Mass Transfer of High Concentration Ozone With High...
16
Mass Transfer of High Concentration Ozone With High Efficiency Injectors and Degassing Separators Presented at: International Ozone Association Pan American Group 1995 Annual Conference Cambridge, Massachusetts November 13, 1995 COURTESY OF: Absolute Systems Inc, Edmonton AB Canada, T5S 1K8, 780 486 3761
Transcript of Mass Transfer of High Concentration Ozone With High...

Mass Transfer of High Concentration Ozone With
High Efficiency Injectors and Degassing Separators
Presented at:
International Ozone Association Pan American Group
1995 Annual Conference
Cambridge, Massachusetts November 13, 1995
COURTESY OF:
Absolute Systems Inc, Edmonton AB Canada, T5S 1K8, 780 486 3761

1
MASS TRANSFER OF HIGH CONCENTRATION OZONE WITH
HIGH EFFICIENCY INJECTORS AND DEGASSING SEPARATORS
Angelo L. Mazzei, R. Michael Meyer Mazzei Injector Corporation Bakersfield, California USA
L. Joseph Bollyky, Ph.D. Bollyky Associates Inc.
Stamford, Connecticut USA
ABSTRACT
High efficiency venturi injectors are commonly used for the mass transfer of various gases into water for a variety of treatment applications. The purpose of this study is to examine the most effective range of operating parameters utilizing high efficiency MAZZEI® Injectors for the mass transfer of high concentration ozone ( 4% to 14%) . The objective is to obtain maximum ozone mass transfer efficiency under the conditions of high ozone concentrations, and various gas to water flow ratios, and increased water pressure. The degassing separators facilitate the removal of off gases from the water after the mass transfer process. The mass transfer of ozone with high efficiency injectors and degassing separators is called the GDTI process . It can be utilized effectively in both the side stream and in the full stream ozone treatment of water..
This paper focuses on the effects of various operating parameters on ozone mass transfer efficiency under various operating conditions. These data can be used for the selecting of optimum operating conditions for various water treatment applications.
INTRODUCTION:
USEPA has set standards for drinking water treatment known as the Surface Water Treatment Rule (SWTR)1 and the proposed Enhanced Surface Water Treatment Rule (ESWTR)1. Among the factors addressed by these regulations are Maximum Contamination Levels (MCLs) for contaminants such as Volatile Organic Compounds (VOCs), Pesticides, and Disinfection By Products (DBPs) which result from the reaction of chlorine with dissolved organic matter1,2 .
Microorganisms such as coliforms, Legionella and Girardia are regulated1, and the ESWTR proposes the regulation of Cryptosporidium as well. Girardia and Cryptosporidium both form cysts which are very resistant to conventional disinfectants such as chlorine. Ozone has proven to be much more effective against the cystacious forms of these organisms3. However, the regulations dictate higher CT (Concentration x Contact Time) values for the disinfection of these

2
organisms4. Furthermore, the discontinuation of prechlorination under the D/DBP rule would also eliminate the corresponding CT credit for disinfection of these organisms5.
In addition, water purveyors are forced increasingly to use lower quality raw water that requires much more extensive treatment in order to provide high quality drinking water. Hydrogen sulfide (H2S) is one of the more common contaminants encountered in certain parts of the country, eg Florida. Ozone is a very effective oxidizer of H2S. The ozone generated by oxygen fed ozone generators have proven to be effective for H2S removal at ozone/H2S weight ratios as low as 2/1 compared to 3/1 when the ozone is generated by air fed units6. Ozone dose requirements are very predictable even at relatively low hydrogen sulfide concentrations.
Due to their low oxygen feed and minimum maintenance requirements, the high ozone concentration (4-14% by weight), oxygen fed ozone generators are being readily accepted for a variety of water treatment applications. These high concentration ozone generators allow the dissolution of large amounts of ozone to produce a high dissolved ozone concentration (15 mg/l)7. Such high dissolved ozone concentrations are readily useful and effective for side stream ozonation. Many other industries such as aquaculture and waste water treatment are finding high concentration ozone to be economically advantageous for various reasons.
In order to fully exploit the advantages of high concentration ozone generators it is important that an effective process with high mass transfer efficiency be employed for the transfer of ozone from the gas phase into the water . The commercially available Mazzei Injector Corp. equipment for the GAS-DEGAS TREATMENT or GDTD Process, consists of a high efficiency venturi injector, a degassing separator and an auxiliary off-gas discharge valve. When the GDTI process is used for ozone mass transfer, the bulk of the ozone is dissolved in the injector and immediately downstream in the pipe. The undissolved gases are separated in the degassing separator and removed through the off-gas discharge valve. This process produces a stream of water containing a high concentration of dissolved ozone free of entrained gases. The contact time requirements are very short, on the order of 10-120 seconds depending on the operating parameters.
The study covered by this report was carried out to determine the mass transfer efficiency of the GDTI process using high concentration ozone under various operating conditions. The data generated by this study demonstrated the utility and operational flexibility of the GDTI process for ozone mass transfer. The effects of the most important operating parameters for ozone mass transfer efficiency were identified and evaluated. Background Information:
The driving force for mass transfer is the difference between the solubility and the already dissolved ozone concentration. The solubility is increased by increasing the pressure8. The solubility of a gas in water can be described by Henry's law. Henry's law states that the solubility of a gas is very nearly directly proportional to its partial pressure in the gas phase9,10.Strictly speaking this law applies only to gases that do not undergo chemical reaction with water during

3
the mass transfer. Dalton's law states that the partial pressure of a gas is equivalent to its volumetric concentration in the gas phase multiplied by the absolute pressure of the system9,10. One form of Henry's law that expresses dissolved gas concentration in units of mg/l is as follows10:
Cs = B x M x PD
Cs = Dissolved Gas Concentration, mg/l M = Gas Phase Density, mg/l B = Bunsen Absorption Coefficient PD = Partial Pressure In Atmospheres
A number of parameters influence the solubility of ozone in water. They are: temperature, pH, ionic strength and the decomposition of ozone in the gas and liquid phases. Much research has been done to determine the Bunsen absorption coefficient for ozone under various conditions10. The curve on Figure 1 is an average of published data of the Bunsen absorption coefficient for ozone versus temperature10. Figures 2 and 3 illustrate the effect of partial pressure and total pressure on the calculated ozone solubility11. It can be seen that increasing both partial and total pressure, increases the calculated ozone solubility dramatically.
Mass transfer efficiency (TE) can be calculated as follows:
TE = ((Ozone In - Ozone Out)/Ozone In) x 100
When the amount of gas entering the system is about the same as the amount leaving the TE can be calculated as follows:
TE = ((Ozone Conc. In - Ozone Conc. Out)/Ozone Conc. In) x 100
The ozone dose is calculated as : Ozone Dosage = Ozone In - Ozone Out Experimental Procedure:
The experimental set up for this study is shown in Figure 4. The experiments were carried out in the laboratory and pilot plant facilities of Bollyky Associates Inc. of Stamford CT.
The injector was a Mazzei Injector Corp. Model 584. The Laval-Mazzei degassing separator was a Model DS-100-SS-AP and the off-gas discharge valve was a Mazzei Model DRV-48-S. The ozone generator was an Emery Trailigaz Model SORBIOS unit fed by bottled dry oxygen.
The dissolved ozone monitors were Anseros Model OZOMAT MP, In USA Model AFX Model W1 and Rosemont Model 1054AOZ. They were calibrated by using the Indigo- Trisulfonate method of Bader and Hoigne12. The gas phase monitors were PCI Ozone Corp. UV type monitors Model HC, LC units. The water was Stamford, CT city water directly from the tap. Water quality was monitored before and after ozone treatment. Typical water quality data are

4
shown in Table 1.
The experiments were carried under continuous flow conditions in the system shown in Figure 4. During each test run the system was operated and monitored continuously until equilibrium was reached. Typically, it took about 25 minutes to reach equilibrium. The effect of detention time was evaluated by varying the residence time in the system. This objective was accomplished by operating with or with out various combinations of 1.5 or 8 gallon up-flow holding tanks.
Mass transfer efficiency (TE) was calculated from the amount of ozone in the feed gas and in the off-gas. Gas flow measurements indicated a good material balance between the feed gas and captured off-gas. Therefore TE was calculated as follows:
TEoff-gas = 100 X {1 - (Ozone Out / Ozone In)}
The operating parameters were evaluated in the ranges indicated below:
Gas/Liquid Volumetric Ratio (Vg/Vl) : 0.023-0.364
Injector Discharge Pressure : 10-38 PSIG
Ozone Feed : 2.1-20.4 mg/l
Ozone Gas Phase Concentration : 4.2-14.4% wt.
Detention Time : 10-120 seconds
The Effect Of Ozone Concentration And Gas/Liquid Ratio On Mass Transfer Efficiency:
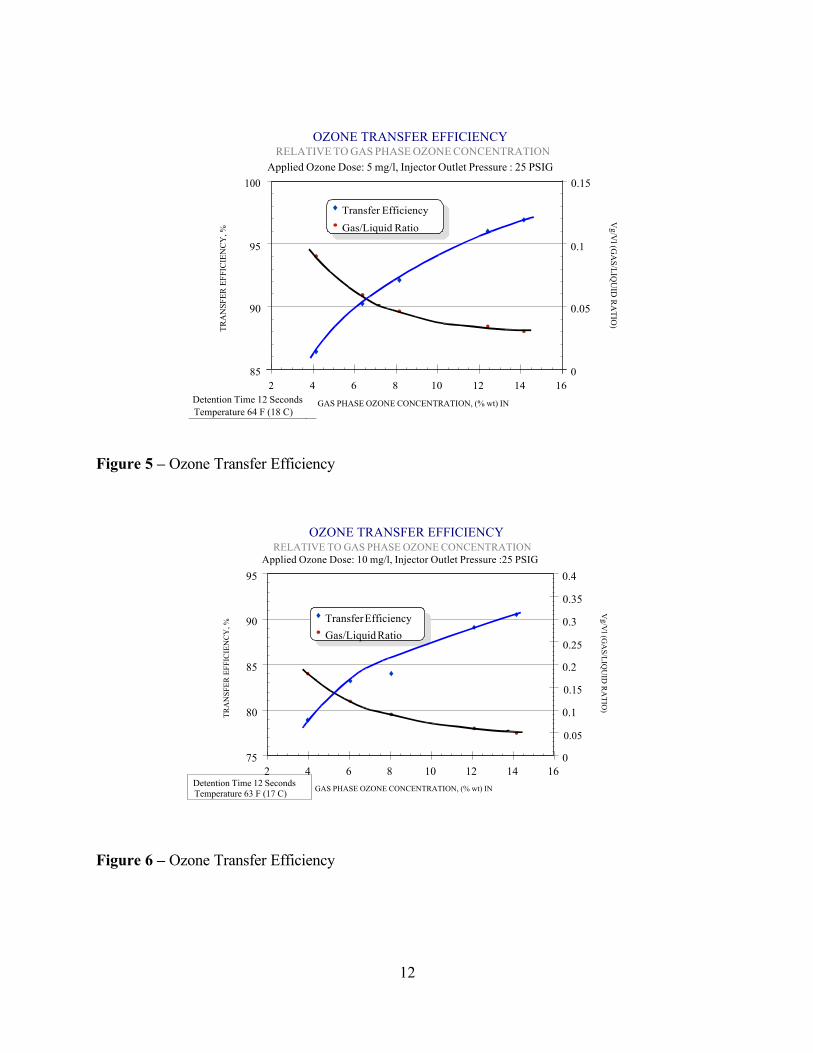
The ozone concentration has a powerful effect on the mass transfer efficiency. In addition the Volumetric Gas/Liquid ratio (Vg/Vl) affects ozone mass transfer efficiency also. The high ozone concentration facilitates low Vg/Vl ratios. The ozone concentration and Vg/Vl ratio are not independent parameters. In fact, the effect of ozone concentration cannot be separated from the effect of Vg/Vl in our experiments. This fact is demonstrated by Figures 5, 6 and 7. The significance of low Vg/Vl ratios is underlined by the observation that a finer dispersion of bubbles is produced under those conditions in our experiments. The smaller bubbles produce a greater interfacial surface area for mass transfer. The agitation created by the injector aggressively promotes continuous renewal of the gas and liquid phases at the gas/liquid interface.
The Figures 5, 6 and 7 demonstrate the improvement in mass transfer efficiency that can be realized with the high concentration ozone. The higher TE is of course the function of higher gas phase ozone concentration (higher partial pressure) and lower Vg/Vl ratio.
The above figures also demonstrate the lower mass transfer efficiency obtained at high

5
ozone concentration when the applied ozone dosage is high. At a 5 mg/l applied ozone dosage (dissolved concentration 3.6 mg/l) a mass transfer efficiency greater than 95% was achieved. In comparison to that at a 14-16 mg/l applied dosage (dissolved ozone concentration 11.2 mg/l), the mass transfer efficiency was approximately 90%. The reason for this reduced transfer efficiency at the higher applied ozone dose is that the dissolved concentration is approaching the solubility of ozone. The Effect Of Injector Discharge Pressure On Mass Transfer Efficiency
The effect of injector discharge pressure on mass transfer efficiency was measured while operating at a set ozone gas concentration of 10% wt , applied high ozone dosage of 15 mg/l and Vg/Vl ratio of 0.1. The data in Figure 8 indicate mass transfer efficiencies in the range of 88% to 95% with injector outlet pressures in the range of 25-34 PSIG.
Transfer efficiencies as high as 99% were measured for many test runs with injector outlet pressures between 25-35 PSIG with ozone dosages of 3-5 mg/l.
The Effect Of Gas/Liquid Ratio (Vg/Vl) On Mass Transfer Efficiency:
The data in Figure 9 indicate the effect of Vg/Vl ratio as well as injector outlet pressure
on transfer efficiency. The effect of increased injector outlet pressure from 10-25 PSIG resulted in increased transfer efficiency from 89% to 91% at a Vg/Vl ratio of 0.1 and 91% to 94% at a Vg/Vl ratio of 0.07.
The Effect of Detention Time On Mass Transfer Efficiency:
Figure 10 illustrates the effect of detention time on mass transfer efficiency at an applied dose rate of 15-18 mg/l, a Vg/Vl ratio of 0.1 and injector outlet pressure of 25 PSIG. The data in Figure 10 indicate that the transfer efficiency of 88% can be achieved with a detention time of just 12 seconds. However , transfer efficiency increased to 95% with 55 seconds of detention time and 97% at 114 seconds detention time.
This ability to achieve very high transfer efficiencies with very short detention times even at a very high applied dosage makes this process eminently suitable for side stream ozonation. The Effect Of Ozone Feed On Mass Transfer Efficiency:
Ozone feed is the amount of ozone introduced into the system. The ozone dose or dosage is defined as the ozone feed less the amount of ozone lost as off-gas from the system. The ozone feed and Vg/Vl ratio can not be varied independently in our experiments if a constant ozone concentration is maintained in the ozone feed.

6
Figure 11 demonstrates the effect of ozone feed on transfer efficiency under the conditions of 12% ozone concentration. The data in Figure 11 indicate that the mass transfer efficiency ranged from nearly 100% with the 2 mg/l feed to 94-95% with the 20 mg/l feed. Dissolved Ozone Concentrations:
Dissolved ozone concentration in the effluent from the ozone contactor is a very important process parameter, especially for side stream ozonation. Dissolved ozone concentrations measured during these experiments varied through a broad range depending on the operating conditions of the test.
Measured dissolved ozone concentrations varied in the range of 2.3-15.6 mg/l depending on operating conditions. The effect of the individual operating parameters on dissolved ozone concentration closely paralleled their effect on mass transfer efficiency.
Figure 10 demonstrates the positive effect of longer detention time. When it is increased from 12 to 55 seconds, the transfer efficiency and the dissolved ozone concentration increased substantially from 88% to 97% and from 10.2 to 12.1 mg/l respectively . Conclusions:
High (85 - 99%) mass transfer efficiencies can be achieved readily even at high ozone dosages, (3 - 15 mg/l) when high concentration ozone (10 - 14% wt) is used for the mass transfer in the GDTI process. The operating parameters shown to be most important for the high transfer efficiency include: ozone concentration, applied ozone dosage, injector discharge pressure and detention time.
The combination of the GDTI process and high concentration ozonegenerators provide a very viable and effective means for producing high dissolved ozone concentration in water streams. The very low entrained gas content resulting from off gas removal facilitates the use of ozone for a wide variety of treatment processes. This combination is particularly suitable for side stream ozonation.
The results of this study identify the parameters for optimum operation of the GDTI process in combination with high concentration ozone generators. The design of any system requires the careful consideration of many factors in order to produce an efficient operating system. The most important factors to be considered for high mass transfer efficiency are: • Ozone concentration and applied dosage. High ozone concentration facilitates high ozone
solubility, and this high solubility is the driving force for ozone mass transfer. When a high applied ozone dose is used the dissolved ozone concentration becomes high and begins to limit the mass transfer. Even though it is easier to achieve higher mass transfer at lower doses, mass transfer efficiencies of about 90% can be achieved at applied ozone doses as high

7
as 10-14 mg/l utilizing high concentration (14%) ozone generators. • Injector Discharge Pressure: Similarly, the higher injector discharge pressure increases the
solubility of ozone. An injector outlet pressure of 25-30 PSIG will facilitate mass transfer efficiencies greater than 95% depending on the other factors involved. However, injector outlet pressures as low as 10 PSIG can provide very adequate transfer efficiencies under some conditions while at the same time utilizing less energy for pumping. Injector outlet pressures greater that 30 psig will often result in very high, 95% or greater, transfer efficiencies, but, at the expense of high energy use for pumping.
• Detention Time: Detention times as low as 12 seconds can provide excellent mass transfer
efficiency (> 95%) depending on the other factors involved. If possible, a detention time of one minute or greater can provide incrementally better transfer efficiency.
• Agitation: The injector introduces the ozone gas into the water stream as a fine dispersion of
bubbles with a great interfacial surface area. The agitation created by the injector aggressively promotes continuous renewal of the gas and liquid interface.
References 1: Pontius, F.W.
An Update Of The Federal Drinking Water Regs Journal AWWA February 1995 pages 48-58
2: Nieminski, E. C., Ongerth, J. E.
Removing Girardia And Cryptosporidium By Conventional Treatment and Direct Filtration Journal AWWA, September 1995 pages 96-106
3: Ozone In Water Treatment, Application And Engineering
AWWA Research Foundation, 1991, Lewis Publishers page 227
4: Finch, G. R., Black, E. K., Gyurek, L., Belosevic, M.
Ozone Disinfection OF Girardia And Cryptosporidium AWWA Research Foundation and American Water Works Association
5: LeChevallier, M. W., Norton, W. D.
Girardia And Cryptosporidium In Raw And Finished Water

8
Journal AWWA September 1995
pages 54-68 6: Price, M., CH2M Hill In Line Injection Improves Oxidation Efficiency Conference Proceedings IOA, Advances In the Application Of Ozone In Water And Waste Water Treatment, September 1994
7: Bollyky Associates Inc. "Study Of Ozone Mass Transfer Efficiency With The Mazzei Injector And Degassing
Separator Using High Concentration Ozone" July 10, 1995.
8: L. Joseph Bollyky The Mass Transfer of Ozone Into Water: Energy Requirements State-Of The-Art Ozone Science And Engineering Vol 3 181-210, 1981
9: CRC Handbook Of Chemistry And Physics, 58th Edition 1977-78
10: Ozone In Water Treatment, Application And Engineering AWWA Research Foundation, 1991, Lewis Publishers pages 112-116
11: Mazzei Injector Corporation
Calculated From Data In Reference 10 Above
12: H. Bader and J. Hoigne Determination Of Ozone In Water By The Indigo Method Ozone Science And Engineering Vol 4 169-170

9
0.5
BUNSEN ABSORPTION COEFFICIENT FOR OZONE vs TEMPERATURE
0.4
0.3
0.2
0.1
0 40 50 60 70 80 90 100 (4.4) (10) (15.6) (21.1) (26.7) (32.2) (37.8)
Figure 1 – Bunsen Absorption Coefficient Figure 2 – Ozone Solubility

10
Figure 3 – Ozone Solubility Relative to Pressure
Typical Water Quality Data
Parameter Before Ozone
After Ozone
pH
7.290
7.310
Alkalinity
32.000
32.000
Mg/l as CaCO3
Total Hardness
51.000
51.000
mg/l as CaCO3
Iron
0.013
0.014
mg/l
Manganese
0.000
0.000
mg/l
Dissolved Oxygen
8.900
11.500
mg/l
Chlorine
0.970
0.020
mg/l
Total Organic Carbon
2.064
1.820
mg/l as C
Table 1 – Typical Water Quality Data

11
Figure 4 – Injector – Degassing Separator Ozone Mass Transfer Test System
12
Vg/V
l (GA
S/LIQU
ID R
ATIO
) V
g/Vl (G
AS/LIQ
UID
RA
TIO)
TRA
NSF
ER E
FFIC
IEN
CY
, %
TRA
NSF
ER E
FFIC
IEN
CY
, %
100
OZONE TRANSFER EFFICIENCY RELATIVE TO GAS PHASE OZONE CONCENTRATION
Applied Ozone Dose: 5 mg/l, Injector Outlet Pressure : 25 PSIG
0.15
Transfer Efficiency
Gas/Liquid Ratio
95
0.1
90 0.05
85 0 2 4 6 8 10 12 14 16
Detention Time 12 Seconds Temperature 64 F (18 C)
GAS PHASE OZONE CONCENTRATION, (% wt) IN Figure 5 – Ozone Transfer Efficiency
OZONE TRANSFER EFFICIENCY RELATIVE TO GAS PHASE OZONE CONCENTRATION
Applied Ozone Dose: 10 mg/l, Injector Outlet Pressure :25 PSIG 95
0.4
90 Transfer Efficiency Gas/Liquid Ratio
0.35
0.3
0.25
85 0.2
0.15
80 0.1
0.05
75 0
2 4 6 8 10 12 14 16 Detention Time 12 Seconds Temperature 63 F (17 C) GAS PHASE OZONE CONCENTRATION, (% wt) IN
Figure 6 – Ozone Transfer Efficiency

13
Vg/V
l (GA
S/LIQU
ID R
ATIO
) TRA
NSF
ER E
FFIC
IEN
CY
, %
OZONE TRANSFER EFFICIENCY RELATIVE TO GAS PHASE OZONE CONCENTRATION
Applied Ozone Dose: 14-16 mg/l, Injector Outlet Pressure: 25 PSIG 90
0.4
0.35
85 0.3
0.25
80 0.2
0.15
75 Transfer Efficiency Gas/Liquid Ratio
70 2 4 6 8 10 12 14 16
0.1 0.05 0
Detention Time 12 Seconds Temperature 57 F (14 C)
GAS PHASE OZONE CONCENTRATION, (% wt) IN
Figure 7 – Ozone Transfer Efficiency
TRANSFER EFFICIENCY vs INJECTOR OUTLET PRESSURE Vg/Vl: 0.1, Applied Ozone Dose: 15 mg/l, Ozone Concentration: 10% wt
96
94
92
90
88
86 15 16 17 18 19 20 21 22 23 24 25 26 27 28 29 30 31 32 33 34 35
Detention Time 12 Seconds Temperature 46 F (8 C )
Figure 8 – Transfer Efficiency vs. Injector Outlet Pressure

14
MASS TRANSFER EFFICIENCY vs GAS/LIQUID RATIO
Applied Ozone Dose: 10-14 mg/l, Gas Concentration: 11 % wt 95
Injector Outlet Pressure 94 10 PSIG 20 PSIG 25 PSIG
93
92
91
90
89
88
0.06 0.07 0.08 0.09 0.1 0.11 Detention Time 12 seconds Temperature 43 F (6 C)
Figure 9 – Mass Transfer Efficiency vs. Gas/Liquid Ratio
TRANSFER EFFICIENCY vs DETENTION TIME Applied Ozone Dosage: 15-18 mg/l, Injector Outlet Pressure: 25 PSIG
100
98
96
94
92
90
88
86 0 10 20 30 40 50 60 70 80 90 100 110 120
Temperature 53 F (12 C) Ozone Conc.: 9.8 - 12.2% wt
Figure 10 – Transfer Efficiency vs. Detention Time

15
TRA
NSF
ER E
FFIC
IEN
CY
, %
100
OZONE TRANSFER EFFICIENCY RELATIVE TO OZONE FEED
Ozone Concentration: 12% wt, Injector Outlet Pressure: 25 PSIG
98
96
94 0 5 10 15 20 25
Detention Time 55 Seconds Temperature 54 F (12 C)
OZONE FEED, mg/l
Figure 11 – Ozone Transfer Efficiency