Market Sentiment and Exchange Rate Directional Forcasting · PDF fileThe author develops an...
21
Copyright belongs to the author. Small sections of the text, not exceeding three paragraphs, can be used provided proper acknowledgement is given. The Rimini Centre for Economic Analysis (RCEA) was established in March 2007. RCEA is a private, nonprofit organization dedicated to independent research in Applied and Theoretical Economics and related fields. RCEA organizes seminars and workshops, sponsors a general interest journal The Review of Economic Analysis, and organizes a biennial conference: The Rimini Conference in Economics and Finance (RCEF) . The RCEA has a Canadian branch: The Rimini Centre for Economic Analysis in Canada (RCEA- Canada). Scientific work contributed by the RCEA Scholars is published in the RCEA Working Papers and Professional Report series. The views expressed in this paper are those of the authors. No responsibility for them should be attributed to the Rimini Centre for Economic Analysis. The Rimini Centre for Economic Analysis Legal address: Via Angherà, 22 – Head office: Via Patara, 3 - 47921 Rimini (RN) – Italy www.rcfea.org - [email protected] WP 37_14 Vasilios Plakandaras Department of Economics, Democritus University of Thrace, Greece Theophilos Papadimitriou Department of Economics, Democritus University of Thrace, Greece Periklis Gogas Department of Economics, Democritus University of Thrace, Greece The Rimini Centre for Economic Analysis, Italy Konstantinos Diamantaras Department of Information Technology, TEI of Thessaloniki, Greece MARKET SENTIMENT AND EXCHANGE RATE DIRECTIONAL FORECASTING
Transcript of Market Sentiment and Exchange Rate Directional Forcasting · PDF fileThe author develops an...

Copyright belongs to the author. Small sections of the text, not exceeding three paragraphs, can be used
provided proper acknowledgement is given.
The Rimini Centre for Economic Analysis (RCEA) was established in March 2007. RCEA is a private,
nonprofit organization dedicated to independent research in Applied and Theoretical Economics and related
fields. RCEA organizes seminars and workshops, sponsors a general interest journal The Review of
Economic Analysis, and organizes a biennial conference: The Rimini Conference in Economics and Finance
(RCEF) . The RCEA has a Canadian branch: The Rimini Centre for Economic Analysis in Canada (RCEA-
Canada). Scientific work contributed by the RCEA Scholars is published in the RCEA Working Papers and
Professional Report series.
The views expressed in this paper are those of the authors. No responsibility for them should be attributed to
the Rimini Centre for Economic Analysis.
The Rimini Centre for Economic Analysis
Legal address: Via Angherà, 22 – Head office: Via Patara, 3 - 47921 Rimini (RN) – Italy
www.rcfea.org - [email protected]
WP 37_14
Vasilios Plakandaras
Department of Economics, Democritus University of Thrace, Greece
Theophilos Papadimitriou
Department of Economics, Democritus University of Thrace, Greece
Periklis Gogas
Department of Economics, Democritus University of Thrace, Greece
The Rimini Centre for Economic Analysis, Italy
Konstantinos Diamantaras
Department of Information Technology, TEI of Thessaloniki, Greece
MARKET SENTIMENT AND EXCHANGE RATE
DIRECTIONAL FORECASTING
1
Market Sentiment and Exchange Rate Directional
Forecasting
Vasilios Plakandaras*, Theophilos Papadimitriou*, Periklis Gogas*a1 and
Konstantinos Diamantaras+
*Democritus University of Thrace, Department of Economics
aRimini Center for Economic Analysis
+TEI of Thessaloniki, Department of Information Technology
Abstract
The microstructural approach to the exchange rate market claims that order flows on a
currency can accurately reflect the short-run dynamics its exchange rate. In this paper,
instead of focusing on order flows analysis we employ an alternative microstructural
approach: we focus on investors’ sentiment on a given exchange rate as a possible
predictor of its future evolution. As a proxy of investors’ sentiment we use StockTwits
posts, a message board dedicated to finance. Within StockTwits investors are asked to
explicitly state their market expectations. We collect daily data on the nominal
exchange rate of four currencies against the U.S. dollar and the extracted market
sentiment for the year 2013. Employing econometric and machine learning
methodologies we develop models that forecast in out-of-sample exercise the future
direction of the four exchange rates. Our empirical findings reject the Efficient Market
Hypothesis even in its weak form for all four exchange rates. Overall, we find evidence
that investors’ sentiment as expressed in public message boards can be an additional
source of information regarding the future directional movement of the exchange rates
to the ones proposed by economic theory.
Keywords: Market Sentiment, Exchange rates, Forecasting, Efficient Market
Hypothesis, Machine Learning.
JEL Codes: F31, F37, C45, C5
1 Corresponding author: tel.: +306947001079, email: [email protected]

2
1. Introduction
In their seminal paper Evans and Lyons (2002) on the microstructural aspect of the
exchange rate markets claim that the trading volume of an exchange rate can describe
a large part of its short-term volatility. More specifically, they state that trading volumes
can capture the data generating process of the time series and thus it can be used
successfully in forecasting its future value. Thus unlike econometric projections, order
flows “reveal the true belief of a trader to back up his beliefs with real money”. In other
words, they redefine the exchange rate determination problem as a market expectations
issue based on the willingness of market participants to finance their beliefs.
As order flows carry valuable information about the short-term price determination
mechanism of the exchange rates, there is a number of studies that build on the
microstructural aspect of the foreign exchange market. Danielsson et al. (2012) provide
evidence in favor of the forecasting superiority of order flow models as compared to a
Random Walk (RW) for the highly traded EUR/USD, EUR/GBP and USD/ JPY. Rime
et al. (2010) bridge micro and macro approaches in exchange rate economics by
developing order flow models conditioned on macroeconomic expectations. The
empirical results report the superiority of investing on exchange rate portfolios based
on trading volumes in comparison to alternative investment approaches reported in the
literature. King et al. (2010) conclude that the addition of order flow dynamics into a
macroeconomic model improves its forecasting ability. Gehrig and Menkhoff (2004)
argue that flow analysis affects traders’ decisions in shaping their expectations, since
order flows embody private information. In a recent survey paper on the microstructural
aspect of the market, King et al. (2013) state that aggregate order flows (short vs long
positions) reflect the total public and private information provided to a trader and often
function as a self-fulfilling prophecy, shaping market expectations. Overall, the existing
literature on the microstructural view of the market relies so far on order flows analysis.
In this paper we tackle the exchange rate directional forecasting problem from an
alternative perspective: instead of relying on order flows, we focus on investors’
sentiment as a possible predictor of the future evolution of exchange rates. The
investors’ sentiment is extracted from the publicly available investors’ expectations as
they are reported on message boards (also known as microblogging) that relate to the

3
foreign exchange market. Public message boards provide the ability to small traders to
express their opinions and share information. Stock message boards are common to the
stock trading community, since dedicated sites such as Yahoo finance, Google finance
or StockTwits provide space for exchanging information and publish weekly trends and
projections over specific stocks. In order to create such projections, each board
participant is asked to express her expectation for the specific theme thread by selecting
among predefined choices; “Bullish”, “Bearish” or “Neutral”. The aggregated
sentiment over all weekly posts provides an estimation over the market sentiment for
the specific stock.
Empirical evidence presented in the literature supports the hypothesis that stock
message board activity is correlated positively with stock trade volatility (Das and
Chen, 2007). Wex et al. (2013) train a GARCH(1,1) model with 45 million Reuters
posts to forecast oil price direction. Their model outperforms a simple Autoregressive
model, while Ruiz et al. (2012) and Sprenger and Welpe (2010) detect a positive
correlation between Twitter posts and stock trading volumes. Bollen et al. (2011)
examine ten million Tweets and based on the extracted sentiment forecast market
movements more accurately than a RW model up to six days ahead. Zhang et al. (2012)
also report the ability to forecast the overall Dow Jones Industrial Index, the NASDAQ
and the S&P 500 index based on Twitter posts more accurately compared to a RW
model. According to Aite Group, as of 2010 35% of all investment firms exploit
sentiment analysis information in their models (Bowley, 2010). Nevertheless, there is
also a number of studies that argue against the value of sentiment based indices
(Rechenthin et al., 2013; Oliveira et al., 2013).
Despite the extensive number of papers on sentiments and stock markets, there is a very
limited number of studies examining the ability of microblogging sentiment to forecast
exchange rates. To the very best of our knowledge the existing literature on the field is
limited to only two papers. Papaioannou et al. (2013) develop an Autoregressive and
an Artificial Neural Network model to forecast high frequency intraday EUR/USD rate
spanning the period October 10, 2010 to January 05, 2011. The authors collect 20250
posts from Twitter and select the ones that relate to the EUR/USD exchange rate.
According to the evidence presented, under certain assumptions the models that exploit
the information provided by the Tweets can outperform the RW model. The second

4
paper (Janetsko, 2014) collects Twitter posts from January 1, 2013 to September 27,
2013. The author develops an ARIMA model fed with market sentiment trends as
extracted by Tweets in order to forecast the daily closing price of the EUR/USD rate.
He concludes that the sentiment-based model consistently outperforms the RW model.
An examination of the existing literature regarding short-term forecasting of exchange
rates leads to mixed results, since there is no clear consensus regarding exchange
market efficiency in daily trading horizon (for instance see Tabak and Lima (2009) and
Crowder (1994)).
In this paper, we forecast the future direction of the daily closing rate for the four most
important (in terms of market volume) nominal exchange rates. These are: USD/EUR,
USD/JPY, USD/GBP and AUD/USD. We use daily data for the year 2013 and evaluate
as possible regressors: a) the extracted market sentiment from StockTwits, b) the total
daily volume of relevant StockTwits posts and c) past values of the exchange rate. We
employ the information provided by StockTwits as it is a message board dedicated
explicitly to financial markets, in contrast to other message boards such as Twitter.
Message boards of broader interest are due to embody posts often irrelevant to market
sentiment, increasing the overall spam included in the input dataset. We fit various
econometric and machine learning models to each exchange rate and compare their
forecasting ability to a RW model used as the benchmark in order to test for the EMH
of the exchange rate market.
The rest of the paper is organized as follows: data and methodology is discussed in
section 2 and the empirical results are reported in section 3. Finally section 4 concludes.
2. Data and methodology
2.1 Methodology overview
In this paper we consider various econometric and machine learning methodologies for
daily directional forecasting of four highly traded exchange rates, employing traders’
sentiment as a possible predictor. In particular, from econometrics we use the Logistic
Regression approach for classification and from the field of supervised machine
learning the Support Vector Machines (SVM), a Naïve Bayes classifier, K-Nearest

5
Neighbors (Knn) classification, decision trees with boosting based on the Adaboost and
Logitboost algorithms and finally an Artificial Neural Network.
The Logistic Regression (commonly known as the Logit model) is a probabilistic
statistical classification methodology used to forecast a binary outcome. Unlike linear
regression, the outcomes of the regression are modeled through a logistic function,
resulting in class probabilities. Instances that meet a predefined threshold are classified
as belonging to the one class (typically coded as “1”) and the remaining as belonging
to the other (coded as “0”).
The Naïve Bayes classifier is also a probabilistic classifying methodology, which
belongs to the broader category of supervised machine learning techniques. The term
naïve corresponds to the assumption that the conditional probability of each regressor
(variable) is independent of the conditional probabilities of the others. After extracting
the mean and variance for each regressor on a known data sample, the model can
classify new (unknown up to that point) instances based on the Bayes theorem, resulting
to posterior class membership probabilities.
The third methodology that we evaluate in our study is the k-nearest neighbor (Knn)
algorithm. The basic idea behind Knn is to classify every instance to the class of the
majority of its k closest neighbors in the feature space. An example of Knn classification
for two classes is depicted in Figure 1.

6
Figure 1: Example of a Knn classification. The circle includes the 8 nearest neighbors
of the new unknown instance marked with an X. The two classes are represented with
a star and a dot, respectively. As we observe the selection of the number of k that is
used for the class membership determination is crucial. If we set k from 1 to 4 we
classify the new instance to the class represented with the dot. In contrast, for higher
values of k the new instance is classified to the star class.
Decision trees map variables and produces decisions regarding the class membership
for each instance. In a forward selection scheme, a randomly selected variable is split
into two nodes according to its binary potential outcome (classes). Then each node is
re-evaluated for further splitting according to the next variable and the process is
continued, until no further splitting increases the accuracy of the model or the number
of variables is exhausted. We develop decision trees models boosted with the popular
Adaboost (Freund and Shaphire, 1996) and Logitboost (Friedman et al., 2000)
algorithms. The term boosting refers to an iterative training procedure, where on a
group of weak learners (decision trees) we combine their decisions by assigning a
different weight to each one; high weights to misclassified instances and low ones to
the ones classified correctly. The procedure is repeated until no further improvement in
the forecasting accuracy of the whole training dataset is achieved. Logitboost algorithm
gives a statistical aspect in the Adaboost algorithm, as it applies a logit function in
updating the weights imposed on classifiers.

7
Support Vector Machines is a binary supervised machine learning classifier. Proposed
by Cortes and Vapnik (1995) the basic notion behind the method is to find a linear
separator of the two classes in the feature space (feature space is called the projected
data space into higher dimensional space with the use of a kernel function). Solving a
convex minimization problem the algorithm converges to a linear separator that has the
largest margin between the two classes. The margin between the classes is defined by
a set of data points called Support Vectors. An example of an SVM classification with
the RBF kernel is depicted in Figure 2.
Figure 2: An example of an SVM classification using the RBF kernel. The two classes
are separated with a linear separator on a higher dimensional space, which when is re-
projected back into its original dimensions becomes a non-linear function. The circled
instances are the Support Vectors defining the decision boundary and the instances with
a square rounding are misclassified instances.
Finally, we develop a 2-layer Perceptron network that belongs to the broader category
of Artificial Neural Networks (ANN). Inspired by the human central nervous system,
an ANN is usually represented as an interconnected “neurons” network that models the
relationship between regressors and dependent values. We train the network based on
the backpropagation algorithm. Since the final outcome of backpropagation may
depend on the initial values of the network, we perform a series of Monte Carlo
simulations to avoid local minima.
2.2 The Data
We compile data for four nominal daily exchange rates: USD/EUR, USD/JPY,
USD/GBP and USD/AUD for the period January 2, 2013 to December 26, 2013 from
8
the Federal Reserve Bank of Saint Louis. According to the triennial survey of the Bank
of International Settlements (2013), the four selected exchange rates exhibit the highest
daily trading volume in the foreign exchange market. Posts are retrieved from
StockTwits for the entire 2013, under an exclusive research license. StockTwits is a
financial communication platform focusing solely on financial and investment topics.
The message board includes more than 200,000 users (Oliveira et al., 2013) and the
main advantage over other social message boards such as Twitter is its explicit financial
character. This could attribute to less spam or irrelevant messages to our dataset.
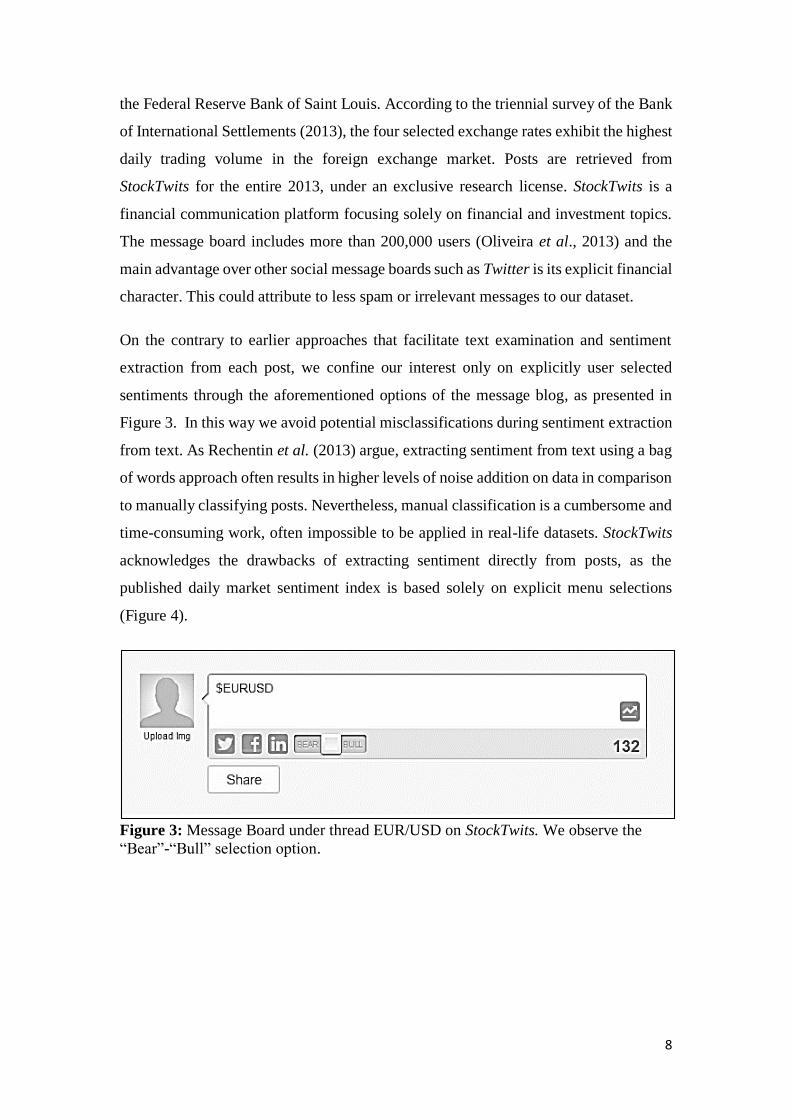
On the contrary to earlier approaches that facilitate text examination and sentiment
extraction from each post, we confine our interest only on explicitly user selected
sentiments through the aforementioned options of the message blog, as presented in
Figure 3. In this way we avoid potential misclassifications during sentiment extraction
from text. As Rechentin et al. (2013) argue, extracting sentiment from text using a bag
of words approach often results in higher levels of noise addition on data in comparison
to manually classifying posts. Nevertheless, manual classification is a cumbersome and
time-consuming work, often impossible to be applied in real-life datasets. StockTwits
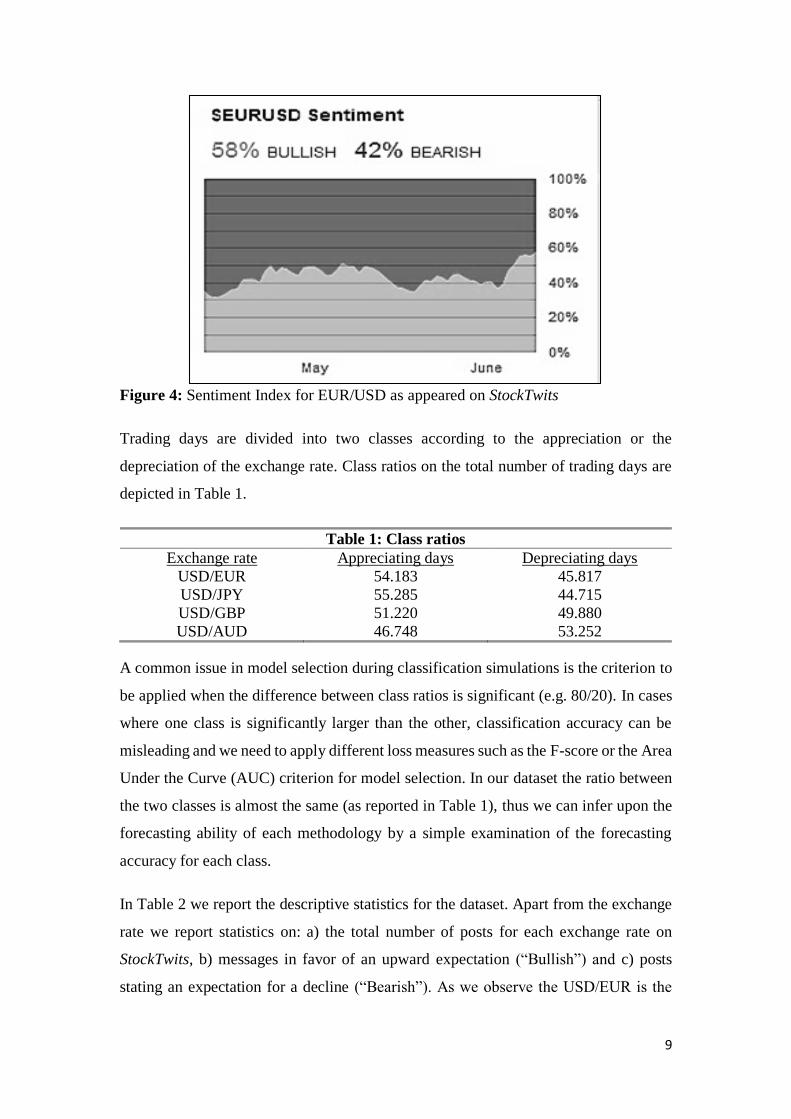
acknowledges the drawbacks of extracting sentiment directly from posts, as the
published daily market sentiment index is based solely on explicit menu selections
(Figure 4).
Figure 3: Message Board under thread EUR/USD on StockTwits. We observe the
“Bear”-“Bull” selection option.
9
Figure 4: Sentiment Index for EUR/USD as appeared on StockTwits
Trading days are divided into two classes according to the appreciation or the
depreciation of the exchange rate. Class ratios on the total number of trading days are
depicted in Table 1.
Table 1: Class ratios
Exchange rate Appreciating days Depreciating days
USD/EUR 54.183 45.817
USD/JPY 55.285 44.715
USD/GBP 51.220 49.880
USD/AUD 46.748 53.252
A common issue in model selection during classification simulations is the criterion to
be applied when the difference between class ratios is significant (e.g. 80/20). In cases
where one class is significantly larger than the other, classification accuracy can be
misleading and we need to apply different loss measures such as the F-score or the Area
Under the Curve (AUC) criterion for model selection. In our dataset the ratio between
the two classes is almost the same (as reported in Table 1), thus we can infer upon the
forecasting ability of each methodology by a simple examination of the forecasting
accuracy for each class.
In Table 2 we report the descriptive statistics for the dataset. Apart from the exchange
rate we report statistics on: a) the total number of posts for each exchange rate on
StockTwits, b) messages in favor of an upward expectation (“Bullish”) and c) posts
stating an expectation for a decline (“Bearish”). As we observe the USD/EUR is the

10
most active thread with 123 posts every day with the least popular being the USD/GBP
exchange rate with 24 posts per day. As expected, the volume of the posts follows the
daily trading volume of each exchange rate. According to the reported p-values of the
Jarque-Bera test (Jarque and Bera, 1980) the null hypothesis of normality is rejected for
all four exchange rates. It is interesting to note that from the total number of sentiment
posts only about one third of them explicitly express an expectation.
Table 2: Descriptive Statistics on data
Obs. Mean Median Standard
deviation
Skewness Kurtosis Jarque -
Bera test
(p-value)
USD/EUR
Rate 246 1.328 1.327 0.027 0.164 2.064 0.013**
Total Posts 30905 123.128 115.000 50.456 0.717 4.331 0.001***
Bullish posts 5514 21.968 20.000 13.244 0.974 4.088 0.001***
Bearish posts 3956 15.761 14.000 10.195 1.190 4.876 0.001***
USD/JPY
Rate 246 97.379 98.180 3.783 -0.846 3.356 0.001***
Total Posts 9535 38.760 32.500 25.591 2.598 12.914 0.001***
Bullish posts 1338 5.439 4.000 4.406 1.335 5.334 0.001***
Bearish posts 1165 4.736 3.000 5.163 3.229 21.615 0.001***
USD/GBP Rate 246 5.439 4.000 4.406 1.334 5.334 0.001***
Total Posts 5966 24.252 22.000 11.304 1.620 7.635 0.001***
Bullish posts 956 3.878 4.000 3.023 1.800 10.594 0.001***
Bearish posts 1046 4.252 3.000 3.595 2.643 17.357 0.001***
USD/AUD Rate 246 0.970 0.952 0.056 0.231 1.476 0.001***
Total Posts 6893 28.020 27.000 11.129 0.821 4.030 0.001***
Bullish posts 750 3.049 3.000 2.534 1.041 3.970 0.001***
Bearish posts 907 3.687 3.000 3.042 1.449 6.115 0.001***
Note: ** and *** denote rejection of the null hypothesis of normality in 5% and 1%
level of significance, respectively.
3. Empirical Results
3.1 Models’ Specification
A straight-forward heuristic approach to measure the accuracy of traders’ sentiment in
forecasting the future direction of the exchange rate would be to examine whether the
majority of traders’ expectations as reflected in traders’ posts match the actual
movement of the exchange rate. We code this approach as Posts Majority (PM). In
contrast, the RW model (used as the benchmark) assumes that the present value of the
exchange rate includes all the information (both private and publicly available) for the

11
time series and thus the best predictor of the future value of the exchange rate is its
present value.
A crucial step of the methodologies discussed in the methodology overview section is
parameter configuration for each model during training. In this paper we examine SVM
models with the linear, the RBF and the sigmoid kernel. In order to select the kernel
function, determine the kernel parameters and the tolerance parameter of the SVM
model with the higher forecasting performance, we apply a 5-fold cross validation
training scheme. We also apply a similar approach for calibrating the number of k
neighbors for the knn classification and the learning rate for the Adaboost and
Logitboost algorithms. Typically when training a Logistic Regression model we should
impose a threshold that separates the two classes, with 0.5 as the most common applied
threshold value in literature. In this paper we consider various thresholds during the in-
sample forecasting step in order to achieve the best possible classification of the dataset.
Finally, we apply a 5-fold cross validation training procedure for the determination of
the number of neurons included in the hidden layer of the ANN model and multiple
thresholds for data classification.
We use the information at period t in order to forecast the directional movement of next
period’s, t+1, closing price. The input variable sets used in the above forecasting
methodologies are reported in Table 3. Input Set 1 includes past values of the exchange
rate and Input Set 2 includes the market sentiment as reflected in StockTwits posts. In
Input Set 3 we append the total posts per day to the predictors included in Input Set 2.
Input Set 4 includes input sets 1 and 2, while Input variable Set 5 includes variables of
Sets 1 and 3. In other words we create all potential combinations of the regressors to
identify the Input Variable Set with the highest forecasting accuracy. In order to
examine potential delays in the transmission channel of market sentiment to the foreign
exchange market we evaluate up to 10 lags (trading days) of all variables.
Table 3: Input Variables Sets
Input Set 1 Past values of the exchange rate
Input Set 2 The volume of “Bearish” and “Bullish” posts per day
Input Set 3 The volume of “Bearish” , “Bullish” and total posts per day
Input Set 4 Past values of the Exchange rate and the volumes of “Bullish” and
“Bearish” posts per day
Input Set 5 Past values of the Exchange rate, volumes of “Bullish”, “Bearish”
and total posts per day

12
The dataset is divided into two parts; the first part includes 200 daily observations from
January, 2 to October, 16 and is used for training the models and in-sample-forecasting,
while the second part spans the period October, 17 to December, 23 with 51
observations and is used for out-of-sample forecasting.
3.2 The USD/EUR Results
On Table 4 we report the best results for the USD/EUR exchange rate for each
methodology and Input Variable Set, respectively. We observe that the Logitboost
classifier with Input Set 3 variables exhibits the highest in-sample forecasting accuracy,
followed by the Adaboost classifier model with similar configuration. Nevertheless, the
true forecasting ability of a model is measured in an out-of-sample exercise. As we
observe the Knn classifier outperforms all the other methodologies in out-of-sample
forecasting reaching a 63.46% accuracy with variables from Input Set 3. Logitboost
and Adaboost classifiers exhibit significantly reduced forecasting accuracy in out-of-
sample forecasting.
Bearing in mind that the best forecasting model is the one which forecasts accurately
and with consistency both in in-sample and in out-of-sample simulations, we select the
best forecasting model and its configuration according to the best out-of-sample
forecasting performance that deviates from the in-sample accuracy less than 10%. In
this way we ensure that the selected model generalizes sufficiently and we avoid
overfitting in either the in-sample or the out-of-sample dataset. Consequently, we
conclude that the knn classifier with Input variables Set 3 exhibits the highest
forecasting performance for the EUR/USD exchange rate. An interesting finding is that
although the heuristic approach on traders’ expectations (PM) does not exhibit the
highest forecasting accuracy, it outperforms the RW model in out-of-sample
forecasting and thus can be used efficiently in directional forecasting of the USD/EUR
rate. Moreover, the lag structure of the best forecasting model (6 lags) is an indication
of a delay in the tramsittion channel of market’s expectation to the directional
movement of the exchange rate.
Table 4: Foresting accuracies in USD/EUR
RW In-sample 43.216
Out-of-sample 46.154
PM In-sample 55.500

13
Out-of-sample 60.784
Input Set 1 2 3 4 5
SVM
Lags 5 9 6 8 9
kernel Sigmoid Sigmoid Sigmoid Sigmoid Sigmoid
In-sample 51.282 58.115 58.763 54.688 55.497
Out-of-sample 51.923 61.538* 59.615 55.769 57.692
Naïve Bayes
Classifier
Lags 8 8 5 5 2
In-sample 53.684 58.421 58.549 58.549* 57.143
Out-of-sample 40.816 51.020* 46.939 40.816 36.735
Knn Classifier
Lags 0 7 6 2 8
Knn 11 6 12 11 9
In-sample 68.500 62.694 64.433 65.657* 63.542
Out-of-sample 57.692 51.923 63.462** 57.692 59.615
Adaboost Classifier
Lags 0 1 1 0 0
Learn. rate 0.7 0.1 0.3 0.1 0.1
In-sample 68.500 65.829 68.844 62.500 62.500
Out-of-sample 48.077 55.769* 55.769* 36.538 36.538
Logitboost
Classifier
Lags 0 1 1 0 0
Learn. rate 0.9 0.1 0.3 0.1 0.1
In-sample 77.000 67.337 79.899 71.000 71.000
Out-of-sample 46.154 55.769 57.692 36.538 36.538
Logistic Regression
Lags 1 10 3 3 1
Threshold 0.4 0.3 0.5 0.4 0.4
In-sample 55.779 55.263 56.345 56.345 57.789
Out-of-sample 54.902 60.784* 56.863 58.824 56.863
Lags 0 0 0 0 0
ANN
Neurons 2 12 15 12 15
Threshold 0.1 0.1 0.1 0.1 0.1
In-sample 55.000 56.000 60.000* 56.000 62.000
Out-of-sample 54.902 52.941 60.784* 52.941 52.941
Note: * denotes out-of-sample forecasting accuracy for each methodology that deviates
less than 10% from the in-sample performance. ** denotes the overall best forecasting
performance.
Another interesting finding is that the set of regressors leading to the most accurate
model for all methodologies except Logisitc Regression is either Input Set 2 or Input
Set 3. This finding is an indication that microblogging can be used efficiently in
directional forecasting of the USD/EUR. All models outperform the RW model and
since Input Set 1 is the simple autoregressive model, we can reject even the weak form
of efficiency in this exchange rate market.
3.3 The USD/JPY Results
14
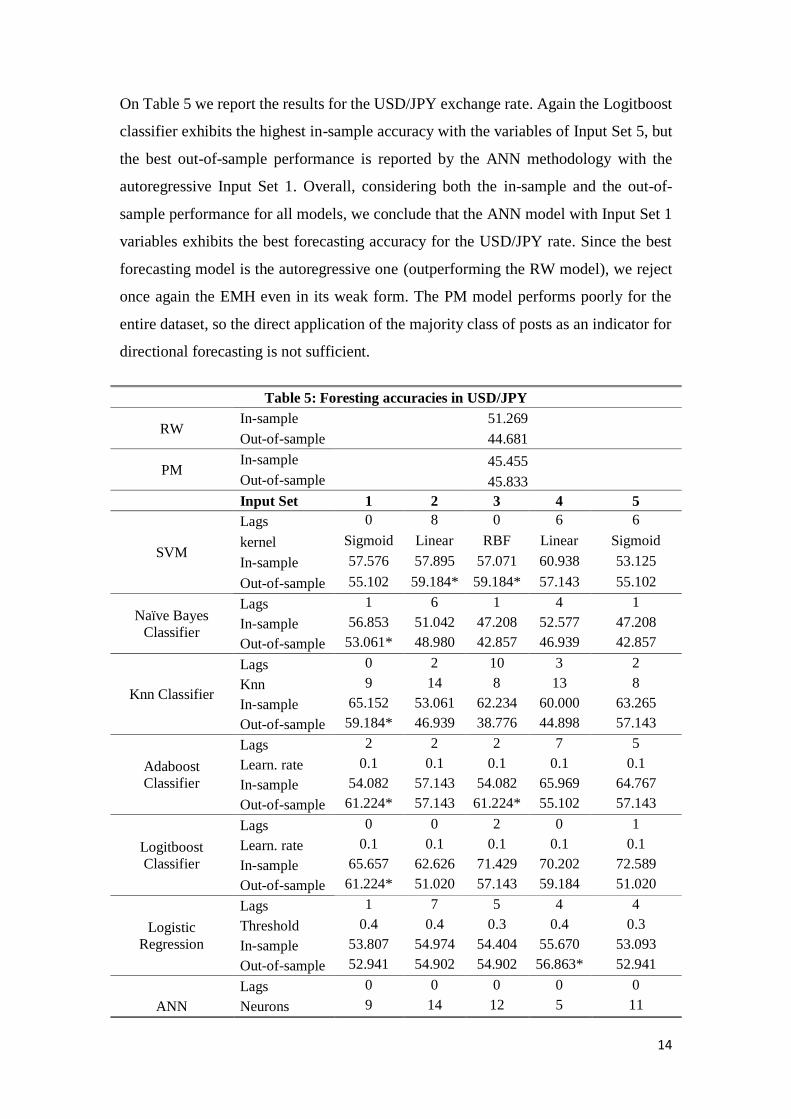
On Table 5 we report the results for the USD/JPY exchange rate. Again the Logitboost
classifier exhibits the highest in-sample accuracy with the variables of Ιnput Set 5, but
the best out-of-sample performance is reported by the ANN methodology with the
autoregressive Input Set 1. Overall, considering both the in-sample and the out-of-
sample performance for all models, we conclude that the ANN model with Input Set 1
variables exhibits the best forecasting accuracy for the USD/JPY rate. Since the best
forecasting model is the autoregressive one (outperforming the RW model), we reject
once again the EMH even in its weak form. The PM model performs poorly for the
entire dataset, so the direct application of the majority class of posts as an indicator for
directional forecasting is not sufficient.
Table 5: Foresting accuracies in USD/JPY
RW In-sample 51.269
Out-of-sample 44.681
PM In-sample 45.455
Out-of-sample 45.833
Input Set 1 2 3 4 5
SVM
Lags 0 8 0 6 6
kernel Sigmoid Linear RBF Linear Sigmoid
In-sample 57.576 57.895 57.071 60.938 53.125
Out-of-sample 55.102 59.184* 59.184* 57.143 55.102
Naïve Bayes
Classifier
Lags 1 6 1 4 1
In-sample 56.853 51.042 47.208 52.577 47.208
Out-of-sample 53.061* 48.980 42.857 46.939 42.857
Knn Classifier
Lags 0 2 10 3 2
Knn 9 14 8 13 8
In-sample 65.152 53.061 62.234 60.000 63.265
Out-of-sample 59.184* 46.939 38.776 44.898 57.143
Adaboost
Classifier
Lags 2 2 2 7 5
Learn. rate 0.1 0.1 0.1 0.1 0.1
In-sample 54.082 57.143 54.082 65.969 64.767
Out-of-sample 61.224* 57.143 61.224* 55.102 57.143
Logitboost
Classifier
Lags 0 0 2 0 1
Learn. rate 0.1 0.1 0.1 0.1 0.1
In-sample 65.657 62.626 71.429 70.202 72.589
Out-of-sample 61.224* 51.020 57.143 59.184 51.020
Logistic
Regression
Lags 1 7 5 4 4
Threshold 0.4 0.4 0.3 0.4 0.3
In-sample 53.807 54.974 54.404 55.670 53.093
Out-of-sample 52.941 54.902 54.902 56.863* 52.941
Lags 0 0 0 0 0
ANN Neurons 9 14 12 5 11

15
Threshold 0.8 0.6 0.4 0.3 0.1
In-sample 63.131 57.071 62.121 58.081 59.091
Out-of-sample 64.583** 58.333 62.500 58.333 58.333
Note: * denotes out-of-sample forecasting accuracy for each methodology that deviates
less than 10% from the in-sample performance. ** denotes the overall best forecasting
performance.
3.4 The USD/GBP Results
On Table 6 we report the results for the USD/GBP rate. Boosted decision trees trained
with the Logitboost algorithm exhibit the highest in-sample accuracy, while the knn
classifier reports the highest out-of-sample forecasting performance. Applying the
aforementioned model selection methodology we conclude that the best forecasting
model is a knn classifier with the variables of Input Set 3. All forecasting models with
the autoregressive Input Set 1 outperform the RW model in out-of-sample forecasting,
while the PM approach performs worse than the RW in the out-of-sample part. In
contrast to the USD/JPY, we find a nine trading days delay in market sentiment as it is
reflected on the exchange rate direction.
Table 6: Foresting accuracies in USD/GBP
RW In-sample 51.515
Out-of-sample 45.833
PM In-sample 53.535
Out-of-sample 44.898
Input Set 1 2 3 4 5
SVM
Lags 3 9 6 1 4
kernel Sigmoid Sigmoid Sigmoid Sigmoid Sigmoid
In-sample 54.359 54.497 59.162 55.330 55.670
Out-of-sample 53.061 53.061 65.306* 57.143 53.061
Naïve Bayes
Classifier
Lags 1 7 2 0 2
In-sample 52.2843 60.2094 58.1633 54.5455 58.1633
Out-of-sample 46.9388 55.1020 53.0612 53.0612 57.1429*
Knn Classifier
Lags 0 7 9 9 0
Knn 7 7 4 7 10
In-sample 63.131 68.586 68.783 66.138 61.111
Out-of-sample 65.306 59.184 69.388** 61.224 61.224
Adaboost
Classifier
Lags 0.0 0.0 0.0 0.0 0.0
Learn. rate 0.1 0.1 0.3 0.1 0.3
In-sample 58.586 60.606 63.131 62.626 66.162
Out-of-sample 46.939 44.898 57.143* 53.061 57.143*
Logitboost
Classifier
Lags 0 0 1 1 0
Learn. rate 0.1 0.1 0.1 0.1 0.1

16
In-sample 63.636 61.616 71.066 69.036 70.202
Out-of-sample 51.020 40.816 53.061 48.980 57.143
Logistic
Regression
Lags 10 10 0 10 0
Threshold 0.5 0.1 0.4 0.2 0.4
In-sample 57.447 53.191 51.010 55.319 51.010
Out-of-sample 60.784* 49.020 47.059 50.980 50.980
Lags 0 0 0 0 0
ANN
Neurons 9 12 9 1 1
Threshold 0.7 0.7 0.8 0.4 0.1
In-sample 60.606 62.121 63.636 57.071 57.071
Out-of-sample 60.417 58.333 62.500* 54.167 54.167
Note: * denotes out-of-sample forecasting accuracy for each methodology that deviates
less than 10% from the in-sample performance. ** denotes the overall best forecasting
performance.
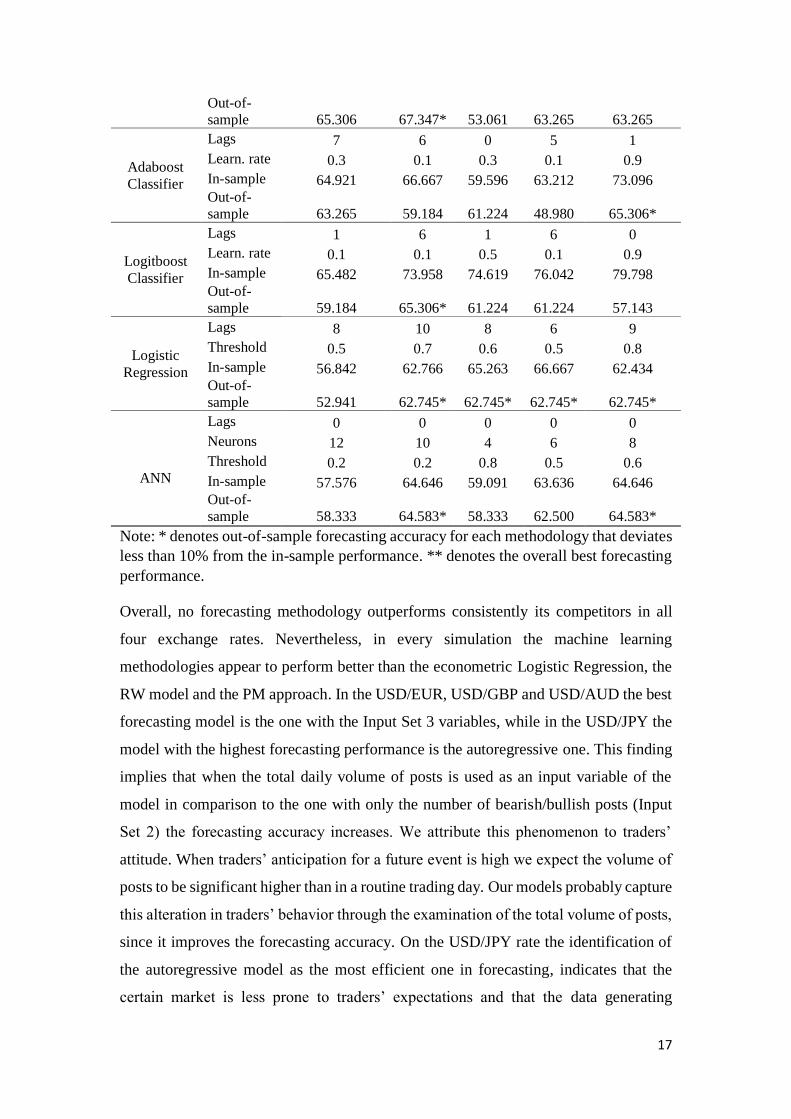
3.5 The USD/AUD Results
As we observe in Table 7, the SVM model with Input Set 3 variables has the highest
out-of-sample accuracy and overall is the best forecasting model for the USD/AUD
rate. The autoregressive SVM model with Input Set 1 variables outperforms the RW
model, while the PM approach performs poorly in the out-of-sample part. We again
detect a significant delay in the transmission channel of market sentiment to the
exchange rate directional movement.
Table 7: Foresting accuracies in USD/AUD
RW
In-sample 48.990
Out-of-
sample 52.083
PM
In-sample 57.576
Out-of-
sample 48.980
Input Set 1 2 3 4 5
SVM
Lags 9 9 8 8 7
kernel Sigmoid Linear Linear Linear Linear
In-sample 56.085 67.725 68.421 69.474 62.827
Out-of-
sample 59.184 69.388 69.388** 67.347 65.306
Naïve Bayes
Classifier
Lags 3 9 10 3 2
In-sample 53.333 67.196 64.361 59.487 59.184
Out-of-
sample 51.020 67.347* 65.306 59.184 59.184
Knn
Classifier
Lags 7 9 5 10 1
Knn 12 14 14 14 4
In-sample 61.257 65.079 60.622 63.830 62.437
17
Out-of-
sample 65.306 67.347* 53.061 63.265 63.265
Adaboost
Classifier
Lags 7 6 0 5 1
Learn. rate 0.3 0.1 0.3 0.1 0.9
In-sample 64.921 66.667 59.596 63.212 73.096
Out-of-
sample 63.265 59.184 61.224 48.980 65.306*
Logitboost
Classifier
Lags 1 6 1 6 0
Learn. rate 0.1 0.1 0.5 0.1 0.9
In-sample 65.482 73.958 74.619 76.042 79.798
Out-of-
sample 59.184 65.306* 61.224 61.224 57.143
Logistic
Regression
Lags 8 10 8 6 9
Threshold 0.5 0.7 0.6 0.5 0.8
In-sample 56.842 62.766 65.263 66.667 62.434
Out-of-
sample 52.941 62.745* 62.745* 62.745* 62.745*
Lags 0 0 0 0 0
ANN
Neurons 12 10 4 6 8
Threshold 0.2 0.2 0.8 0.5 0.6
In-sample 57.576 64.646 59.091 63.636 64.646
Out-of-
sample 58.333 64.583* 58.333 62.500 64.583*
Note: * denotes out-of-sample forecasting accuracy for each methodology that deviates
less than 10% from the in-sample performance. ** denotes the overall best forecasting
performance.
Overall, no forecasting methodology outperforms consistently its competitors in all
four exchange rates. Nevertheless, in every simulation the machine learning
methodologies appear to perform better than the econometric Logistic Regression, the
RW model and the PM approach. In the USD/EUR, USD/GBP and USD/AUD the best
forecasting model is the one with the Input Set 3 variables, while in the USD/JPY the
model with the highest forecasting performance is the autoregressive one. This finding
implies that when the total daily volume of posts is used as an input variable of the
model in comparison to the one with only the number of bearish/bullish posts (Input
Set 2) the forecasting accuracy increases. We attribute this phenomenon to traders’
attitude. When traders’ anticipation for a future event is high we expect the volume of
posts to be significant higher than in a routine trading day. Our models probably capture
this alteration in traders’ behavior through the examination of the total volume of posts,
since it improves the forecasting accuracy. On the USD/JPY rate the identification of
the autoregressive model as the most efficient one in forecasting, indicates that the
certain market is less prone to traders’ expectations and that the data generating

18
mechanism should be address to its co-evolution with other markets (Plakandaras et al.,
2013).
All models based on information exchange through microblogging outperform the RW
model and can be utilized in shaping profitable investment portfolios. The low
forecasting efficiency of the direct application of the shaped market sentiment (PM
approach) as a predictor indicates the inability to use such an approach as a technical
analysis technique. Finally, in the USD/EUR, USD/GBP and the USD/AUD rates we
detect a significant lag in the transmission channel of market expectations as they are
reflected in StockTwits posts and the directional movement of the exchange rate market.
This finding indicates stickiness in the directional movement of the exchange rates and
should be considered by traders.
4. Conclusions
We evaluate various forecasting methodologies considering alternative input variable
sets in forecasting the four exchange rates with the highest daily trading volumes. In
this study, instead of relying on order flows that is a common approach within the
microstructural view of the financial markets, we focus on investors’ sentiment as a
possible predictor of the future evolution of exchange rates. As a proxy of investors’
sentiment we use the StockTwits, a finance dedicated message board. Our empirical
findings report that no methodology consistently outperforms the others, but overall
Knn classifier, SVM and ANN exhibit higher forecasting ability than the econometric
Logistic Regression. The weak form of efficiency is rejected for all exchange rates and
thus private information exchanged in message boards shapes market expectations and
drives exchange rates. Extending the work of Evans and Lyons (2002b) on the
microstructural proposition of the foreign exchange market, traders’ sentiment as
reflected in publicly available microblogging could provide an additional informational
path to order flow analysis for traders and policy makers.
Acknowledgments
This research has been co-financed by the European Union (European Social Fund –
ESF) and Greek national funds through the Operational Program "Education and
Lifelong Learning" of the National Strategic Reference Framework (NSRF) - Research
19
Funding Program: THALES (MIS 380292). Investing in knowledge society through
the European Social Fund.
References
Bank of International Settlements (2013), “Triennial Central Bank Survey of foreign
exchange and derivatives markets activity in 2013”, Triennial Central Bank
Survey, BIS, accessed at https://www.bis.org/publ/rpfxf13fxt.pdf.
Bollen, J., Mao, H., Zeng, X.J., 2011, March. Twitter mood predicts the stock market.
Cheung Y-W and Chinn M –D (2001) Currency traders and exchange rate dynamics: a
survey of the U.S. Market, Journal of International Money and Finance, vol. 20
(4), pp. 439–471.
Cortes, C. and Vapnik, V. (1995) Support-vector networks, Machine Learning,
vol. 20 (3), pp. 273.
Crowder W. (1994) Foreign exchange market efficiency and common stochastic trends,
Journal of International Money and Finance, vol. 13 (5), pp. 551-564.
Daniélsson J., Luo J. and Payne R. (2012) Explaining and forecasting exchange rates,
European Journal of Finance, vol. 18 (9), pp. 823–840
Das S.R. and Chen M.Y. (2007) Yahoo! for Amazon: Sentiment extraction from small
talk on the web, Managerial Science, vol.53 (9), pp. 1375–1388.
Evans M.D.D. and Lyons R.K. (2002) Order flow and exchange rate dynamics Journal
of Political Economy, vol. 110 (1), pp. 170–180.
Freund Y. and Schapire R. (1996) Experiments with a new boosting algorithm.
In the Proceedings of the Thirteenth International Conference on Machine
Learning, pp. 148--156, 1996
Friedman J., Hastie T. and Tibshirani R. (2000) Additive logistic regression: a statistical
view of boosting. Annals of Statistics, vol. 28(2), pp. 337–407.
Gehrig T. and Menkhoff L. (2004) The use of flow analysis in foreign exchange:
exploratory evidence, Journal of International Money and Finance, vol. 23 (4),
pp. 573–594
Janetzko D. (2014) Using Twitter to Model the EUR/USD Exchange Rate, arxiv
archive.
Jarque C., Bera M. and Anil K. (1980). "Efficient tests for normalit, homoscedasticity
and serial independence of regression residuals". Economics Letters, vol.6(3), pp.
255–259.
King M., Sarno L. and Sojli E. (2010) Timing exchange rates using order flow: the case
of the Loonie, Journal of Banking and Finance, vol. 34 (12), pp. 2917–2928.

20
King M.R., Osler C.L and Rime D. (2013) The market microstructure approach to
foreign exchange: Looking back and looking forward, vol. 38, pp. 95–119.
Oliveira N., Cortez P. and Areal N. (2013) On the Predictability of Stock Market
Behavior Using StockTwits Sentiment and Posting Volume, Progress in
Artificial Intelligence, Lecture Notes in Computer Science, vol. 8154, pp. 355-
365.
Papaioannou, P., Russo, L., Papaioannou, G., and Siettos, C. I. (2013). Can social
microblogging be used to forecast intraday exchange rates? NETNOMICS:
Economic Research and Electronic Networking, 14(1-2):47–68.
Plakandaras Vasilios, Papadimitriou Theophilos and Gogas Periklis (2013 Forecasting
daily and monthly exchange rates with machine learning techniques DUTH
Research Papers in Economics 3-2013, Democritus University of Thrace,
Department of Economics.
Rechenthin M., Street W.N. and Srinivasan P. (2013) Stock chatter: Using stock
sentiment to predict price direction. Algorithmic Finance, vol.2 pp. 169–196.
Rime D., Sarno L. and Sojli E. (2010) Exchange rate forecasting, order flow and
macroeconomic information, Journal of International Economics, vol. 80 (1), pp.
72–88.
Ruiz E.J., Hristidis V., Castillo C., Gionis A. and Jaimes A. (2012) Correlating financial
time series with micro-blogging activity. Proceedings of the 5th ACM
International Conference on Web Search and Data Mining, ACM, Seattle, WA,
pp. 513–522..
Sprenger T. and Welpe I. (2010) Tweets and trades: The information content of stock
microblogs. Social Science Research Network Working Paper Series, pp.1-89.
Tabak B. and Lima E. (2009) Market Efficiency of Brazilian Exchange Rate: Evidence
from Variance Ratio Statistics and Technical Trading Rules, European Journal
of Operational Research, vol. 194 (3), pp. 814-820.
Taylor M.P. and Allen H. (1992) The use of technical analysis in the foreign exchange
market, Journal of International Money and Finance, vol. 11 (3), pp. 304–314
Wex F., Widder N., Liebmann M. and Neumann D. (2013) Early warning of impending
oil crises using the predictive power of online news stories. System Sciences
(HICSS), 46th Hawaii International Conference, Wailea, Maui, Hawaii,pp.
1512–1521.
Zhang, X., Fuehres, H. and Gloor, P.A. (2012) Predicting asset value through twitter
buzz. Advances in Collective Intelligence, Springer, Savannah, Georgia, pp. 23–
34.