Mardie Project - EPA WA
109
CLIENT: Mardie Minerals STATUS: Rev 3 REPORT No.: 190108 ISSUE DATE: 20 th October 2020 Mardie Project Marine Environmental Quality Monitoring & Management Plan
Transcript of Mardie Project - EPA WA

CLIENT: Mardie Minerals
STATUS: Rev 3 REPORT No.: 190108
ISSUE DATE: 20th October 2020
Mardie Project Marine Environmental Quality
Monitoring & Management Plan

ii Mardie Minerals Ltd
Mardie Project: Marine Environmental Quality Monitoring & Management Plan
19WAU-0006 / R190108
Important Note
This report and all its components (including images, audio, video, text) is copyright. Apart from fair
dealing for the purposes of private study, research, criticism or review as permitted under the Copyright
Act 1968, no part may be reproduced, copied, transmitted in any form or by any means (electronic,
mechanical or graphic) without the prior written permission of O2 Marine.
This report has been prepared for the sole use of the Mardie Minerals Pty Ltd (herein, ‘the client’), for
a specific site (herein ‘the site’, the specific purpose specified in Section 1 of this report (herein ‘the
purpose’). This report is strictly limited for use by the client, to the purpose and site and may not be
used for any other purposes.
Third parties, excluding regulatory agencies assessing an application in relation to the purpose, may
not rely on this report. O2 Marine waives all liability to any third-party loss, damage, liability or claim
arising out of or incidental to a third-party publishing, using or relying on the facts, content, opinions or
subject matter contained in this report.
O2 Marine waives all responsibility for loss or damage where the accuracy and effectiveness of
information provided by the Client or other third parties was inaccurate or not up to date and was relied
upon, wholly or in part in reporting.
This report contains maps that include data that are copyright to the Commonwealth of Australia (2006),
the Western Australian Government (2001, 2018 and 2019) and Microsoft Corporation Earthstar
Geographics SIO (2020).
Maps are created in WGS 84 - Pseudo-Mercator (EPSG:3857) coordinate reference system and are
not to be used for navigational purposes.
Positional accuracy should be considered as approximate.

iii Mardie Minerals Ltd
Mardie Project: Marine Environmental Quality Monitoring & Management Plan
19WAU-0006 / R190108
WA Marine Pty Ltd t/as O2 Marine ACN 168 014 819
Originating Office – Southwest
29 Albert Street, Busselton WA 6280
T 08 93351232 | [email protected]
Version Register
Version Status Author Reviewer Change from
Previous Version
Authorised for Release
(signed and dated)
Rev 0 Draft C Lane T Hurley
N Dixon
Address client review
comments
C Lane 24/5/2019
Rev 1 Final R Stevens N Dixon Inclusion of Monitoring
& Management
Sections
C Lane 9/12/2019
Rev 2 Final R Stevens Office of the
EPA
Update Project
Description, revised
LEPs and incorporate
comments from client
C Lane 25/03/2020
Rev 3 Final R Stevens Include several
updates from EPA
Review
C Lane 20/10/2020
Transmission Register
Controlled copies of this document are issued to the persons/companies listed below. Any copy of this
report held by persons not listed in this register is deemed uncontrolled. Updated versions of this report
if issued will be released to all parties listed below via the email address listed.
Name Email Address
Neil Dixon [email protected]
Michael Klvac [email protected]

iv Mardie Minerals Ltd
Mardie Project: Marine Environmental Quality Monitoring & Management Plan
19WAU-0006 / R190108
Acronyms and Abbreviations
Acronyms/Abbreviation Description
ANZG Australian and New Zealand Guidelines
BCH Benthic Communities and Habitat
EPA Environmental Protection Authority
EQC Environmental Quality Criteria
EQIs Environmental Quality Indicators
EQMF Environmental Quality Management Framework
EQOs Environmental Quality Objectives
ESD Environmental Scoping Document
EVs Environmental Values
GLpa Gigalitre per annum
ktpa kilo tonnes per annum
LEPs Levels of Ecological Protection
MEQ Marine Environmental Quality
MEQMMP Marine Environmental Quality Monitoring & Management Plan
MEQP Marine Environmental Quality Plan
MS Ministerial Statement
MTs Management Targets
Mtpa Million tonnes per annum
NaCl Sodium chloride, commonly known as salt.
SOP Sulphate of potash
SWQMS State Water Quality Management Strategy

v Mardie Minerals Ltd
Mardie Project: Marine Environmental Quality Monitoring & Management Plan
19WAU-0006 / R190108
Table of Contents
1. Introduction 8
Project Description 8
Scope 13
2. Existing Environment 15
Coastal Setting 15
Climatology and Oceanography 16
Water Quality 21
Sediment Quality 23
Benthic Communities and Habitat 24
Marine Fauna 32
3. Environmental Quality Management Framework 35
Background 35
Environmental Values & Environmental Quality Objectives 35
Levels of Ecological Protection 37
4. Environmental Pressures and Key Threats to Marine Environmental Quality 40
Relevant Operational Activities 40
5. Conceptual Model of Pressures/Threats and Selection of Environmental Quality
Indicators 43
Conceptual Model for the Mardie Project 43
Environmental Quality Criteria 45
6. Monitoring and Management 49
Monitoring and Management Programs 52
Pre-Commissioning Baseline Monitoring Program 57
Bitterns Diffuser Outfall Commissioning 68
Bitterns Diffuser Outfall Validation 72
Routine Operational Performance Assessment 89
7. Review 107
8. References 108
Figures
Figure 1-1 Mardie Project Regional Location 11
Figure 1-2 Mardie Project Development Envelopes 12
Figure 2-1 Wind Rose plots for Dry Season (left) and Wet Season Months (right) based on analysis of the measured data from Mardie airport 16
Figure 2-2 Climate Statistics for Mardie (BOM). 17
Figure 2-3 Tracks of notable cyclones impacting Karratha (left) and Onslow (right) 17
vi Mardie Minerals Ltd
Mardie Project: Marine Environmental Quality Monitoring & Management Plan
19WAU-0006 / R190108
Figure 2-4 Wave conditions offshore of the Mardie Proposal location for Dry Season months (left) and Wet Season Months (right) based on measured data April 2018 – January 2019. 18
Figure 2-5 Measured water level data from inshore Aquadopp location November 2018 20
Figure 2-6 Intertidal Benthic Communities and Habitat and Local Assessment Units 28
Figure 2-7 Subtidal Benthic Communities and Habitat and Local Assessment Unit 31
Figure 3-1 Environmental Quality Management Framework 35
Figure 3-2 Levels of Ecological Protection for the Mardie Proposal 39
Figure 5-1 Mardie Project Conceptual Site Model 44
Figure 5-2 Summary of the approach used to derive preliminary Environmental Quality Guidelines 48
Figure 6-1 Baseline Water Quality Monitoring Locations 61
Figure 6-2 Contingency management framework during bitterns discharge commissioning 71
Figure 6-3 Bitterns Outfall and Offshore Marine Facilities Sites for Validation Sampling 83
Figure 6-4 Post-commissioning brine discharge quality validation contingency management. 88
Figure 6-5 Contingency management framework for routine bitterns discharge quality 96
Figure 6-6 Seawater abstraction and small vessel facility MEQ monitoring locations 98
Figure 6-7 Routine Marine Environmental Quality Monitoring and Assessment Framework 101
Figure 6-8 Management Response Framework for assessment of required action from routine and investigative monitoring programs 105
Figure 6-9 Ongoing Marine Environmental Quality Monitoring Contingency Management Actions 106
Tables
Table 1-1 Proposal Summary 8
Table 1-2 Location and proposed extent of physical and operational elements 10
Table 2-1 Mardie Tidal Planes (location 21.03572 S, 115.92766 E, National Tide Centre) 20
Table 3-1 Environmental Values and Environmental Quality Objectives applicable to the Mardie Project area 36
Table 3-2 Specific features of EVs identified through Mardie Environmental Investigations 36
Table 3-3 Limits of acceptable change in the key elements of ecosystem integrity for the four levels of ecological protection (Source: EPA, 2016). 37
Table 4-1 Preliminary Diffuser Design and Configuration (Source Baird 2020) 41
Table 5-1 Environmental Quality Indicators and Criteria selected for the Mardie Project 46
Table 6-1 Management Targets and Proposed Actions to Mitigate Operational Impacts on Marine Environmental Quality 49
Table 6-2 Elements of the Marine Environmental Quality Monitoring and Management 52
Table 6-3 Monitoring Program Overview 53
Table 6-4 Monitoring Frequency for the Proposed Phase I Baseline data collection 58
Table 6-5 Baseline Water Quality Monitoring Locations and Routine Tasks 59
Table 6-6 Aesthetic observations quick reference guide 62
Table 6-7 Preliminary EQGs for Marine Environmental Quality Validation – Phase III 73
Table 6-8 Monitoring Frequency for EQC Validation Monitoring 80
Table 6-9 Marine Environmental Quality Monitoring Locations and Associated Routine Sampling Tasks for MEQ Validation 81
Table 6-10 Preliminary EQGs for routine Marine Environmental Quality Monitoring – Sediment Sampling 90
Table 6-11 Preliminary EQGs for routine Marine Environmental Quality Monitoring – Sediment Toxicity Bioavailability Assessment 91
Table 6-12 Preliminary EQSs for routine Marine Environmental Quality Monitoring 92

vii Mardie Minerals Ltd
Mardie Project: Marine Environmental Quality Monitoring & Management Plan
19WAU-0006 / R190108
Table 6-13 Monitoring Frequency for Ongoing Marine Environmental Quality Monitoring 97
Table 7-1 MEQMMP review timeframes for the Project lifecycle 107
Mardie Minerals Ltd Mardie Project: Marine Environmental Quality Monitoring & Management Plan
18WAU-0002 / R190108
8
1. Introduction
Project Description
Proposal Summary
Table 1-1 Proposal Summary
Proposal Title Mardie Project
Proponent Name Mardie Minerals Pty Ltd
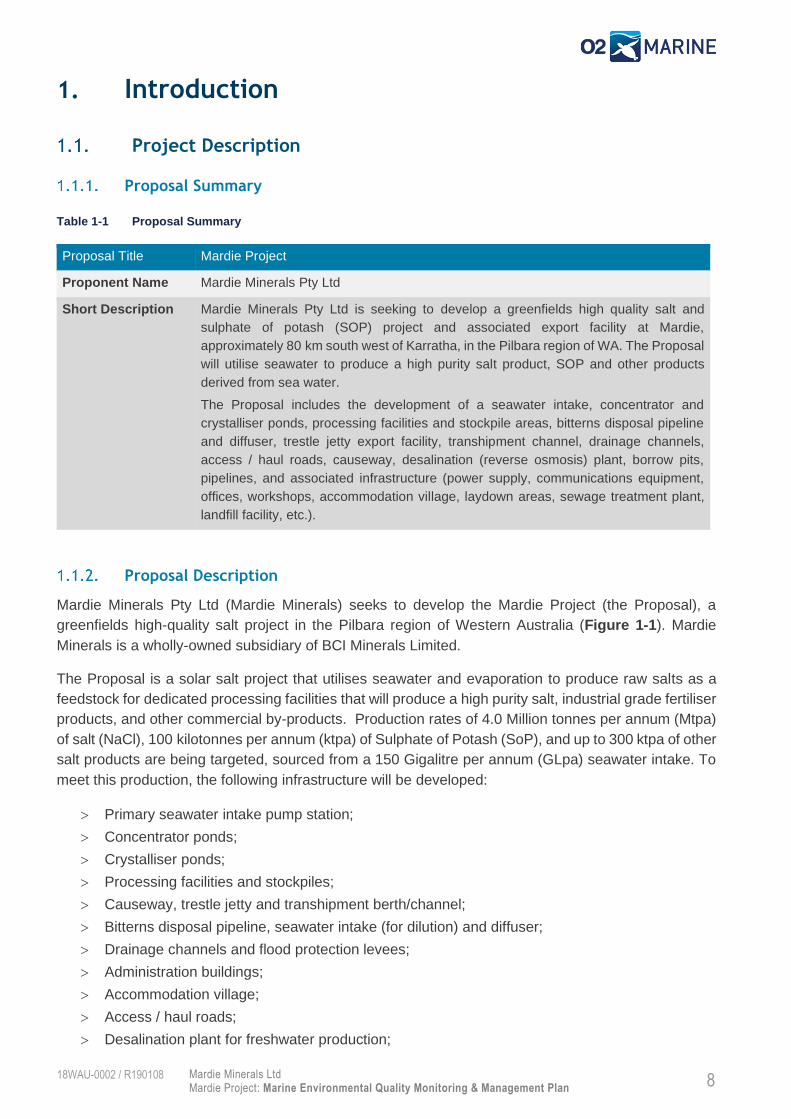
Short Description Mardie Minerals Pty Ltd is seeking to develop a greenfields high quality salt and
sulphate of potash (SOP) project and associated export facility at Mardie,
approximately 80 km south west of Karratha, in the Pilbara region of WA. The Proposal
will utilise seawater to produce a high purity salt product, SOP and other products
derived from sea water.
The Proposal includes the development of a seawater intake, concentrator and
crystalliser ponds, processing facilities and stockpile areas, bitterns disposal pipeline
and diffuser, trestle jetty export facility, transhipment channel, drainage channels,
access / haul roads, causeway, desalination (reverse osmosis) plant, borrow pits,
pipelines, and associated infrastructure (power supply, communications equipment,
offices, workshops, accommodation village, laydown areas, sewage treatment plant,
landfill facility, etc.).
Proposal Description
Mardie Minerals Pty Ltd (Mardie Minerals) seeks to develop the Mardie Project (the Proposal), a
greenfields high-quality salt project in the Pilbara region of Western Australia (Figure 1-1). Mardie
Minerals is a wholly-owned subsidiary of BCI Minerals Limited.
The Proposal is a solar salt project that utilises seawater and evaporation to produce raw salts as a
feedstock for dedicated processing facilities that will produce a high purity salt, industrial grade fertiliser
products, and other commercial by-products. Production rates of 4.0 Million tonnes per annum (Mtpa)
of salt (NaCl), 100 kilotonnes per annum (ktpa) of Sulphate of Potash (SoP), and up to 300 ktpa of other
salt products are being targeted, sourced from a 150 Gigalitre per annum (GLpa) seawater intake. To
meet this production, the following infrastructure will be developed:
Primary seawater intake pump station;
Concentrator ponds;
Crystalliser ponds;
Processing facilities and stockpiles;
Causeway, trestle jetty and transhipment berth/channel;
Bitterns disposal pipeline, seawater intake (for dilution) and diffuser;
Drainage channels and flood protection levees;
Administration buildings;
Accommodation village;
Access / haul roads;
Desalination plant for freshwater production;

Mardie Minerals Ltd Mardie Project: Marine Environmental Quality Monitoring & Management Plan
18WAU-0002 / R190108
9
Boat launching facility and port stockyard; and
Associated infrastructure including power supply, communications, workshop, laydown, landfill
facility, sewage treatment plant.
Seawater for the process will be pumped from a large tidal creek into the concentrator ponds. All pumps
will be screened and operated accordingly to minimise entrapment of marine fauna and any reductions
in water levels in the tidal creek.
Concentrator and crystalliser ponds will be developed behind low permeability walls engineered from
local clays and soils and rock armoured to protect against erosion. The height of the walls varies across
the project and is matched to the storm risk for the area.
Potable water will be required for the production plants and the village. The water supply will be sourced
from desalination plants across the Proposal. The high salinity brine output from the plants will be
directed to concentrator ponds or a lined process pond.
A trestle jetty will be constructed to convey salt (NaCl) from the salt production stockpile to the
transhipment berth pocket, approximately 2.2 km offshore. The jetty will not impede coastal water or
sediment movement, thus ensuring coastal processes are maintained.
Dredging of up to 850,000 m3 will be required to ensure sufficient depth for the transhipper berth pocket
at the end of the trestle jetty, as well as along a 4.5 km long channel out to deeper water. The average
depth of dredging is approximately 1 m below the current sea floor. The dredge spoil is inert and will be
transported to shore for use within the development.
The production process will produce a high-salinity bittern that, prior to its discharge through a diffuser
at the far end of the trestle jetty, will be diluted with seawater to bring its salinity closer to that of the
receiving environment.
Access to the project from North West Coastal Highway will be based on an existing public road
alignment that services the Mardie Station homestead and will require upgrading..
The majority of the power required for the project (i.e. approximately 95%) is provided by the sun and
the wind, which drives the evaporation and crystallisation processes. In addition, the Proposal will
require diesel and gas to provide additional energy for infrastructure, support services and processing
plant requirements.
The Proposal will be developed within three development envelopes. The boundaries of these
development envelopes are shown in Figure 1-2 and described in Table 1-2.

Mardie Minerals Ltd Mardie Project: Marine Environmental Quality Monitoring & Management Plan
18WAU-0002 / R190108
10
Table 1-2 Location and proposed extent of physical and operational elements
Element Ref. Proposed Extent
Physical Elements
1. Ponds & Terrestrial Infrastructure Development Envelope – concentrator and crystalliser ponds, processing plant, access / haul road, desalination plant, causeway, administration, accommodation village, laydown, other infrastructure.
Fig. 2 Disturbance of no more than 11,212 ha within the 16,005 ha Ponds & Terrestrial Infrastructure Development Envelope.
2. Marine Development Envelope – trestle jetty, seawater intake and pipelines.
Fig. 2 Disturbance of no more than 7 ha within the 50 ha Marine Development Envelope.
3. Dredge Channel Development Envelope – berth pocket, channel to allow access for transhipment vessels, bitterns outfall diffuser.
Fig. 2 Disturbance of no more than 115 ha within the 304 ha Dredge Channel Development Envelope.
4. Mangrove Disturbance Fig. 2 Disturbance of mangrove communities limited to 20 ha of Scattered Canopy mangroves and 1.0 ha of Closed Canopy mangroves
Operational Elements
Desalination Plant discharge Fig. 2 Discharge to ponds or bitterns stream
Dredge volume Fig. 2 Dredging is only to occur within the Dredge Channel Development Envelope.
Dredging of no more than 850,000 m3 of material from the berth pocket and high points within the dredge channel, with the material to be deposited within the Ponds & Terrestrial Infrastructure Development Envelope.
Bitterns discharge Fig. 2 Discharge of up to 3.6 gigalitres per annum (GLpa) of bitterns with a specific gravity of no more than 1.25 via a diffuser within a Low Ecological Protection Area.
Bitterns will be diluted prior to discharge.
Pond seawater intake Up to 150 GL per annum, from a screened intake with a maximum average intake flow rate at the screen of less than 0.15 m/s.
Seawater abstraction will only occur when water levels are at mean sea level or higher.

Mardie Minerals Ltd Mardie Project: Marine Environmental Quality Monitoring & Management Plan
18WAU-0002 / R190108
11
Figure 1-1 Mardie Project Regional Location

Mardie Minerals Ltd Mardie Project: Marine Environmental Quality Monitoring & Management Plan
18WAU-0002 / R190108
12
Figure 1-2 Mardie Project Development Envelopes

Mardie Minerals Ltd Mardie Project: Marine Environmental Quality Monitoring & Management Plan
18WAU-0002 / R190108
13
Scope
The purpose of this Marine Environmental Quality Monitoring and Management Plan (MEQMMP) is to
establish a framework to ensure that the implementation of the Project does not compromise the
Environmental Values (EVs) and Environmental Quality Objectives (EQOs) of the Mardie coastal area.
The framework relies on establishing EVs and EQOs, spatially defining the Levels of Ecological
Protection (LEPs) for the Project area, and applying a risk-based, adaptive approach to monitoring and
management.
The MEQMMP applies to the following project activities that have the potential to impact on the
environmental quality of the marine environment at Mardie:
the discharge of waste bitterns;
day-to-day port operations; and
the storage and handling of potentially contaminating materials.
Project activities associated with off-shore dredging and on-shore construction are managed through
their respective, specialised environmental management plans.
The MEQMMP sets out a process for monitoring and reporting to allow residual impacts to be assessed
against acceptable limits of ecological change during the lifecycle of the Proposal. Where results
outside the limits of acceptable change are reported, a pre-determined risk-based response is triggered
to ensure the EVs and EQOs are not compromised.
Specifically, the objectives of this MEQMMP are to:
Identify EVs and clearly define EQOs relevant to the Proposal area;
Spatially define LEPs relevant to the Proposal area;
Establish Environmental Quality Criteria (EQC) to provide measurable levels of acceptable
change to Environmental Quality Indicators (EQIs) for each EV;
Establish protocols and procedures for the monitoring, management and reporting regarding
the achievement of EQOs and protection of EVs;
Provide a framework to guide management response and required actions in the event
established EQC are exceeded; and
Ensure the collection, analysis and reporting of marine environmental quality (MEQ) data
occur in a consistent and robust manner.
This MEQMMP applies to each of the key project phases. The Plan also details the process for routine
review and continual improvement of the Plan as the Proposal progresses, or at any time key processes
alter and new risks are identified.
To ensure the objectives of the MEQMMP are achieved the following key processes have been defined:
1. Pre-Project Baseline Data Collection;
o Derive locally relevant EQC from baseline data to inform ongoing monitoring and
management.
2. Commissioning and Validation;
o Undertake further whole of effluent toxicity (WET) of the final bitterns during the
commissioning phase to ensure the species protection levels (SPL) within the outfall
mixing zone and the designated LEPs are appropriate;

Mardie Minerals Ltd Mardie Project: Marine Environmental Quality Monitoring & Management Plan
18WAU-0002 / R190108
14
o Validate the accuracy of numerical modelling in predicting the extent of the mixing
zone; and
o Validate performance of the bitterns outfall diffuser during both commissioning and
operational phases of the Proposal.
3. Ongoing MEQ Monitoring;
o Monitor and mitigate potential impacts to MEQ throughout the life of the Proposal.

Mardie Minerals Ltd Mardie Project: Marine Environmental Quality Monitoring & Management Plan
18WAU-0002 / R190108
15
2. Existing Environment
This section describes the existing environment at the site of the proposal and surrounding waters. The
description of the existing environment is based on a desktop review of historical information and
investigations currently conducted as part of the environmental impact assessment process.
Coastal Setting
The Pilbara coast is noted to be a region of extremes (Elliot et al 2013), an arid environment where
sediment is delivered periodically to the coast through networks of rivers and streams and where
significant events such as tropical cyclones bring episodic flooding and inundation impacts that drive
geomorphic changes along its coastal landforms. Semeniuk (1993) describes the dominant drivers for
coastal processes and ecology within the study area as typically wave dominated, with a lesser
dominant driver associated with meso-tides experienced in the region with a range exceeding 3.5 m.
The coastal area of the Pilbara is composed of an ancient hard-rock terrain over which the deposition
of sediment from sources including coral reefs, flood plains and river deltas has occurred for 2 million
years. The shoreline at the Proposal site is generally northwest facing with the inter-tidal region around
the Proposal site generally described as quaternary mudflat deposits, clay, salt and sand (Elliot et al
2013).
The inner shelf region is very wide along this section of the coast, and consequently the near shore
bathymetry is very shallow, with water depth of approximately 5 m (below LAT) at a distance of 10km
offshore. A series of offshore islands and reefs are located immediately offshore which provide natural
protection for the coastline during extreme events (e.g. Tropical Cyclones). Further offshore the
Montebello Islands, Barrow Island and the Barrow shoals provide significant protection against extreme
waves associated with the passage of a tropical cyclone.
A series of major tidal creeks lined by mangroves and salt marsh extend from the shoreline through the
intertidal area, with branches that convey tidal flows across the tidal flats. Beyond the mangrove areas,
large areas of clay pan are present across expansive tidal flat areas which extend 10km or more inland
from the coast. During neap tides the high tide water level is generally contained within the creeks
through the intertidal areas and there is little to no inundation of the tidal flats. During spring tides, a
large proportion of the intertidal area becomes completely inundated and based on aerial imagery and
anecdotal reports the surface water can remain on the surface for days after. The Fortescue river mouth
is located approximately 20 km east of the Proposal site and under extreme flooding scenarios breakout
flows have the potential to extend across the Proposal site (RPS 2018).
Analysis of satellite images from the Mardie site over the period 2004 - 2017 reported in RPS 2018 note
the dynamic nature of the mangroves and tidal creek areas. The flat terrain of the intertidal areas results
in the tidal watersheds being highly sensitive to small changes in the landform. The analysis examined
the tidal branches over time noting evidence of increased colonisation of many of the creeks by
mangroves along with increased branching of the creeks over the approximately 13-year period, which
is likely indicative of either sea-level rise or erosion of sediment from the intertidal zone. Behind the
mangrove zone the analysis indicated a clay pan area which is colonised by algae and cyanobacteria
that form extensive crusting mats. The tidal creek systems through the intertidal area provide the
mechanism by which seawater is moved in and out of this area under the general tidal regime.

Mardie Minerals Ltd Mardie Project: Marine Environmental Quality Monitoring & Management Plan
18WAU-0002 / R190108
16
Climatology and Oceanography
The southern Pilbara region has a tropical monsoon climate with distinct wet and dry seasons. The dry
season extends from May to October, and is characterised by warm to hot temperatures, easterly to
southeasterly winds from the continental landmass, clear and stable conditions as the subtropical high-
pressure ridge migrates over this area. In the afternoon, the wind direction shifts to north-westerly,
particularly later in the dry season, associated with the onset of the land sea breeze as the temperature
difference between the continent and the ocean increases throughout the day. In the wet season the
wind climate is dominated by westerly and north-westerly winds. Wind rose plots for the Dry Season
months (May to October) and Wet Season months (November to April) are presented in Figure 2-1
based on analysis of the measured wind records from Mardie Airport over the period 2011 - 2018.
Figure 2-1 Wind Rose plots for Dry Season (left) and Wet Season Months (right) based on analysis of the measured
data from Mardie airport
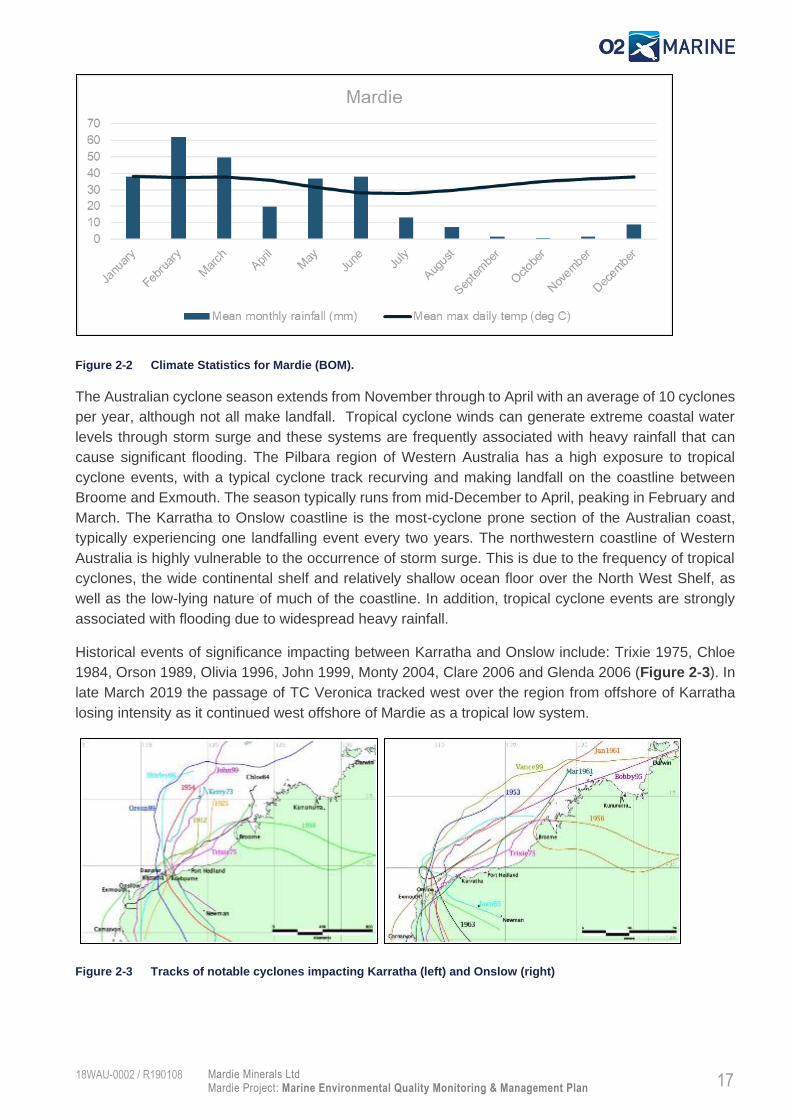
Climate statistics for the town of Mardie are presented in Figure 2-2 from the Bureau of Meteorology
(BoM) site which is approximately 16km inland. Maximum daily temperatures at Mardie average 33.9
°C throughout the year, peaking at 38.0 °C in January and falling to 27.7 °C in July. The Pilbara is
influenced by northern rainfall systems of tropical origin. These systems are responsible for heavy falls
during the summer months, while the southern low-pressure systems sometimes bring limited winter
rains. The annual average rainfall is only 128 mm, and the mean monthly rainfall has a bimodal
distribution, peaking in January to March and also May to June, with very little rainfall from July to
December (Figure 2-2). Daily rainfall can reach over 300 mm during extreme events that may occur
one to two times per decade. Evaporation rates in the region are high, estimated to exceed by ten times
the annual rainfall.
Mardie Minerals Ltd Mardie Project: Marine Environmental Quality Monitoring & Management Plan
18WAU-0002 / R190108
17
Figure 2-2 Climate Statistics for Mardie (BOM).
The Australian cyclone season extends from November through to April with an average of 10 cyclones
per year, although not all make landfall. Tropical cyclone winds can generate extreme coastal water
levels through storm surge and these systems are frequently associated with heavy rainfall that can
cause significant flooding. The Pilbara region of Western Australia has a high exposure to tropical
cyclone events, with a typical cyclone track recurving and making landfall on the coastline between
Broome and Exmouth. The season typically runs from mid-December to April, peaking in February and
March. The Karratha to Onslow coastline is the most-cyclone prone section of the Australian coast,
typically experiencing one landfalling event every two years. The northwestern coastline of Western
Australia is highly vulnerable to the occurrence of storm surge. This is due to the frequency of tropical
cyclones, the wide continental shelf and relatively shallow ocean floor over the North West Shelf, as
well as the low-lying nature of much of the coastline. In addition, tropical cyclone events are strongly
associated with flooding due to widespread heavy rainfall.
Historical events of significance impacting between Karratha and Onslow include: Trixie 1975, Chloe
1984, Orson 1989, Olivia 1996, John 1999, Monty 2004, Clare 2006 and Glenda 2006 (Figure 2-3). In
late March 2019 the passage of TC Veronica tracked west over the region from offshore of Karratha
losing intensity as it continued west offshore of Mardie as a tropical low system.
Figure 2-3 Tracks of notable cyclones impacting Karratha (left) and Onslow (right)

Mardie Minerals Ltd Mardie Project: Marine Environmental Quality Monitoring & Management Plan
18WAU-0002 / R190108
18
The astronomical tide is the periodic rise and fall of the sea surface caused by the combination of the
gravitational force exerted by the moon and the Sun upon the Earth and the centrifugal force due to
rotations of the Earth and moon, and the Earth and the Sun around their common centre of gravity.
Tides are subject to spatial variability due to hydrodynamic, hydrographic and topographic influences.
At the study area, the tides are characterised by amplification of tidal range due to the shallow
bathymetry over the North West Shelf and complex hydrographic and topographic features. The tide
levels recently analysed from data near the Proposal site indicates that the mean spring tide range
exceeds 3.5 m and the maximum tide range is ≈ 5.1 m.
The northwest shelf of Western Australia experiences waves generated from three primary sources:
Indian Ocean swell, locally generated wind-waves and tropical cyclone waves. Along the shoreline the
ambient (non-cyclonic) wave climate is generally mild. In dry season months low amplitude swell
originating in the Indian Ocean propagates to the site and occurs in conjunction with locally generated
sea waves of short period (<5 s). In the wet season the wave climate is locally generated sea waves
from the southwest. In general, the significant wave height is dominated by locally generated sea
conditions within the range of 0.5 m to 1 m at short wave periods (Tp< 5 s). Measured data from an
ADCP instrument deployed approximately 15 km offshore for the Proposal has been analysed to
characterise the wave conditions in the wet and dry seasons as shown in Figure 2-4.
Figure 2-4 Wave conditions offshore of the Mardie Proposal location for Dry Season months (left) and Wet Season
Months (right) based on measured data April 2018 – January 2019.
Whilst the non-cyclonic ambient wave conditions are generally mild, in contrast the strong winds in a
tropical cyclone can generate extreme wave conditions. It is noted that the offshore island features
would provide some natural protection from extreme wave conditions depending on the direction of
propagation. Extreme cyclonic waves contribute to the total water level through wave run-up which is
the maximum vertical extent of wave uprush on a beach and is comprised of both wave set-up and
swash. The impact of cyclonic waves on the study site is dependent on the prevailing water level
conditions and direction of cyclone approach. If coincident with a spring tide and storm surge, waves
could propagate beyond the typical position of the beach and induce erosion of the shoreline as well as
sediment transport.
Tropical cyclones are typically associated with heavy rainfall prior to, during and after the landfall of the
system, which can lead to catchment flooding. The elevation in coastal water levels caused by the storm
tide and wave processes can also propagate into estuarine waterways. The peak flood levels within

Mardie Minerals Ltd Mardie Project: Marine Environmental Quality Monitoring & Management Plan
18WAU-0002 / R190108
19
the waterways will be influenced by the combination of fluvial and ocean, and coastal based processes,
the interaction of which is highly dependent on the timing of peak of each process and the specific
bathymetry and topography of the catchment and the inlet.
Geomorphology
The geomorphology of the site is characterised by tidal creeks which have generally evolved in
response to the ongoing tidal current forcing. Rainfall in this environment is highly intermittent and it is
likely that rainfall runoff occurs as sheet flow over the local drainage catchments that have relatively
small catchment areas towards the tidal creek drainage network. Sediment is delivered periodically to
the coast through networks of rivers and streams. Extreme water levels and waves and associated
rainfall and runoff under cyclonic conditions would be a significant driver of geomorphic changes along
the coast, leading to erosion and enhanced sediment transport processes (Elliot et al 2013).
The primary mechanism for sediment transport in nearshore areas appears to be the tidal flows. The
measured data from inshore shows a marginally stronger flood magnitude compared with the ebb, likely
due to the shallow water and complex bathymetry which funnels water in on the flood tide between the
reefs and islands. Based on measured data from inshore, the depth averaged velocity in spring tides is
in the range of 0.3 m/s to 0.5 m/s, whilst on the neaps the current speed is 0.2 m/s to 0.3 m/s. Whilst
the site is generally protected from swells, the sea waves and swell will contribute to nearshore and
shoreline sediment transport processes
Sediment samples from the nearshore areas around the Proposal site collected by O2 Marine in 2018
and 2019 confirm the seabed composition is made up of predominantly sand fractions with varying
degrees of fines. The samples collected from the seabed through the region of the proposed berth
pocket and entrance channel showed fine fractions (silt and clay) of 20 % to 30 %. Further offshore
(approximately 5 km) the sediment sampling indicated the fine fractions reduced to less than 5 % of the
sample with the composition of the seabed sediment dominated by sand fractions.
Tide and Water Levels
The Mardie Proposal location experiences a dominant semi-diurnal tide (two highs and two lows a day)
and the tidal planes have been defined by the National Tide Centre (NTC) based on field measurements
completed for the Proposal in late 2018 (O2 Marine 2019c). The Mardi Gauge (MardiLAT18) datum
definition completed by the NTC shows that the offset between LAT and Mean Sea Level (MSL) is 2.75
m and the total tidal range is 5.185 m with tidal planes shown in Table 2-1. The mean tide range is
3.6 m in springs and 1 m in neaps.
It is noted that the calculated tidal planes for Mardie are larger than for the nearest stations at Steamboat
Island, Barrow Island Tanker Mooring and North Sandy Island likely as a result of the closer inshore
location (O2 Marine 2019c).

Mardie Minerals Ltd Mardie Project: Marine Environmental Quality Monitoring & Management Plan
18WAU-0002 / R190108
20
Table 2-1 Mardie Tidal Planes (location 21.03572 S, 115.92766 E, National Tide Centre)
Tidal Planes Elevation (m LAT)
HAT 5.185
MHWS 4.557
MHWN 3.226
MSL 2.75
MLWN 2.275
MLWS 0.943
ISLW 0.528
LAT 0
Measured data from an inshore Aquadopp in November 2018 is shown in Figure 2-5 illustrating the
water level time series through the spring and neap cycles. It is noted that the instrument could not
measure tide levels below -2 m MSL.
Figure 2-5 Measured water level data from inshore Aquadopp location November 2018
Modelling of coastal inundation completed by RPS for the Proposal in 2018 described the following key
processes over the typical spring-neap cycle for the tides propagating across the tidal flat areas:
Water floods onto the land within the Proposal area when tidal levels offshore are approaching high
tide at tide levels of 1.2 m MSL or higher.
Flooding onto the land occurs via multiple pathways:
1. Water floods onto the coastal margin through the mangrove zone and lower sections of the
coast and floods onto the land surrounding the creeks.
2. Water floods out of the creeks from multiple low points that occur along the full length of the
creeks and floods out onto the surrounding land via erosion channels.
3. Water floods from the terminal ends of the creeks and flows directly to the claypans beyond.
Water delivered from multiple pathways by high spring tides tends to merge over the land surrounding
the creeks and then flood out to form a shallow lake over the clay pan area. The water floods out over
the clay pan as a surge. The extent of the flooded area varies with the tidal level offshore, which
generates the head of water to force the surge, and the time required for water to flood out over the
surrounding land.
Mardie Minerals Ltd Mardie Project: Marine Environmental Quality Monitoring & Management Plan
18WAU-0002 / R190108
21
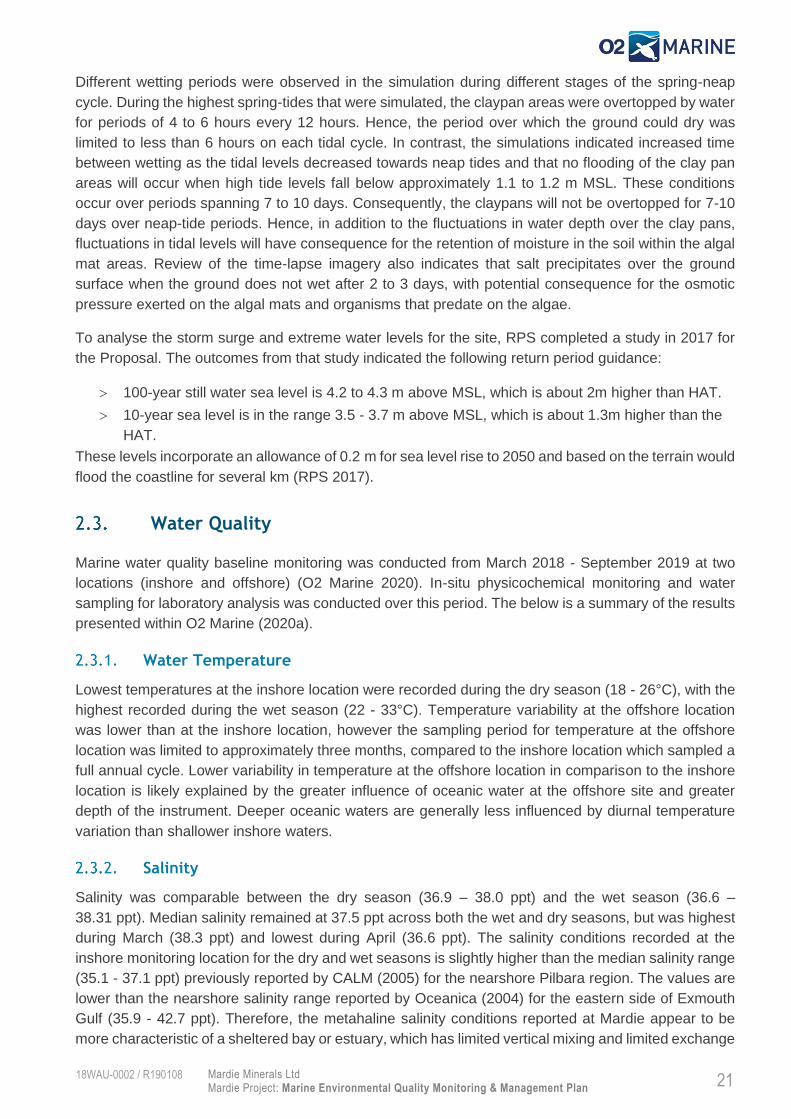
Different wetting periods were observed in the simulation during different stages of the spring-neap
cycle. During the highest spring-tides that were simulated, the claypan areas were overtopped by water
for periods of 4 to 6 hours every 12 hours. Hence, the period over which the ground could dry was
limited to less than 6 hours on each tidal cycle. In contrast, the simulations indicated increased time
between wetting as the tidal levels decreased towards neap tides and that no flooding of the clay pan
areas will occur when high tide levels fall below approximately 1.1 to 1.2 m MSL. These conditions
occur over periods spanning 7 to 10 days. Consequently, the claypans will not be overtopped for 7-10
days over neap-tide periods. Hence, in addition to the fluctuations in water depth over the clay pans,
fluctuations in tidal levels will have consequence for the retention of moisture in the soil within the algal
mat areas. Review of the time-lapse imagery also indicates that salt precipitates over the ground
surface when the ground does not wet after 2 to 3 days, with potential consequence for the osmotic
pressure exerted on the algal mats and organisms that predate on the algae.
To analyse the storm surge and extreme water levels for the site, RPS completed a study in 2017 for
the Proposal. The outcomes from that study indicated the following return period guidance:
100-year still water sea level is 4.2 to 4.3 m above MSL, which is about 2m higher than HAT.
10-year sea level is in the range 3.5 - 3.7 m above MSL, which is about 1.3m higher than the
HAT.
These levels incorporate an allowance of 0.2 m for sea level rise to 2050 and based on the terrain would
flood the coastline for several km (RPS 2017).
Water Quality
Marine water quality baseline monitoring was conducted from March 2018 - September 2019 at two
locations (inshore and offshore) (O2 Marine 2020). In-situ physicochemical monitoring and water
sampling for laboratory analysis was conducted over this period. The below is a summary of the results
presented within O2 Marine (2020a).
Water Temperature
Lowest temperatures at the inshore location were recorded during the dry season (18 - 26°C), with the
highest recorded during the wet season (22 - 33°C). Temperature variability at the offshore location
was lower than at the inshore location, however the sampling period for temperature at the offshore
location was limited to approximately three months, compared to the inshore location which sampled a
full annual cycle. Lower variability in temperature at the offshore location in comparison to the inshore
location is likely explained by the greater influence of oceanic water at the offshore site and greater
depth of the instrument. Deeper oceanic waters are generally less influenced by diurnal temperature
variation than shallower inshore waters.
Salinity
Salinity was comparable between the dry season (36.9 – 38.0 ppt) and the wet season (36.6 –
38.31 ppt). Median salinity remained at 37.5 ppt across both the wet and dry seasons, but was highest
during March (38.3 ppt) and lowest during April (36.6 ppt). The salinity conditions recorded at the
inshore monitoring location for the dry and wet seasons is slightly higher than the median salinity range
(35.1 - 37.1 ppt) previously reported by CALM (2005) for the nearshore Pilbara region. The values are
lower than the nearshore salinity range reported by Oceanica (2004) for the eastern side of Exmouth
Gulf (35.9 - 42.7 ppt). Therefore, the metahaline salinity conditions reported at Mardie appear to be
more characteristic of a sheltered bay or estuary, which has limited vertical mixing and limited exchange

Mardie Minerals Ltd Mardie Project: Marine Environmental Quality Monitoring & Management Plan
18WAU-0002 / R190108
22
with lower salinity oceanic currents. Hydrodynamic modelling undertaken by Baird (2020b) found that
due to the alignment of the island and reef features of the Passage Islands, the majority of incoming
tidal flow on the flood tide is directed through the gap between Scholl Island and Mardie Island,
approximately 10 km to the north of the inshore monitoring location. Seawater exchange from the open
ocean to the inshore region in the vicinity of the Proposal export facilities is therefore influenced by this
constraint of flows around the Passage Islands, which is likely to affect the rate of mixing with the open
ocean (Baird, 2020b). It is therefore possible that restricted mixing with lower salinity oceanic currents,
combined with high evaporation rates and very little freshwater runoff to the nearshore waters has
contributed to creation of a higher salinity environment in the vicinity of the inshore monitoring location
(O2 Marine, 2020).
Light
Light data was collected between 19 December 2018 and 3 August 2019 at an offshore and inshore
location. Variable levels of underwater light were recorded reaching the substrate throughout the
sampling period. Data recorded for Daily Light Integral (DLI) typically identified highest DLI recordings
during neap tides and lowest during spring tides when compared with the results from the pressure /
depth data. Light levels are significantly affected by water depth due to absorption, refraction and
diffraction through the water column (Jones et al., 2019). Despite the greater depth of the offshore site
(11 m) than the inshore site (6 m), higher light levels were recorded on the seabed offshore for most of
the monitoring period. This is supported by general field observations of higher water clarity offshore
than inshore.
The offshore DLI recorded ranges between 0 – 16.5 (mol/m2)/day, with the maximum recorded on 16
January 2019 and the minimums recorded on 28 January, 21 March, 11 April, 17 May, 3 June and 28
July 2019. The maximum DLI for the inshore sites was recorded on 9 July 2019 and the timing of several
of the extended light minimum events corresponded with those listed for the offshore site. One period
of low light coincided with Tropical Cyclone Veronica approaching the coast on 21 March and the other
coincided with the low pressure system on the 3 June 2019. Light levels are influenced by the amount
of suspended sediment / turbidity present through the water column, as well as the depth of the water
column. The lowest light levels at the end of January corresponded with turbidity maximums. It is noted
that, thus far, light data for Mardie is only available for the wet season, which also corresponds with
strong seasonal onshore winds, both of which may have contributed to lower levels of light through
increased suspended sediment concentrations (SSC).
Turbidity / Suspended Sediment Concentration
Turbidity data was recorded between 7 November 2018 and 9 September 2019. A notable difference
in turbidity was observed between the inshore and offshore monitoring locations. In general turbidity
was found to be much higher at the inshore location [mean of 14.03 Nephelometric Turbidity Units
(NTU)] than at the offshore location (mean of 1.45 NTU), which is consistent with regional surveys
which also found turbidity and SSC declined with distance from shore (O2 Marine, 2020f). At the inshore
location the 14-day rolling mean of natural baseline NTU and SSC frequently exceeded the Jones et
al. (2019) thresholds for possible and probable effects on corals. Conversely, the 14-day rolling mean
for NTU and SSC at the offshore location did not exceed either of the Jones et al. (2019) coral
thresholds. Therefore, whilst these thresholds may be appropriate criteria for dredge monitoring in the
offshore areas, they are unlikely to be suitable for dredge monitoring in the inshore areas.

Mardie Minerals Ltd Mardie Project: Marine Environmental Quality Monitoring & Management Plan
18WAU-0002 / R190108
23
Laboratory Results
All results were below the Australian and New Zealand Guidelines for Fresh and Marine Water Quality
(ANZG, 2018) 99% species protection guidelines for all analytes with stated guideline values. These
results indicate that the current allocation of maximum and high LEPs are appropriate for Mardie marine
waters.
Sediment Quality
O2 Marine (2019a) undertook a Sediment Quality Investigation to determine the characteristics and
quality of the material to be dredged and disposed of onshore. The assessment included both
preliminary and detailed site investigations in accordance with DWER (2014) guidelines for the
Assessment and Management of Contaminated Sites.
Preliminary Site Investigation
The preliminary site investigation reviewed historical sediment investigations (i.e. DEC, 2006) and
sources of contaminants and identified that there are no known contaminants of potential concern within
the proposed dredging area. Therefore, all areas were classified as being “uncontaminated”. Outcomes
of the preliminary site investigation provided a basis for determining the scope of the detailed site
investigation, including defining the contaminants of potential concern (CoPC) and identifying the
number, depth and location of required sampling (O2 Marine, 2019a).
Detailed Site Investigation
A detailed site investigation was undertaken by O2 Marine in December 2018, January 2019 and
February 2019 (O2 Marine, 2019a). Collected sediment samples were sent to a NATA-accredited
laboratory for testing of:
Physical Sediment Characteristics: particle size analysis (PSA), total organic carbon (TOC),
moisture content;
Inorganic Compounds: Total metals and metalloids (Al, Ag, As, Cd, Co, Cr, Cu, Fe, Hg, Mn,
Ni, Sb, V and Zn);
Organic Compounds: Total petroleum hydrocarbons (TPH), benzene, toluene, ethylbenzene,
xylenes and Naphthalene (BTEXN), polycyclic aromatic hydrocarbons (PAH) and tributyltin
(TBT);
Phenoxyacetic acid herbicides;
Organochlorine (OCP) and organophosphate pesticides (OPP);
Nutrients (total nitrogen, total kjeldahl nitrogen, ammonia, nitrate and nitrite, total phosphorous
and filterable reactive phosphorous); and
Acid sulfate soils (ASS) screening test.
Samples from seven locations were also analysed to provide an assessment of the benthic infauna
communities present in the sampling area. The following key findings were noted:
There was no significant difference in species richness or diversity indices across all the sites;
All sites had high evenness suggesting that the abundances are distributed evenly among the
different morphological species present Composition of taxa varied at each site. However,
there was no significant difference in community composition between sites;

Mardie Minerals Ltd Mardie Project: Marine Environmental Quality Monitoring & Management Plan
18WAU-0002 / R190108
24
Surface feeding was the most common source of food for all sites and omnivores dominated
across all sites; and
Quinqueloculina spp. was present in high numbers across most sites. Previous studies
suggest that the presence of this particular genus of Foraminifera in relatively high abundance
may be an indication of low environmental stress and that this genus may be considered a
good bioindicator of marine environmental quality.
The following key findings were made during the detailed site investigation (O2 Marine, 2019a):
The 95% Upper confidence limit (UCL) of metal concentrations were below the ANZECC
DGV-low level screening guidelines for all contaminants of concern with exception of Nickel
and Arsenic. However, these were deemed to be lithographically occurring exceedances
supported by previous marine sediment sampling in the Pilbara (DEC, 2006) and
normalisation to Aluminium;
Organics including organotins (TBT etc.), Total Recoverable Hydrocarbons (TRH), TPH, and
BTEXN contaminant concentrations were all below ANZECC DGVs (if available) and the vast
majority of organic analytes were non-detections below the laboratory Limit of Reporting;
All analytes in OC/OP Pesticides and Phenoxyacetic Acid Herbicides suites were at
nondetection levels below the Limits of Reporting. Herbicides were identified early as a CoPC
due to their extensive use on Mardie Station. This investigation found no evidence of
herbicides in the marine sediments sampled; and
None of the samples failed the ASS screening test and, as such, the sediments within the
dredging area are considered to pose a low ASS / PASS risk.
O2 Marine (2019a) concluded that the sediment within the dredge corridor is uncontaminated and is
considered suitable for onshore disposal. Additionally, the background sediment quality in the vicinity
of the proposed outfall is also uncontaminated and is similar to other unimpacted areas of the Pilbara,
WA.
Benthic Communities and Habitat
O2 Marine undertook extensive Benthic Communities and Habitat (BCH) surveys within both the
intertidal and subtidal environments. The assessment was undertaken across the study area by dividing
the region into seven discreet Local Assessment Units (LAUs). These detailed assessments are
presented in the following technical reports:
O2 Marine (2020b) Mardie Project – Intertidal Benthic Communities and Habitat. Report
prepared for Mardie Minerals Ltd; and
O2 Marine (2020c) Mardie Project – Subtidal Benthic Communities and Habitat. Report
prepared for Mardie Minerals Ltd.
The following sections summarise the data presented in detail within these two reports.
Intertidal Benthic Communities and Habitat
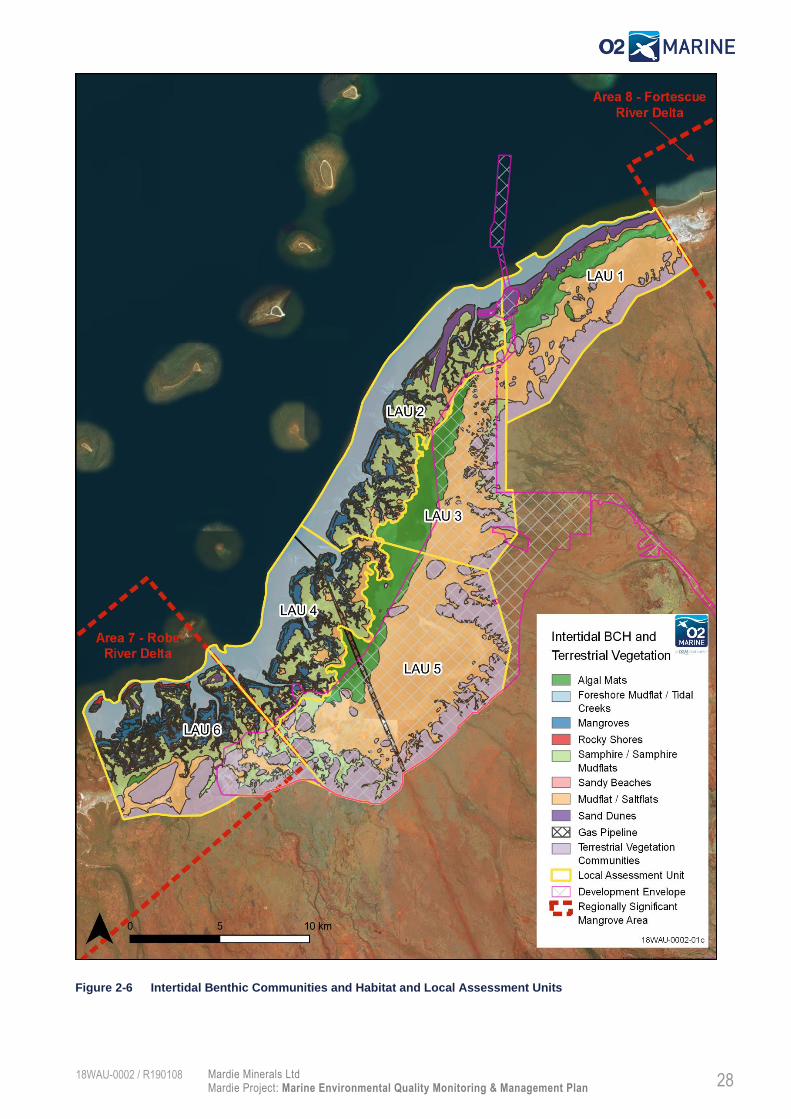
The study area is predominantly comprised of barren Mudflats/Saltflats, Samphires/Samphire Mudflats
and Foreshore Mudflats/Tidal Creeks, comprising ~73% of mapped intertidal BCH and ~58% of the
total mapped area (i.e. including terrestrial habitats such as Sand Dune & Spinifex Sandplain islands
occurring between intertidal BCH within the study area). This is consistent with the URS (2010) who

Mardie Minerals Ltd Mardie Project: Marine Environmental Quality Monitoring & Management Plan
18WAU-0002 / R190108
25
identified similar community types comprising over 60% of the mapped study area nearby the Ashburton
Delta between Secret Creek and Four Mile Creek South of Onslow. Rocky Shore and Sandy Beach
communities were found to occupy the lowest land area, encompassing ~0.2% of the BCH area.
Terrestrial habitats occurring within the study area represent ~21% of the total mapped area, which is
similar to habitat mapping undertaken by URS (2010) along the Ashburton Delta Coast.
Broadscale regional characteristics within the study area identifies decreasing trends in the percentage
abundance of Algal Mats and Mudflat/Saltflats from North to South (LAU1 to LAU6), whilst the opposite
is true for Mangroves and Samphires/Samphire Mudflats. This transition of BCH composition represents
a change across the study area from the ‘Regionally Significant’ mangrove area of the Robe River delta
in the south (LAU6), through the broad intertidal zones dominated by Samphire/Samphire Mudflats,
Mudflats/Saltflats and Algal Mats (LAUs 2, 3, 4 and 5) whereby terrestrial dunal vegetations become
present in LAU1. The distribution of these habitats reflect the frequency of tidal creeks which become
increasingly sparse within the North of the study area with Sandy Beaches and a coastal sand dune
system forming a larger proportion through LAU2 into LAU1.
Regional characteristics from the seaward to landward zones of the intertidal area are typified by
Foreshore Mudflats/Tidal Creeks extending to the high-water mark whereby Mangrove communities
have established as the dominant intertidal BCH type. Mangroves occur in bands of varying width along
the coastline and banks of Tidal Creeks, with more structurally complex, taller and denser CC
communities occurring on the seaward extent and making way for the sparser, lower and less
structurally complex SC communities on the landward extent. CC communities are particularly dominant
within the southern coastal LAUs where they occur over a wider range of habitats and form larger
forests extending out over tidal flats. Samphire communities occur on the landward extent of mangrove
communities, typically Am3, where they often form overlapping boundaries (these shared habitats are
classified to the dominant BCH type and mapped as Mangroves). Samphires typically form extensive
communities, characterised by highly variable densities, between mangrove fringed creeks and
seaward from where Algal Mats and bare Mudflats/Saltflats dominate. The exception is the zonation
observed in LAU6 where samphires occur immediately seaward of mapped terrestrial flora
communities, intermixed with some bare Mudflat/Saltflats. Algal Mats typically occur landward of
Samphire/Samphire Mudflats throughout the central region, and behind Sand Dune communities in
LAU1. Mudflats/Saltflats dominate in LAU5 in the south-east through LAUs and into LAU1 in the north,
with a comparatively small pocket occurring in LAU6.
Intertidal BCH distributions are presented within Figure 2-6.
Algal Mats
Algal mats are typically green to grey or black, and either contiguous or fragmented. 11 species were
identified with filamentous cyanobacteria Microcoleus sp. and Lyngbya sp. the dominant species.
Algal mat communities extend over 3,400 ha and comprise 10% of the total mapped intertidal BCH
area. They predominantly occur in two major communities within the central and northern sections of
the Study Area. They occur within a relatively nominal elevation of 1.1 – 1.3 m AHD which is lower than
the adjacent seaward BCH where they form vast shallow lakes at high tides (>1.2m).
Foreshore Mudflat/Tidal Creeks
A variety of benthic habitat types from flat fine to coarse sands, flat mud, sparse to high macroalgae,
and low to moderate seagrasses were identified occurring within Foreshore Mudflats/Tidal Creeks.

Mardie Minerals Ltd Mardie Project: Marine Environmental Quality Monitoring & Management Plan
18WAU-0002 / R190108
26
Foreshore Mudflats/Tidal Creeks occur over 5,000 ha and comprise 14% of the total mapped intertidal
BCH area. Tidal creeks are typically well established within the southern LAUs (Robe River Delta) and
become sparser in the northern LAUs. Foreshore mudflats extend over a wider area through the central
LAUs with subtidal area much closer to the coastline in the northern and southern LAUs.
Mangroves
Closed Canopy Mangroves
Closed Canopy (CC) mangroves comprise the greater structural complexity, typically higher seaward
mangrove associations. Avicennia marina dominate the species with Rhizophora stylosa the sub
dominant species.
CC mangrove communities extend over 1,280 ha and comprise 4% of the total mapped intertidal BCH
area. They are very well established within LAU 6, with over 46% of their total area represented. CC
mangroves occur as ribbons along the coastline and fringing tidal creeks, with more vast forest
occurring within the southern LAU, particularly LAU 6 within the boundary of the Robe River Delta
Scattered Canopy Mangroves
Scattered Canopy (SC) mangroves comprise the least structural complexity, typically lower landward
mangrove associations. Avicennia marina dominate the species with Ceriops australis also observed.
SC mangrove communities occur over 2,300 ha and comprise 7% of the total mapped BCH area. SC
mangroves are the most extensive mangrove functional groups representing over 64%. They are
typically located on the landward extents extending over wide intertidal mudflat areas with the largest
areas occurring in LAU 2, LAU 4 and LAU 6.
Rocky Shorelines and Sandy Beaches
Rocky shorelines within the Study Area were typically low relief rock platforms generally with little to
low associated flora and fauna. Macroalgae were identified as the dominant communities with minimal
juvenile hard corals, oyster stacks and some soft corals also present.
Rocky shorelines occur over 59 ha comprising <1% of the total mapped BCH area. They are only
located within LAU 2 and LAU 6.
Sandy beaches are typically flat, low energy, low profile beaches backed by gently rising dunes. Sandy
beaches are only located within LAU1 and LAU 2 representing 32 ha in total and comprising <1% of
mapped BCH. They are found extending from the northern extent of LAU 1 into the northern LAU 2 they
continue along the coast for approximately 2.5 km west of the northernmost creek mouth.
Samphire/Samphire Mudflat
Samphire/Samphire Mudflats are distributed over more than 5,900 ha, comprising approximately 17%
of the mapped intertidal BCH. They are typically located on the landward extent of mangroves, whilst
through the centre of the Study Area are on the seaward extent of algal mats, with a smaller
communities in LAU 1 and LAU 3 seaward of terrestrial vegetation. By area they are the greatest in
LAU 2 and lowest in LAU 1.

Mardie Minerals Ltd Mardie Project: Marine Environmental Quality Monitoring & Management Plan
18WAU-0002 / R190108
27
Mudflats/Saltflats
Mudflat/Saltflats are extremely low in biodiversity and support little to no associated fauna or flora due
to their characteristic high salinities. Mudflat/Saltflats are the dominant intertidal BCH extending over
10,500 ha and comprising 29% of the total mapped BCH area. They are most dominant through the
supratidal LAUs (3 & 5) representing over 83% of their total distribution. They typically occur on the
higher intertidal gradients on the landward extent of Samphire’s or Algal Mats.
Mardie Minerals Ltd Mardie Project: Marine Environmental Quality Monitoring & Management Plan
18WAU-0002 / R190108
28
Figure 2-6 Intertidal Benthic Communities and Habitat and Local Assessment Units

Mardie Minerals Ltd Mardie Project: Marine Environmental Quality Monitoring & Management Plan
18WAU-0002 / R190108
29
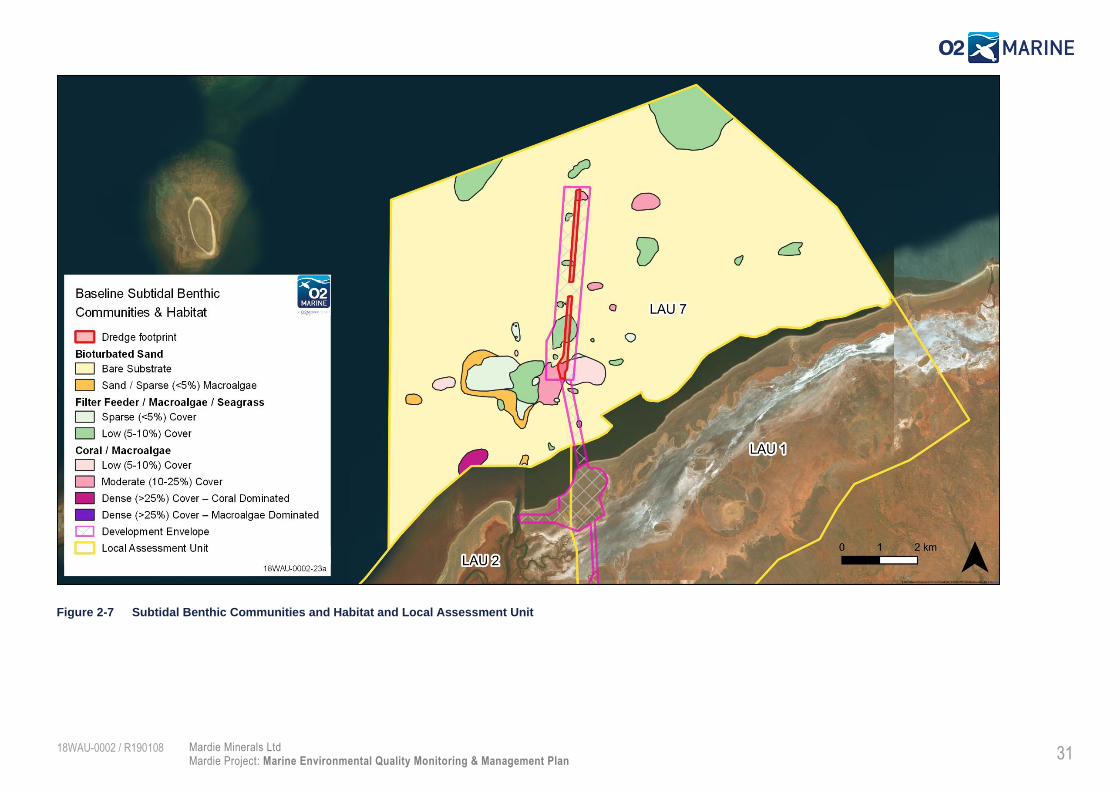
Subtidal Benthic Communities and Habitat
Subtidal BCH surveys identified three broad habitat classes present within LAU 7 (the only subtidal
BCH LAU) including Bare sand, filter feeder/macroalgae/seagrasses and coral/macroalgae with eight
BCH subclasses distinguished based on varying levels of benthic cover and dominant taxa.
LAU 7 is a shallow, naturally turbid environment that is characterised by bare sand / silt with patchy
distribution of predominantly macroalgal (Phaeophyceae: Sporochnus, Hormophysa, Sargassum &
Dictyota; Rhodophyceae: Asparagopsis; Chlorophyceae: Caulerpa, Halimeda) and filter feeder
communities (e.g. sponges, octocorals, hydroids, ascidians). These inshore sand, macroalgal and filter
feeder habitats are known to be widespread throughout turbid nearshore environments of the Pilbara
region and, as such, are not considered to be of any regional significance (O2 Marine, 2020c).
Halophila seagrass species are also present in LAU 7, however, targeted multi-season surveys failed
to identify any locations within LAU 7 that recorded benthic cover of seagrass that was more than 1%.
It is well documented that seagrass habitats in the Pilbara vary greatly between seasons and years.
However, unrelated surveys by O2 Marine at nearby Cape Preston (50 km north of Mardie) in March
2018 identified extensive Halophila sp. seagrass meadows, indicating that seasonal local conditions
were appropriate to support meadow formation at Mardie at the time of surveys undertaken. Therefore,
it is unlikely that LAU 7 constitutes ideal habitat to support the quality of the regionally significant
seagrass meadows that are regularly observed at Cape Preston to the north and Coolgra Point to the
South.
Coral species are also present in low to moderate densities within LAU 7. However, the majority of
corals in the vicinity of LAU 7 are confined to biogenic reefs and rocks fringing the nearby islands. The
diversity and abundance of corals in LAU 7 was relatively low and confined to sediment tolerant species
(e.g. Faviidae, Dendrophyllidae, Mussidae and Poritidae). However, a marked increase in diversity and
abundance of coral species was observed at the fringing reefs surrounding the nearby islands,
indicating that these areas represent the most regionally significant coral habitats. Although LAU 7
supports complex BCH, including coral and seagrass species, extensive surveys did not identify any
subtidal BCH areas that are considered to be locally or regionally significant coral habitats.
Although LAU 7 supports complex BCH, including coral and seagrass species, extensive surveys did
not identify any subtidal BCH areas that are considered to be locally or regionally significant.
Subtidal BCH distributions are presented within Figure 2-7.
Filter Feeder/Sparse Macroalgae/Seagrass
Sand/Sparse (<5%) Filter Feeders
Sparse filter feeder habitat occurs where the relief is flat and is associated with fine to coarse sands.
Although only present in sparse densities (<5% cover), hydroids are most common where there is no
bedform, whilst sponges occur where there is some bioturbation.
This habitat comprises 2% of the subtidal BCH within LAU 7 and is widely dispersed throughout the
region.
Low (5-10%) Cover Macroalgae/Filter Feeders
Flat to low relief constituting either fine to coarse sands, including shell grit on occasions. Macroalgae,
hydrozoan and sponge species are equally dispersed throughout this habitat although benthic cover is

Mardie Minerals Ltd Mardie Project: Marine Environmental Quality Monitoring & Management Plan
18WAU-0002 / R190108
30
low (3-10%). Occasional very sparse (<1%) cover of Halophila sp. seagrass was also observed at some
locations.
This habitat comprises 6% of the subtidal BCH within LAU 7 and follows a patchy distribution throughout
the region.
Outside of LAU 7, this habitat was also observed in small patches fringing the shallow waters of Long
Island, Mardie Island and close to the mainland.
Coral/Macroalgae
Low (5-10%) Coral Cover
Flat to low relief rock and rubble with coarse sand. Low (3 - 10%) cover of soft and hard corals, including
Faviidae, Dendrophyllidae, Mussidae and Octocorals. Sparse macroalgae was also present.
This habitat comprises 1% of the subtidal BCH within LAU 5. Outside of LAU 7 this habitat was also
found fringing Mardie Island and in small isolated patches between Angle Island and the mainland. It
was generally recorded in waters between 1-3 m depth.
Moderate (10-25%) Cover Coral/Macroalgae
Low to moderate relief rock and rubble/coarse sand. Low to moderate cover (3 – 25%) of soft and hard
corals with macroalgae. Corals largely consisted of Faviidae, Poritidae, and Octocorals, while
Phaeophyceae dominated the macroalgae communities.
This habitat class comprises only 1% of the subtidal BCH within LAU 7. However, outside of LAU 7, it
was recorded in larger areas in fringing shallow waters south of Mardie Island and adjacent to the
mainland coast.
Dense (>25%) Cover (Macroalgae Dominated)
This habitat class occurs on low relief substrate with fine to coarse sands and areas of exposed
limestone reef. Dense assemblages (>75%) of macroalgae and hydrozoan species predominately in
waters at depths of 2.2m-4.0m. This habitat also supported sparse juvenile corals (Faviidae,
Dendrophyllidae, Mussidae) with occasional larger coral (Poritidae) bommies (1-2m diameter).
This habitat class comprised <1% of the subtidal BCH in LAU7. It was also identified outside of LAU7
in the waters fringing the eastern outer edge of Long Island, Round Island and Sholl Island.
Dense (>25%) Cover (Coral Dominated)
Low relief limestone reef and rubble substrate which supports high coral cover (25%-75%) of diverse
coral species, including Faviidae, Dendrophyllidae, Mussidae, Portitidae, and Octocoral species.
This habitat class was only recorded at one location in LAU7 and, as such, comprises only <1% of the
subtidal BCH within LAU7. However, it was also recorded outside of LAU7, in a much larger area,
fringing the Northern edge of Mardie Island.
Mardie Minerals Ltd Mardie Project: Marine Environmental Quality Monitoring & Management Plan
18WAU-0002 / R190108
31
Figure 2-7 Subtidal Benthic Communities and Habitat and Local Assessment Unit

Mardie Minerals Ltd Mardie Project: Marine Environmental Quality Monitoring & Management Plan
18WAU-0002 / R190108
32
Marine Fauna
O2 Marine (2020d) undertook an assessment of the likelihood of occurrence for threatened marine
mammal species identified through the desktop review, based on the list of species provided in the ESD
(Preston, 2018).
Listed threatened marine mammals with high potential to occur or are known to occur off the Mardie
coast (on occasion) include:
Marine Mammals:
o Humpback whale (Megaptera novaeangliae);
o Dugong (Dugong dugong); and
o Australian humpback dolphin (Sousa sahulensis).
Marine Turtles:
o Loggerhead turtle (Caretta caretta);
o Green turtle (Chelonia mydas); and
o Flatback turtle (Eretmochelys imbricate)
Elasmobranch:
o Green sawfish (Pristis zijsron)
Marine Mammals
Humpback Whale
Humpback whales migrate annually from Antarctic feeding grounds to the Kimberley coast for calving
during the winter. Humpback whales predominantly occur offshore in open oceanic environments.
However, they are known to stopover in the lee of the offshore islands and have been observed on
several occasions during the humpback southerly migration, within 5 km of the Mardie Project Marine
Development Envelope, by O2M staff in 2018. The southern migration is the period when they are
closest to shore at an average of 36 km although are often recorded in waters less than 10 m deep
during the latter part of the migration (September to November). The Project area is a shallow
embayment (i.e. generally <5m deep) and could not be considered critical habitat for any whale species.
Dugong
Dugong (Dugong dugong) are found throughout the Pilbara region, particularly close to the coast or in
the lee of reef-fringed islands and often in areas where seagrass has previously been recorded.
Although Dugong have been previously recorded in the nearshore waters of the Mardie coastline, the
nearest known Dugong aggregations have been recorded near Cape Preston in the North and Coolgra
Point in the South, generally in areas that consistently support extensive seagrass meadows (O2
Marine, 2020d).
No Dugong were observed in the waters around Mardie during over 700 hours of vessel-based
observations. O2 Marine (2020d) concluded that this was most likely due to the lower value of the
subtidal BCH in the area as suitable feeding or foraging habitat for Dugong.
Australian Humpback Dolphin
The Australian humpback dolphin was the only conservation significant species known to occur in the
Project area, with records of Australian humpback dolphins (Sousa sahulensis) reported throughout the

Mardie Minerals Ltd Mardie Project: Marine Environmental Quality Monitoring & Management Plan
18WAU-0002 / R190108
33
year at the Montebello Islands (Raudino et al 2018) and in the Mardie Project area. They are likely to
be one of the most common dolphin species occurring in the Project area. This species together with
the Indo-Pacific Bottlenose Dolphin (Tursiops aduncus) are likely to be the most abundant dolphin
species in the Mardie Project area inside the 20 m isobath.
Marine Turtles
Only a small part of potential marine turtle nesting beach lies within the development envelopes, a
narrow section of the beach labelled as ‘Mardie Creek East’ in Figure 92. The Pendoley (2019) survey
identified only very minor nesting effort by Flatback turtles and a single hawksbill turtle, along the 15
km stretch of coastline to the east of the creek. These results indicated that the mainland beaches are
not currently a regionally important rookery. The results of the temperature loggers also confirmed that
mainland beaches were significantly warmer than the offshore islands, impacting the success rate of
any marine turtle nests on these beaches.
With the exception of the single hawksbill nest recorded on the mainland in December, turtles nested
most successfully on the offshore islands; 34 – 42 % of Flatback and 36 – 50 % of hawksbill nesting
attempts on the islands resulted in a nest. None of the three Flatback nesting attempts on the mainland
resulted in a nest. This variation in nesting success may be related to the varying nesting habitat
characteristics between the island and mainland monitoring sites. For example, the island sites featured
a wide supratidal zone, a well-defined primary dune, and fine-medium grained sand size that may have
facilitated the successful deposition of a clutch, whereas the mainland sites featured a narrow supratidal
zone, little or no primary dune development, and medium-coarse grained sand size that may have
hindered successful clutch deposition.
The main species recorded on the offshore islands was Flatback turtles, with relatively less nesting
effort seen for hawksbill and green turtles at the same locations. The snapshot monitoring data from
Round, Middle, and Angle Islands confirmed similar species composition and abundance at these sites.
These results are consistent with turtle activity throughout the Pilbara where Flatback and Hawksbill
nesting is dominant on nearshore island habitat, and Flatback turtles are the most common mainland
nesting species (Pendoley et al., 2016).
Baseline artificial light results found the overhead skies at the Proposal are typically very dark and
representative of pristine, natural dark skies unaffected by artificial light. The only light source visible
from all mainland and offshore light monitoring sites was the Sino Iron facilities located over 30 km
away on the easterly horizon.
Elasmobranchs
Sawfish
The Northwest Marine Region is considered a particularly important area for sawfish species because
the region and adjacent inshore coastal waters and riverine environments contain nationally and
globally significant populations of sawfish species (DSEWPaC 2012). However, relatively little is known
about the distribution and abundance of sawfish species in north-western Australia (Morgan 2012).
In the Pilbara, green sawfish are known to utilise the mouths of major river systems (i.e. Ashburton
River) as pupping grounds and nursery areas, before juveniles migrate into adjacent creeks at
approximately 3 to 6 months old, and then further offshore to mature at a length of about 3 m (Morgan
2012). Acoustic tracking of green sawfish from the Ashburton shows that the species does not travel
more than 700m upstream from the mouth of the river. In the Western Pilbara they are assumed to be

Mardie Minerals Ltd Mardie Project: Marine Environmental Quality Monitoring & Management Plan
18WAU-0002 / R190108
34
present in all tidal creeks. In the Project area larger systems are represented by the Robe River and
Fortescue River. Green sawfish are currently known from Exmouth Gulf, Whim Creek, Beagle Bay,
Pender Bay, King Sound in Western Australia. Tidal mangrove systems, river estuaries, and rivers of
the King Sound provide ideal nursery habitat for juveniles <0.5m (Whitty et al, 2011 and Whitty, 2017,
Elhassan 2018). Studies also indicate movement of the species away from turbid areas and low-salinity
areas i.e. when rainfall flushes estuaries etc. mangrove and inshore areas used as nurseries where
they spend their first few years of life and then move to deeper waters (Elhassan 2018).
Green sawfish are expected to be present in the creeks and rivers of the Mardie coastline. The habitats
present within the intake creek are well represented in the region with as many as a dozen smaller size
creeks within 100km.
Mardie Minerals Ltd Mardie Project: Marine Environmental Quality Monitoring & Management Plan
18WAU-0002 / R190108
35
3. Environmental Quality Management
Framework
Background
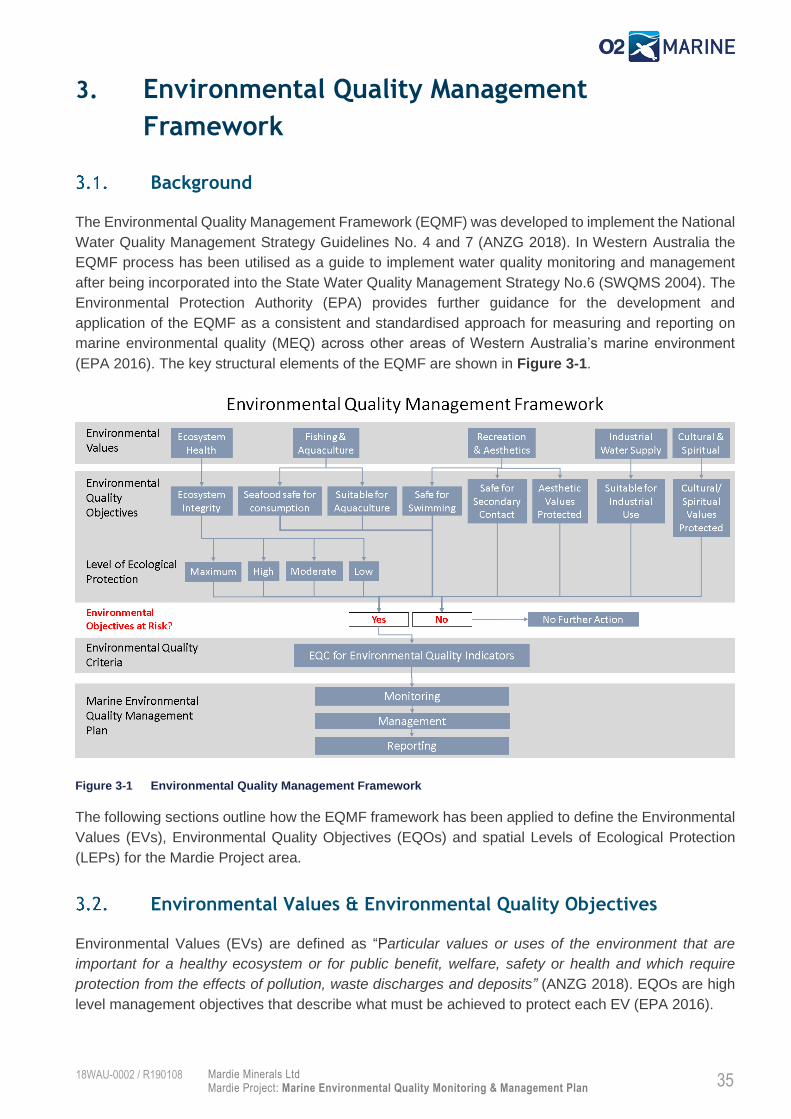
The Environmental Quality Management Framework (EQMF) was developed to implement the National
Water Quality Management Strategy Guidelines No. 4 and 7 (ANZG 2018). In Western Australia the
EQMF process has been utilised as a guide to implement water quality monitoring and management
after being incorporated into the State Water Quality Management Strategy No.6 (SWQMS 2004). The
Environmental Protection Authority (EPA) provides further guidance for the development and
application of the EQMF as a consistent and standardised approach for measuring and reporting on
marine environmental quality (MEQ) across other areas of Western Australia’s marine environment
(EPA 2016). The key structural elements of the EQMF are shown in Figure 3-1.
Figure 3-1 Environmental Quality Management Framework
The following sections outline how the EQMF framework has been applied to define the Environmental
Values (EVs), Environmental Quality Objectives (EQOs) and spatial Levels of Ecological Protection
(LEPs) for the Mardie Project area.
Environmental Values & Environmental Quality Objectives
Environmental Values (EVs) are defined as “Particular values or uses of the environment that are
important for a healthy ecosystem or for public benefit, welfare, safety or health and which require
protection from the effects of pollution, waste discharges and deposits” (ANZG 2018). EQOs are high
level management objectives that describe what must be achieved to protect each EV (EPA 2016).

Mardie Minerals Ltd Mardie Project: Marine Environmental Quality Monitoring & Management Plan
18WAU-0002 / R190108
36
The EVs and associated EQOs for the Pilbara marine environment are already well established in
Pilbara Coastal Waters Consultation Outcome (DoE 2006). Five EVs and eight corresponding EQOs
apply to the Mardie Project area. These EVs and corresponding EQOs are presented in Table 3-1.
Table 3-1 Environmental Values and Environmental Quality Objectives applicable to the Mardie Project area
Environmental Values Environmental Quality Objectives
Ecosystem Health EQO1: Maintenance of ecosystem integrity. EQO1 is split into four sub-objectives, being: Maximum, High, Moderate and Low Levels of Ecological Protection (LEPs) (Refer Section 2.3 below).
Fishing and Aquaculture EQO2: Seafood (caught) is of a quality safe for human consumption.
EQO3: Water quality is suitable for aquaculture purposes.
Recreation & Aesthetics EQO4: Water quality is safe for primary contact recreation (e.g. swimming and diving).
EQO5: Water quality is safe for secondary contact recreation (e.g. fishing and boating).
EQO6: Aesthetic values of the marine environment are protected.
Cultural & Spiritual EQO7: Cultural and spiritual values of the marine environment are protected.
Industrial Water Supply EQO8: Water quality is suitable for industrial supply purposes.
Site-specific features of the EVs identified through various investigations undertaken for the Mardie
Project are summarised in Table 3-2.
Table 3-2 Specific features of EVs identified through Mardie Environmental Investigations
Ecosystem Health Fishing &
Aquaculture
Recreation &
Aesthetics
Cultural &
Spiritual
Industrial Water
Supply
Water quality (O2 Marine
2020a)
Sediment quality (O2
Marine 2019a)
Ecological processes
Benthic Communities and
Habitat (O2 Marine
2020b/2020c):
o Corals
o Macroalgae
o Filter feeders
o Seagrass)
o Mangroves
o Samphires
o Algal mats
Marine Fauna (O2 Marine
2020d):
o Turtles
o Fish
o Shore birds
o Sea birds
o Sea Snakes
o Whales
o Dolphins
o Dugong
Shore-based
fishing
Boat-based
fishing
Crabbing is
popular in the
tidal creeks
Onslow Prawn
Managed
Fishery –
Fortescue
Nursery Area
No
aquaculture
operations
undertaken at
present
Recreational
fishing
Free diving
Scuba diving
4WD Vehicles
/ Quad bikes
Access to the
Project area
Hunting
Mud
crabbing
Fishing
Maceys
Shipwreck
Recognition
of traditional
owner rights
to access &
usage of
country
Proposed
Mardie
Project
seawater
intakes

Mardie Minerals Ltd Mardie Project: Marine Environmental Quality Monitoring & Management Plan
18WAU-0002 / R190108
37
Levels of Ecological Protection
In accordance with EPA (2016), the objective for ‘Ecosystem Health’ is spatially allocated into four
Levels of Ecological Protection (LEPs): Maximum, High, Moderate and Low. Each LEP area is assigned
an acceptable limit of change as shown in Table 3-3. The spatial distribution of the LEPs enables
measurable EQOs to be allocated for areas in accordance with expectations for ecosystem health
condition. For example, important areas for conservation are assigned a Maximum LEP and maintained
within the limits of natural variation, whereas large changes from natural variation may be allowed in
small areas assigned a Low LEP around a bitterns discharge where EVs may not be protected.
Table 3-3 Limits of acceptable change in the key elements of ecosystem integrity for the four levels of ecological
protection (Source: EPA, 2016).
Key elements of ecosystem integrity and their limits of
acceptable change
Level of protection for
maintenance of ecosystem
integrity
Key elements Limits of acceptable change Maximum High Moderate Low
Ecosystem processes
(e.g. primary production, nutrient cycles, food chains)
Ecosystem processes are maintained within the limits of natural variation (no detectable change)
✓ ✓
Small changes in rates, but not types of ecosystem processes
✓
Large changes in rates, but not types of ecosystem processes
✓
Biodiversity
(e.g. variety and types of naturally
occurring marine life)
Biodiversity as measured on both local and regional scales remains at natural levels (no detectable change)
✓ ✓ ✓
Biodiversity measured on a regional scale remains at natural levels although possible change in variety of biota at a local scale
✓
Abundance and biomass of marine
life
(e.g. number or density of individual animals, the total weight of plants)
Abundances and biomasses of marine life vary within natural limits (no detectable change)
✓ ✓
Small changes in abundances and/or biomasses of marine life
✓
Large changes in abundances and/or biomasses of marine life
✓
The quality of water, biota and
sediment
(e.g. types and levels of contaminants such
as heavy metals, dissolved oxygen
content, water clarity)
Levels of contaminants and other measures of quality remain within limits of natural variation (no detectable changes)
✓
Small detectable changes beyond limits of natural variation but no resultant effect on biota
99% Species Protection Limits (SPL) Applies
✓
Moderate changes beyond limits of natural variation but not to exceed specified criteria
90% SPL Applies
✓
Large changes from natural variation
80% SPL Applies
✓

Mardie Minerals Ltd Mardie Project: Marine Environmental Quality Monitoring & Management Plan
18WAU-0002 / R190108
38
LEP boundaries have been previously described for the Mardie Project area in the Pilbara Coastal
Water Quality Consultation Outcomes (DoE 2006). These existing LEP boundaries were reviewed and
updated in the context of the proposed Mardie waste bitterns outfall and Port facility, to spatially define
proposed LEPs around the project infrastructure.
The LEP boundaries were defined and mapped in consideration of the following key elements:
A Low LEP area (LEPA) was designated based on modelled predictions of the bitterns plume
which determined that a 90% SPL would be achieved at the LEPA/MEPA boundary (Baird
2020). Whole of effluent toxicity (WET) testing results presented in O2 Marine (2019b) were
used to inform the number of dilutions required to meet the 90% SPL used by Baird (2020a);
A Moderate LEP area (MEPA) was designated for all waters (excluding the LEPA areas) based
on providing a 250 m buffer surrounding ship turning basin and berthing pocket and modelled
predictions of the bitterns plume which determined that a 99% SPL would be achieved at the
MEPA/HEPA boundary (Baird 2020). WET testing results presented in O2 Marine (2019b) were
used to inform the number of dilutions required to meet the 99% SPL used by Baird (2020a);
Two small HEPAs were designated within adjacent to proposed small vessel launching and
retrieval ramp and the seawater abstraction pipeline in the northern and southern creeks
respectively. These were both based upon a 250 m buffer around proposed infrastructure; and
Existing LEPs as presented in the Pilbara Coastal Water Quality Consultation Outcomes (DoE
2006) were retained for all other areas which includes a High LEP area (HEPA) and a Maximum
LEP area (XEPA). Based on WET testing results presented in O2 Marine (2019b), Baird (2020a)
determined that a 99% SPL would be achieved at the MEPA/HEPA boundary.
The proposed spatial designation of LEPs for the Mardie Proposal area is presented in Figure 3-2.

Mardie Minerals Ltd Mardie Project: Marine Environmental Quality Monitoring & Management Plan
18WAU-0002 / R190108
39
Figure 3-2 Levels of Ecological Protection for the Mardie Proposal
Mardie Minerals Ltd Mardie Project: Marine Environmental Quality Monitoring & Management Plan
18WAU-0002 / R190108
40
4. Environmental Pressures and Key Threats to
Marine Environmental Quality
Relevant Operational Activities
The following three key operational elements of the Mardie Proposal have been identified as posing a
potential risk to MEQ:
Waste bitterns discharge operations;
Port operations; and
Product processing and storage.
The key aspects of these operational elements are discussed below in the context of risks to MEQ.
Waste Bitterns Discharge Operations
The production process will produce a high-salinity bittern (i.e. salinity ~325 ppt) that will be discharged
into the marine environment through a diffuser at the end of the trestle jetty.
Whole of Effluent Toxicity (WET) testing results (O2 Marine 2019b) determined that the following
dilutions of the waste bitterns would need to be achieved in order to meet the required Species
Protection Levels (SPL) for each of the designated LEPs:
90% SPL requires 263 dilutions (LEPA/MEPA Boundary); and
99% SPL requires 417 dilutions (MEPA/HEPA Boundary).
In order to reach the required levels of dilution within each of the zones, the raw bitterns will be
prediluted five-fold with seawater prior to being discharged through the diffuser (Baird 2020).
Prior to commencing full discharge operations, a diffuser commissioning phase will occur to allow initial
validation of the outfall modelling and make final adjustments to the diffuser configuration (e.g. port
spacing, port angle, etc.) and discharge operations (e.g. discharge rate, discharge velocity, pre-dilution
rate, etc.) to ensure that the required number of dilutions are met at the LEP boundaries specified
above. Key elements of the preliminary diffuser design and configuration are provided in Table 4-1.

Mardie Minerals Ltd Mardie Project: Marine Environmental Quality Monitoring & Management Plan
18WAU-0002 / R190108
41
Table 4-1 Preliminary Diffuser Design and Configuration (Source Baird 2020)
Design Parameters Details
Location: Outfall is attached to the trestle jetty and discharges into the dredged berth pocket
Discharge Regime: Constant
Water Depth: 6.45m MSL
No. of Ports: Maximum 8 Ports
Port Spacing: 10.5 m apart
Port Diameter: 0.13 m
Port Angle: 90° to dominant current, 45° up towards surface
Total Diffuser Length 200 m
Discharge Velocity: 2.5 m/s
Discharge Flow Rate: 0.69 m3/s
Discharge Volume: 3.6 GLpa
Raw Bitterns Salinity: 325 ppt
Diluted 1:5 Outfall Effluent Salinity 85.4 ppt
Whole Effluent Toxicity Results 99% SPL requires 417 dilutions – target bitterns concentration 0.24%
90% SPL requires 263 dilutions – target bitterns concentration 0.38%
80% SPL requires 227 dilutions – target bitterns concentration 0.44%
Port Operations
The Proposal includes the export of bulk salt. The salt will be loaded onto a transhipper barge using
typical conveyors and ship-loading infrastructure, then the barge will travel offshore and re-load the salt
onto an ocean-going vessel anchored offshore.
Some product spills may occur during the loading of vessels, however these volumes will be relatively
low and intermittent. A risk area for Port Operations would be maintenance activities along the conveyor
system where product has built up over time and requires removal, resulting in hypersaline runoff water
to the receiving environment.
Vessel bunkering of the transhipper and support vessels is likely to be undertaken alongside the trestle
jetty, within the berth pocket and the proposed LEPA/MEPA zones. Therefore, whilst hydrocarbon spills
to the marine environment are possible in this area, they will be managed in accordance with leading
industry operating procedures and as such represent a relatively low risk.
Vessel movements within the Port area are also likely to continually mobilise and redistribute fine
sediments in the vicinity of the berth pocket.
Storage and Processing Facilities
Concentrator and crystalliser ponds will be developed behind low permeability walls engineered from
local clays and soils and rock armoured to protect against erosion. The height of the walls varies across
the project and is matched to the flood risk for the area.

Mardie Minerals Ltd Mardie Project: Marine Environmental Quality Monitoring & Management Plan
18WAU-0002 / R190108
42
A spill or leak of brine from the ponds or pipelines could result in impacts to MEQ within adjacent tidal
creeks. However, brine is the resource for the Proposal, and as such the evaporation ponds and brine
pipelines have been designed to minimise the risk of leaks, overflows and wall breaches. Pipelines will
utilise industry-standard materials to minimise the chance of leaks, and mitigation will be implemented
to reduce this risk further. Ponds have been designed with adequate freeboard and overflow features
to minimise the risk of unplanned overflows and wall breaches.

Mardie Minerals Ltd Mardie Project: Marine Environmental Quality Monitoring & Management Plan
18WAU-0002 / R190108
43
5. Conceptual Model of Pressures/Threats and
Selection of Environmental Quality Indicators
Conceptual Model for the Mardie Project
In accordance with EPA (2016) a conceptual model has been developed which presents the key threats
and their assciated pressures summarised from the operation desriptions presented above. These are
then contextualised into the presure/reponse pathways through identification of the enviornmental
indicators though which the presures and threats act to reduce MEQ if not appropriately managed.
The conceptual model and subsequent EQIs selected for the Project are presented within Figure 5-1.

Mardie Minerals Ltd Mardie Project: Marine Environmental Quality Monitoring & Management Plan
18WAU-0002 / R190108
44
Figure 5-1 Mardie Project Conceptual Site Model

Mardie Minerals Ltd Mardie Project: Marine Environmental Quality Monitoring & Management Plan
18WAU-0002 / R190108
45
Environmental Quality Criteria
EQIs are measurable parameters selected to monitor changes in each EQO. The EQIs for the Mardie
Project are listed in Table 5-1.
EQCs are generally quantitative and are usually described numerically. They are comprised of
Environmental Quality Guidelines (EQG) and more robust Environmental Quality Standards (EQS) and
allow changes within adopted EQIs to be quantitatively assessed over time.
Environmental Quality Guidelines: EQG are threshold numerical values or narrative
statements which if met, indicate that there is a high degree of certainty that the associated
EQO has been achieved. If the EQG is not met, then there is uncertainty as to whether the
associated EQO has been achieved, and a more detailed assessment against an
‘Environmental Quality Standard’ (EQS) is triggered. This assessment is risk-based and
investigative in nature.
Environmental Quality Standards: EQS are threshold numerical values or narrative
statements that indicate a level beyond which there is a significant risk that the associated
EQO has not been achieved and a management response is triggered. The response would
normally focus on identifying the cause/source of the exceedance and eradicating or reducing
the contaminant of concern.
As identified within the Monitoring and Management Section (Section 6) prior to establishing specific
numerical criteria for the EQGs and EQSs, it is proposed that:
a minimum of two years baseline data will be collected prior to commissioning to determine
site specific EQCs (Section 6.2);
Whole of Effluent Toxicity (WET) testing be undertaken on bitterns at the completion of the
commissioning process to determine the number of dilutions required at each LEP boundary
(Section 6.4.5); and
Laboratory analysis be conducted on the bitterns to determine which toxicants are
concentrated and therefore selected to represent EQSs for bitterns dilution assessment at the
LEP boundaries (Section 6.4.6).
The adopted approach to derive preliminary EQC constituents for the EQIs is presented within Table
5-1 and preliminary EQGs outlined within Figure 5-2.

Mardie Minerals Ltd Mardie Project: Marine Environmental Quality Monitoring & Management Plan
18WAU-0002 / R190108
46
Table 5-1 Environmental Quality Indicators and Criteria selected for the Mardie Project
Environmental
Quality
Indicators
Environmental Quality Criteria
Environmental Quality Guidelines Environmental Quality
Standards
Constituents1 Low LEP Moderate LEP High LEP Maximum LEP
Physicochemical Constituents in
Water
Salinity2
No EQG Apply
95th percentile of natural background salinity
concentration is achieved
80th percentile of natural background salinity
concentration is achieved
No detectable change from
natural background levels for
Physicochemical parameters or toxicants within
water and sediments
No loss or decline within BCH communities outside of acceptable levels of change for MEPA (i.e. 95th percentile of natural background) and no change from natural within HEPA and XEPA)
No loss or decline within animal communities outside of acceptable levels of change for MEPA (i.e. 95th percentile
of natural background) and no (no change from natural within HEPA and
XEPA)
No reports of animal disease or deaths attributable to the Project
Salinity concentrations below the maximum calculated from WET testing
and bitterns sampling for each LEP boundary
Dissolved oxygen2
5th percentile of natural background DO concentration
is achieved
80th percentile of natural background DO
concentration is achieved
pH
5th or 95th percentile of natural background pH conditions are
achieved
20th or 80th percentile of natural background pH conditions are achieved
Temperature 5th or 95th percentile of natural background temperatures are
achieved
20th or 80th percentile of natural background
temperatures are achieved
Dissolved major anions and
cations
Ionic balance
5th or 95th percentile of natural background ionic balance conditions are achieved
20th or 80th percentile of natural background ionic balance conditions are
achieved
Total Alkalinity as CaCO3
Total Hardness as CaCO3
5th or 95th percentile of natural background conditions are
achieved
20th or 80th percentile of natural background
conditions are achieved
Toxicants in Water3
Metals
Hydrocarbons
Chloride
Fluoride
80% species protection trigger
values for potentially
bioaccumulating/ bioconcentrating
chemicals
90% species protection trigger values
99% species protection trigger values4
No loss or decline within BCH communities outside of acceptable levels
of change for LEP (no change from natural within HEPA and XEPA) (EPA
2016)
No loss or decline within animal communities outside of acceptable levels
of change for LEP (no change from The required number of dilutions as determined through WET testing is achieved at LEP boundaries

Mardie Minerals Ltd Mardie Project: Marine Environmental Quality Monitoring & Management Plan
18WAU-0002 / R190108
47
Environmental
Quality
Indicators
Environmental Quality Criteria
Environmental Quality Guidelines Environmental Quality
Standards
Constituents1 Low LEP Moderate LEP High LEP Maximum LEP
Toxicants in Sediment
Metals
Antifoulants
Hydrocarbons
ISQG-low trigger
values but only
for potentially
bioaccumulating/
bioconcentrating
chemicals
ISQG-low trigger values
natural within HEPA and XEPA) (EPA 2016)
80th percentile of tissue concentrations in filter or deposit feeder at suitable
reference site (HEPA) and no detectable change from natural background
(XEPA).
No reports of animal disease or deaths attributable to the Project
Selected toxicant concentrations below the maximum calculated from WET
testing and bitterns sampling for each LEP boundary
Notes: 1: This list of consituents for EQGs is considered preliminary based upon identified potential risks. These will be revised at the completion of the MEQ Validation Phase (Refer Section 6.4) 2: EQGs will apply for surface and bottom waters 3:Where no guidelines trigger values are available, or the toxicants are naturally occuring at high levels the EQG will be derived from the 95th percentile of natural background concentrations and
applied within the HEPA and XEPA only. 4: Except cobalt which where the 95% species protection trigger value applies

Mardie Minerals Ltd Mardie Project: Marine Environmental Quality Monitoring & Management Plan
18WAU-0002 / R190108
48
Figure 5-2 Summary of the approach used to derive preliminary Environmental Quality Guidelines
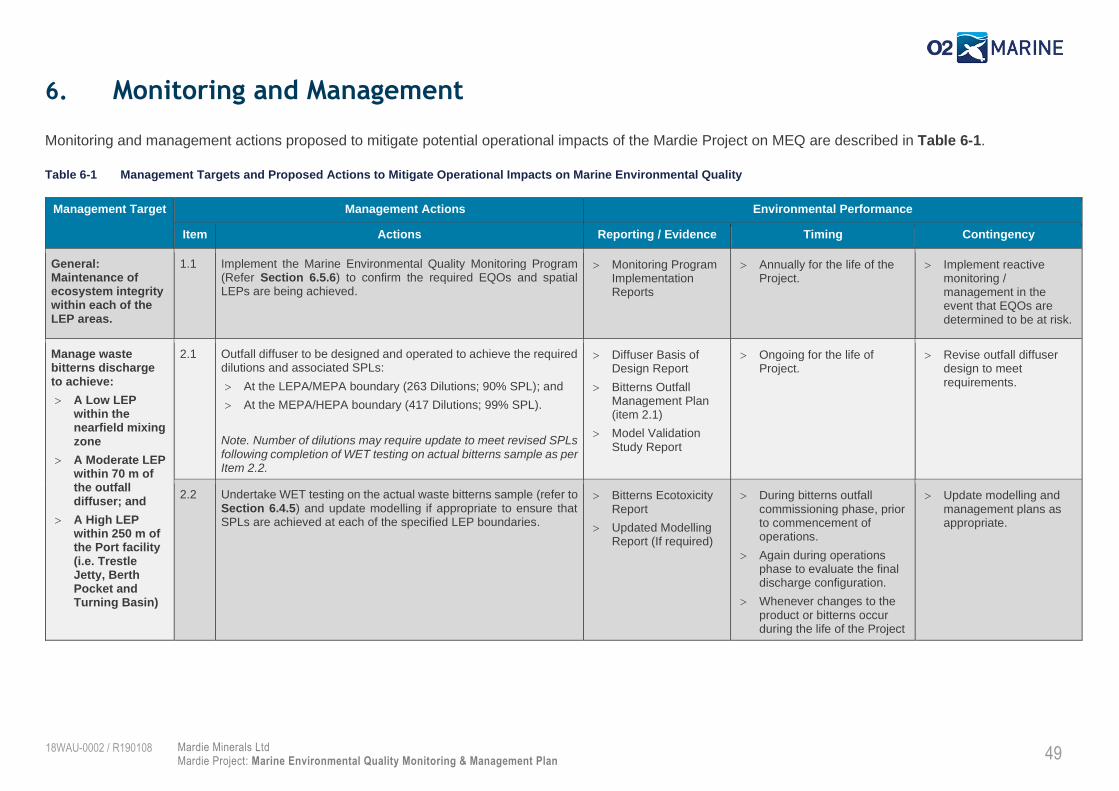
Mardie Minerals Ltd Mardie Project: Marine Environmental Quality Monitoring & Management Plan
18WAU-0002 / R190108
49
6. Monitoring and Management
Monitoring and management actions proposed to mitigate potential operational impacts of the Mardie Project on MEQ are described in Table 6-1.
Table 6-1 Management Targets and Proposed Actions to Mitigate Operational Impacts on Marine Environmental Quality
Management Target Management Actions Environmental Performance
Item Actions Reporting / Evidence Timing Contingency
General: Maintenance of ecosystem integrity within each of the LEP areas.
1.1 Implement the Marine Environmental Quality Monitoring Program (Refer Section 6.5.6) to confirm the required EQOs and spatial LEPs are being achieved.
Monitoring Program Implementation Reports
Annually for the life of the Project.
Implement reactive monitoring / management in the event that EQOs are determined to be at risk.
Manage waste bitterns discharge to achieve:
A Low LEP within the nearfield mixing zone
A Moderate LEP within 70 m of the outfall diffuser; and
A High LEP within 250 m of the Port facility (i.e. Trestle Jetty, Berth Pocket and Turning Basin)
2.1
Outfall diffuser to be designed and operated to achieve the required dilutions and associated SPLs:
At the LEPA/MEPA boundary (263 Dilutions; 90% SPL); and
At the MEPA/HEPA boundary (417 Dilutions; 99% SPL).
Note. Number of dilutions may require update to meet revised SPLs following completion of WET testing on actual bitterns sample as per Item 2.2.
Diffuser Basis of Design Report
Bitterns Outfall Management Plan (item 2.1)
Model Validation Study Report
Ongoing for the life of Project.
Revise outfall diffuser design to meet requirements.
2.2 Undertake WET testing on the actual waste bitterns sample (refer to Section 6.4.5) and update modelling if appropriate to ensure that SPLs are achieved at each of the specified LEP boundaries.
Bitterns Ecotoxicity Report
Updated Modelling Report (If required)
During bitterns outfall commissioning phase, prior to commencement of operations.
Again during operations phase to evaluate the final discharge configuration.
Whenever changes to the product or bitterns occur during the life of the Project
Update modelling and management plans as appropriate.

Mardie Minerals Ltd Mardie Project: Marine Environmental Quality Monitoring & Management Plan
18WAU-0002 / R190108
50
Management Target Management Actions Environmental Performance
Item Actions Reporting / Evidence Timing Contingency
2.3 Implement the bitterns outfall model validation study as described in the MEQMMP (Section 6.4.6).
Bitterns Outfall Model Validation Study Report
During bitterns outfall commissioning phase, prior to commencement of operations.
Again during initial operations phase to evaluate the final discharge configuration.
Biannually (i.e. during winter & summer) for first 5 years
Whenever changes to the product or bitterns occur during the life of the Project
Revise outfall diffuser design to meet requirements as appropriate.
Manage vessel bunkering, chemical storage and spill response to avoid release of contaminants to the marine environment
3.1 Develop and implement project specific management procedures:
1. Chemical Storage and Handling Procedure.
2. Bunkering Procedure.
3. Port Facility Oil Spill Response Plan.
3. Shipboard Oil Pollution Emergency Plan (SOPEP).
Management Procedures
Audit records providing evidence of effective controls.
Prior to commencement of any works onsite.
Corrective actions should be applied where there is evidence that procedures have not been followed.
Update procedures as appropriate.
3.2 All vessel equipment to be designed and operated to prevent spills and leaks through the provision of in-built safeguards including, but not limited to, relief valves, overflow protection, and automatic and manual shut-down systems.
Inspection reports
Vessel management procedure
Inspection reports required at least quarterly for the life of the Project.
Rectify any equipment that is damaged or missing as soon as practicable.
Port operations not to commence prior to development and approval of vessel management procedures.
3.3 In accordance with the Port Facility Oil Spill Response Plan (Item 3.1), Hydrocarbon spills will be reported to the Relevant Decision-making Authority (DMA). An incident report will be submitted for each spill to the marine environment.
Verbal communication
Incident Report
Immediate verbal communication.
Incident report submitted with 24 hrs of incident.
Implement reactive sampling as appropriate.

Mardie Minerals Ltd Mardie Project: Marine Environmental Quality Monitoring & Management Plan
18WAU-0002 / R190108
51
Management Target Management Actions Environmental Performance
Item Actions Reporting / Evidence Timing Contingency
Manage operations to avoid release of any brine or product from the processing, storage or vessel loading facilities to the marine environment
4.1 Intake and outfall pipelines will utilise industry-standard materials to minimise the chance of leaks, and mitigation will be implemented to reduce this risk further.
Pipeline Basis of Design Report
Prior to pipeline installation Review pipeline design as required.
4.2 Ponds will be designed with adequate freeboard and overflow features to minimise the risk of unplanned overflows and wall breaches.
Pond Basis of Design Report
Prior to pond construction Review pond design as required.
4.3
Regular inspections to be undertaken on facilities to ensure:
Bund wall condition / integrity; and
Pipeline condition / integrity.
Inspections reports
At least quarterly for the life of the Project.
Implement routine or reactive maintenance as required to rectify any observed defects.
4.4 Routine maintenance procedures to be developed and implemented for all product storage and processing infrastructure.
Maintenance Procedures
Procedures to be developed prior to construction and updated as required for the life of the Project
Corrective actions should be applied where there is evidence that procedures have not been followed.
Update procedures as appropriate
4.5 Relevant Decision-making Authority (DMA) is to be notified immediately in the event of a critical asset failure to the marine environment. An incident report will be submitted for each spill.
Verbal communication
Incident Report
Immediate verbal communication.
Incident report submitted with 24 hrs of incident.
Implement reactive sampling as appropriate.

Mardie Minerals Ltd Mardie Project: Marine Environmental Quality Monitoring & Management Plan
18WAU-0002 / R190108
52
Monitoring and Management Programs
To ensure that defined EVs and EQOs are not compromised through construction, commissioning and
routine operation of the Mardie Project a comprehensive monitoring and management program is
proposed. The elements of the monitoring and management program as they relate to potential MEQ
impacts from the Project are defined in Table 6-2, whilst an overview of the monitoring requirements
are presented in Table 6-3.
Table 6-2 Elements of the Marine Environmental Quality Monitoring and Management
Element Sub-Elements Rationale
Pre-Commissioning Baseline Monitoring
Water Quality Monitoring
Sediment Monitoring
Benthic Infauna
Physical Observation
To collect sufficient spatial and temporal data with a high level of replication from which site specific EQGs and EQS will be derived.
Potential Project impacts have been identified to water and sediment quality, so monitoring has been designed in accordance with ANZG (2018) protocols for monitoring and assessment of these values.
Bitterns Diffuser Outfall Commissioning
Bitterns Discharge Quality
Bitterns Discharge Flowrate
To implement a monitoring and management program for bitterns outfall diffuser commissioning that meets MEQ expectations.
This program targets the actual water quality being discharged to ensure that the design specifications are being achieved. If water quality of the discharge is achieved, then it is assumed through bitterns outfall modeling that the EQC within each LEP will be achieved (Note: the below program will validate this assumption)
Marine Environmental Quality Validation
Bitterns Whole Effluent Toxicity and Contaminant Testing
To identify the actual toxicity of the bitterns discharge on local native species WET Testing will be undertaken.
Laboratory assessment of continents of potential concern will also be undertaken to ascertain which toxicants are highly concentrated in the bitterns.
These results will be used with other monitoring results to validate modelled impact predictions and verify the LEPs and EQCs.
Bitterns Diffuser Outfall Validation Testing
To ensure that the specified bitterns discharge criteria are met once routine operations are established.
These results will be used with other monitoring results to validate modelled impact predictions and verify the LEPs and EQCs.
Model and EQC Validation To provide an assessment of whether the defined EQCs are being met at their respective LEPs and determine if the discharged bitterns conform with WET testing and modelled predictions and required dilutions are being achieved at the LEPA/MEPA and MEPA/HEPA boundaries during routine operations.
These results will be used with other monitoring results to validate modelled impact predictions and verify the LEPs and EQCs
Routine Operational Performance Assessment
Bitterns Diffuser Outfall Water Quality
To ensure that design specifications for bitterns discharge constituents, as defined by modelling and WET testing, are being achieved through the lifecycle of the Project.
Ongoing Marine Environmental Quality
To verify that impacts from operational activities associated with the Mardie Project, such as ocean outfall, vessel operations stormwater runoff or groundwater flows, do not impact MEQ outside the limits of acceptable ecological change associated with the defined LEPs.

Mardie Minerals Ltd Mardie Project: Marine Environmental Quality Monitoring & Management Plan
18WAU-0002 / R190108
53
Table 6-3 Monitoring Program Overview
Element Sub-Element Sample
Requirement
Parameters Frequency Duration No. of
Sites
No.
Samples per
site*
Pre-Commissioning Baseline Monitoring
Water Quality Monitoring
Physico-chemical water column profiling
Electrical conductivity
Salinity
Temperature
pH
Dissolved oxygen
Turbidity
Six weekly 2 years 4 NA
Water sampling Hydrocarbons
Ionic balance
Metals and metalloids
Six weekly 2 years 4 1
Sediment Quality Monitoring
Sediment sampling Particle size distribution
Total organic carbon and moisture
Metals and metalloids
Hydrocarbons
Once only** NA 10 1
Benthic infauna Sediment grab sample
Lowest taxonomic level Annual 2 years 10 3
Aesthetic Observation
Physical observations
Nuisance organisms
Large-scale deaths
Oil/Film
Natural reflectance
Objectionable odour
Floating debris, rubbish, surface slicks
Six weekly 2 years 14 NA
Bitterns Diffuser Outfall Commissioning
Bitterns discharge quality
Water grab sample Salinity Weekly TBD 2 2
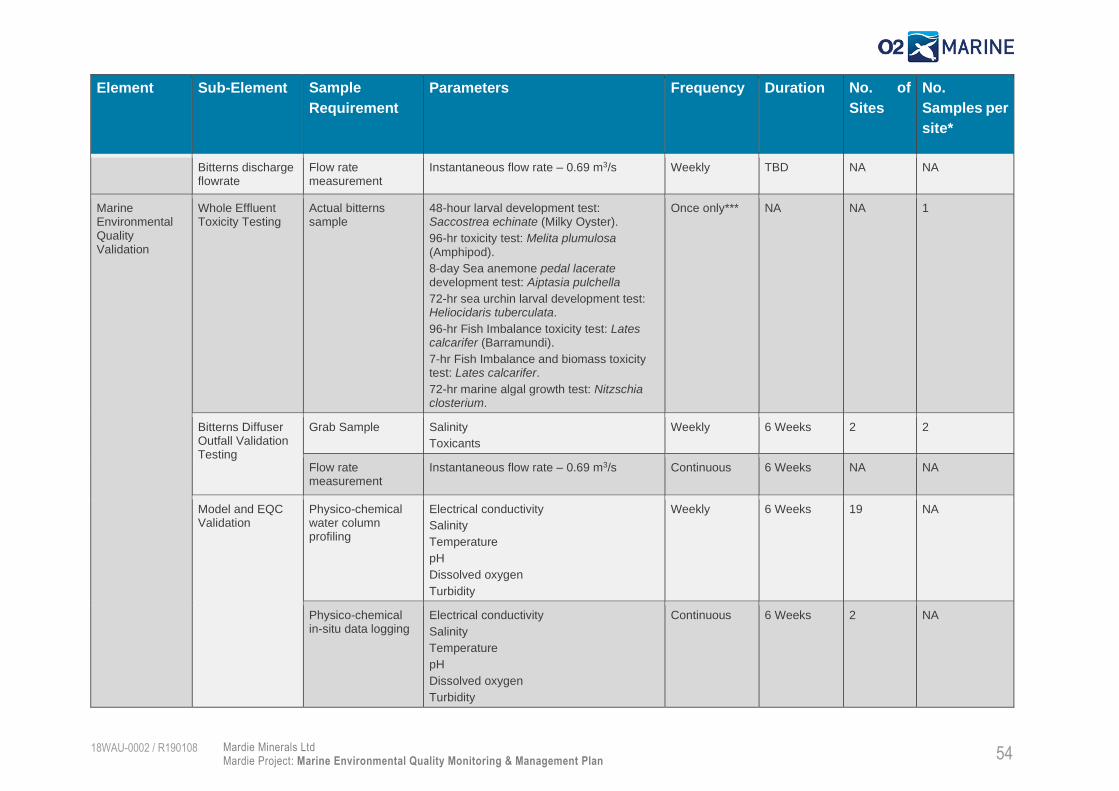
Mardie Minerals Ltd Mardie Project: Marine Environmental Quality Monitoring & Management Plan
18WAU-0002 / R190108
54
Element Sub-Element Sample
Requirement
Parameters Frequency Duration No. of
Sites
No.
Samples per
site*
Bitterns discharge flowrate
Flow rate measurement
Instantaneous flow rate – 0.69 m3/s Weekly TBD NA NA
Marine Environmental Quality Validation
Whole Effluent Toxicity Testing
Actual bitterns sample
48-hour larval development test: Saccostrea echinate (Milky Oyster).
96-hr toxicity test: Melita plumulosa (Amphipod).
8-day Sea anemone pedal lacerate development test: Aiptasia pulchella
72-hr sea urchin larval development test: Heliocidaris tuberculata.
96-hr Fish Imbalance toxicity test: Lates calcarifer (Barramundi).
7-hr Fish Imbalance and biomass toxicity test: Lates calcarifer.
72-hr marine algal growth test: Nitzschia closterium.
Once only*** NA NA 1
Bitterns Diffuser Outfall Validation Testing
Grab Sample Salinity
Toxicants
Weekly 6 Weeks 2 2
Flow rate measurement
Instantaneous flow rate – 0.69 m3/s Continuous 6 Weeks NA NA
Model and EQC Validation
Physico-chemical water column profiling
Electrical conductivity
Salinity
Temperature
pH
Dissolved oxygen
Turbidity
Weekly 6 Weeks 19 NA
Physico-chemical in-situ data logging
Electrical conductivity
Salinity
Temperature
pH
Dissolved oxygen
Turbidity
Continuous 6 Weeks 2 NA
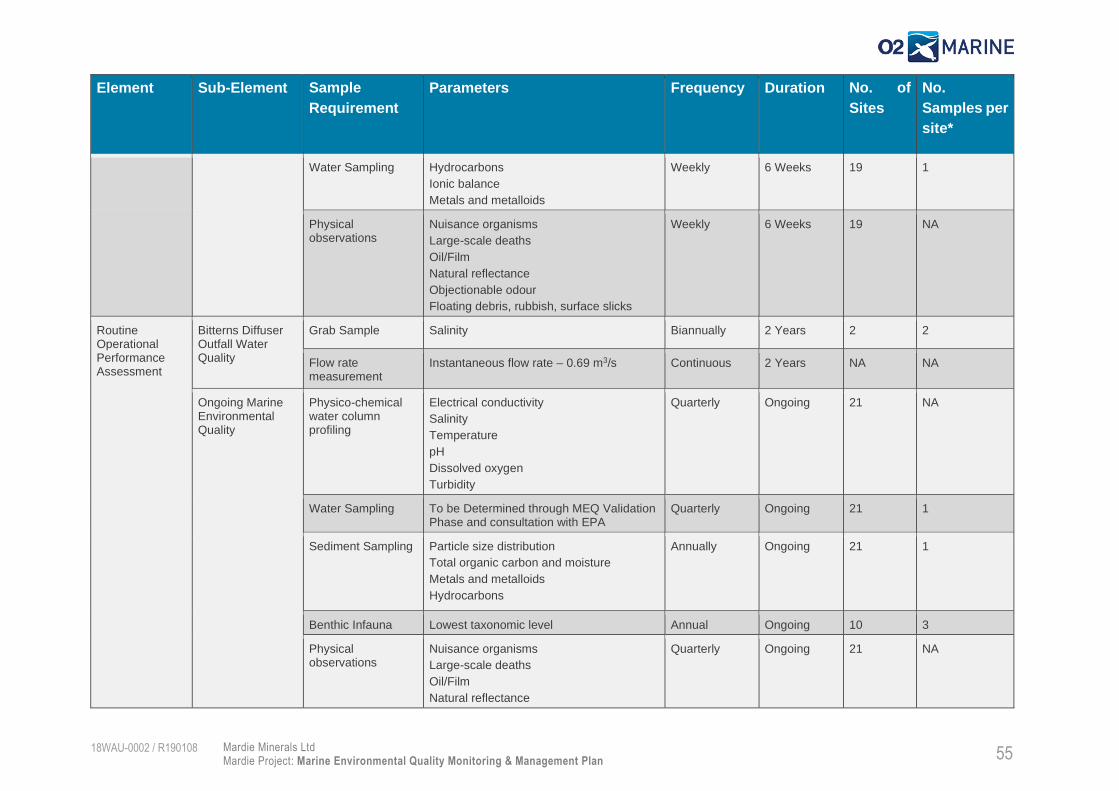
Mardie Minerals Ltd Mardie Project: Marine Environmental Quality Monitoring & Management Plan
18WAU-0002 / R190108
55
Element Sub-Element Sample
Requirement
Parameters Frequency Duration No. of
Sites
No.
Samples per
site*
Water Sampling Hydrocarbons
Ionic balance
Metals and metalloids
Weekly 6 Weeks 19 1
Physical observations
Nuisance organisms
Large-scale deaths
Oil/Film
Natural reflectance
Objectionable odour
Floating debris, rubbish, surface slicks
Weekly 6 Weeks 19 NA
Routine Operational Performance Assessment
Bitterns Diffuser Outfall Water Quality
Grab Sample Salinity Biannually 2 Years 2 2
Flow rate measurement
Instantaneous flow rate – 0.69 m3/s Continuous 2 Years NA NA
Ongoing Marine Environmental Quality
Physico-chemical water column profiling
Electrical conductivity
Salinity
Temperature
pH
Dissolved oxygen
Turbidity
Quarterly Ongoing 21 NA
Water Sampling To be Determined through MEQ Validation Phase and consultation with EPA
Quarterly Ongoing 21 1
Sediment Sampling Particle size distribution
Total organic carbon and moisture
Metals and metalloids
Hydrocarbons
Annually Ongoing 21 1
Benthic Infauna Lowest taxonomic level Annual Ongoing 10 3
Physical observations
Nuisance organisms
Large-scale deaths
Oil/Film
Natural reflectance
Quarterly Ongoing 21 NA

Mardie Minerals Ltd Mardie Project: Marine Environmental Quality Monitoring & Management Plan
18WAU-0002 / R190108
56
Element Sub-Element Sample
Requirement
Parameters Frequency Duration No. of
Sites
No.
Samples per
site*
Objectionable odour
Floating debris, rubbish, surface slicks
Notes:
* Excludes field QA/QC sample requirements
** Excludes previously undertaken investigation reported in O2 Marine 2019a
*** WET testing and bitterns contamination analysis are also required at any time during which the Project process is altered in any way, thus potentially altering the levels of constituents and
therefore possibly the toxicity within the discharge stream

Mardie Minerals Ltd Mardie Project: Marine Environmental Quality Monitoring & Management Plan
18WAU-0002 / R190108
57
Pre-Commissioning Baseline Monitoring Program
Context
In order to be able to determine impacts upon MEQ from the Mardie Project a comprehensive set of
EQCs needs to be defined that are specific to the local area within which the Project will be situated.
The pre-commissioning baseline monitoring program aims to collect data from the local marine
environment with which to derive site specific EQCs for which actual Project impacts can be measured
against during commissioning and ongoing routine operations. This program is typically comprised of
the following sub-monitoring elements:
Marine water quality monitoring;
Physical observations;
Sediment monitoring; and
Benthic infauna.
Purpose
The purpose of this element is to collect sufficient spatial and temporal data with a high level of
replication from which site specific EQGs and EQS will be derived in accordance with ANZG (2018).
Site specific EQGs and EQS will be used to define marine environmental performance during both the
commissioning and routine operational phases of the Project lifecycle. In accordance with ANZG (2018)
a two-year baseline monitoring period is proposed to provide a suitable data set for the intended
purpose.
This phase will also allow the fine tuning of sampling methodology to ensure the described practices
are effective when applied under field situations. Any lessons learnt, or alterations to the defined
methodologies will be included into a revised version of this MEQMMP.
Environmental Quality Criteria
As the purpose of this phase is to collect baseline data from which to derive site specific EQC, there
are no applicable EQGs or EQSs for assessment of data.
At the completion of this phase EQC will be calculated in accordance with Figure 5-2 which will apply
to MEQ monitoring programs outlined within Section 6.4.7 and Section 6.5.6.
Sampling Design
Table 6-4 provides a summary of the proposed sampling frequency. Where practical, sampling should
be undertaken on or near to the same date each month/year to allow for consistent comparison of
seasonal trends. Sampling frequency has been determined based on the recommended number of
samples and sample collection frequency specified in ANZG (2018).
Sediment and water quality investigation have previously been undertaken to assists with the
environmental assess met for the proposed project. Data has been analysed and reported in the
following project specific technical documents:

Mardie Minerals Ltd Mardie Project: Marine Environmental Quality Monitoring & Management Plan
18WAU-0002 / R190108
58
Mardie Project Baseline Sediment Characterisation. Report prepared by O2 Marine for Mardie
Minerals Ltd (O2 Marine 2019a); and
Mardie Project Baseline Water Quality Monitoring. Report prepared by O2 Marine for Mardie
Minerals Ltd (O2 Marine 2020a).
Whilst these studies were developed to specifically inform project environmental impact assessment,
data collected will be pooled with data to be collected during the baseline water and sediment quality
program to derive EQCs in accordance the process specified in Section 5.2.
Additional sediment and water quality data will be collected in accordance with this MEQMMP.
Table 6-4 Monitoring Frequency for the Proposed Phase I Baseline data collection
Monitoring Event Frequency Period No. of Sampling Rounds*
No. of Sites No. of Samples
Collected*
Physico-chemical Water Quality Profiling
Six weekly 2 years 17 4 68
Benthic Infauna Sampling
Annual 2 years 2 10 60
Sediment Sampling Annual 2 years 2 10 20
Physical Observation Six weekly 2 years 17 14 88
Water Sampling Six weekly 2 years 17 4 68
Notes:
* Excludes sampling previously undertaken as reported in O2 Marine 2019a or O2 Marine 2020a.
The water quality monitoring program includes four (4) locations. These are presented in Figure 6-1
and described in Table 6-5.
Sediment quality and infauna monitoring programs include 10 locations. These are presented in Figure
6-3 and described in Table 6-5

Mardie Minerals Ltd Mardie Project: Marine Environmental Quality Monitoring & Management Plan
18WAU-0002 / R190108
59
Table 6-5 Baseline Water Quality Monitoring Locations and Routine Tasks
Site
Name Site Reference
Level of
Ecological
Protection
Easting
(GDA94
MGA50)
Northing
(GDA94
MGA50)
Routine Sampling Tasks
Ph
ysic
al
Ob
serv
ati
on
s
Ph
ysic
o-c
hem
ical
Wate
r C
olu
mn
Pro
fili
ng
W
ate
r S
am
ple
Co
llecti
on
Sed
imen
t M
on
ito
rin
g
Ben
thic
in
fau
na
MB1 This site is located offshore within the HEPA allowing an
assessment of the pre-project baseline conditions. High 388382.2 7673404.0 X X X
MB2 This site is located nearshore within the XEPA allowing an
assessment of the pre-project baseline conditions. Maximum 388485.8 7670738.7 X X X
NC1 This site is located adjacent to the small vessel support
infrastructure area within Mardie Creek allowing assessment of impacts associated with related activities.
High 388401.7 7668638.8 X X X
MIC1 This site is located adjacent to the sweater abstraction intake within Peter’s Creek allowing assessment of potential impacts
related to this activity. High 379199.1 7649389.6 X X X

Mardie Minerals Ltd Mardie Project: Marine Environmental Quality Monitoring & Management Plan
18WAU-0002 / R190108
60
Site
Name Site Reference
Level of
Ecological
Protection
Easting
(GDA94
MGA50)
Northing
(GDA94
MGA50)
Routine Sampling Tasks
Ph
ysic
al
Ob
serv
ati
on
s
Ph
ysic
o-c
hem
ical
Wate
r C
olu
mn
Pro
fili
ng
W
ate
r S
am
ple
Co
llecti
on
Sed
imen
t M
on
ito
rin
g
Ben
thic
in
fau
na
MLB1
MLB3
MLB4
MLB6
These sites have been selected to represent baseline conditions at the LEPA/MEPA Boundary.
Moderate
389583.4
389693.6
389595.6
389454.1
7673064.5
7673081.6
7672206.6
7672198.1
X X X
MMB1
MMB3
MMB7
MMB5
These sites have been selected to represent baseline conditions at the MEPA/HEPA Boundary.
High
389612.5
389719.4
389893.2
389174.2
7673446.5
7673454.8
7672216.9
7672168.4
X X X
MH1
MH3
These sites have been selected to represent reference sites located away from the influence of operations and
construction which can be used for ongoing MEQ sampling programs.
High 388640.0
390650.1
7672814.3
7672847.0 X X X

Mardie Minerals Ltd Mardie Project: Marine Environmental Quality Monitoring & Management Plan
18WAU-0002 / R190108
61
Figure 6-1 Baseline Water Quality Monitoring Locations

Mardie Minerals Ltd Mardie Project: Marine Environmental Quality Monitoring & Management Plan
18WAU-0002 / R190108
62
Sampling Methodology
Physical Observations
General Observations
The following field observations are to be recorded at each site during each sampling event:
Date and time of sampling at each location;
Person conducting sampling;
Site reference;
GPS coordinates of sampling location;
Tides and water depth at the time of sampling;
Wind speed (km/hr) and direction;
Sea state (i.e. wave and swell heights); and
General weather conditions (rain, storms, cloud cover, etc).
Digital photographs should also be taken throughout the monitoring event as weather conditions change
and as required to document any notable site observations. Field logs are to be scanned and saved in
BCI’s records management system and attached as an appendix in the quarterly and annual reports.
Aesthetic Observations
At each sampling location, observations of aesthetic water quality parameters should be recorded for
each of the quick reference guide categories provided in Table 6-6. Aesthetic observations are to
consider waters within an approximate 50 metre radius of the survey vessel.
Table 6-6 Aesthetic observations quick reference guide
Parameter REF 1 2 3 4 5
Nuisance organisms (Surface coverage %) A Nil 1-10 11-50 51-80 100+
Large-scale deaths (Marine fauna) B Nil 1-10 11-51 51-81 100+
Oil/Film (Surface coverage) C Nil 1-10% 11-50% 51-80% 81-100%
Natural reflectance (Diminished) E 81-100% 51-80% 11-50% 1-10% Nil
Objectionable odour F Nil Slight Moderate Strong Offensive
Floating debris, rubbish, surface slicks
(Surface coverage %) G Nil 1-10 11-50 51-80 100+

Mardie Minerals Ltd Mardie Project: Marine Environmental Quality Monitoring & Management Plan
18WAU-0002 / R190108
63
Physico-chemical Water Quality Monitoring
A pre-calibrated, Water Quality Sonde will be used to collect physico-chemical water quality profiles at
all four (4) sampling locations identified within Table 6-5. As a minimum, the following parameters will
be measured at 0.5 metre (m) intervals throughout the water column from the seabed to the surface:
Depth (m);
Water temperature (oC);
pH;
Salinity (ppt);
Electrical Conductivity (mS/cm);
Turbidity (NTU); and
Dissolved oxygen (% saturation & mg/L).
All recorded measurements are to be stored on the sonde hand-held unit and downloaded to a secure
server within 24 hours. The data should be immediately assessed to ensure validity and, any erroneous
data should be removed from the analysis as appropriate.
Water Sample Collection
Water samples will be collected at all four (4) sampling locations as identified within Table 6-5. Water
samples will be collected using a depth-integrated water sampler1 to pump the required volume of water
commencing at the seabed up to the surface.
The water sampler will be rinsed with Decon solution (or equivalent) between samples. Water samples
will be collected in suitable (laboratory supplied) bottles and immediately stored on ice for transport to
a National Association of Testing Authorities (NATA) accredited laboratory for analysis.
All sample containers will be marked with a unique identifier, the date/time and the sampler’s name and
clarification that the samples are marine water using a waterproof permanent maker. All samples will
then be listed on a Chain of Custody (CoC) form to be included with the samples sent to the laboratories.
Laboratory Analysis
General water sample analysis will be performed on samples collected from all four (4) sampling
locations. These samples are required to be analysed by a NATA-accredited laboratory for the
following;
Ionic balance:
o Alkalinity and Hardness;
o Calcium, Magnesium, sodium, potassium cations;
o Chloride, fluoride and sulphate anions
Hydrocarbons (TRH, TPH and BTEXN); and
1 If a depth-integrated water sampler is not available, a pole sampler or niskin bottle (or equivalent) may be used to sample
at a depth of 0.5m below the surface. Near-surface sampling is generally considered to be representative of water quality at the sample sites as waters in Mardie Coastline experience a high degree of mixing.

Mardie Minerals Ltd Mardie Project: Marine Environmental Quality Monitoring & Management Plan
18WAU-0002 / R190108
64
Dissolved Metals and Metalloids (Al, As, Bo, Cd, Cu, Hg, Pb, Zn, V).
Field Quality Assurance & Quality Control
All water quality meters are to be in calibration. If monitoring equipment is hired, calibration certificates
are to be provided from the supplier. Calibration records are to be saved and attached as an appendix
to compliance reports.
The following Quality Assurance & Quality Control (QA/QC) Samples should be collected as described
below:
A duplicate sample is to be collected at the same site as two (2) of the primary monitoring
samples. The purpose of the sample is to confirm that the primary laboratory is able to
produce consistent results when analysing the same sample. The site where it was taken is to
be recorded but not reported to the laboratory. Ideally it should be collected at a site that is
expected to have higher levels of contamination (based on historic data and potential sources
of contamination) as this will confirm a wider range of analytes and reduce the level of
instrument error when comparing larger concentrations.
A field split sample is collected at the same site as the duplicates and sent to a secondary
laboratory for analysis. The purpose of this sample is to confirm that intra-laboratory analysis
of the sample produces consistent results.
A rinsate sample is collected to confirm that cross contamination doesn’t occur during the
sampling processes in the field. The rinsate sample should be taken after the decontamination
process of the sample collection container by running deionised water over the container and
collecting it in laboratory provided bottles.
Laboratory Quality Assurance & Quality Control
Laboratories used for water sample analysis must be NATA accredited. Comprehensive QA/QC testing
of water samples should be undertaken in accordance with NATA accreditation and include testing of
laboratory control samples, method blanks, matrix spikes, laboratory duplicates and surrogate recovery
outliers (where applicable).
Sediment Sampling
Sample Collection
Sediment samples will be collected at all ten (10) sampling locations described in Table 6-5. Sampling
will involve the collection of sediment using a combination of vibro-coring, surface grab sampling and
diver-coring. The grab, plastic tray and other equipment in contact with the sediment will be rinsed with
Decon solution and seawater prior to sampling each site to reduce potential for contamination. Where
insufficient sediment is collected (i.e. less than 1/3rd of grab volume), the grab will be required to be
redeployed. Estimate and record the volume of sediment collected and empty the grab into a plastic
tray to mix and homogenise the sediment. Photograph each sample once emptied into the plastic tray.
Place sample into appropriate sample jars/ containers provided by laboratory. Containers should be
refrigerated or placed into an esky with ice bricks before frozen at the completion of each sampling day
and sent to a NATA approved laboratory.

Mardie Minerals Ltd Mardie Project: Marine Environmental Quality Monitoring & Management Plan
18WAU-0002 / R190108
65
All sample containers will be marked with a unique identifier, the date/time and the sampler’s name and
clarification that the samples are marine water using a ‘Wet-write’ permanent maker. All samples will
then be listed on a CoC form which will accompany the samples sent to the laboratories.
Laboratory Analysis
Sediment quality sample analysis will be performed on samples collected from all 10 monitoring
locations. These samples will be analysed by a NATA-accredited laboratory for the following analytical
suite:
Particle size distribution (PSD);
Total organic carbon (TOC);
Moisture;
Metals and metalloids (Al, As, Bo, Cd, Cu, Hg, Pb, Zn, V);
Hydrocarbons (TRH, TPH and BTEXN);
Antifoulant Compounds (Diuron, Chlorothalonil).
Field Quality Assurance & Quality Control
Disposable nitrile gloves should be used during handling of the sediment sample and all equipment in
contact with the sediment should be washed down with Decon solution prior to each sample being
taken. The following QA/QC Samples should be collected as described below:
Triplicate samples (i.e. three separate samples taken with the sediment grab at the same
location) should be taken at one (1) site to determine the variability of the sediment physical
and chemical characteristics.
A field split sample (i.e. one sediment grab sample thoroughly mixed and then split into three
sub-samples) should be collected at collected at one (1) site to assess inter and intra-
laboratory variation, with one of the three samples sent to a second laboratory.
A transport blank (acid-washed silica sand) in a sealed jar should be provided by the
laboratory and taken to site but not opened. The transport blank is sent back to the laboratory
with the other samples and analysed. This blank is used to assess if any contamination is
already present in the acid-washed sand or container.
A method blank (acid-washed silica sand) should be used to assess the potential for
contamination during the sampling process. The method blank should be placed into the ‘van
Veen’ grab and processed identically to the usual sediment samples. The method blank
should be sent to the laboratory and analysed with the other samples to assess presence of
contamination during the processing procedures.
Laboratory Quality Assurance & Quality Control
Laboratories used for sediment toxicity sample analysis must be NATA accredited. Comprehensive
QA/QC testing of sediment samples should be undertaken in accordance with NATA accreditation and
include testing of laboratory control samples, method blanks, matrix spikes, laboratory duplicates and
surrogate recovery outliers (where applicable).
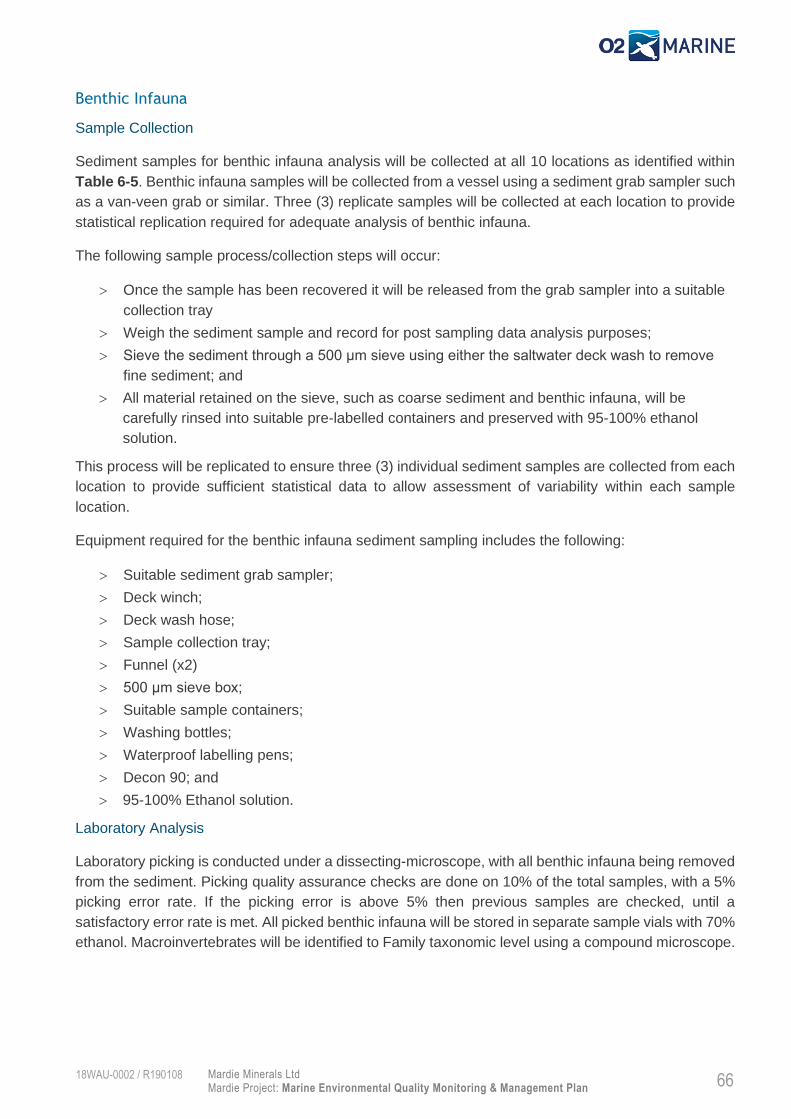
Mardie Minerals Ltd Mardie Project: Marine Environmental Quality Monitoring & Management Plan
18WAU-0002 / R190108
66
Benthic Infauna
Sample Collection
Sediment samples for benthic infauna analysis will be collected at all 10 locations as identified within
Table 6-5. Benthic infauna samples will be collected from a vessel using a sediment grab sampler such
as a van-veen grab or similar. Three (3) replicate samples will be collected at each location to provide
statistical replication required for adequate analysis of benthic infauna.
The following sample process/collection steps will occur:
Once the sample has been recovered it will be released from the grab sampler into a suitable
collection tray
Weigh the sediment sample and record for post sampling data analysis purposes;
Sieve the sediment through a 500 μm sieve using either the saltwater deck wash to remove
fine sediment; and
All material retained on the sieve, such as coarse sediment and benthic infauna, will be
carefully rinsed into suitable pre-labelled containers and preserved with 95-100% ethanol
solution.
This process will be replicated to ensure three (3) individual sediment samples are collected from each
location to provide sufficient statistical data to allow assessment of variability within each sample
location.
Equipment required for the benthic infauna sediment sampling includes the following:
Suitable sediment grab sampler;
Deck winch;
Deck wash hose;
Sample collection tray;
Funnel (x2)
500 μm sieve box;
Suitable sample containers;
Washing bottles;
Waterproof labelling pens;
Decon 90; and
95-100% Ethanol solution.
Laboratory Analysis
Laboratory picking is conducted under a dissecting-microscope, with all benthic infauna being removed
from the sediment. Picking quality assurance checks are done on 10% of the total samples, with a 5%
picking error rate. If the picking error is above 5% then previous samples are checked, until a
satisfactory error rate is met. All picked benthic infauna will be stored in separate sample vials with 70%
ethanol. Macroinvertebrates will be identified to Family taxonomic level using a compound microscope.

Mardie Minerals Ltd Mardie Project: Marine Environmental Quality Monitoring & Management Plan
18WAU-0002 / R190108
67
Data Assessment and Reporting
Data Validation
All data is required to be validated prior to the release of any monitoring reports to confirm that data
has been entered correctly. Data entry is to be checked and verified against raw data logs and
laboratory reports by an independent person.
Quality Control
An assessment of quality control data needs to be undertaken and included in all reports including:
Assessment of field contamination (rinsate, transport blank and method blank);
Assessment of field variability (duplicate, triplicate or replicate);
Assessment of lab variability (intra and inter-laboratory duplicates, picking error); and
Laboratory QA/QC results.
Data Assessment
During this phase no, commissioning or project related operational activities will occur. Therefore, data
collected will not be required to be assessed against the EQCs identified within Section 5.2 to interpret
if EVs and EQOs are being compromised. However, for the purposes of providing context to sample
results, a review of the similarity of reference sites to LEPA/MEPA and MEPA/HEPA boundary sites
will be undertaken to confirm suitability.
At the completion of the two year baseline data collection period a review of the baseline data will be
undertaken to derive and determine site specific EQG and EQS for the LEPA, MEPA and HEPA LEP
Boundary areas in accordance with the process outlined in the EQMF (Section 5.2). Site specific EQS
will be incorporated into a revised version of this MEQMMP once defined.
Reporting
At the completion of each sampling round a brief summary report will be submitted outlining the results
obtained.
A comprehensive report will be compiled at the completion of the two-year data collection period which
will include, but not be limited to:
Summary of the methods applied and any deviations from this MEQMMP;
Timeseries graphs of physicochemical water column profiles;
A table summarising laboratory analysis results;
Timeseries graphs of laboratory analysis results;
Statistical summary of infauna (as per collection frequency)
An assessment of all data collected against the EQCs;
Presentation of the calculated site specific EQG and EQS in accordance with ANZG (2018);
and
Any actions or recommendations required as a result of field implementation of the Sampling
and Analysis Plan (SAP) and assessment of monitoring data.

Mardie Minerals Ltd Mardie Project: Marine Environmental Quality Monitoring & Management Plan
18WAU-0002 / R190108
68
Bitterns Diffuser Outfall Commissioning
Context
In order to discharge bitterns, a diffuser commissioning period will be required. During commissioning
it is possible that the bitterns being discharged will not meet the design criteria which was initially used
to model the dilutions and recirculation in order to establish an appropriate mixing zone. The end of the
commissioning period will be determined when engineering confirms typical operating conditions have
been achieved for all facilities and associated infrastructure and monitoring confirms the SPLs for each
LEP are achieved.
Management during the initial commissioning process is focused on achieving the desired level of
dilution required to ensure the discharged bitterns meets the accepted level of brine discharge. Where
desired levels are not being achieved contingency actions will be implemented to ensure the permanent
bitterns outfall discharge process and design are optimised prior to completion of commissioning. These
actions that are implemented during commissioning will ensure that the end point for routine operations
is a discharge process that meets or exceeds the expected targets.
Purpose
The purpose of commissioning monitoring and management is to design a process that meets MEQ
expectations, whilst providing flexibility during the initial stages of the bitterns discharge process to allow
a staggered start up and optimisation process. Management triggers have been designed which provide
assurance around protecting EVs, but also to ensure appropriate contingency management actions,
such as alterations to the process or design, are implemented during this period, thus reducing the
potential for long-term issues.
Environmental Quality Criteria
As the purpose of this phase is to determine the number of dilutions between the raw bitterns and the
diffuser during commissioning no EQC apply. Rather, two Management Triggers presented below guide
this phase of the Project.
Management Triggers
In order to achieve the purpose, two levels of management triggers have been established which will
inform Management when contingency measures need to be put into place to ensure the required SPLs
are met at the LEP boundaries. Contingency measures are identified in Section 6.3.6 and are typically
based upon conducting an investigation into the reason why a management trigger was exceeded and
putting appropriate corrective actions in place to reduce re-occurrence and where possible rectify the
situation to ensure optimisation of the process prior to completion of commissioning.
The two levels of management triggers are based upon the maximum instantaneous flow rate and the
maximum predicted design concentration for constituents within the bitterns discharge.
Additional management trigger levels are applicable to the MEPA / LEPA boundary, however these are
detailed within Section 6.4.

Mardie Minerals Ltd Mardie Project: Marine Environmental Quality Monitoring & Management Plan
18WAU-0002 / R190108
69
Management Trigger 1
Management trigger 1 is based upon the maximum instantaneous flow rate of:
0.69 m3/s constant discharge regime.
The management trigger level will be exceeded if the maximum instantaneous flow rate is exceeded,
thus enacting contingency management as described in Section 6.3.6.
Management Trigger 2
Management trigger 2 is based upon maximum discharge concentrations of:
325 ppt salinity of the pre-diluted bitterns waste; and
85.4 ppt salinity of the 5 times diluted bitterns waste at the outfall.
Adjusted management trigger levels will be revised accordingly prior to commissioning to ensure they
are appropriately set. If any management triggers are breached contingency management as described
in Section 6.3.6 will be required.
Bitterns Diffuser Outfall Commissioning Monitoring Program
Bitterns diffuser outfall commissioning monitoring will require continuous flow rate monitoring during
discharge and water samples to be collected from the raw bitterns wastewater sump and at the diffuser
outfall.
Two duplicate water samples will be collected weekly from the following two locations:
Direct grab sampling from the raw bitterns wastewater sump directly prior to discharge; and
Direct grab sampling from the pipeline at the closest point to final discharge and where five
dilutions with seawater has occurred.
Samples will be collected directly into laboratory supplied sample bottles at each location. Sampling will
be undertaken in accordance ANZG (2018) for water quality sampling with QA/QC samples requiring a
transport blank.
Water samples will be sent to a NATA accredited laboratory for analysis of salinity. Laboratory QA/QC
requirements will be undertaken in accordance with the NATA accreditation and reported with the
sample results.
Data Assessment and Reporting
Data Validation and Quality Control
All data is required to be validated prior to the release of any monitoring reports to confirm that data
has been entered correctly. Data entry is to be checked and verified against raw data logs and
laboratory reports by an independent person.
An assessment of quality control data needs to be undertaken and included in all reports including:
Assessment of field contamination (transport blank);

Mardie Minerals Ltd Mardie Project: Marine Environmental Quality Monitoring & Management Plan
18WAU-0002 / R190108
70
Assessment of variability (duplicate);
Laboratory QA/QC results.
Data Assessment
Laboratory analysed samples, physicochemical results and recorded flow rates will be compared with
defined management triggers as soon as practicable. Any elevation will require contingency actions as
described in Section 6.3.6 to be implemented.
Reporting
At the completion of each sampling round a validated laboratory report and interpreted tabulated data
will be submitted to BCI Minerals.
An investigation report will be compiled in accordance with BCI Minerals Management System for any
elevated results which requires investigation. Submission to the regulator will be subject to project
approval conditions.
A comprehensive report will be developed at the completion of the commissioning phase which will
include, but not be limited to:
Summary of the methods applied and any deviations from this MEQMMP;
Timeseries graphs of physicochemical parameters In-situ;
A table summarising laboratory analysis results;
Timeseries graphs of laboratory analysis results;
An assessment of all data collected against management triggers;
A review of management trigger exceedances investigations and remedial actions
implemented; and
Any actions or recommendations required as a result of field implementation of the SAP and
assessment of monitoring data.
Contingency Management during Commissioning
In the event that the bitterns discharge is not meeting the defined management triggers operational and
design solutions will be investigated. Firstly, depending upon the exceedance, an investigation needs
to be undertaken to determine the cause(s). Once the cause(s) is determined then appropriate
corrective or preventative actions need to be put into place to ensure re-occurrence does not occur.
This system of investigation and implementation of remedial actions will ensure that during the
commissioning phase all possible design modifications are put into place to ensure optimal performance
of the process at the completion of commissioning.
There are several potential operational and design solutions which may be used as contingency
measures in response to management trigger exceedances. Figure 6-2 provides an overview of the
contingency response and management framework to be applied during commissioning of the diffuser.

Mardie Minerals Ltd Mardie Project: Marine Environmental Quality Monitoring & Management Plan
18WAU-0002 / R190108
71
Figure 6-2 Contingency management framework during bitterns discharge commissioning

Mardie Minerals Ltd Mardie Project: Marine Environmental Quality Monitoring & Management Plan
18WAU-0002 / R190108
72
Bitterns Diffuser Outfall Validation
Context
To determine the actual impacts from project related activities to the MEQ a comprehensive MEQ
validation monitoring and management program has been designed. This program is broken into
several smaller components which each have different objectives, methodologies and contingency
actions. These components are:
Whole Effluent Toxicity (WET) testing to determine actual bitterns discharge toxicity and the
number of dilutions required to achieve ecological protection at LEP boundaries;
Bitterns discharge validation testing to characterise the discharge from the outfall diffuser
against design and determine final concentrations of toxicants; and
EQC and modelling validation monitoring at strategically positioned impact and reference
locations surrounding the outfall to allow an assessment against defined site specific EQC.
Management during validation is focused on ensuring that predicted impacts are commensurate with
actual impacts within the respective spatial LEPs, therefore protecting the associated EVs and EQOs.
Where desired levels are not being achieved contingency actions will be implemented to ensure the
permanent discharge of bitterns and associated engineering design are optimised for routine
operations, and Project related activities either meet or exceeds the predicted impacts within the defined
LEPs.
Purpose
The purpose of MEQ validation monitoring and management is to ensure that the predicted and
modelled impacts are accurate (model validation) and that actual Project impacts are within the limits
of acceptable change as defined for each LEP. This will ensure that the defined EVs and EQOs are not
compromised by operational activities associated with the Mardie Project once typical conditions have
been reached (i.e. completion of the commissioning phase).
Environmental Quality Criteria
As the purpose of this phase is to validate predictive modelling, determining final toxicity and dilution
factors required to protect MEQ at LEP boundaries, only EQGs are applicable to this Phase. The
preliminary EQGs are presented in Table 6-7. These are based upon the ANZG (2018) species
protection levels for toxicants in water at protection levels commensurate with Table 5-1. These are
intended, within this version of the MEQMMP, as a guide only and are subject to review at the
completion of the Phase I baseline data collection program.

Mardie Minerals Ltd Mardie Project: Marine Environmental Quality Monitoring & Management Plan
18WAU-0002 / R190108
73
Table 6-7 Preliminary EQGs for Marine Environmental Quality Validation – Phase III
EQI Units EQG
Low Moderate High Maximum
Temperature
pH
Salinity
Electrical Conductivity
Turbidity
Dissolved Oxygen
Various To be calculated upon completion of Phase I in accordance with Figure 5-2 and as outlined within Table 5-1.
Where appropriate EQGs will be determined for surface and seafloor.
No detectable change from natural
background
Impact < reference 95th percentile
Impact < reference 95th percentile
Aluminium (μg/L) Impact <
Reference 99th percentile
Impact < reference 95th
percentile
Impact < reference 80th percentile
Arsenic (III/V) (μg/L) Impact <
Reference 99th percentile
Impact < reference 95th percentile
Impact < reference 80th percentile
Boron (μg/L) Impact <
Reference 99th percentile
Impact < reference 95th percentile
Cadmium1 (μg/L) 36 14 0.7
Copper1 (μg/L) 8 3 0.3
Lead1 (μg/L) 12 6.6 2.2
Mercury1 (μg/L) 1.4 0.7 0.1
Vanadium1 (μg/L) 280 160 50
Zinc1 (μg/L) 43 23 7
TRH C6-C14 (μg/L) 25 25 25
TRH C15-C36 (μg/L) 100 100 100
BTEXN1
- Benzene
- Toluene
- Ethylbenzene
- Xylene2
- Napthalene
(μg/L)
1300
330
160
150
120
900
230
110
100
90
500
110
50
50
50
Hydroxide Alkalinity as CaCO3
Carbonate Alkalinity as CaCO3
Bicarbonate Alkalinity as CaCO3
Total Alkalinity as CaCO3
Total Hardness as CaCO3
(mg/L) To be calculated upon completion of Phase I in accordance
with Figure 5-2 and as outlined within Table 5-1
Total Anions
Total Cations
Ionic Balance
(meq/L)
(meq/L)
(%)
To be calculated upon completion of Phase I in accordance with Figure 5-2 and as outlined within Table 5-1
Cations:
Calcium
Magnesium
(mg/L) To be calculated upon completion of Phase I in accordance
with Figure 5-2 and as outlined within Table 5-1

Mardie Minerals Ltd Mardie Project: Marine Environmental Quality Monitoring & Management Plan
18WAU-0002 / R190108
74
EQI Units EQG
Low Moderate High Maximum
Sodium
potassium
Anions:
Chloride
Fluoride
Sulphate
(mg/L) To be calculated upon completion of Phase I in accordance
with Figure 5-2 and as outlined within Table 5-1
Notes: 1 Derived from ANZG (2018) DGVs for 99%, 90% and 80% SPL 2 Xylene based upon m-Xylene from ANZG (2018)
Management Triggers
In order to achieve the purpose, three levels of management triggers have been established which will
inform Management when contingency measures need to be put into place to ensure Project related
impacts are within the acceptable levels. Contingency measures specific to each validation program
are identified below and are typically based upon conducting an investigation to determine the cause
of any management trigger exceedances and implementing appropriate corrective actions to reduce
re-occurrence and where possible rectify the situation to ensure optimisation of Project related
processes.
The three levels of management triggers are based upon the maximum instantaneous flow rate, the
maximum predicted design concentration for constituents within the bitterns discharge and the EQC
defined within Table 6-7 for the constituents being monitored. The management trigger levels are
detailed below.
Management Trigger 1
Management trigger 1 is based upon the maximum instantaneous flow rate of:
0.69 m3/s constant discharge regime.
The management trigger level will be exceeded if the maximum instantaneous flow rate is exceeded,
thus enacting contingency management as described below.
Management Trigger 2
Management trigger 2 is based upon maximum discharge concentrations of:
325 ppt salinity of the pre-diluted bitterns waste; and
85.4 ppt salinity of the 5 times diluted bitterns waste at the outfall.
Adjusted management trigger levels may be revised accordingly to ensure they are appropriately set.
If any management triggers are breached contingency management as described below will be
required.

Mardie Minerals Ltd Mardie Project: Marine Environmental Quality Monitoring & Management Plan
18WAU-0002 / R190108
75
Management Trigger 3
Management Trigger 3 are defined as the EQCs and are based upon assessment against MEQ
samples collected at the LEPA/MEPA or MEPA/HEPA boundaries or within the LEPs.
MEQ samples collected from designated sample locations are to be assessed against the EQCs
presented within Table 6-7, noting these are preliminary and subject to review at the completion of
Phase I. The validation monitoring will ensure that the required level of species protection is being met
at each of the LEP boundaries.
Where an exceedance of any of the EQCs occur contingency management as described in the following
sections will be required.
Whole Effluent Toxicity Testing
Purpose
The purpose of WET testing is to identify the specific toxicity of the bitterns wastewater under accredited
laboratory conditions, using indigenous selected species. WET testing results will provide an
assessment of the dilution factors required to be achieved on bitterns outfall wastewater to achieve the
species protection levels defined within Table 3-3.
Results from the WET testing will also be used along with results from the toxicant concentration
assessment (Section 6.4.6) to further define and revise the EQCs for ongoing operational performance
assessment (Section 6.5).
Sampling Design
WET testing has been undertaken of the prototype bitterns discharge effluent by ESA. Once the
commissioning phase of the Project nears completion WET testing will be undertaken when water
quality of the discharge is considered to be within design specifications and therefore representative of
actual conditions experienced during routine operations. WET testing will be conducted twice on
samples taken directly from the raw bitterns namely:
1. towards the finalisation of Project commissioning to identify the toxicity of the bitterns
under normal operating conditions; and
2. within 12 months of commission to validate routine operational discharge.
Additional WET testing will also be required at any time during which the Project process is altered in
any way, thus potentially altering the levels of constituents and therefore possibly the toxicity within the
discharge stream.
The proposed WET testing sampling program will involve two processes namely:
1. Range finding test for toxicity to determine if the effluent is toxic and if so, determine
the appropriate concentration range for subsequent tests, and
2. Definitive toxicity testing to determine the 50% Effect Concentration (EC50), 50%
Inhibitory Concentration (IC50), 50% Lethal Concentration (LC50) and No Observed
Effect Concentration (NOEC) values of effluent for selected species.

Mardie Minerals Ltd Mardie Project: Marine Environmental Quality Monitoring & Management Plan
18WAU-0002 / R190108
76
WET testing is proposed to be undertaken on a minimum of five (5) locally relevant species from four
(4) taxonomic groups. Testing will be in accordance with laboratory NATA accredited methodologies
and in accordance with ANZG (2018) toxicity sampling and testing protocols. The proposed tests and
locally relevant species identified for WET testing are listed below:
1. 48-hour larval development test: Saccostrea echinate (Milky Oyster).
2. 96-hr toxicity test: Melita plumulosa (Amphipod).
3. 8-day Sea anemone pedal lacerate development test: Aiptasia pulchella
4. 72-hr sea urchin larval development test: Heliocidaris tuberculata.
5. 96-hr Fish Imbalance toxicity test: Lates calcarifer (Barramundi).
6. 7-hr Fish Imbalance and biomass toxicity test: Lates calcarifer.
7. 72-hr marine algal growth test: Nitzschia closterium.
The above tests will be validated closer to the time in collaboration with the preferred laboratory to
ensure appropriateness of the selected tests and to determine availability of the selected species. If
new tests or other species are identified in collaboration with the laboratory then the above WET tests
may be revised accordingly.
Sampling Methodology
Samples for WET testing will be collected directly from the raw bitterns prior to any dilutions at the point
directly before it enters the discharge pipe. Samples will be collected in laboratory supplied sample
containers and in accordance with sampling instructions and ANZG (2018) protocols. Typically, this
involves filling plastic sample bottles (~2.5 L) from the bitterns sump once normal operational processes
are established and normal discharges are occurring. Samples are typically required to be chilled and
transported to the laboratory within stipulated timeframes. Diluent water will be collected from a source
within the HEPA that has been determined to have no impacts from the outfall discharge (i.e. through
interpreting modelling results) from a depth equal to the outfall diffuser. Samples will be transported
directly to the laboratory to ensure ecotoxicity testing can occur as soon as practicable after sample
collection.
Data Assessment and Reporting
WET testing results may be used to re-run the predictive modelling and refine the spatial application of
the mixing zone and designation of the LEPs.
Data Validation and Quality Control
All data is required to be validated prior to the release of any monitoring reports to confirm that data
has been entered correctly. Data entry is to be checked and verified against raw data logs and
laboratory reports by an independent person.
An assessment of quality control data needs to be undertaken and included in all reports including:
Laboratory QA/QC results.

Mardie Minerals Ltd Mardie Project: Marine Environmental Quality Monitoring & Management Plan
18WAU-0002 / R190108
77
Data Assessment
Ecotoxicity testing results will be entered into a software program (e.g. BurrilOZ) to calculate the value
required to achieve a 90% SPL at the boundary of the LEPA/MEPA and a 99% SPL at the boundary of
the MEPA/HEPA. These results will be used to validate, or as a basis for review, of the defined spatial
LEPs as presented within this Plan. They will also be used to further define and review EQCs. This
process is defined in the following section (Section 6.4.6).
Reporting
At the completion of each WET Testing round a validated laboratory report and interpreted tabulated
results will be submitted to BCI.
A summary report will be compiled at the completion of any WET testing requirements which will
include, but not be limited to:
Summary of the methods applied and any deviations from this MEQMMP;
A table summarising laboratory analysis results;
An interpretation of the raw date from the software program used (i.e. BurrilOZ);
Analysis of results against predictive modelling with respect to dilution contour modelling and
spatial allocation of LEPs with the mixing zone boundary required to meet the 99% SPL; and
Any actions or recommendations required as a result of field implementation of the SAP and
assessment of monitoring data.
Bitterns Discharge Validation Testing
Purpose
The purpose of the bitterns discharge validation testing is to ensure that:
the optimal design targets for bitterns constituents are being achieved once the Project has
completed commissioning; and
actual toxicant concentrations are determined within the bitterns to adequately inform the
determination of the final EQCs.
Bitterns discharge validation testing will also provide an indication of the level of variability of salinity
and toxicant concentrations likely to be present within the bitterns discharge, thus allowing a definitive
prediction of the levels of impacts from routine discharges to be predicted.
Results from the salinity and toxicant concentration assessment will be used along with WET testing
(Section 6.4.5) to further define and revise the EQCs for ongoing operational performance assessment
(Section 6.5).
Sampling Design
Bitterns discharge validation monitoring will require continuous flow rate monitoring during discharge
and water samples to be collected from the bitterns discharge at two locations prior to discharge weekly
for a period of six weeks post commissioning. Samples will be collected concurrently with the MEQ

Mardie Minerals Ltd Mardie Project: Marine Environmental Quality Monitoring & Management Plan
18WAU-0002 / R190108
78
monitoring surveys so that the actual discharge waters can be compared against the water quality
results obtained at sampling location around the outfall.
Sampling Methodology
Bitterns diffuser outfall commissioning monitoring will require continuous flow rate monitoring during
discharge and water samples to be collected from the raw bitterns wastewater sump and at the diffuser
outfall weekly for a period of six weeks post commissioning. Samples will be collected concurrently with
the MEQ monitoring surveys so that the actual discharge waters can be compared against the water
quality results obtained at sampling location around the outfall.
Two duplicate water samples will be collected weekly from the following two locations:
Direct grab sampling from the raw bitterns wastewater sump directly prior to discharge; and
Direct grab sampling from the pipeline at the closest point to final discharge and where five
dilutions with seawater has occurred.
Samples will be collected directly into laboratory supplied sample bottles at each location. Sampling will
be undertaken in accordance ANZG (2018) for water quality sampling with QA/QC samples requiring a
transport blank.
Water samples will be sent to a NATA accredited laboratory for analysis of salinity and a broad suite of
toxicants which be used to further refine and define the final EQCs for ongoing monitoring programmes.
Laboratory QA/QC requirements will be undertaken in accordance with the NATA accreditation and
reported with the sample results.
Laboratory analysis of water samples will include:
Ionic balance:
o Alkalinity and Hardness;
o Calcium, Magnesium, sodium, potassium cations;
o Chloride, fluoride and sulphate anions
Hydrocarbons (TRH, TPH and BTEXN); and
Dissolved Metals and Metalloids (Al, As, Ba, Bo, Br, Cd, Cu, Hg, Li, Mo, Pb, Sr, Zn, V).
Data Assessment and Reporting
Data Validation and Quality Control
All data is required to be validated prior to the release of any monitoring reports to confirm that data
has been entered correctly. Data entry is to be checked and verified against raw data logs and
laboratory reports by an independent person.
An assessment of quality control data needs to be undertaken and included in all reports including:
Assessment of field contamination (transport blank);
Assessment of variability (duplicate);
Laboratory QA/QC results.

Mardie Minerals Ltd Mardie Project: Marine Environmental Quality Monitoring & Management Plan
18WAU-0002 / R190108
79
Data Assessment
Laboratory analysed results will be compared with the previously defined management triggers as soon
as practicable. Any elevation will require contingency actions as described below to be implemented.
At the completion of the six-week period and in combination with WET testing results define and
calculate the values which will become represent salinity and toxicant in water EQSs for ongoing
bitterns outfall performance assessment. These will be derived according to the following process:
WET testing results will be used to determine species protection values using a species
sensitivity distribution using Burrlioz 2.0 software in accordance with ANZECC/ARMCANZ
2000 guidelines to determine the number of dilutions required at each LEP boundary.
Interrogate concentrations of salinity and toxicant data from bitterns wastewater samples to:
o Identify toxicants which are concentrated above ANZG (2018) guidelines and select
toxicants suitable to act as EQCs for assessment of EQIs at LEP boundaries;
o Determine the 80th percentile for salinity and each toxicant within the sampling dataset;
o Using dilution factors as determined from WET testing, calculate toxicant and salinity
concentrations for each LEP boundary; and
Revise the MEQMMP to incorporate these values as the defined final EQSs for operational
performance assessment of the bitterns outfall.
Reporting
At the completion of each sampling round a validated laboratory report and interpreted tabulated data
will be submitted to BCI.
An investigation report will be compiled in accordance with BCI Environmental Management System
for any elevated results which requires investigation. Submission to the regulator will be subject to
project approval conditions.
A comprehensive report will be developed at the completion of the validation monitoring which will
include, but not be limited to:
Summary of the methods applied and any deviations from this MEQMMP;
Timeseries graphs of physicochemical water column profiles;
A table summarising laboratory analysis results;
Timeseries graphs of laboratory analysis results;
An assessment of all data collected against management triggers;
A review of management trigger exceedances investigations and remedial actions
implemented;
Any actions or recommendations required as a result of field implementation of the MEQMMP
and assessment of monitoring data; and
Calculation and presentation of final EQCs (along with WET testing results) which will be used
for Ongoing Operational Performance Monitoring as per Section 6.5.

Mardie Minerals Ltd Mardie Project: Marine Environmental Quality Monitoring & Management Plan
18WAU-0002 / R190108
80
Marine Environmental Quality Validation Monitoring
Purpose
The purpose of the MEQ validation is to provide an assessment of environmental performance to
identify if the defined EQCs are being met within their respective LEPs. Results will also be used to
determine if the modelled bitterns constituent concentrations and predicted dilution factors are being
achieved at the LEPA/MEPA and MEPA/HEPA boundaries.
Sampling Design
Table 6-8 provides a summary of the proposed sampling frequency.
Table 6-8 Monitoring Frequency for EQC Validation Monitoring
Monitoring Event Frequency Commencement Completion
Water Quality Sampling Weekly End of Commissioning 6 weeks post commissioning
Physico-chemical Water Quality Profiling
Weekly End of Commissioning 6 weeks post commissioning
In-Situ Physico-chemical Monitoring
Continuous End of Commissioning 6 weeks post commissioning
Physical Observations Weekly End of Commissioning 6 weeks post commissioning
The program includes a total of 19 MEQ monitoring locations, including:
o Six (6) sites at the LEPA/MEPA boundary;
o Eight (8) sites at the MEPA/HEPA boundary; and
o Five (5) sites within the HEPA.
Details of the 19 monitoring locations and associated routine sampling tasks to be completed at each
location are presented in Table 6-9 and displayed in Figure 6-3.

Mardie Minerals Ltd Mardie Project: Marine Environmental Quality Monitoring & Management Plan
18WAU-0002 / R190108
81
Table 6-9 Marine Environmental Quality Monitoring Locations and Associated Routine Sampling Tasks for MEQ Validation
Site
Name Site Reference
Level of
Ecological
Protection
Easting
(GDA94
MGA50)
Northing
(GDA94
MGA50)
Routine Sampling Tasks
Ph
ysic
al
Ob
serv
ati
on
s
Ph
ysic
o-c
hem
ical
Wate
r C
olu
mn
Pro
fili
ng
G
en
era
l W
ate
r
Sam
ple
An
aly
sis
In-s
itu
Ph
ysic
och
em
ical
Mo
nit
ori
ng
MLB1-6
These sites are located on the LEPA/MEPA boundary. They are positioned within the predicted bitterns outfall plume as modelled by Baird (2020a) to
ensure impacts are within the predictions and the LEP. They also represent potential impact boundaries from the Offshore Shipping Facility
Moderate
389583.4
389661.9
389693.6
389595.6
389534.3
389454.1
7673064.5
7673378.3
7673081.6
7672206.6
7672059.9
7672198.1
X X X X1
MMB1-8 These sites are located on the MEPA/HEPA boundary. They are positioned within the predicted bitterns outfall plume as modelled by Baird (2020a) to
ensure impacts are within the predictions and the LEP. High
389612.5
389684.9
389719.4
389895.9
389893.2
389529.4
389174.2
389298.4
7673446.5
7673542.6
7673454.8
7672749.8
7672216.9
7671801.9
7672168.4
7672704.6
X X X
MH1-4
Sites MH1-4 are outside of the predicted bitterns outfall plume as modelled by Baird (2020a) to ensure impacts are within the predictions and the LEP.
They also collectively provide an assessment of any measured change within the High LEP from the Offshore Shipping Facility.
High
Maximum (MH4)
388640.0
389076.1
390650.1
389338.8
7672814.3
7674293.2
7672847.0
7670946.0
X X X

Mardie Minerals Ltd Mardie Project: Marine Environmental Quality Monitoring & Management Plan
18WAU-0002 / R190108
82
Site
Name Site Reference
Level of
Ecological
Protection
Easting
(GDA94
MGA50)
Northing
(GDA94
MGA50)
Routine Sampling Tasks
Ph
ysic
al
Ob
serv
ati
on
s
Ph
ysic
o-c
hem
ical
Wate
r C
olu
mn
Pro
fili
ng
G
en
era
l W
ate
r
Sam
ple
An
aly
sis
In-s
itu
Ph
ysic
och
em
ical
Mo
nit
ori
ng
MIS1 This site is located within the dredge channel where the bathymetry is
naturally deeper than the proposed channel depth and there is the potential for the plume to disperse out of the channel.
High 389736.0 7674275.2 X X X
1: In-situ physicochemical monitoring undertaken at MLB4 and MLB6 only

Mardie Minerals Ltd Mardie Project: Marine Environmental Quality Monitoring & Management Plan
18WAU-0002 / R190108
83
Figure 6-3 Bitterns Outfall and Offshore Marine Facilities Sites for Validation Sampling

Mardie Minerals Ltd Mardie Project: Marine Environmental Quality Monitoring & Management Plan
18WAU-0002 / R190108
84
Sampling Methodology
Sampling methodologies for the following activities will be conducted in accordance with the protocols
outlined within Section 6.2.5:
Physical Observations; and
Physico-chemical water column profiles.
In-situ physicochemical sampling and water quality sampling activities will be undertaken in accordance
with the protocol described below.
Sampling dates and times will be scheduled to ensure that a range of tidal conditions, including
coverage of neap and spring tides, incorporating incoming and outgoing tidal regimes, are assessed.
In-situ Water Quality Sampling and Analysis
A range of instruments will be deployed at two (2) monitoring locations as identified within Table 6-9 to
record in-situ physiochemical parameters, each attached to purpose-designed seabed frames. The in-
situ loggers will record the following parameters:
Electrical Conductivity
Salinity
Temperature
Depth/Pressure
Photosynthetically Active Radiation (PAR)
Temperature
Turbidity (NTU)
The seabed frames are designed to stand upright on the seabed, while maintaining the instruments at
approximately 0.3 m above the seafloor and to reduce the likelihood of interaction of sensors with
sediment, large rocks and rubble on the seafloor.
Water quality instrument maintenance & calibration is typically conducted regularly (i.e. typically every
6 weeks), however as this will be a six weekly deployment maintenance and calibration will be
conducted prior to deployment. Maintenance, calibration checks and data download/backup are carried
out in line with manufacturer specifications and QA/QC protocols. Where calibration checks are not
satisfactory, a new calibration is performed as per manufacturer specification.
Water Sample Collection
Water samples will be collected at all 19 sampling locations identified within Table 6-9. Water samples
will be collected from three separate depths, as required to validate and identify modelled stratification
(Baird 2020). The following samples will be collected:
0.5m below surface;
Middle of water column; and
0.5m above seafloor.

Mardie Minerals Ltd Mardie Project: Marine Environmental Quality Monitoring & Management Plan
18WAU-0002 / R190108
85
Samples will be collected using an electronic water sample pump or niskin bottle to collect the required
volume of water from each of the depths identified above.
The water sampler will be rinsed with Decon solution (or equivalent) between samples. Water samples
will be collected in suitable (laboratory supplied) bottles and immediately stored on ice for transport to
a National Association of Testing Authorities (NATA) accredited laboratory for analysis.
All sample containers will be marked with a unique identifier, the date/time and the sampler’s name and
clarification that the samples are marine water using a waterproof permanent maker. All samples will
then be listed on a Chain of Custody (CoC) form to be included with the samples sent to the laboratories.
Laboratory Analysis
General water sample analysis will be performed on samples collected. These samples are required to
be analysed by a NATA-accredited laboratory for the following parameters;
Ionic balance:
o Alkalinity and Hardness;
o Calcium, Magnesium, sodium, potassium cations;
o Chloride, fluoride and sulphate anions
Total Recoverable Hydrocarbons (TRH);
Total Petroleum Hydrocarbons (TPH);
BTEXN; and
Dissolved Metals and Metalloids.
Field Quality Assurance & Quality Control
All water quality meters are to be in calibration. If monitoring equipment is hired, calibration certificates
are to be provided from the supplier. Calibration records are to be saved and attached as an appendix
to compliance reports.
The following Quality Assurance & Quality Control (QA/QC) Samples should be collected as described
below:
A duplicate sample is to be collected at the same site as two (2) of the primary monitoring
samples. The purpose of the sample is to confirm that the primary laboratory is able to
produce consistent results when analysing the same sample. The site where it was taken is to
be recorded but not reported to the laboratory. Ideally it should be collected at a site that is
expected to have higher levels of contamination (based on historic data and potential sources
of contamination) as this will confirm a wider range of analytes and reduce the level of
instrument error when comparing larger concentrations.
A field split sample is collected at the same site as the duplicates and sent to a secondary
laboratory for analysis. The purpose of this sample is to confirm that intra-laboratory analysis
of the sample produces consistent results.
A rinsate sample is collected to confirm that cross contamination doesn’t occur during the
sampling processes in the field. The rinsate sample should be taken after the decontamination
process of the sample collection container by running deionised water over the container and
collecting it in laboratory provided bottles.

Mardie Minerals Ltd Mardie Project: Marine Environmental Quality Monitoring & Management Plan
18WAU-0002 / R190108
86
Laboratory Quality Assurance & Quality Control
Laboratories used for water sample analysis must be NATA accredited. Comprehensive QA/QC testing
of water samples should be undertaken in accordance with NATA accreditation and include testing of
laboratory control samples, method blanks, matrix spikes, laboratory duplicates and surrogate recovery
outliers (where applicable).
Data Assessment and Reporting
Data Validation
All data is required to be validated prior to the release of any monitoring reports to confirm that data
has been entered correctly. Data entry is to be checked and verified against raw data logs and
laboratory reports by an independent person.
Quality Control
An assessment of quality control data needs to be undertaken and included in all reports including:
Assessment of field contamination (rinsate, transport blank and method blank);
Assessment of field variability (duplicate and triplicate);
Assessment of lab variability (triplicate);
Laboratory QA/QC results.
Data Assessment
Compliance with the preliminary EQGs (Table 6-7) for the respective LEP at each sample location will
be assessed through a comparison of the median results for each parameter from the commissioning
and six-week post-commissioning phases. Data from the commissioning phase and medians for each
parameter calculated from the six-week dataset for each site from the post commissioning phase will
be compared directly to the EQCs. Results for each individual site will be compared to the relevant
guideline value or the relevant Reference percentile. Reference percentiles will be calculated from the
six-week median for each individual Reference site.
Reporting
At the completion of each sampling round a validated laboratory report and interpreted tabulated data
will be submitted to BCI Minerals.
An investigation report will be compiled in accordance with BCI Minerals Environmental Management
System for any elevated results which require investigation. Submission to the regulator will be subject
to project approval conditions.
A comprehensive report will be compiled at the completion of the validation phase which will include,
but not be limited to:
Summary of the methods applied and any deviations from this MEQMMP;
Timeseries graphs of physicochemical water column profiles;
A table summarising laboratory analysis results;
Timeseries graphs of laboratory analysis results;

Mardie Minerals Ltd Mardie Project: Marine Environmental Quality Monitoring & Management Plan
18WAU-0002 / R190108
87
An assessment of all data collected against management triggers;
A review of management trigger exceedances investigations and remedial actions
implemented; and
Any actions or recommendations required as a result of field implementation of the SAP and
assessment of monitoring data.
Sample Preservation, Storage and Holding Times
Analytical Limits of Reporting (LoRs) should be appropriate to provide suitable detection levels as
appropriate to allow comparison with ANZG (2018) or DEC (2006) guidelines for baseline monitoring
and for the purposes of establishing site specific EQC at the completion of baseline monitoring.
Storage and holding times need to be confirmed with the laboratory prior to sampling to ensure the
sampling program is compliant with specified standards
Contingency Management
In the event that the Project related impacts exceed the desired management trigger levels a range of
operational and design solutions will be investigated. Firstly, depending upon the exceedance, an
investigation needs to be undertaken to determine the cause(s). Once the cause(s) is determined then
appropriate corrective or preventative actions need to be implemented to ensure re-occurrence does
not occur. This system of investigation and implementation of remedial actions will ensure that during
the post-commissioning phase all possible design or process modifications are established to ensure
optimal performance of the process for ongoing operations.
There are several potential operational and design solutions which may be used as contingency
measures in response to management trigger exceedances. Figure 6-4 provides an overview of the
contingency response and management framework to be applied during MEQ validation for the Mardie
Project.

Mardie Minerals Ltd Mardie Project: Marine Environmental Quality Monitoring & Management Plan
18WAU-0002 / R190108
88
Figure 6-4 Post-commissioning brine discharge quality validation contingency management.

Mardie Minerals Ltd Mardie Project: Marine Environmental Quality Monitoring & Management Plan
18WAU-0002 / R190108
89
Routine Operational Performance Assessment
Context
To determine any actual impacts from routine operational activities associated with the Mardie Project,
a comprehensive MEQ monitoring and management program has been designed. This program
comprises two smaller components which each have a different purpose, methodologies and
contingency actions. These components include:
Ongoing assessment of bitterns discharge quality against design specifications; and
Ongoing MEQ monitoring to ensure that potential impacts from operational activities are
occurring within the limits of acceptable change allocated within each spatial LEP.
Management during ongoing operations will be focused on ensuring that the predicted levels of impact
within the defined spatial LEPs are achieved, therefore protecting the associated EVs and EQOs.
Where desired levels are not being achieved contingency actions will be implemented to ensure the
impacts are restricted, investigated and remediated through implementing a course of actions. At this
stage compliance reporting requirements will also be stipulated, with outcomes from these monitoring
programs reported against their objectives and criteria and submitted, as required, to the regulator.
Purpose
The purpose of the routine operational performance assessment is to determine if typical operational
activities associated with the Mardie Project are compliant with defined management triggers and that
no temporal impacts are being observed. To determine if operations are impacting MEQ the following
two monitoring and assessment programs will be implemented:
1. Bitterns Discharge Quality; and
2. Ongoing MEQ Monitoring.
Environmental Quality Criteria
Environmental Quality Guidelines
EQGs for routine MEQ monitoring are currently preliminary and subject to review at the completion of
Phase I and Phase III data collection. The EQGs presented below are therefore considered a guide at
this early stage of the program.
The final EQGs will be based upon baseline data collected through Phase I and WET testing and
toxicant analysis of the bitterns undertaken during Phase III. Also review of this MEQSAP at the
completion of Phase will ensure that all risks from operational activities associated with the project are
included within the final EQGs presented below.
Water Quality
The preliminary EQGs are presented within Table 6-7. At the completion of Phase I and Phase III these
will be reviewed accordingly and the final set of EQGs will be determined and presented below.

Mardie Minerals Ltd Mardie Project: Marine Environmental Quality Monitoring & Management Plan
18WAU-0002 / R190108
90
Sediment Quality
The preliminary EQGs for sediment quality are presented within Table 6-10. Where levels are elevated
additional testing for bioavailability is required. EQGs for bioavailability testing are presented in Table
6-11.
Table 6-10 Preliminary EQGs for routine Marine Environmental Quality Monitoring – Sediment Sampling
EQI Units EQG
Low Moderate High Maximum
Aluminium1 mg/kg 6150 4100 4100
No detectable change from natural background
Arsenic1 mg/kg 20 20 20
Boron mg/kg To be calculated upon completion of Phase I in accordance with Figure 5-2 and as outlined
within Table 5-1
Cadmium1 mg/kg 1.5 1.5 1.5
Copper1 mg/kg 65 65 65
Lead1 mg/kg 50 50 50
Mercury1 mg/kg 0.15 0.15 0.15
Vanadium1 mg/kg 54 36 36
Zinc1 mg/kg 200 200 200
TRH2
Total
C6-C14
C15-C36
mg/kg
250
25
100
250
25
100
250
25
100
TPH3 mg/kg 280 280 280
BTEXN1
- Benzene
- Toluene
- Ethylbenzene
- Xylene2
- Napthalene
mg/kg To be calculated upon completion of Phase I in accordance with Figure 5-2 and as outlined
within Table 5-1
Diuron mg/kg To be calculated upon completion of Phase I in accordance with Figure 5-2 and as outlined
within Table 5-1
Chlorothalonil mg/kg To be calculated upon completion of Phase I in accordance with Figure 5-2 and as outlined
within Table 5-1 1 Derived from ANZG (2018) Default Guideline Values 2 Derived using the lowest limits of reporting available 3 Sum of TPHs derived from Simpson et al. ( 2013) as presented within ANZG (2018) Default Guideline Values

Mardie Minerals Ltd Mardie Project: Marine Environmental Quality Monitoring & Management Plan
18WAU-0002 / R190108
91
Table 6-11 Preliminary EQGs for routine Marine Environmental Quality Monitoring – Sediment Toxicity
Bioavailability Assessment
EQI Units EQG
Moderate High
Arsenic1 mg/kg 20 20
Cadmium1 mg/kg 1.5 1.5
Copper1 mg/kg 65 65
Boron mg/kg Median within 80th percentile of reference range
Lead1 mg/kg 50 50
Mercury1 mg/kg 0.15 0.15
Vanadium1 mg/kg Median within 80th percentile of reference range
Zinc1 mg/kg 200 200
TRH2
mg/kg C6-C9: 25
C10-C14: 25
C15-C28: 100
C29-C36: 100
TRH: 250
C6-C9: 25
C10-C14: 25
C15-C28: 100
C29-C36: 100
TRH: 250
Diuron mg/kg Median within 80th percentile of reference range
Chlorothalonil mg/kg Median within 80th percentile of reference range
Environmental Quality Standards
The establishment of EQS typically require a robust understanding of the spatial and temporal variation
of the indicators selected through which EQOs can be measured against to ensure the protection of
EVs. This information is currently limited upon which to derive scientifically robust values. In accordance
with ANZG (2018) the intention is to develop site specific EQS where currently no values exist, or where
default guideline values have been applied through assessment of baseline data collected in
accordance with this Plan or other Mardie Project monitoring programs (e.g. Mardie Operational
Environmental Management Plan).
EQS established in this Plan have been derived for EQI constituents identifies in Section 5.2 within the
following groups:
Toxicants and Stressors:
Salinity
Key toxicants (as determined by Phase III program)
Biological Condition:
Toxicants in biota;
Condition of Benthic Communities and Habitat (BCH);
Condition of Benthic Infauna; and
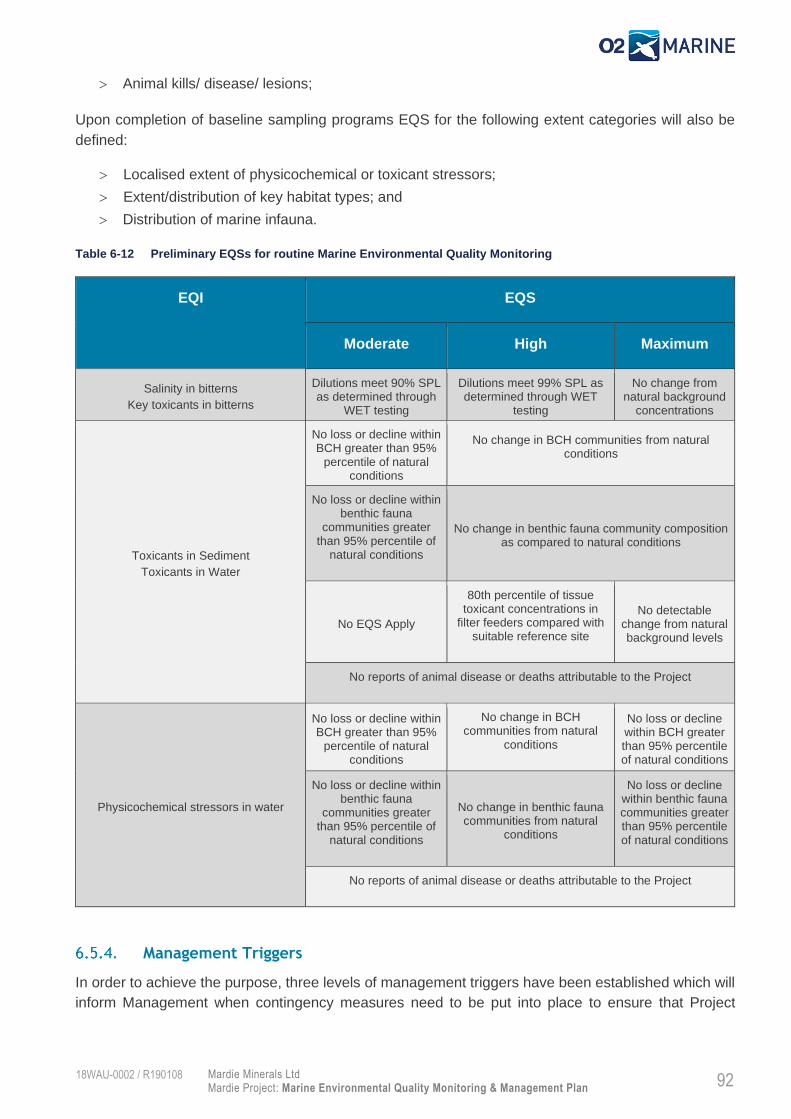
Mardie Minerals Ltd Mardie Project: Marine Environmental Quality Monitoring & Management Plan
18WAU-0002 / R190108
92
Animal kills/ disease/ lesions;
Upon completion of baseline sampling programs EQS for the following extent categories will also be
defined:
Localised extent of physicochemical or toxicant stressors;
Extent/distribution of key habitat types; and
Distribution of marine infauna.
Table 6-12 Preliminary EQSs for routine Marine Environmental Quality Monitoring
EQI EQS
Moderate High Maximum
Salinity in bitterns
Key toxicants in bitterns
Dilutions meet 90% SPL as determined through
WET testing
Dilutions meet 99% SPL as determined through WET
testing
No change from natural background
concentrations
Toxicants in Sediment
Toxicants in Water
No loss or decline within BCH greater than 95%
percentile of natural conditions
No change in BCH communities from natural conditions
No loss or decline within benthic fauna
communities greater than 95% percentile of
natural conditions
No change in benthic fauna community composition as compared to natural conditions
No EQS Apply
80th percentile of tissue toxicant concentrations in
filter feeders compared with suitable reference site
No detectable change from natural background levels
No reports of animal disease or deaths attributable to the Project
Physicochemical stressors in water
No loss or decline within BCH greater than 95%
percentile of natural conditions
No change in BCH communities from natural
conditions
No loss or decline within BCH greater than 95% percentile of natural conditions
No loss or decline within benthic fauna
communities greater than 95% percentile of
natural conditions
No change in benthic fauna communities from natural
conditions
No loss or decline within benthic fauna communities greater than 95% percentile of natural conditions
No reports of animal disease or deaths attributable to the Project
Management Triggers
In order to achieve the purpose, three levels of management triggers have been established which will
inform Management when contingency measures need to be put into place to ensure that Project
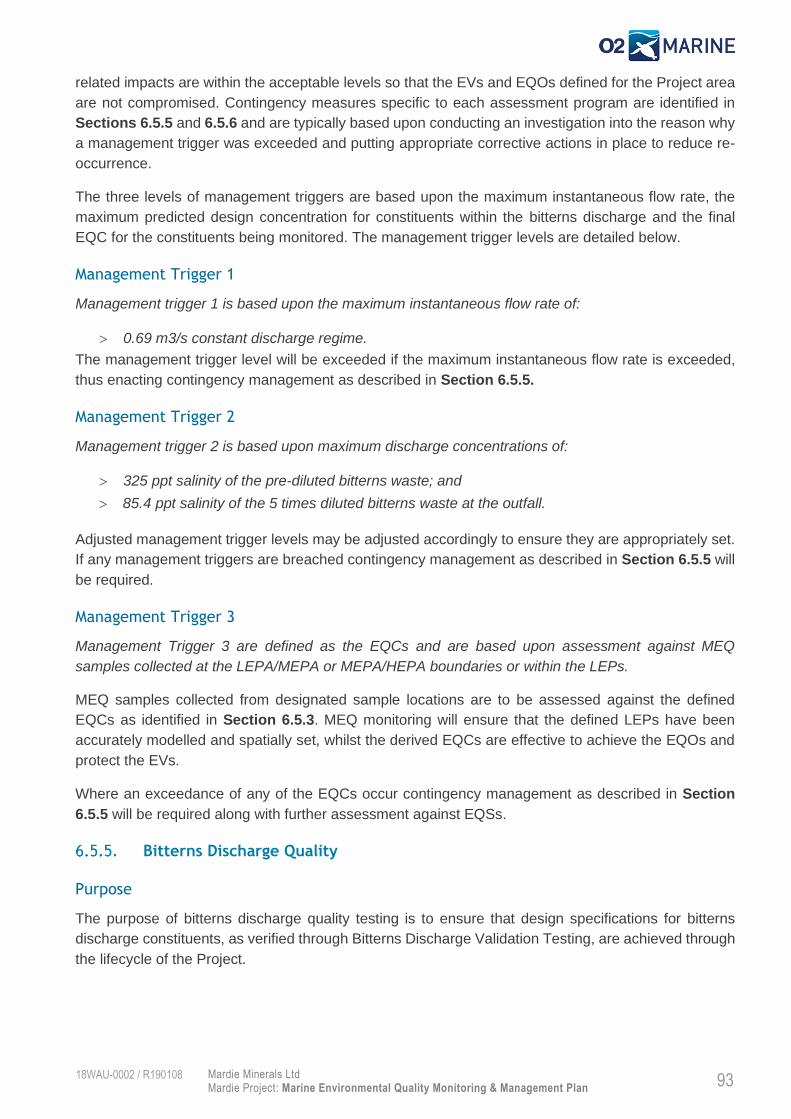
Mardie Minerals Ltd Mardie Project: Marine Environmental Quality Monitoring & Management Plan
18WAU-0002 / R190108
93
related impacts are within the acceptable levels so that the EVs and EQOs defined for the Project area
are not compromised. Contingency measures specific to each assessment program are identified in
Sections 6.5.5 and 6.5.6 and are typically based upon conducting an investigation into the reason why
a management trigger was exceeded and putting appropriate corrective actions in place to reduce re-
occurrence.
The three levels of management triggers are based upon the maximum instantaneous flow rate, the
maximum predicted design concentration for constituents within the bitterns discharge and the final
EQC for the constituents being monitored. The management trigger levels are detailed below.
Management Trigger 1
Management trigger 1 is based upon the maximum instantaneous flow rate of:
0.69 m3/s constant discharge regime.
The management trigger level will be exceeded if the maximum instantaneous flow rate is exceeded,
thus enacting contingency management as described in Section 6.5.5.
Management Trigger 2
Management trigger 2 is based upon maximum discharge concentrations of:
325 ppt salinity of the pre-diluted bitterns waste; and
85.4 ppt salinity of the 5 times diluted bitterns waste at the outfall.
Adjusted management trigger levels may be adjusted accordingly to ensure they are appropriately set.
If any management triggers are breached contingency management as described in Section 6.5.5 will
be required.
Management Trigger 3
Management Trigger 3 are defined as the EQCs and are based upon assessment against MEQ
samples collected at the LEPA/MEPA or MEPA/HEPA boundaries or within the LEPs.
MEQ samples collected from designated sample locations are to be assessed against the defined
EQCs as identified in Section 6.5.3. MEQ monitoring will ensure that the defined LEPs have been
accurately modelled and spatially set, whilst the derived EQCs are effective to achieve the EQOs and
protect the EVs.
Where an exceedance of any of the EQCs occur contingency management as described in Section
6.5.5 will be required along with further assessment against EQSs.
Bitterns Discharge Quality
Purpose
The purpose of bitterns discharge quality testing is to ensure that design specifications for bitterns
discharge constituents, as verified through Bitterns Discharge Validation Testing, are achieved through
the lifecycle of the Project.

Mardie Minerals Ltd Mardie Project: Marine Environmental Quality Monitoring & Management Plan
18WAU-0002 / R190108
94
Sampling Design and Methodology
Bitterns discharge quality monitoring will be conducted in accordance with Section 6.4.6 with the
following deviation:
Samples are to be collected biannually for a period of two years, or as applicable in
accordance with specific Project approval conditions; and
During any time which the wastewater treatment plant alters the bitterns discharge in any way.
Data Assessment and Reporting
Data collected will require immediate comparison with management triggers identified above. Any
elevation will require contingency actions as described below.
Data Validation and Quality Control
All data is required to be validated prior to the release of any monitoring reports to confirm that data
has been entered correctly. Data entry is to be checked and verified against raw data logs and
laboratory reports by an independent person.
An assessment of quality control data needs to be undertaken and included in all reports including:
Assessment of field contamination (transport blank);
Assessment of variability (replicate);
Laboratory QA/QC results.
Data Assessment
Laboratory analysed samples and physico-chemical results will be compared with the previously
defined management triggers as soon as practicable. Any elevation will require contingency actions as
described below to be implemented.
Reporting
At the completion of each sampling round a validated laboratory report and interpreted tabulated data
will be submitted to BCI Minerals.
An investigation report will be compiled in accordance with BCI Minerals Environmental Management
System for any elevated results which requires investigation. Submission to the regulator will be subject
to project approval conditions.
A comprehensive report will be developed at the completion of the monitoring program which will
include, but not be limited to:
Summary of the methods applied and any deviations from this MEQMMP;
Timeseries graphs of physicochemical water column profiles;
A table summarising laboratory analysis results;
Timeseries graphs of laboratory analysis results;
An assessment of all data collected against management triggers;

Mardie Minerals Ltd Mardie Project: Marine Environmental Quality Monitoring & Management Plan
18WAU-0002 / R190108
95
A review of management trigger exceedances investigations and remedial actions
implemented; and
Any actions or recommendations required as a result of field implementation of the MEQMMP
and assessment of monitoring data.
Contingency Management
In the event that the treatment process is not meeting the desired management trigger levels a range
of operational and design solutions will be investigated. Firstly, depending upon the exceedance, an
investigation needs to be undertaken to determine the cause(s). Once the cause(s) is determined then
appropriate corrective or preventative actions need to be put into place to ensure re-occurrence does
not occur. This system of investigation and implementation of remedial actions will ensure that optimal
performance of the process continues through the lifecycle of the project.
There are several potential operational and design solutions which may be used as contingency
measures in response to management trigger exceedances. Figure 6-5 provides an overview of the
contingency response and management framework to be applied during routine operation of the Mardie
Project.
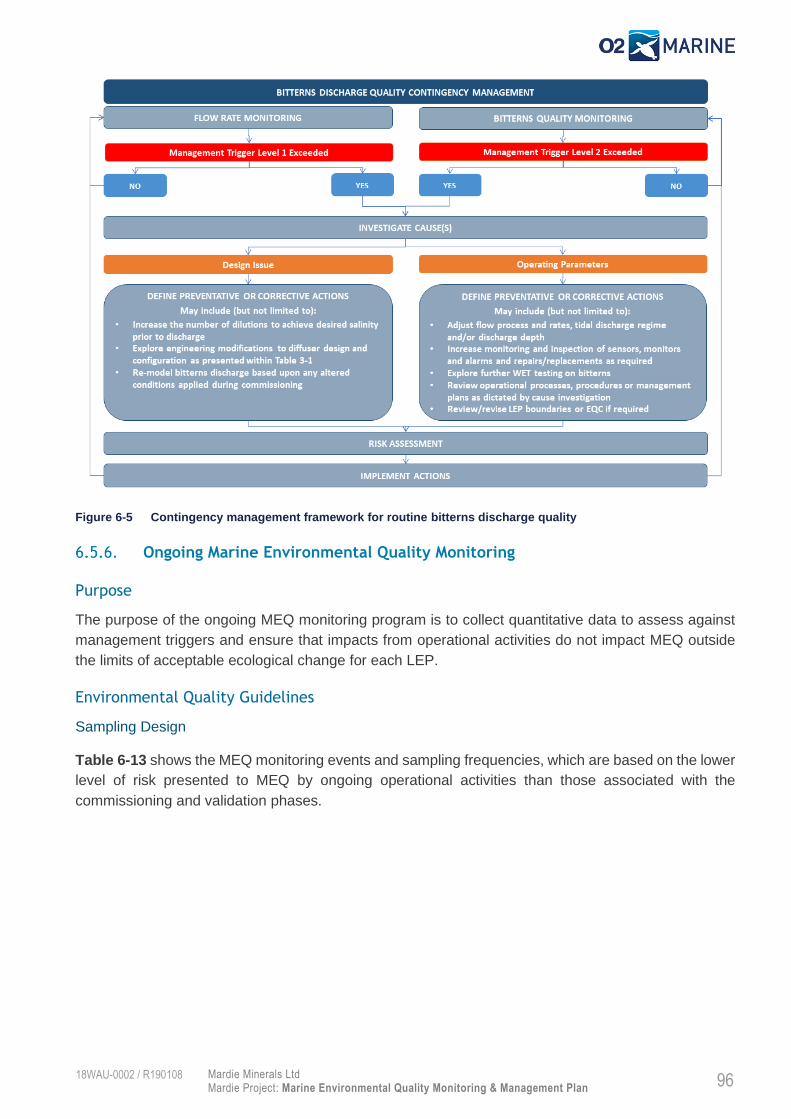
Mardie Minerals Ltd Mardie Project: Marine Environmental Quality Monitoring & Management Plan
18WAU-0002 / R190108
96
Figure 6-5 Contingency management framework for routine bitterns discharge quality
Ongoing Marine Environmental Quality Monitoring
Purpose
The purpose of the ongoing MEQ monitoring program is to collect quantitative data to assess against
management triggers and ensure that impacts from operational activities do not impact MEQ outside
the limits of acceptable ecological change for each LEP.
Environmental Quality Guidelines
Sampling Design
Table 6-13 shows the MEQ monitoring events and sampling frequencies, which are based on the lower
level of risk presented to MEQ by ongoing operational activities than those associated with the
commissioning and validation phases.

Mardie Minerals Ltd Mardie Project: Marine Environmental Quality Monitoring & Management Plan
18WAU-0002 / R190108
97
Table 6-13 Monitoring Frequency for Ongoing Marine Environmental Quality Monitoring
Monitoring Event Frequency No. Sample Sites Commencement
Water Sampling Quarterly 21 Post six-week validation period
Physico-chemical Water Quality Profiling
Quarterly 21 Post six-week validation period
Sediment Sampling Annually 21 Post six-week validation period
Physical Observations Quarterly 21 Post six-week validation period
The program includes a total of 21 MEQ monitoring locations, which are:
Bitterns outfall:
o Six (6) sites at the LEPA/MEPA boundary;
o Nine (9) sites at the MEPA/HEPA boundary; and
o Four (4) sites within the HEPA.
Mardie Creek:
o One (1) adjacent to the Mardie Creek small vessel launch facility within the HEPA.
Intake Creek:
o One potential impact site positioned adjacent to the seawater abstraction intake within
the HEPA.
Locations of the 21 monitoring locations are presented in Table 6-5 and Table 6-9 and displayed in
Figure 6-3 and Figure 6-6.

Mardie Minerals Ltd Mardie Project: Marine Environmental Quality Monitoring & Management Plan
18WAU-0002 / R190108
98
Figure 6-6 Seawater abstraction and small vessel facility MEQ monitoring locations

Mardie Minerals Ltd Mardie Project: Marine Environmental Quality Monitoring & Management Plan
18WAU-0002 / R190108
99
Sampling Methodology
Sampling methodologies for the sampling programs below will be conducted in accordance with the
protocols outlined in Section 6.2.5, with the exception for water sampling which will occur in accordance
the protocols outlined within Section 6.4.7. Sampling locations are described within Table 6-5 and
Table 6-9. The ongoing MEQ monitoring program comprise the following sampling programs:
General Observations;
Aesthetic Observations;
Physico-chemical Water Column Profiling;
Water Sample Collection; and
Sediment Sample Collection.
In addition, the following variations for water and sediment sample collection will apply.
Water Quality Sampling
Field Quality Assurance & Quality Control
The following Quality Assurance & Quality Control (QA/QC) Samples should be collected as described
below:
A duplicate sample is to be collected at the same site as two (2) of the primary monitoring
samples. The purpose of the sample is to confirm that the primary laboratory is able to
produce consistent results when analysing the same sample. The site where it was taken is to
be recorded but not reported to the laboratory. Ideally it should be collected at a site that is
expected to have higher levels of contamination (based on historic data and potential sources
of contamination) as this will confirm a wider range of analytes and reduce the level of
instrument error when comparing larger concentrations.
A field split sample is collected at the same site as the duplicates and sent to a secondary
laboratory for analysis. The purpose of this sample is to confirm that intra-laboratory analysis
of the sample produces consistent results.
A rinsate sample is collected to confirm that cross contamination doesn’t occur during the
sampling processes in the field. The rinsate sample should be taken after the decontamination
process of the sample collection container by running deionised water over the container and
collecting it in laboratory provided bottles.
Sediment Quality Sampling
Field Quality Assurance & Quality Control
The following QA/QC Samples should be collected as described below:
Triplicate samples (i.e. three separate samples taken with the sediment grab at the same
location) should be taken at three (3) site to determine the variability of the sediment physical
and chemical characteristics.
A field split sample (i.e. one sediment grab sample thoroughly mixed and then split into three
sub-samples) should be collected at collected at two (2) site to assess inter and intra-
laboratory variation, with one of the three samples sent to a second laboratory.

Mardie Minerals Ltd Mardie Project: Marine Environmental Quality Monitoring & Management Plan
18WAU-0002 / R190108
100
A transport blank (acid-washed silica sand) in a sealed jar should be provided by the
laboratory and taken to site but not opened. The transport blank is sent back to the laboratory
with the other samples and analysed. This blank is used to assess if any contamination is
already present in the acid-washed sand or container.
A method blank (acid-washed silica sand) should be used to assess the potential for
contamination during the sampling process. The method blank should be placed into the ‘van
Veen’ grab and processed identically to the usual sediment samples. The method blank
should be sent to the laboratory and analysed with the other samples to assess presence of
contamination during the processing procedures.
Toxicant Bioavailability Assessment
Elevated toxicants in sediment may be present in a variety of forms, however, only the bioavailable
fraction will impact organisms. Bioavailability testing assesses the availability of elevated toxicants
present within sediments for the uptake of organisms. Where total toxicants from routine sediment
analysis identify exceedances of the EQGs outlined within Table 6-10, a bioavailability analysis is
required for assessment against EQGs presented in Table 6-11.
Bioavailability tests comprise dilute acid extraction of toxicants under laboratory conditions. Therefore,
additional samples should be collected during routine sediment sampling to facilitate any additional
testing that may be required. If toxicant concentrations from bioavailability tests exceed the EQGs
(Table 6-11) further ecotoxicity or bioaccumulation testing will be required for comparison against
established EQS.
Environmental Quality Standards
Sampling Design
Sampling for assessment against EQSs is reactive program required at any time that the routine
monitoring program identifies exceedances above the final EQGs. Figure 6-7 presents the relationship
between EQG exceedances and reactive sampling programs which are required to be implemented.
Reactive sampling programs are required to determine the extent and severity of any impacts and
provide an assessment of whether the EQOs are compromised and if the EVs are at risk.
Mardie Minerals Ltd Mardie Project: Marine Environmental Quality Monitoring & Management Plan
18WAU-0002 / R190108
101
Figure 6-7 Routine Marine Environmental Quality Monitoring and Assessment Framework
Sampling Methodology
Toxicants in Biota
Bioaccumulation is a late stage testing and monitoring methodology within the phased approach
described in Figure 6-7. The objective of monitoring is to determine if toxicants are bioaccumulating at
a rate that could affect marine life and/or result in seafood being not safe for human consumption.
Initially, a desktop study will be to determine the likelihood/risk of contaminant bioaccumulation across
the Project study area. The desktop study will review the concentrations of any contaminant that has
exceeded the bioavailable EQSs and whether or not the contaminant is likely to bioaccumulate in locally
relevant species. Guidance procedures and assessment for bioaccumulation testing will follow Simpson
et al. (2005) and Simpson et al. (2008), and in the ASTM International guide E1688 (2016), Standard
Guide for Determination of the Bioaccumulation of Sediment-Associated Contaminants by Benthic
Invertebrates.
One or both of the following methods will be used for monitoring toxicants in biota, as appropriate:
Field collected and caged/transplanted organisms; and
Laboratory bioaccumulation test sampling.

Mardie Minerals Ltd Mardie Project: Marine Environmental Quality Monitoring & Management Plan
18WAU-0002 / R190108
102
Direct field collected and caged/transplanted organisms involve measuring any toxicants accumulating
in tissues of organisms at the affected site and comparing with the same species in one or more suitable
reference sites. Field collected samples rely on existing information on the concentrations of
contaminants that have exceeded the relevant EQSs prior to the detection of elevated levels, whereas
caged/transplanted organisms involves the deployment of relevant species (usually filter-feeding
bivalves) at the affected and reference sites to measure the change in the contaminants that have
exceeded the relevant EQC over time. An appropriate gut depuration interval is generally required
(typically 24 hours) prior to analysis although the specific requirements should be discussed with the
laboratory.
Laboratory bioaccumulation tests generally run for 28 days and use several test species. At least two
bioaccumulation tests should occur, preferably on a bivalve mollusc and burrowing polychaete
(Simpson et al., 2005). The requirements for these species are similar to toxicity testing in that each
species should provide adequate biomass for analysis, ingest water/sediments and be efficient
metabolisers of contaminants. However, the organisms do not need to be sensitive to the contaminants
that are under investigation for bioaccumulation potential.
The location, nature and frequency of reactive monitoring required will be tailored on advice from
appropriate specialists for the collection of the appropriate information required to inform any
management responses to specific exceedance events. Monitoring sites will target areas of concern,
with the inclusion of extra reference sites and the duration of reactive monitoring is likely to be acute.
Consideration will be given to the utilisation of historical data as well as physical and chemical sediment
data.
For any contaminant where bioaccumulated concentrations are statistically greater than that measured
in the controls, an investigation into the source of the contaminant will be conducted. Where
environmental and public health risks are identified as a possibility, the appropriate government
agencies will be notified accordingly.
Benthic Communities and Habitat
BCH monitoring is a requirement of ongoing monitoring associated with the Mardie Project. BCH
monitoring is described within the Mardie Operational Environmental Management Plan currently under
development) (MOEMP).
Please refer to this document for further details and specific information related to monitoring BCH.
Where relevant EQGs are exceeded BCH monitoring data captured under the MOEMP will be
evaluated against the EQSs presented in Table 6-12. If required, additional sampling may be
implemented in circumstance where routine BCH monitoring results are not adequate to allow
assessment against the EQS. Additional monitoring will be conducted in accordance with the methods
detailed within the MOEMP, however additional sites or other variations as required for assessment
against the EQS will be considered prior to the sampling occurring.
Benthic Infauna
Benthic infauna sampling will be conducted in accordance with the methods and at the sample locations
presented within Section 6.2.
Data obtained during the sampling will be assessed against the EQS presented in Table 6-12.

Mardie Minerals Ltd Mardie Project: Marine Environmental Quality Monitoring & Management Plan
18WAU-0002 / R190108
103
Salinity and Key Toxicants in Bitterns
Water sample collection will be conducted in accordance with the methods outlined within Section 6.2
at the MEPA/HEPA boundary (MMB1-8) and HEPA (MH1-4) sampling sites. Laboratory analysis will be
undertaken by a NATA accredited laboratory with the analytical suite sufficient to address each of the
final toxicant and salinity EQSs (as determined during Phase III).
Animal Deaths and Disease
Records of animal deaths or disease will occur primarily from the following sources:
Physical observations undertaken during routine sampling programs; and
Any reported incidents from operation or Project related personnel.
Any animal deaths or disease will require investigation in accordance with the contingency management
procedure outlined below.
Data Assessment and Reporting
Data Validation
All data will be validated prior to the release of any monitoring and assessment reports. Data used or
otherwise presented in the reports is to be checked and verified against raw data logs and laboratory
reports.
Quality Control
An assessment of quality control data needs to be undertaken and included in all reports including:
Assessment of field contamination (rinsate, transport blank and method blank);
Assessment of field variability (duplicate and triplicate);
Assessment of lab variability (triplicate); and
Laboratory QA/QC results.
Data Assessment
Laboratory samples and in-situ results will be compared with the management triggers as soon as
practicable to ensure that the appropriate reactive monitoring programs are implemented as soon as
practicable if any EQGs are exceeded.
Elevated results will be assessed in accordance with Figure 6-8 to determine the level of management
actions or investigative monitoring required.
Reporting
An investigation report will be compiled in accordance with BCI Minerals Environmental Management
System for any elevated results which requires management response in accordance with Figure 6-9.
Submission to the regulator will be subject to project approval conditions.
A comprehensive report will be developed at the completion of each monitoring round which will include,
but not be limited to:

Mardie Minerals Ltd Mardie Project: Marine Environmental Quality Monitoring & Management Plan
18WAU-0002 / R190108
104
Summary of the methods applied and any deviations from this MEQMMP;
Timeseries graphs of physicochemical water column profiles;
A table summarising laboratory analysis results;
Timeseries graphs of laboratory analysis results;
An assessment of all data collected against management triggers;
A review of management trigger exceedances investigations and remedial actions
implemented; and
Any actions or recommendations required as a result of field implementation of the SAP and
assessment of monitoring data.
Contingency Management
In the event that Project related operational activities result in an exceedance of the defined
management triggers, a tiered risk-based investigative monitoring program will be required as defined
within Figure 6-8. Figure 6-9 provides the management contingency actions required.
Firstly, depending upon the exceedance, an investigation needs to be undertaken to determine the
cause(s). Due to the nature of the monitoring program potential causes can be isolated from the
following four point sources:
1. Bitterns discharge water quality;
2. Offshore Port and shipping related activities;
3. Onshore vessel related activities (Mardie Creek HEPA); and
4. Seawater abstraction and related activities (Peters Creek HEPA)
Once the cause(s) is determined then appropriate corrective or preventative actions need to be put into
place to ensure re-occurrence does not occur. This system of investigation and implementation of
remedial actions will ensure that optimal environmental performance continues through the lifecycle of
the Project.
In the event of an EQS exceedance, the CEO of DWER will be notified and a report provided to the
CEO within 3 months describing any subsequent investigations, management actions put into place
and success of the actions in returning marine environmental quality to within requirements.
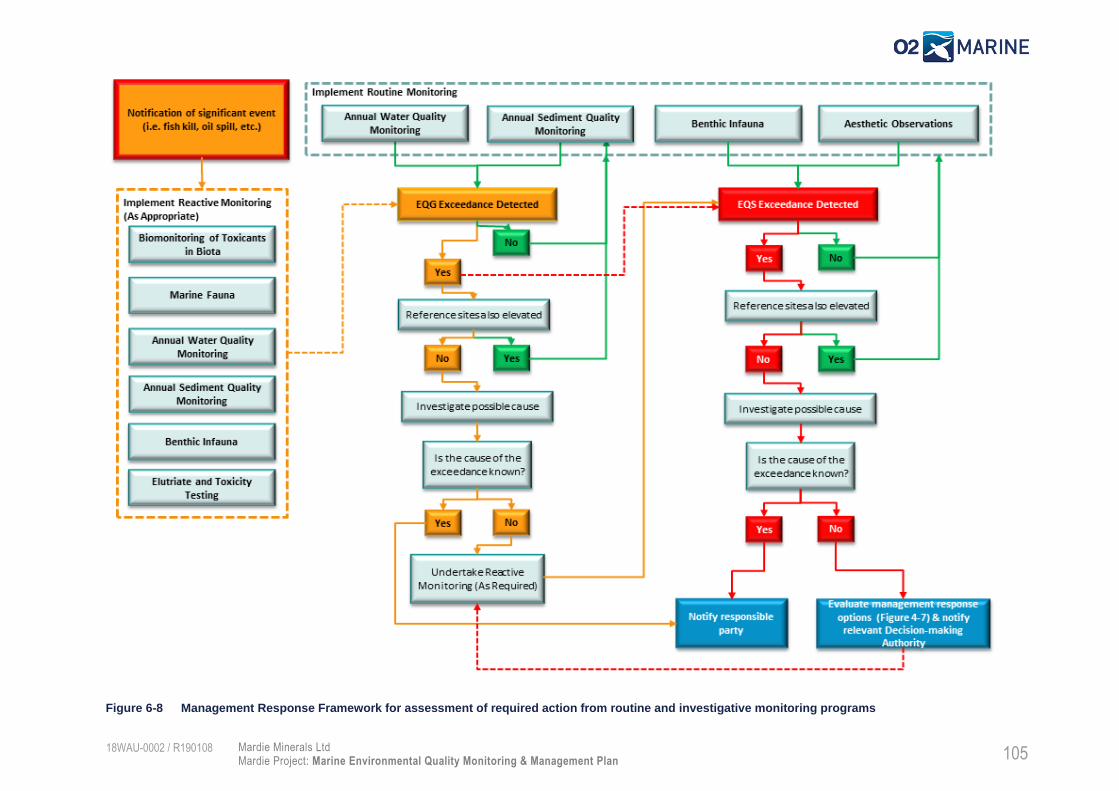
Mardie Minerals Ltd Mardie Project: Marine Environmental Quality Monitoring & Management Plan
18WAU-0002 / R190108
105
Figure 6-8 Management Response Framework for assessment of required action from routine and investigative monitoring programs

Mardie Minerals Ltd Mardie Project: Marine Environmental Quality Monitoring & Management Plan
18WAU-0002 / R190108
106
Figure 6-9 Ongoing Marine Environmental Quality Monitoring Contingency Management Actions

Mardie Minerals Ltd Mardie Project: Marine Environmental Quality Monitoring & Management Plan
18WAU-0002 / R190108
107
7. Review
This MEQMMP is a living document and will be regularly reviewed in accordance with Table 7-1 to
ensure it remains relevant to the Project and aligns with industry best practice.
Table 7-1 MEQMMP review timeframes for the Project lifecycle
Timing Rationale
Scheduled Review
Upon receipt of Approval Conditions Ministerial Statement approval conditions obtained will necessitate a comprehensive review of this MEQMMP to ensure all relevant aspects are covered within this Plan to ensure compliance.
Upon completion of Baseline Data Assessment
This review is required to derive the site specific EQCs for the ongoing assessment of Project impacts, along with any other findings that require update upon completion of the baseline data collection phase.
Upon Completion of Commissioning This will typically be required to update management triggers associated with the discharge design for the bitterns wastewater.
Upon Completion of Validation assessment
A comprehensive review of the LEPs and EQC will be required based upon data obtained during this phase. A comprehensive review of the entire MEQMMP will be required to ensure adequacy for management of the ongoing MEQ with respect to the final operational Processing Facility.
Annually during routine operations At the completion of annual reporting requirements any recommendations for alteration of the MEQMMP will need to be incorporated into a revised version suitable for the next 12 months of operations.
Ad-Hoc Review
Any time operational activities significantly alter
Operational changes to the project may result in an altered risk profile. Therefore, the MEQMMP will require a review to ensure that it remains fit-for-purpose for altered operational conditions.
Any time Bitterns discharge quality or regime alters
Process or design alterations changes to the bitterns discharge may result in an altered risk profile. Therefore, the MEQMMP will require a review to ensure that it remains fit-for-purpose for altered operational conditions.
During review of the MEQMMP consideration should be given to (but not limited to):
Overall effectiveness of the Plan;
Appropriateness of EVs, EQO and LEPs;
To refine EQC with compiled baseline data set;
New threats to MEQ that may be identified;
Lessons learned during sampling or analysis;
Changes in industry best practice;
Changes in environmental risk; and
Any changes in methodology or equipment used.

Mardie Minerals Ltd Mardie Project: Marine Environmental Quality Monitoring & Management Plan
18WAU-0002 / R190108
108
8. References
ANZG (2018). Australian and New Zealand Guidelines for Fresh and Marine Water Quality. Australian and New
Zealand Governments and Australian state and territory governments, Canberra ACT, Australia.
Available at www.waterquality.gov.au/anz-guidelines
ANZECC/ARMCANZ 2000. Australian and New Zealand guidelines for fresh and marine water quality. National
Water Quality Management Strategy No 4, Australian and New Zealand Environment and Conservation
Council and Agricultural and Resource Management Council of Australia and New Zealand, Canberra,
ACT.
Baird (2020a). Mardie Project: Bitterns Outfall Modelling Report. Report prepared for Mardie Minerals Ltd.
Baird (2020b). Mardie Project Hydrodynamic Modelling. Report Prepared for Mardie Minerals Pty Ltd.
CALM (2005). Indicative Management Plan for the proposed Dampier Archipelago Marine Park and Cape Preston
Marine Management Area. Department of Conservation and Land Management.
DSEWPaC. (2012). Marine bioregional plan for the North-west Marine Region. Department of Sustainability,
Environment, Water Population and Communities.
DoE (2006). Pilbara Coastal Water Quality Consultation Outcomes – Environmental Values and Environmental
Quality Objectives. Department of the Environment, Government of Western Australia, Marine Series
Report No. 1. pp. 67
EPA (2016). Technical Guidance for Protecting the Quality of Western Australia’s Marine Environment.
Environmental Protection Authority, Western Australia
Elhassan, I.S. (2018). Occurrence of the green sawfish Pristis zijsron in the Sudanese Red Sea with observations
on reproduction. Endangered Species Research. Vol. 36: 41-47.
Eliot I, Gozzard B, Eliot M, Stul T and McCormack G., (2013). Geology, Geomorphology & Vulnerability of the
Pilbara Coast, In the Shires of Ashburton, East Pilbara and Roebourne, and the Town of Port Hedland,
Western Australia. Damara WA Pty Ltd and Geological Survey of Western Australia, Innaloo, Western
Australia.
Jones R, Fisher R, Bessell-Brown P, Negri A, Duckworth A (2019). Theme 4 | Synthesis Report: Defining
thresholds and indicators of coral response to dredging-related pressures. Western Australian Marine
Science Institution (WAMSI). Perth, Western Australia pp. 36.
Morgan, D. A. (2012). Sawfish Monitoring Project – Wheatstone. Centre for Fish & Fisheries Research, Murdoch
University Report to Chevron Australia.
O2 Marine (2019a). Mardie Project Baseline Sediment Characterisation. Report prepared for Mardie Minerals Ltd.
O2 Marine (2019b) Mardie Project Bitterns Outfall Ecotoxicity Assessment. Report prepared for Mardie Minerals
Ltd.
O2Marine (2019c), Mardie Salt Project Geophysical Survey - BCI Minerals. Survey Report, EGS PROJECT.
Prepared for Mardie Minerals by O2 Marine, January 2019.
O2 Marine (2020a) Mardie Project Marine Water Quality Baseline. Report prepared for Mardie Minerals Ltd.

Mardie Minerals Ltd Mardie Project: Marine Environmental Quality Monitoring & Management Plan
18WAU-0002 / R190108
109
O2 Marine (2020b). Mardie Project Intertidal Benthic Communities and Habitat. Report Prepared for Mardie
Minerals Pty Ltd.
O2 Marine (2020c). Mardie Project Subtidal Benthic Communities and Habitat. Report prepared for Mardie
Minerals Pty Ltd
O2 Marine (2020d). Mardie Project Marine Fauna Review. Report prepared for Mardie Minerals Pty Ltd
Pendoley, K.L., Whittock, P.A., Vitenbergs, A. & Bell, C. (2016). Twenty years of turtle tracks: marine turtle nesting
activity at remote locations in the Pilbara, Western Australia. Australian Journal of Zoology, 64(3): 217-
226.
Pendoley Environmental (2019). Mardie Salt Project Marine Turtle Monitoring Program 2018/19. Report Prepared
for Mardie Minerals Pty Ltd.
Preston (2018) Mardie Project Environmental Scoping Document. Report prepared for Mardie Minerals Ltd.
Raudino, H., Hunt, T and Waples, K. (2018). Records of Australian humpback dolphins (Sousa sahulensis) from
an offshore island group in Western Australia. Marine Biodiversity Records 11(1). DOI: 10.1186/s41200-
018-0147-0
RPS, 2017, Mardie Salt Project - Pre-Feasibility Surface Water Assessment, Prepared for Mardie Minerals by
RPS Australia West, October 2017.
RPS, 2018, BCI Mardie Development Coastal Inundation Studies, Prepared for Mardie Minerals by RPS Australia
West, 21 June 2018.
Semeniuk, V 1993. The mangrove system of Western Australia: 1993 Presidential Address. Journal of the Royal
Society of Western Australia 76: 99–122.
SWQMS (2004). Implementation Framework for Western Australia for the Australian and New Zealand Guidelines
for Fresh and Marine Water Quality and Water Quality Monitoring and Reporting (Guidelines No.s 4 & 7:
National Water Quality Management Strategy). State Water Quality Management Strategy, Report No. 6.
Government of Western Australia.
URS, 2010. Report: Wheatstone Project – Intertidal Habitats of the Onslow Coastline. Prepared for Chevron
Australia Pty Ltd, May 2010.
Whitty, J.M., Thorburn, D.C., Phillips, N.M., McAuley, R., Morgan, D.L. and Chaplin, J.A. (2011). North-western
Australia as a hotspot for endangered elasmobranchs with particular reference to sawfishes and the
Northern River Shark. Journal of the Royal Society of Western Australia, 94:345-358.
Whitty, J.M., Morgan, D.L., Gleiss, A.C., Ebner, B.C., Beatty, S.J. and Allen, M.G. (2017). Habitat use and site
fidelity of neonate and juvenile green sawfish Pristis zijsron in a nursery area in Western Australia.
Endangered Species Research, Vol. 34: 235-249. https://doi.org/10.3354/esr00847.