6.5 Potential impacts - EPA WA
39
72 6.5 Potential impacts 6.5.1 Potential construction impacts Figure 6-7 and Table 6-9 list the relevant cause-effect pathways and the impacts that may arise during proposed construction and commissioning activities. Risks were assessed via a desktop review and theoretical modelling. Modelling investigated the theoretical dispersal of excavated material during the installation of the marine risers, intake structures and outlet diffusers, under a worst-case scenario. Impacts to water and sediment quality may have flow on effects to other Factors, including Benthic Communities and Habitats and Marine Fauna. Potential construction impacts to the latter factors are assessed in Section 7 and 8, respectively. 1. 'Causes' are represented in the dark grey boxes; 'effects' shown in light blue and white boxes. 2. Section 6 addresses only light blue effects associated with water and sediment quality; impacts to BCH and Marine Fauna are addressed in Sections 7 and 8, respectively. Figure 6-7: Cause-effect pathways associated with SDP construction and commissioning
Transcript of 6.5 Potential impacts - EPA WA

72
6.5 Potential impacts
6.5.1 Potential construction impacts
Figure 6-7 and Table 6-9 list the relevant cause-effect pathways and the impacts that may arise during proposed construction and commissioning activities. Risks were assessed via a desktop review and theoretical modelling. Modelling investigated the theoretical dispersal of excavated material during the installation of the marine risers, intake structures and outlet diffusers, under a worst-case scenario.
Impacts to water and sediment quality may have flow on effects to other Factors, including Benthic Communities and Habitats and Marine Fauna. Potential construction impacts to the latter factors are assessed in Section 7 and 8, respectively.
1. 'Causes' are represented in the dark grey boxes; 'effects' shown in light blue and white boxes. 2. Section 6 addresses only light blue effects associated with water and sediment quality; impacts to BCH and Marine
Fauna are addressed in Sections 7 and 8, respectively.
Figure 6-7: Cause-effect pathways associated with SDP construction and commissioning

73
Table 6-9: Potential construction impacts to marine environmental quality
Potential impacts Context Reduced light (elevated TSS) There is potential for periodic elevations in turbidity and associated
reductions in light penetration generated via the drilling of foundations for the marine risers, intakes structures and outlet diffusers.
Smothering / Physical damage (elevated TSS)
Placement and/or the construction of foundations for intake and outlet infrastructures may lead to permanent or temporary loss of benthic communities and habitats.
Toxicity (grouting materials) There is potential for short-term release of toxicants during the grouting processes required to secure marine infrastructure.
Toxicity (chemicals) The commissioning phase requires short-term (~4 months) flushing and hydrostatic testing of the reverse osmosis infrastructure. Cleaning and disinfection fluids will be used creating potential for toxicity in the vicinity of the diffuser.
Stressor effects (tunnel residues) The commissioning phase will involve short-term (~4 months) flushing and testing of the outlets and intakes. The flushing may result in the mobilisation and discharge of construction residues. Some of the materials are potentially acidic resulting in a low pH discharge.
Toxicity (hydrocarbon spills and waste generation)
Marine construction activities include the use of a jack-up barge and support vessels, presenting potential risks due to hydrocarbons spills and waste generation.
6.5.2 Potential operational impacts
The seawater desalination process produces a liquid concentrate (brine) (at 69-71 psu), cleaning chemicals and some metals (iron used for flocculation and removal of particulates prior to RO treatment). The waste product is also discharged at a temperature +4°C above ambient.
Figure 6-8 and Table 6-10 list the relevant cause-effect pathways and the impacts that may arise during proposed operations. Risks associated with operational activities were assessed using a three-dimensional numerical model (DHI 2018, 2019) and a desktop review of salinity tolerances. Modelling investigated the dispersal, dilution and trajectory of the return seawater brine, its effect on the marine environment, and the potential for cumulative effects when combined with the TWW discharge (located 670 m north-west).
Note that while Section 6 addresses potential operational impacts to Marine Environmental Quality, impacts to water and sediment quality may have flow on effects to other Factors, including Benthic Communities and Habitats (BCH) and Marine Fauna. The potential flow on effects to the factors, BCH and Marine Fauna, are addressed in Section 7 and 8, respectively.

74
1. 'Causes' are represented in the dark grey boxes; 'effects' shown in light blue and white boxes. 2. Section 6 addresses only light blue effects associated with water and sediment quality; impacts to BCH and Marine
Fauna are addressed in Sections 7 and 8, respectively.
Figure 6-8: Potential impacts to marine environmental quality, and flow-on effects, associated with ASDP marine operations

75
Table 6-10: Potential operational impacts to marine environmental quality
Potential impacts Context Reduction in dissolved oxygen (stratification)
Inputs of return seawater (brine) may lead to stratification (a persistent layer of saline water at the bottom of the water column). The potential for reduced mixing between the surface and bottom of the water column may lead to oxygen drawdown and depletion.
Stressor effects (increased salinity & temperature)
Inputs of return seawater (brine) may lead to persistent increases in salinity in low lying habitats, and artificial warming around the diffuser. Elevated salinity may result in osmotic stress and ion toxicity which affect plant water relations, ion concentrations in cytoplasm and the vacuole and growth and photosynthesis (Cambridge et al 2019). Marine fauna, benthic habitats and their associated communities may experience heat stress, or in severe cases, mortality.
Toxicity (chemicals used in RO maintenance processes)
Chemicals used in plant maintenance may lead to localised toxicity around the diffuser.
6.6 Assessment of impacts
6.6.1 Assessment thresholds
The Alkimos marine environment is managed according to EPA (2000) which sets out the Environmental Quality Plan (EQP) for Perth’s coastal waters between Yanchep and Dawesville. EPA (2000) falls within EPA (2016g) which provides the management framework for Western Australia. The objective of the EQP is to ensure the marine environment is managed to achieve the Environmental Values (EVs) and Environmental Quality Objectives (EQOs) as outlined in Table 6-3.
The environmental factor for Marine Environmental Quality is closely aligned with the EV for Ecosystem Health. The EV for Ecosystem Health recognises that there are areas (such as around outlets, ports and harbours) where a high level of ecosystem protection cannot be maintained. These areas are assigned either a moderate or low level of ecological protection (EPA 2016g), each of which has specific limits of acceptable change (Table 6-12).
The framework recognises the competing environmental, social and industrial uses of the marine environment, and allows for small localised effects, while aiming to maintain overall environmental integrity (EPA 2016g). This is important in the context of this document, which includes strategies to manage the expected reduction in environmental quality immediately adjacent to the outlet diffusers, while maintaining broader regional environmental quality.

76
Table 6-11: Levels of ecological protection linked to the environmental quality objective for maintenance of ecosystem integrity
Level of ecological protection
Environmental quality conditions (limit of acceptable change) Contaminant concentration indicators
Biological indicators
Maximum No contamination – pristine No detectable change from natural variation
High Very low levels of contaminants No detectable change from natural variation
Moderate Elevated levels of contaminants Moderate changes from natural variation
Low High levels of contaminants Large changes from natural variation
Potential impacts to water and sediment quality were assessed wherever possible against the criteria in the EPA's Technical Guidance Statements, and the EPA's Environmental Quality Criteria (EQC). The EQC encompass Environmental Quality Guidelines (EQG) and Environmental Quality Standards (EQS):
• EQGs are threshold numerical values or narrative statements which if met indicate there is a high degree of certainty that the associated environmental quality objective has been achieved. If the guideline is not met, then there is uncertainty as to whether the associated environmental quality objective has been achieved and a more detailed assessment against an environmental quality standard is triggered; this assessment is risk-based and investigative in nature
• EQSs are threshold numerical values or narrative statements that indicate a level which if not met indicates there is a significant risk that the associated environmental quality objective has not been achieved and a management response is triggered. The response would normally focus on identifying the cause (or source) of the exceedance and then reducing loads of the contaminant of concern (i.e. source control) and may also require in situ remedial work to be undertaken.
The conceptual framework for applying the EQC to operational impacts is illustrated in Figure 6-9.

77
Figure 6-9: Conceptual framework for applying the environmental quality guidelines and standards
Construction
Potential impacts resulting from the construction and commissioning phases of the Proposal were considered in the context of light, toxicity, stress, smothering and/or physical damage (Table 6-12). The effects of toxicants were considered with respect to their volume and concentration following initial dilution (see Section 6.4.2), while the potential for reduced light penetration and smothering was examined using a conceptual hydrodynamic and sediment transport model.

78
Table 6-12: Indicators and trigger values applied to the assessment of construction impacts
Environmental quality objective
Environmental Indicator(s)
Considerations
Maintenance of ecosystem integrity
Reduced light (elevated TSS)
Potential impacts were assessed in the context of the magnitude and duration of effect, focussing primarily on light attenuation.
Smothering / physical damage
The trajectory and settlement of suspended particles (expelled as drill cuttings) was examined using a conceptual hydrodynamic model. Potential impacts were assessed in the context of settlement patterns and the volume of the deposited material (as a function of distance from the drill head).
Toxicants / stressors
Potential effects were considered in the context of dispersion and dilution of toxicants and stressors in a high energy environment.
The potential for toxicity resulting from hydrocarbon spills was assessed in the context of the probability of it occurring, and the strategies required to manage it should it occur.
Operation
Potential operational impacts were assessed in the context of the indicators and triggers listed in Table 6-13. Triggers were selected based on EPA (2016g) or following precedents set in other desalination approvals processes (Jacobs & WorleyParsons 2018a).
Table 6-13: Indicators and trigger values applied to the assessment of operational impacts
Environmental quality objectives
Environmental indicator(s)
Trigger values
Maintenance of ecosystem integrity
Salinity At the LEPA/High Environmental Protection Area (HEPA) boundary the median salinity increase above background (ambient) conditions shall not exceed +1.3 ppt, when measured 50 cm above the sediment surface.
Temperature At the LEPA/HEPA boundary the maximum temperature increase shall not exceed +2°C above ambient seawater temperature.
Dissolved oxygen The median dissolved oxygen concentration in bottom waters at the site (measured in daylight hours and defined to be within 50 cm of the sediment surface), calculated over a period of no more than one week, is greater than 90% saturation.
Toxicants The 95th percentile of the sample concentrations from a single site or a defined area should not exceed ANZG (2018) 99% species protection trigger values at the LEPA/HEPA boundary.
Maintenance of aesthetic values
TSS The natural visual clarity of the water should not be reduced by more than 20%. The seafloor should generally be visible in up to 10 m of water under calm conditions in summer.

79
6.6.2 Construction impacts
Drilling activities
The SDP requires the installation of infrastructure, including marine risers, intake structures and outlet diffusers (Section 3.4.2). Installation requires the drilling of four 2.05 m diameter shafts to a depth of approximately 14 m. Drilling will be conducted within separate tubular casings designed to support the sediments and prevent ‘cave-ins’ during the drilling process. In order to reduce the footprint of the sediment plumes, the height of the casings may be extended to the water’s surface (a height of approximately 13 m) to contain the excavated material within ‘coffer dams’. However, this assessment is based on a worst case scenario where grouting fluids and the drill cuttings are released to the environment. The assessment proceeded based on the understanding that sediment plumes and/or the escape of grouting fluids will be restricted to approximately 32 m3 per site, and that the release of particles will be restricted to short periods while the drill and jack-up barge is in place.
Reduced light (elevated TSS)
The extent that an increase in light attenuation may lead to impacts is related to the volume of TSS in the water column and the duration of the effect (Collier 2007). It is anticipated that drill cuttings released from the excavation sites, could remain suspended in the water column for the full duration of the drilling program. The duration of drilling at Alkimos will depend on the nature of the substrates and the resistance levels encountered. The Concept Design Report (Jacobs & WorleyParsons 2018a) estimates that drilling will be complete within three months, with each of the shafts requiring approximately three weeks. Drilling will cease at the completion of each site, to allow the repositioning of the jack-up barge.
Section 6.6.2 describes the predicted spatial extent of sedimentation following the drilling of the shafts. Approximately 90% of cuttings are expected to settle quickly, while the remaining un-flocculated material will disperse under the influence of prevailing currents (Neff 2005).
While the results do not extend to predicting TSS concentrations in the water column, it is anticipated that the worst-case mobilisation of 32 m3 of sediments over a three-week period (equating to ~1.5 m3 per day per shaft), is unlikely to result in a significant sediment plume. Potential impacts due to shading are therefore considered very low.
Smothering / physical damage
The extent that smothering may lead to impacts is related to the depth, or the ‘thickness’, of the sedimentation layer (Table 7-8). For the motile elements of the BCH (e.g. invertebrates), an organism’s tolerance to sedimentation is based on its ability to escape burial (Table 7-8). Laboratory studies confirm that the probability of escape is inversely proportional to the rate and volume of sedimentation. Nichols et al (1978) (cited in Chou et al 2004) and Miller et al (2003), found that most invertebrates could avoid burial if deposition was restricted to a thickness of 5-10 cm; though other authors (Kranz 1974) cite much higher values of between 11 and 57 cm (Table 7-8).

80
Under the crushed particle scenario, the maximum sedimentation thickness across each of the four drilling sites, was approximately 1.5 to 2.0 mm in depth, with a deposition footprint of approximately 100 m radius (Figure 6-10). For the native particle discharge, the maximum sedimentation thickness was higher at 120 to 200 mm, but the deposition footprint was smaller (~10 m diameter).
Based on the thresholds described in the literature (Table 7-8, Figure 7-8), the predicted worst-case rates of sedimentation are within the non-lethal range (~1 cm per m2 per day, based on a total deposition of 20 cm over 21 days), meaning most invertebrates will be capable of escaping the effects of the deposition under the predicted rates.
Figure 6-10: Results of the conceptual particle transport model showing the spread and depth of crushed sediments at the proposed outlet (upper) and intake (lower) drilling sites
Toxicity (grouting materials)
Grouting materials contain cement and other additives such as surfactants (soaps), de-foamers, lignins, inorganic salts and binding agents (bentonite). Grouting materials, which will be used to secure the intakes structures and outlet diffusers to the seafloor, are not routinely released to the environment but small amounts may unavoidably be released during the grouting activities.

81
The risk that the grouting materials may lead to acute or chronic effects on biota depends on the concentration of the constituent chemicals, their rate of dilution (following release to the water column) and the duration of exposure. In well-mixed waters, it is estimated that grouting materials are diluted 100-fold within 10 m and 1000-fold within ~100 m from the discharge (Neff 2005).
Given the grouting materials are to be applied to small areas of the seafloor (~4 m radius), the risk that chemicals may impart acute and/or sub-lethal effects to the surrounding biota is considered low.
Toxicity (due to release of toxicants during flushing)
Commissioning requires disinfection (flushing) and pressure testing of the pipelines and RO plant. Commissioning is expected to take around 30 weeks and will begin with the initial flooding and flushing of the intake and outfall pipelines with seawater, followed by flushing of the membrane filtration system and RO piping with potable water from the drinking water mains. Risks to marine environmental quality are generally considered negligible given the benign nature of the flushing agents (discussed in greater detail below). In-line with EPA expectations (EPA 2008) Water Corporation plan to undertake a similar process to that was used to manage environmental risks during plant commissioning of the SSDP (SSWA 2015), in the commissioning of the ASDP.
The risks of discharging the various chemical additives and their degradation products formed during the pressure testing and pipeline disinfection process have been examined so that appropriate management measures can be implemented during the disposal of the pressure test and disinfection water.
Sodium hypochlorite
Sodium hypochlorite is expected to be dosed between 5 mg/L to 20 mg/L (reported as residual chlorine) within the pressure test and disinfection waters. Sodium hypochlorite dissociates to hypochlorous acid in potable water which is then subject to an equilibrium distribution with the hypochlorite ion. The relative proportion of each total residual oxidant (TRO) compound (sodium hypochlorite, hypochlorous acid, hypochlorite ion and other chemical oxidants present) is predominately determined by the pH.
The water used in the pressure test process will be neutralised with an excess of sodium bisulphite. Following treatment of pressure test and disinfection water with sodium bisulphite, the concentration of residual chlorine (residual oxidants) in the effluent will be zero. To ensure this, chlorine levels in the pressure test and disinfection water will be monitored prior to discharge.
Sodium bisulphite
Sodium bisulphite is used to chemically reduce chlorine. It is proposed that the dose rate will be 120% of the stoichiometric demand to ensure that no chlorine remains. The excess sodium bisulphite will consume approximately 0.9 mg/L of dissolved oxygen (DO) from its fresh water body before it is discharged into the environment. The maximum concentration of all derivatives from sodium bisulphite and its reaction with sodium hypochlorite is approximately 57 mg/L.

82
Sodium bisulphite reduces the residual chlorine to produce chloride, sodium and sulphate ions. These ions are present in the background potable water used for pressure testing and are also relatively abundant in seawater. The concentration of these ions in the neutralised (de-chlorinated) disinfection/pressure test water will be significantly lower than the natural concentration in the receiving seawater. All end products resulting from the addition of sodium bisulphite are unlikely to present an adverse environmental impact on the marine environment.
Calcium carbonate
Leaching of calcium carbonate (CaCO3) may occur during pressure testing, which may in turn increase the pH and alkalinity of the pressure test water. The dissolved calcium carbonate will be present in the water as calcium and bicarbonate ions, both of which are relatively abundant in seawater. The pH of the pressure test water will be adjusted, where required, by the addition of sulphuric acid.
Calcium carbonate is ubiquitous in the marine environment and is the major constituent of marine shell and coral reefs. Acute toxicity (48-hour LC50) from exposure to calcium carbonate was reported in the mosquitofish, Gambusia affinis, at 56,000 mg/L (Fisher Scientific 2008), which is considerably higher than the residual concentrations expected to be discharged. Calcium carbonate present in the pressure test water is unlikely to impact the marine or freshwater environments given that it has limited potential to affect aquatic organisms.
Toxicity (hydrocarbon spills and waste generation)
Installation of the intake structures and outlet diffusers will be undertaken from a temporary jack-up barge. Various hydrocarbons will be used as part of this operation, including diesel fuel, oil and lubricants. Given this, there is a small risk of unplanned hydrocarbon spills to the marine environment.
Hydrocarbon use will be managed carefully under the contractor’s hydrocarbon and waste management plans, which will include compliance with relevant requirements of the International Maritime Organisation’s (IMO) International Convention for the Prevention of Pollution from Ships (MARPOL).
Stressor effects (tunnel residues)
The initial stages of the commissioning phase will involve the flooding and flushing of the plant and tunnel infrastructure. Whilst every effort will be made to install clean infrastructure, small amounts of foreign material (mainly residual grouting material and dust) may be released to the ocean during the initial flush.
As flushing will be undertaken using potable water or seawater (or a combination of both), a very high level of dilution will be achieved in the initial dilution phase. Previous studies indicate that dilutions 1:100 within 10 m of the outlets are likely (Neff 2005).
83
6.6.3 Operational impacts
Salinity
The RO process produces a liquid brine concentrate by-product that is roughly twice the salinity of seawater (69 to 71 psu). High salinity results in osmotic stress and ion toxicity which affect plant water relations, ion concentrations in cytoplasm and the vacuole and growth and photosynthesis (Cambridge et al 2019). It is important that diffusers are engineered to achieve a very high rate of initial dilution, to mitigate potential osmotic/physiological effects.
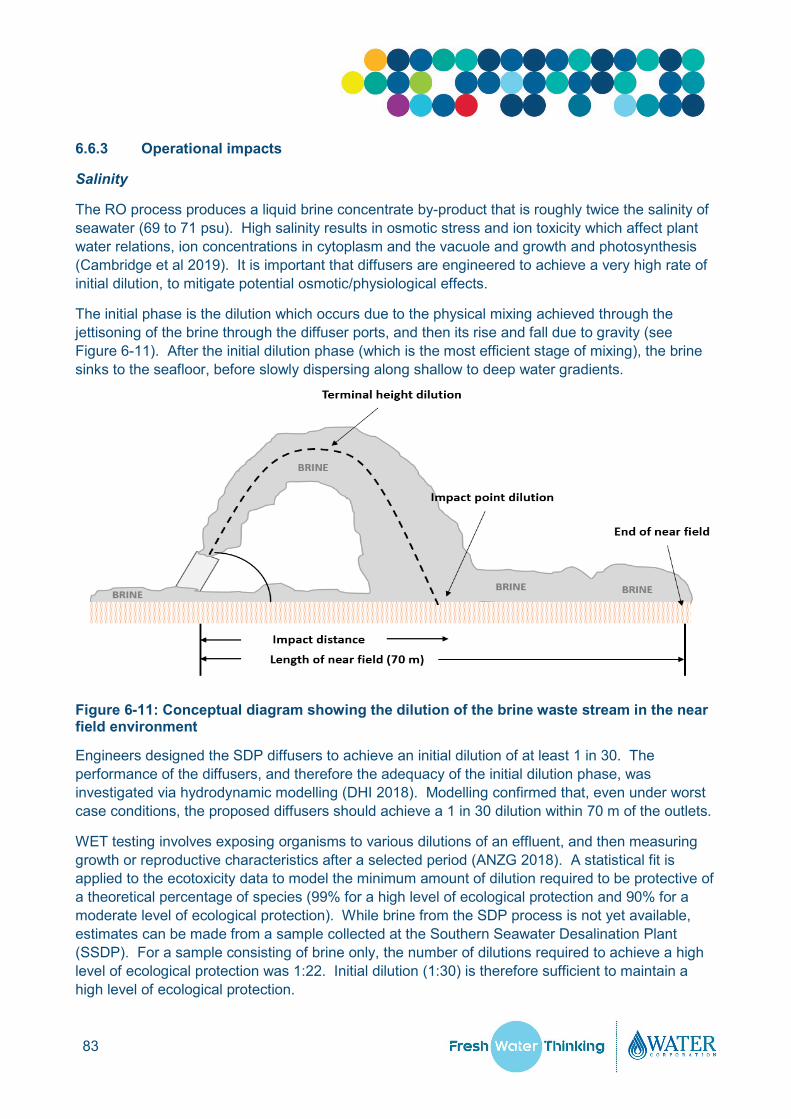
The initial phase is the dilution which occurs due to the physical mixing achieved through the jettisoning of the brine through the diffuser ports, and then its rise and fall due to gravity (see Figure 6-11). After the initial dilution phase (which is the most efficient stage of mixing), the brine sinks to the seafloor, before slowly dispersing along shallow to deep water gradients.
Figure 6-11: Conceptual diagram showing the dilution of the brine waste stream in the near field environment
Engineers designed the SDP diffusers to achieve an initial dilution of at least 1 in 30. The performance of the diffusers, and therefore the adequacy of the initial dilution phase, was investigated via hydrodynamic modelling (DHI 2018). Modelling confirmed that, even under worst case conditions, the proposed diffusers should achieve a 1 in 30 dilution within 70 m of the outlets.
WET testing involves exposing organisms to various dilutions of an effluent, and then measuring growth or reproductive characteristics after a selected period (ANZG 2018). A statistical fit is applied to the ecotoxicity data to model the minimum amount of dilution required to be protective of a theoretical percentage of species (99% for a high level of ecological protection and 90% for a moderate level of ecological protection). While brine from the SDP process is not yet available, estimates can be made from a sample collected at the Southern Seawater Desalination Plant (SSDP). For a sample consisting of brine only, the number of dilutions required to achieve a high level of ecological protection was 1:22. Initial dilution (1:30) is therefore sufficient to maintain a high level of ecological protection.

84
In this assessment, salinity is assessed as a ‘stressor’ using a threshold of +1.3 psu above background. Negligible impacts are expected if median salinity elevations are within +1.3 psu of background (Table 6-13). The 1 in 30 dilution projected by the model is expected to be sufficient to restrict near field salinity elevations to within +1.1 psu above background, well below the +1.3 psu criterion.
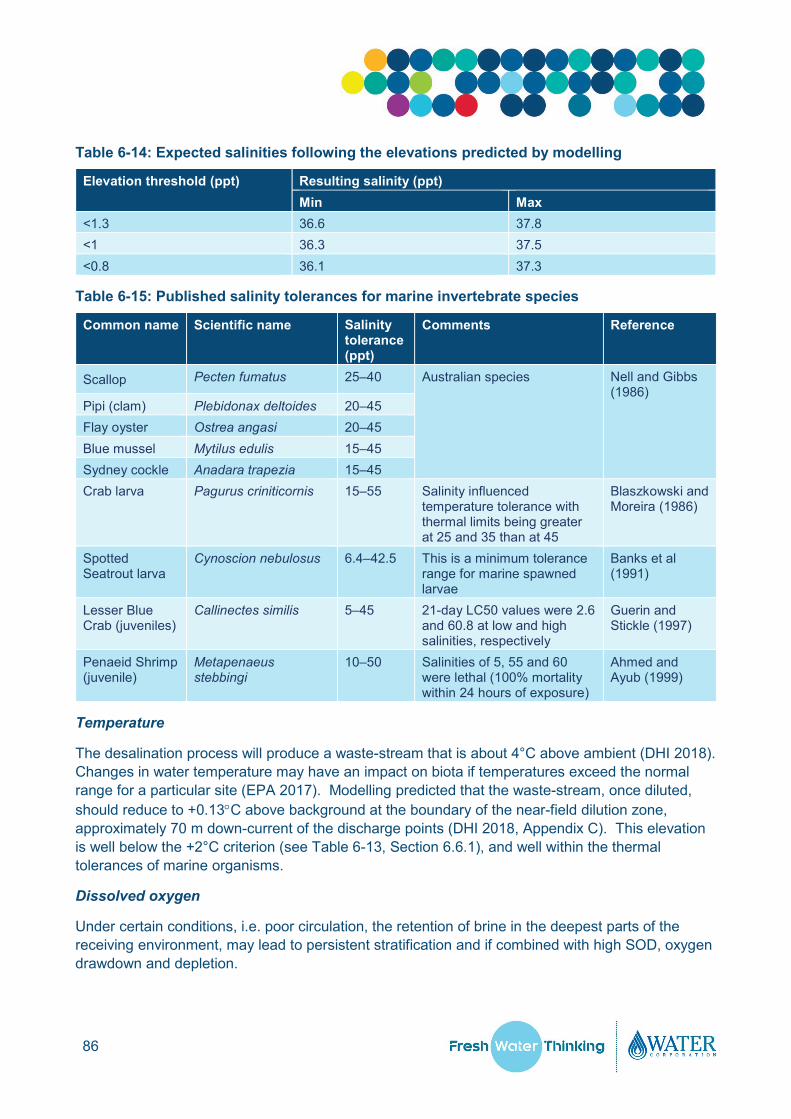
Median salinity elevations for the month of April (representing the period of lowest wind speeds, and therefore poorest dilution) are shown in Figure 6-12. When added to typical background salinities (Table 6-14), these translate to salinities that are well within the tolerance limits of most marine species (Table 6-15) (Diaz and Rosenberg 1995).

Coordinate System: GDA 1994 MGA Zone 50
Date: 7/03/2019
!(!(
!(!(
368000
368000
370000
370000
372000
372000
374000
374000
6498500
6498500
6500500
6500500
© 2019. Whilst every care has been taken to prepare this map, BMT & Linc Property makes no representations or warranties about its accuracy, reliability, completeness or suitability for any particular purpose and cannot accept liability and responsibility of any kind (whether in contract, tort or otherwise) for any expenses, losses, damagesand/or costs (including indirect or consequential damage) which are or may be incurred by any party as a result of the map being inaccurate, incomplete or unsuitable in any way and for any reason.
G:\SpatialData\Client\WaterCorp\1334_11Alkimos EIA\005_ModellingSummary\GIS_Requests\005_02\005_02bamedaprA4_20190218.mxd
Client: Water Corporation, 3/2019. Created by: BMT
0 400 800m
±Scale 1:7,070 at A4
[email protected] | www.bmt.org
Legend
ppt Above BackgroundASDP Outfall Diffuser!(
See Inset Map
!(
!(
INSET MAP
Proposed
LEPA
50 0 5025
metres
ASDP Intake Structure!(
Proposed LEPA
0.8 to 1.0 > 1.3
1.0 to 1.3
Figure 6-12: Predicted salinity elevations (50th percentile in April) above background
86
Table 6-14: Expected salinities following the elevations predicted by modelling
Elevation threshold (ppt) Resulting salinity (ppt) Min Max
<1.3 36.6 37.8 <1 36.3 37.5 <0.8 36.1 37.3
Table 6-15: Published salinity tolerances for marine invertebrate species
Common name Scientific name Salinity tolerance (ppt)
Comments Reference
Scallop Pecten fumatus 25–40 Australian species Nell and Gibbs (1986)
Pipi (clam) Plebidonax deltoides 20–45 Flay oyster Ostrea angasi 20–45 Blue mussel Mytilus edulis 15–45 Sydney cockle Anadara trapezia 15–45 Crab larva Pagurus criniticornis 15–55 Salinity influenced
temperature tolerance with thermal limits being greater at 25 and 35 than at 45
Blaszkowski and Moreira (1986)
Spotted Seatrout larva
Cynoscion nebulosus 6.4–42.5 This is a minimum tolerance range for marine spawned larvae
Banks et al (1991)
Lesser Blue Crab (juveniles)
Callinectes similis 5–45 21-day LC50 values were 2.6 and 60.8 at low and high salinities, respectively
Guerin and Stickle (1997)
Penaeid Shrimp (juvenile)
Metapenaeus stebbingi
10–50 Salinities of 5, 55 and 60 were lethal (100% mortality within 24 hours of exposure)
Ahmed and Ayub (1999)
Temperature
The desalination process will produce a waste-stream that is about 4°C above ambient (DHI 2018). Changes in water temperature may have an impact on biota if temperatures exceed the normal range for a particular site (EPA 2017). Modelling predicted that the waste-stream, once diluted, should reduce to +0.13°C above background at the boundary of the near-field dilution zone, approximately 70 m down-current of the discharge points (DHI 2018, Appendix C). This elevation is well below the +2°C criterion (see Table 6-13, Section 6.6.1), and well within the thermal tolerances of marine organisms.
Dissolved oxygen
Under certain conditions, i.e. poor circulation, the retention of brine in the deepest parts of the receiving environment, may lead to persistent stratification and if combined with high SOD, oxygen drawdown and depletion.
87
Oxygen drawdown occurs when the rate of respiration exceeds the rate of oxygen replenishment. Reoxygenation occurs primarily via the diffusion of oxygen from the atmosphere to the ocean across the surface-water interface. In its dissolved form, it is distributed between the surface and the bottom of the water column via mixing processes (D’Adamo 2002, Okely et al 2007). The risk of oxygen depletion is increased when mixing processes are impeded during stratification.
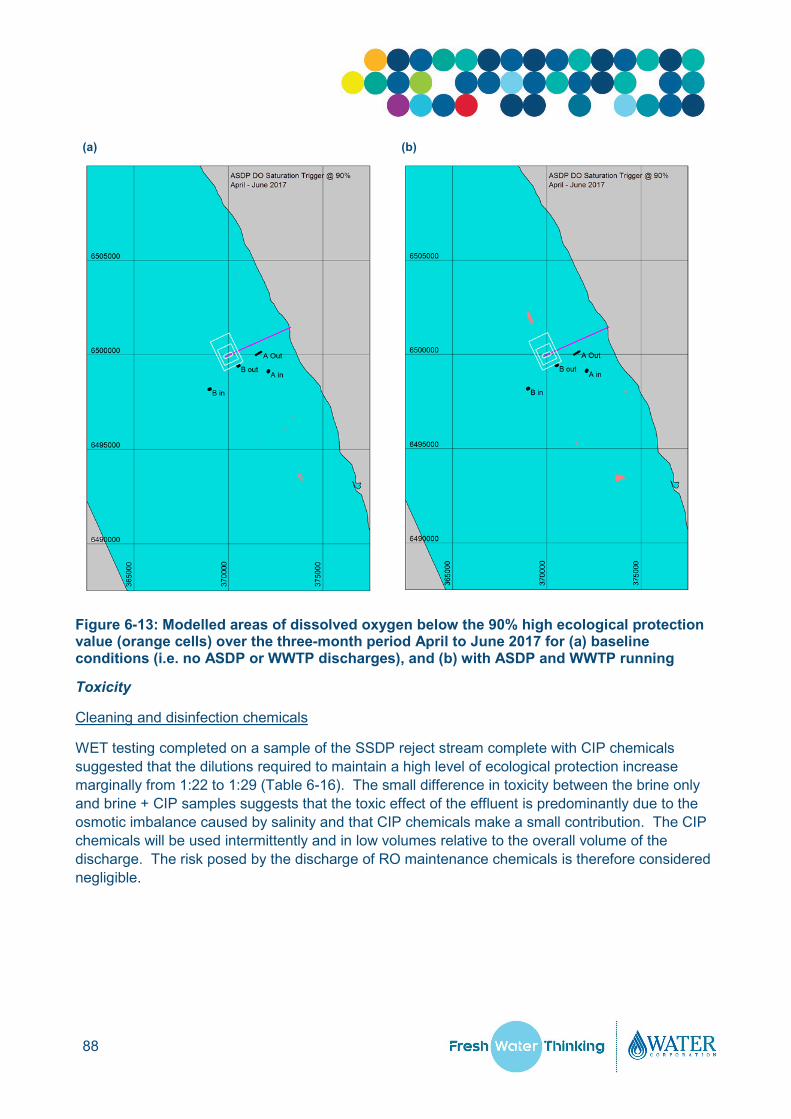
The potential for oxygen drawdown under baseline conditions (no development) and following the introduction of the SDP was examined by DHI (2019) (Section 6.4.2). Figure 6-13 shows the <90% DO saturation contours under baseline (prior to development) and operational conditions (with both the WWTP and the SDP running in parallel) (Figure 6.13 a and b, respectively)3.
The areas occupied under the <90% contours increased marginally under the operational scenario (Figure 6.13 b). Exceedances were restricted to April, May and June 2017, when regional wind speeds were at their lowest. Despite the exceedances, none of the saturation values fell below 88% (DHI 2018). The results presented are due to an increase in bottom-water residence times, brought about by the increase in bottom water density.
The modelling applied to DO was extremely sensitive to the vertical dispersion, such as that caused by surging waves (DHI 2019). Modelling used a conservative value for vertical dispersion, which effectively ‘turned off’ the effect of the waves. Even small departures from the dispersion applied resulted in the disappearance of the exceedances, with a corresponding return to baseline conditions (DHI 2018, Appendix C). For this reason, it is considered unlikely that the additional residence time imposed by the SDP plume will result in exceedances of the 90% DO criterion, despite the results of modelling presented in Figure 6.13 a and b.
3 Modelling statistics for DO calculated using a 7-day running median for entire day (note: EQG calculations are restricted to daylight hours only).
88
(a)
(b)
Figure 6-13: Modelled areas of dissolved oxygen below the 90% high ecological protection value (orange cells) over the three-month period April to June 2017 for (a) baseline conditions (i.e. no ASDP or WWTP discharges), and (b) with ASDP and WWTP running
Toxicity
Cleaning and disinfection chemicals
WET testing completed on a sample of the SSDP reject stream complete with CIP chemicals suggested that the dilutions required to maintain a high level of ecological protection increase marginally from 1:22 to 1:29 (Table 6-16). The small difference in toxicity between the brine only and brine + CIP samples suggests that the toxic effect of the effluent is predominantly due to the osmotic imbalance caused by salinity and that CIP chemicals make a small contribution. The CIP chemicals will be used intermittently and in low volumes relative to the overall volume of the discharge. The risk posed by the discharge of RO maintenance chemicals is therefore considered negligible.

89
Table 6-16: Dilutions required to achieve ecological protection derived from WET testing
Level of ecological protection Dilutions required to achieve level of protection Brine only Brine + CIP chemicals
High LEP 21.7 29.4
Moderate LEP 9.1 9.1
Shock chlorination
Shock chlorination is unlikely to be required, with Water Corporation preferring to seek an engineering solution to biofouling. The intake tunnel (described in Section 5.7) has been designed to allow marine growth of up to 100 mm after which continued growth of biofilm on the inner surface of the intake tunnel becomes self-limiting.
If shock chlorination is used at all, it will be used intermittently at weekly to fortnightly intervals. Allowances have been made in the site layout and the pipe infrastructure for the inclusion of a chemical dosing should it be required.
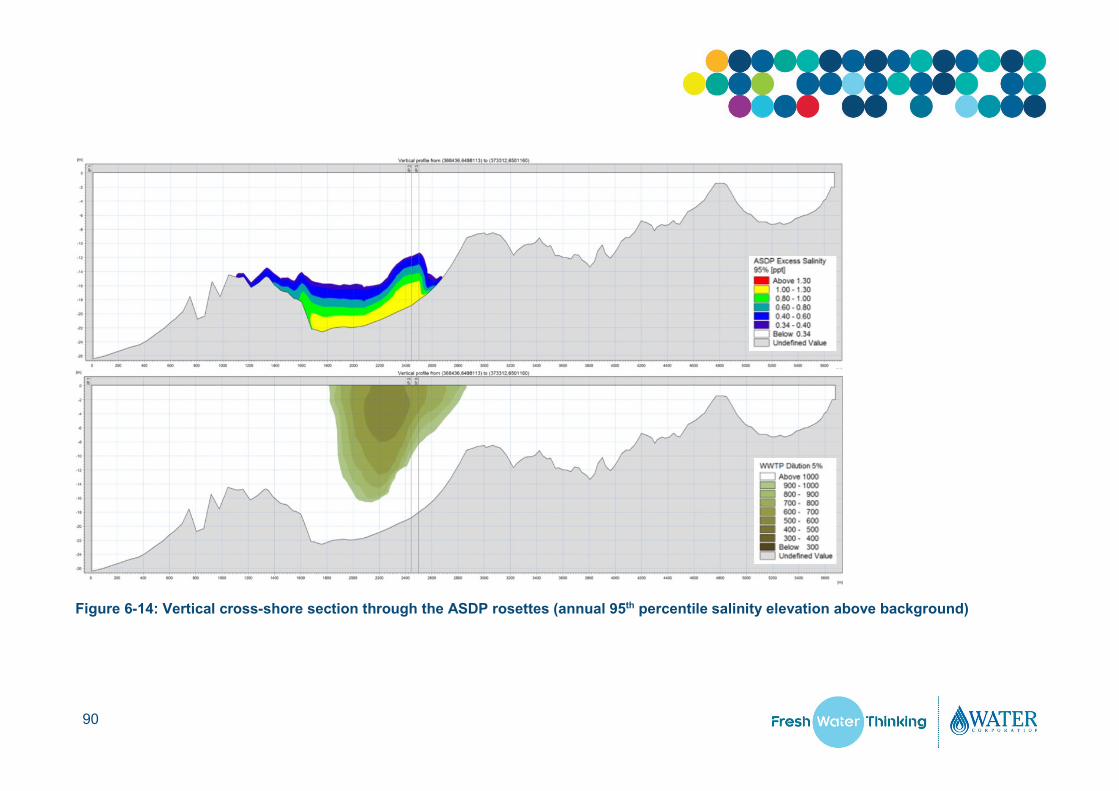
6.6.4 Cumulative impacts
Section 6.5.4 addresses the potential impacts of SDP, along with the historical and potential future impacts of the Alkimos WWTP. Modelling examined the potential for interaction between the plumes and the ramifications on dilution performance (due to the mixing of TWW with brine).
With exception of the area immediately above the Alkimos WWTP outlet, modelling indicated little scope for interaction between the respective plumes. The TWW is usually restricted to the upper two-thirds of the water column, while the brine is restricted to the bottom third. Any interaction, would occur in the middle of the water column, between two already very diluted plumes. For this reason, it was concluded that any interaction is unlikely to materially affect the dilution, dispersion and/or trajectory of the plumes in the near, or far-field environments (DHI, pers comm).
90
Figure 6-14: Vertical cross-shore section through the ASDP rosettes (annual 95th percentile salinity elevation above background)

91
6.7 Mitigation
The following mitigation hierarchy has been applied to the Proposal to ensure marine water, sediment and biota quality are maintained. Mitigation measures are summarised in Table 6-17.
Table 6-17: Mitigation hierarchy for potential construction and operational impacts on marine environmental quality
Impact Avoid Minimise Management and monitoring
Turbidity generated during construction drilling works
Intake and outlet structures: Excavations required for the marine infrastructures are at least 100 m from the nearest seagrass and macroalgal habitats. Sub-sea pipeline: On-shore disposal of excavated sediment from the TBM will avoid potential for direct and/or indirect impacts on marine quality associated with disposal of dredge spoil at sea.
Water Corporation has developed a conceptual model to predict drill cutting dispersion to assess the fate of particles. Pre-selection of the tunnelling method to minimise impacts to the marine benthic environment. Use of an extended sleeve when drilling to manage the dispersal of drill cuttings.
Implementation of a Construction Marine Environmental Framework (Water Corporation, in prep).
Discharge of seawater return
The planned location of the desalination discharge outlet is sufficiently separated from benthic macroinvertebrate communities so that mixing/dilution occurs prior to the plume reaching these communities.
Water Corporation has developed a hydrodynamic model to predict changes in marine quality associated with discharge of brine during operations. Seawater outlet diffusers will be oriented to optimise mixing and therefore minimise stratification. The desalination outlet diffuser ports have been designed to optimise mixing.
Implementation of an ASDP Operational Environmental Management Plan (Water Corporation, in prep). Spatially define a LEPA to ensure marine quality around the SDP diffuser is managed to achieve a high level of ecological protection beyond the near-field mixing zone.
Discharge of chemicals used in SDP maintenance
Chemicals to be well managed and used only as necessary.
Water Corporation has developed a hydrodynamic model to predict changes in marine quality (toxicants) associated with discharge of brine during operations.
Implementation of an ASDP Operational Environmental Management Plan (Water Corp, in prep). Spatially define a LEPA to ensure marine quality around the SDP diffuser is managed to achieve a high level of ecological protection beyond the near-field mixing zone.

92
6.7.1 Construction
A preliminary register of measurable and/or auditable environmental commitments to manage the environmental impacts associated with construction activities (Section 6.6.2) are provided in Table 6-18. Environmental monitoring and management will be outlined in further detail in a MCEMF to be finalised prior to commencement of dredging. It is anticipated that the MCEMF will include:
• detailed monitoring and management requirements (in line with Table 6-18)
• timing/frequency of monitoring and management commitments
• responsibilities for monitoring and management commitments
• contingency planning/measures in the event of an environmental or safety issue
• stakeholder consultation
• reporting requirements to government and environmental regulators.
Table 6-18: Relevant environmental objectives, performance indicators and proposed measurement criteria
Environmental objective
Performance criteria1
Standards2 Performance indicators3
To maintain the quality of water, sediment and biota so that environmental values are protected
No persistent impacts to marine environmental quality as a result of drilling activities
Detailed procedures for hydrocarbon spill/waste generation management, including:
• comply with the International Maritime Organisation (IMO) International Convention for the Prevention of Pollution from Ships (MARPOL compliant)
• spill kit kept on site at all times, with all necessary materials for mitigation of accidental spillage of hydrocarbons
• implement procedures to maintain clean and tidy work areas, including the safe storage of all potentially hazardous substances
• detailed procedures for toxicity management, including:
o where practicable, position the ocean outlet at least 100 m from the nearest benthic macrofaunal and macroalgal communities or at a distance sufficient to achieve toxicant concentrations lower than the EPA’s high protection criteria
o manage inputs and reduce concentrations of toxicants as far as reasonably practicable.
System in place to ensure waste management and spill prevention procedures. Adherence to refuelling procedures. Audit spill response and clean-up procedures.

93
Environmental objective
Performance criteria1
Standards2 Performance indicators3
Detailed procedures for turbidity management, including:
• all excavated material generated during tunnelling to be transported out of the shoreward end of the tunnel and disposed of as clean landfill.
1. Performance criteria = the performance criteria are the proposal-specific desired state for an environmental factor/s that an organisation sets out to achieve from the implementation of outcome-based provisions.
2. Standards = can include company standards, regulatory requirements, and recognised Australian and International Standards.
3. Performance indicators = measurable/auditable outcomes to assess the company's environmental performance.
6.7.2 Operation
A preliminary register of measurable and/or auditable environmental commitments to manage the marine environmental impacts from the SDP plant operation (Section 6.5) are provided in Table 6-19. At the commencement of operation, environmental quality will be monitored continuously under an EPA approved marine operational environmental management plan (MOEMP). The MOEMP will be developed according to the EPA’s environmental quality management framework (EPA 2106g), which involves a risk-based approach to environmental monitoring.
Details of the monitoring program, including the adopted performance standards, will be outlined in MOEMP, which will be finalised prior to commencement of plant operations. It is anticipated that the MOEMP will include:
• detailed monitoring and management requirements (in-line with Table 6-19)
• timing/frequency of monitoring and management commitments
• responsibilities for monitoring and management commitments
• contingency planning/measures in the event of an environmental or safety issue
• stakeholder consultation
• reporting requirements to government and environmental regulators.

94
Table 6-19: Relevant environmental objectives, performance indicators and proposed measurement criteria
Environmental objective
Performance criteria1
Standards2 Performance indicators3
To maintain the quality of water, sediment and biota so that environmental values are protected.
No persistent impacts to marine environmental quality as result of RO return water discharges.
Detailed procedures for: • implementation of an
MOEMP to ensure compliance with EPA (2017) environmental quality criteria within the HEPA.
Detailed management procedures for RO discharges, including: • on-going water quality
monitoring • control of RO discharges at
ASDP plant.
• evidence of normal plant operation and performance
• regular third-party audits of MOEMP outcomes
• evidence of compliance with MOEMP objectives and procedures
• regular reporting of performance against the EQC.
1. Performance criteria = the performance criteria are the proposal-specific desired state for an environmental factor/s that an organisation sets out to achieve from the implementation of outcome-based provisions.
2. Standards = can include company standards, regulatory requirements, and recognised Australian and International Standards.
3. Performance indicators = measurable/auditable outcomes to assess the company's environmental performance.
6.8 Predicted outcome
A key component of this assessment was to identify the stressors related to the construction and operation of a desalination plant, and how they may affect marine environmental quality. These included: (a) the disturbance of the benthic environment due to placement of marine infrastructure and (b) the discharge of return seawater (brine) to the marine environment.
Water Corporation intend to mitigate the potential impacts by: (a) installing pipelines in sub-marine tunnels (as excavated using a TBM); and (b) optimising the design of the outlet diffusers, to achieve dilutions compliant with high ecological protection criteria.
For salinity, modelling predicted that the proposed SDP diffusers should achieve a 1 in 30 dilution within 70 m of the discharge point. A 1:30 dilution was found sufficient to reduce near field elevations to within +1.1 psu of background, which is well below the +1.3 psu criterion. When added to typical background salinities (Table 6-14), these elevations were within the tolerable range for marine species (Table 6.16) (Diaz and Rosenberg 1995).
The commissioning phase requires flushing and disinfection of the pipelines and RO infrastructure. The essentially freshwater effluent from the pressure test and disinfection processes will be buoyant in seawater and will form a plume that will naturally rise to the water surface. Water Corporation has committed to no residual chlorine or TRO in the pressure test and disinfection waters discharged to the marine environment through the diffuser outlet following treatment.

95
The impacts of pH will be controlled by neutralisation with sulphuric acid (H2SO4) if the pH of the discharge does not meet the criteria stated in the ANZEG (2018) guidelines. This requires the Water Corporation to ensure the discharge is not outside the 8.0–8.4 pH range required to be in compliance with discharge to south west inshore marine areas.
To ensure compliance, the pH of the pressure test water and disinfection water will be field tested using a water quality meter at the discharge point prior to discharge. Testing will take place to ensure that there is no residual chlorine in the wastewater discharged into the marine environment.
Considering the potential risks from the chemical additives and the respective management measures to be implemented, no significant adverse environmental impacts are expected to result from the discharge of the treated disinfection and pressure test waters beyond the boundary of the LEPA. Water Corporation is of the view that all relevant known impacts have been sufficiently incorporated into the impact assessment and that there is no requirement for further assessment on marine quality within the Alkimos marine environment.
The use of cleaning (CIP) and disinfection chemicals during routine plant maintenance was examined in the context of frequency of use, and potential toxicity after dilution. Material concentrations of contaminants are not anticipated in the discharge waters, and will be diluted both within the discharged waste (brine) stream and then further by seawater after discharge. Any residual contaminants entrained within the waste stream will diminish rapidly.
The potential for DO drawdown following the introduction of the SPD was examined by DHI (2019) (Section 6.4.2). DO levels were maintained at >90% saturation for most of the year. The only exception was in April, when values dipped to 88% saturation in isolated patches (DHI 2018). These results are highly conservative, and most likely an artefact of the modelling. Even small departures from the dispersion applied in the modelling resulted in the elimination of the exceedances, and a return to baseline conditions (DHI 2019, Appendix B). For this reason, it is considered unlikely that the SOD demand in combination with the additional residence time caused by the brine will result in exceedances of the 90% DO criterion.
Taking the above into consideration, the Proposal is not expected to compromise the EPA’s high ecological protection criteria beyond 70 m from the outlets. Water Corporation will apply to the EPA to establish a low ecological protection area (LEPA) of a 100 m radius around the outlet diffusers (MOEMP, Water Corporation, in prep). The establishment of a LEPA based on the area of the near-field mixing zone is in keeping with EPA (2016c) and ANZG (2019) guidance.

96
7. Benthic Communities and Habitats
7.1 EPA objective
The EPA’s environmental objective for benthic communities and habitats is:
“To protect benthic communities and habitats so that biological diversity and ecological integrity are maintained” (EPA 2018b).
7.2 Policy and guidance
The relevant EPA policies and guidelines and the scope of each of these as relevant to the Proposal, are presented in Table 7-1.
Table 7-1: Policies and guidelines
Policy or guidance Consideration Factor Guideline – Benthic Communities and Habitats (EPA 2016a)
Environmental Factor Guidelines (EFGs) pertain to the protection of Environmental Factors; while Environmental Factor Technical Guidance documents provide additional technical detail to the EFGs.
Technical Guidance – Benthic Communities and Habitats (EPA 2016e)
The EPA (2016e) Technical Guidance - Benthic Communities and Habitats provides a framework for the assessment of impacts to BCH by a Proposal.
7.3 Overview of studies
BCHs at Alkimos are well documented following two separate rounds of mapping (Oceanica 2005c; BMT 2018d) and six years of routine macroalgal community monitoring (Oceanica 2009b, 2010, 2011, 2012, 2013, BMT Oceanica 2014a) (Table 7-2). Figure 7-1 outlines the spatial and temporal extent of studies undertaken to: (a) support the approvals process for the Alkimos WWTP (approved 2007 under Ministerial Statement 755); (b) satisfy the commitments contained within the MTWDM&MP (Water Corporation 2016); and (c) to inform the approvals process for the present Proposal. The purpose of the historical and contemporary mapping studies and the macroalgal algal community surveys are described in Table 7-2.

Coordinate System: GDA 1994 MGA Zone 50
Date: 7/03/2019
345000
345000
360000
360000
375000
375000
390000
390000
6500000
6500000
6515000
6515000
© 2019. Whilst every care has been taken to prepare this map, BMT & Linc Property makes no representations or warranties about its accuracy, reliability, completeness or suitability for any particular purpose and cannot accept liability and responsibility of any kind (whether in contract, tort or otherwise) for any expenses, losses, damagesand/or costs (including indirect or consequential damage) which are or may be incurred by any party as a result of the map being inaccurate, incomplete or unsuitable in any way and for any reason.
G:\SpatialData\Client\WaterCorp\1334_11Alkimos EIA\005_ModellingSummary\GIS_Requests\005_02\005_02alkalglauA4_20190226.mxd
Client: Water Corporation, 3/2019. Created by: BMT
0 1.5 3km
±Scale 1:192,989 at A4
I N D I A N
O C E A N
LOCALITYMAP
WESTERN
AUSTRALIA
Mapped Area
[email protected] | www.bmt.org
Figure 7-1: Spatial extent of historical and contemporary benthic habitat mapping studies
Legend
Study Area 2009 - 2015
Alkimos Outlet Study Area 2017
Study Area 2005

98
Table 7-2: Historical and contemporary benthic studies used to inform the Proposal
Relevant study / monitoring program
Description
Baseline habitat mapping prior to WWTP operation (Oceanica 2005c)
Benthic habitat mapping in 2005 focussed primarily on the proposed route of the wastewater treatment plant ocean outlet and encompassed an area of 370 ha. The classification of the aerial imagery was supplemented by ground-truthing using towed underwater video and dives. A total of 24 towed video transects, ranging from approximately 200–1000 m in length, were distributed over the survey area. The habitat mapping was used to determine the potential direct and indirect losses of benthic primary producer habitat (BPPH) from the construction of the Alkimos WWTP.
Baseline infauna survey prior to WWTP operation (Oceanica 2005c)
In 2005, a baseline infauna survey was completed at eight sites west of Alkimos (Oceanica 2005c). The objective was to determine the species richness and diversity of Infaunal communities prior to the construction of the Alkimos WWTP. At each site, five replicate sediment cores were collected to a depth of 200 mm. Four of the replicate samples from each site were sieved using a 1 mm sieve, while the fifth was sieved using a 0.5 mm sieve to capture smaller infauna. Infauna were identified to the lowest taxonomic level possible.
Routine macroalgal community monitoring during WWTP operation (Oceanica 2009-2013, BMT Oceanica 2014a)
Macroalgal community monitoring was completed between 2009 and 2014 at three reference locations (2 north of Alkimos, and 1 south) and one impact location (adjacent to the outlet) (Figure 7-1). Within each of the four locations, five study sites were established based on previously determined depths and reef rugosity criteria (Oceanica 2010). Prior to sampling, major macroalgal species were consolidated into seven super-categories based on their morphology and function.
ASDP impact assessment habitat mapping (BMT 2018d)
The most recent marine habitat mapping study covered a much larger area (5400 ha) than the 2005 survey. Mapping was undertaken using multispectral satellite imagery from December 2016, which was selected based on its clarity, low turbidity and near absence of artefacts such as sun-glint. Ground truthing data were used to manually define seagrass and macroalgal habitats over the vegetated areas.
7.4 Receiving environment
7.4.1 Alkimos benthic communities and habitats
Distribution of benthic habitats at Alkimos
BCHs are dominated by a network of low to high relief reef structures, interspersed between sandy lagoons. Macroalgal communities consisting primarily of kelp and foliose brown morphological groups, dominate the reef structures, whereas seagrasses tend to predominate in the shallow lagoons near the shoreline (Oceanica 2010).

99
The reef structures consist of as an inner and outer reef platform separated by a deep (20-23 m), sand dominated lagoon (Figure 7-2). The morphology of the benthic environment varies in rugosity, from low relief to high relief, with networks of crevasses and caves. The reef structures provide habitats for a variety of reef fishes and commercially important invertebrates, including octopus and western rock lobster (Oceanica 2010) (see Section 8.4).
The proposed SDP outlet and intake sites are characterised by either sand or platform limestone covered in sand veneer (based on inspection of aerial photographs). The average depth of the inner reef is ~10 m and the outer ~20 m. The sediments in the area consist of medium sand grains and coarse shell fragments with a low organic content (Oceanica 2005b, 2011).
Macroalgal assemblages (grouped according to the morphological criteria of Littler (1980), Littler & Littler (1980) and Steneck & Dethier (1994)) consist of kelp (Ecklonia radiata), robust browns, foliose browns, foliose reds, coralline reds, foliose greens, turf algae and lettuce algae (Ulva sp.) (Oceanica 2010) (Table 7-3).
Table 7-3: Morphological groups along with representative common genera used for macroalgae monitoring at Alkimos between 2009 and 2015
Morphological group Species Robust browns Scytothalia, Platythalia, Cystophora Foliose browns Dictyopteris, Dictyota, Padina, Spatoglossum, Glossophora Foliose reds Hennedya, Plocamium, Callophycus Foliose greens Caulerpa, Bryopsis Coraline reds Amphiroa, Metamastophora, Metagoniolithon Ulva spp. Various Turfing algae Various
Seagrasses are primarily distributed in nearshore waters and are most prevalent in the north of the mapped area (Figure 7-2). The nearshore seagrass communities are largely dominated by A. griffithii and A. antarctica. Other species included: P. coriacea, P. australis and P. sinuosa; Haolphila spp.; Zostera spp. (Table 7-4 and Figure 7-2).
The mapped BCHs are representative of known regional habitats. No new BCH assemblages were identified during the mapping survey, when compared to historical BCH studies in the area (Oceanica 2005c, Oceanica 2010).

100
This page is intentionally blank

Coordinate System: GDA 1994 MGA Zone 50
Date: 7/03/2019
[email protected] | www.bmt.org
368000
368000
373000
373000
6495000
6495000
6500000
6500000
6505000
6505000
G:\SpatialData\Client\WaterCorp\1334_11Alkimos EIA\005_ModellingSummary\GIS_Requests\005_02\005_02alkhabitatA3_20190218.mxd
© 2019. Whilst every care has been taken to prepare this map, bmt makes no representations or warranties about its accuracy, reliability, completeness or suitability for any particular purpose and cannot accept liability
and responsibility of any kind (whether in contract, tort or otherwise) for any expenses, losses, damages and/or costs (including indirect or consequential damage) which are or may be incurred by any party as a result of the map being inaccurate,
incomplete or unsuitable in any way and for any reason.
Client: Water Corporation, 3/2019. Created by: BMT
0 500 1,000m
±Scale 1:40,000 at A3
Legend
Benthic Habitat
Bare sand
Unknown
Exposed Reef
Macroalgae Reef
(Mixed Assemblage)
Macroalgae Reef (Mixed
Assemblage dominated by Sargassum)
Macroalgae Reef (Mixed Assemblage dominated
by Ecklonia; <30% Caulerpa and Mixed Brown)
Macroalgae Reef (Mixed Assemblage; <30%
Ecklonia, Caulerpa, Mixed Brown, Other
Brown and Mixed Red); <30% Filter Feeders
Macroalgae Reef (Mixed Assemblage dominated
by Ecklonia; <30% Caulerpa, Mixed Brown and
Other Brown); <30% Filter Feeders
Macroalgae Reef (Mixed Assemblage dominated
by Ecklonia; <30% Caulerpa, Mixed Brown,
Sargassum, Mixed Red and Encrusting Red)
Macroalgae Reef (Mixed Assemblage; <30%
Ecklonia and Sargassum); <30% Seagrass
(Mixed Assemblage)
Macroalgae Reef (Mixed Assemblage; <30% Ecklonia, Caulerpa,
Mixed Brown, Mixed Red and Encrusting Red); <30% Seagrass
(Mixed Assemblage)
Macroalgae Reef (Mixed Assemblage; <30% Ecklonia, Mixed
Brown); <30% Seagrass (Mixed Assemblage; <30% Posidonia)
and Filter Feeders
Macroalgae Reef (Mixed Assemblage dominated by Mixed Brown;
<30% Mixed Red and Encrusting Red); <30% Seagrass (Mixed
Assemblage)
Macroalgae Reef (Mixed Assemblage; <30% Ecklonia, Mixed
Brown); <30% Seagrass (Mixed Assemblage) and Filter Feeders
Macroalgae Reef (Mixed Assemblage dominated by Mixed Brown;
<30% Sargassum); <30% Seagrass (Mixed Assemblage)
Macroalgae Reef (Mixed Assemblage; <30% Sargassum); <30%
Seagrass (Mixed Assemblage; <30% Amphibolis)
Seagrass (Amphibolis; <30% Posidonia, Zostera, Mixed
Assemblage); <30% Macroalgae (Mixed Brown)
Seagrass (Mixed Assemblage; <30% Amphibolis and Halophila);
<30% Macroalgae (Mixed assemblage; <30% Sargassum)
Seagrass (Mixed Assemblage dominated by Amphibolis and
Posidonia); <30% Macroalgae (Mixed Assemblage, Ecklonia,
Sargassum, Mixed Brown and Other Brown)
Seagrass (Mixed Assemblage dominated by Amphibolis; <30%
Posidonia and Zostera)
Macroalgae Reef (Mixed Assemblage dominated by Ecklonia;
<30% Caulerpa, Mixed Brown and Other Brown); <30% Seagrass
(Mixed Assemblage) and Filter Feeders
Seagrass (Amphibolis; <30% Mixed Assemblage); <30%
Macroalgae (Mixed Assemblage; <30% Ecklonia, Sargassum
and Other Brown)
Figure 7-2: Alkimos benthic habitat classification

102
This page is intentionally blank

103
Table 7-4: Classification of benthic habitats mapped at Alkimos in 2017
Dominant habitat category
Habitat description Area (ha)
Area (%)
Macroalgal dominated reef
Mixed Assemblage dominated by Ecklonia radiata; <30% Caulerpa spp. and Mixed Brown
555 10
Mixed Assemblage dominated by Ecklonia radiata; <30% Caulerpa spp., Mixed Brown and Other Brown; <30% Filter Feeders
330 6.1
Mixed Assemblage dominated by Ecklonia radiata; <30% Caulerpa spp., Mixed Brown and Other Brown); <30% Seagrass (Mixed Assemblage) and Filter Feeders
119 2.2
Mixed Assemblage dominated by Ecklonia radiata; <30% Caulerpa spp., Mixed Brown, Sargassum spp., Mixed Red and Encrusting Red
645 12
Mixed Assemblage dominated by Mixed Brown; <30% Mixed Red and Encrusting Red; <30% Seagrass (Mixed Assemblage)
25 0.47
Mixed Assemblage dominated by Mixed Brown; <30% Sargassum spp.; <30% Seagrass (Mixed Assemblage)
21 0.39
Mixed Assemblage dominated by Sargassum spp. 10 0.19 Mixed Assemblage 0.56 0.01 Mixed Assemblage; <30% Ecklonia radiata and Sargassum spp.; <30% Seagrass (Mixed Assemblage)
43 0.79
Mixed Assemblage; <30% Ecklonia radiata, Caulerpa spp., Mixed Brown, Mixed Red and Encrusting Red; <30% Seagrass (Mixed Assemblage)
77 1.4
Mixed Assemblage; <30% Ecklonia radiata, Caulerpa spp., Mixed Brown, Other Brown and Mixed Red; <30% Filter Feeders
157 2.9
Mixed Assemblage; <30% Ecklonia radiata, Mixed Brown; <30% Seagrass (Mixed Assemblage) and Filter Feeders
42 0.78
Mixed Assemblage; <30% Ecklonia radiata, Mixed Brown); <30% Seagrass (Mixed Assemblage; <30% Posidonia spp.) and Filter Feeders
139 2.6
Mixed Assemblage; <30% Sargassum spp.); <30% Seagrass (Mixed Assemblage; <30% Amphibolis spp.)
105 1.9
Subtotal 2269 42

104
Dominant habitat category
Habitat description Area (ha)
Area (%)
Seagrass dominated
Amphibolis spp.; <30% Mixed Assemblage; <30% Macroalgae (Mixed Assemblage; <30% Ecklonia radiata, Sargassum spp. and Other Brown)
147 2.7
Amphibolis spp.; <30% Posidonia spp., Zostera spp., Mixed Assemblage; <30% Macroalgae (Mixed Brown)
17 0.32
Mixed Assemblage dominated by Amphibolis spp. and Posidonia spp.; <30% Macroalgae (Mixed Assemblage, Ecklonia radiata, Sargassum spp., Mixed Brown and Other Brown)
81 1.5
Mixed Assemblage dominated by Amphibolis spp.; <30% Posidonia spp. and Zostera spp.
17 0.32
Mixed Assemblage; <30% Amphibolis spp. and Halophila spp.); <30% Macroalgae (Mixed assemblage; <30% Sargassum spp.)
108 2.0
Subtotal 371 6.9 Other Bare sand 2742 51
Exposed reef 9.1 0.17 Unknown/unidentifiable 7.7 0.14 Subtotal 2758 51
Total 5398 100
Infauna communities at Alkimos4
Infaunal communities at Alkimos are relatively species-poor (Table 7-5 and Figure 7-3; Oceanica 2005c). Of the taxa present, polychaetes and crustaceans are the most numerous followed by molluscs, pycnogonids and sipunculids. Polychaetes and crustaceans dominated the samples both in terms of the number of individuals and the number of species (species richness) (Figure 7-3).
From a multivariate perspective, infaunal communities were variable between sites and between replicate samples from the same site. There were no apparent changes in community structure with changing water depth, sediment type or distance offshore. The findings were not dissimilar to previous studies in high energy, low nutrient environments (for example Wildsmith et al 2005) where similarly low levels of infauna have been reported.
4 Infauna is the animal community living within the sediment, such as /polychaete worms, molluscs and crustaceans.

105
Table 7-5: Mean number of individuals, species and species diversity of infauna
Site Sediment type Number of individuals
Number of species
Species diversity
1 Medium/fine sand 24 11 1.9 2 Medium/fine sand 21 8 1.2 3 Medium sand with some
fines 18 7 1.0
4 Medium sand 11 7 1.4 5 Medium sand 15 9 2.1 6 Coarse sand with shell
fragments 4 4 1.4
7 Medium/fine sand 9 7 1.2 8 Medium sand with shell
fragments 5 3 0.9

Coordinate System: GDA 1994 MGA Zone 50
Date: 18/03/2019
87
6
5
4
3
2
1
370000
370000
371300
371300
372600
372600
6500000
6500000
6501000
6501000
© 2019. Whilst every care has been taken to prepare this map, BMT & Linc Property makes no representations or warranties about its accuracy, reliability, completeness or suitability for any particular purpose and cannot accept liability and responsibility of any kind (whether in contract, tort or otherwise) for any expenses, losses, damagesand/or costs (including indirect or consequential damage) which are or may be incurred by any party as a result of the map being inaccurate, incomplete or unsuitable in any way and for any reason.
G:\SpatialData\Client\WaterCorp\1334_11Alkimos EIA\005_ModellingSummary\GIS_Requests\005_02\005_02sedalkA4_20190218.mxd
Data source: Digital Globe December 2016. Client: Water Corporation, 3/2019. Created by: BMT
0 250 500m
±Scale 1:15,000 at A4 % Taxonomic composition of
benthic communitiesMolluscs
Polychaetes
Sipunculids
Crustaceans
Pycnogonids
[email protected] | www.bmt.org
Figure 7-3: Infauna taxonomic richness
Legend
Benthic Survey Area
Alkimos WWTP Outlet
Alkimos WWTP Diffuser

107
7.5 Potential impacts
7.5.1 Potential construction impacts
Figure 7-4 and Table 7-6 list the relevant cause-effect pathways and the impacts that may arise during proposed construction activities. The potential for impact to BCH due to construction activities were assessed via a desktop review and conceptual modelling. Modelling investigated the theoretical dispersal of excavated material during the installation of the marine risers, intake structures and outlet diffusers, under a worst-case scenario. Section 6 of this document addressed the effects of the construction phase on water and sediment quality. Section 7.6.2 addresses the potential flow on effects to BCH.
Figure 7-4: Potential impacts to benthic communities and habitat and flow-on effects, associated with Alkimos seawater desalination plant construction and commissioning

108
Table 7-6: Potential construction impacts to benthic communities and habitats
Potential impacts Context Direct loss of BCH Direct removal of BCH through construction activities (drilling,
jack up barge placement, anchoring, etc.). Secondary & tertiary loss of BCH (shading / smothering)
There is potential for short-term elevations in turbidity generated through excavation of the foundations, which may lead to increased TSS and a reduction in light availability. There is also potential for smothering of BCH due to deposition of drill cutting materials.
Secondary loss BCH (toxicity) Intermittent or short-term releases of toxicants used in grouting and the commissioning phases of operations, may impact BCH near the excavation sites and in the near field dilution zones around the diffusers.
7.5.2 Potential operational impacts
Figure 7-5 and Table 7-7 list the relevant cause-effect pathways and the impacts that may arise during proposed operations. Risks to BCH were assessed using a three-dimensional numerical model (DHI 2019, Section 6.3.2) to map the trajectory of the brine across the benthic environment. The potential effects of the Proposal to water and sediment quality were addressed in Section 6. Section 7.6.3 of this document addresses the potential flow on effects to BCH.

109
Figure 7-5: Potential impacts to benthic communities and habitat, and flow-on effects, associated with operation of the Alkimos seawater desalination plant

110
Table 7-7: Potential operational impacts to benthic communities and habitats
Potential impacts Context Tertiary effects (reduced DO) Reduced mixing due to stratification may lead to oxygen drawdown and
depletion. There is potential for impacts to marine macroinvertebrates if dissolved oxygen levels fall below certain critical thresholds.
Tertiary effects (stressors) The discharge of brine to the receiving environment may lead to persistent increases in low-lying habitats. Elevated salinity may result in osmotic stress and ion toxicity which affect plant water relations, ion concentrations in cytoplasm and the vacuole and growth and photosynthesis (Cambridge et al 2019). In addition, the discharge of brine at temperatures higher than ambient may lead to artificial warming of the receiving environment in the immediate vicinity of the diffuser. Persistent elevations may exceed the tolerance limits of seagrasses, macroalgal and macroinvertebrate communities.
Secondary & tertiary effects (toxicity)
The initial commissioning phase will involve short-term (4 months) flushing and hydrostatic testing of reverse osmosis infrastructure. Cleaning fluids will be used creating potential for short term toxicity near the diffuser. The introduction of toxicants may adversely impact seagrasses, macroalgal and macroinvertebrate communities near the diffuser.
7.6 Assessment of impacts
The EPA's Technical Guidance Protection of Benthic Communities and Habitats (EPA 2016e) was used to determine the potential extent and significance of direct and indirect impacts to BCH resulting from the ASDP Proposal.
7.6.1 Local Assessment Unit
EPA (2016f) provides a risk-based spatial assessment framework for evaluating cumulative loss or serious damage to BCH. The framework has been applied here to determine the extent of direct and/or indirect impacts to seagrass and macroalgal habitats due to ASDP construction and operational activities. The assessment must consider all losses:
• prior to all human-induced disturbance
• existing at the time of the proposal
• remaining after implementation of the proposal.
Local Assessment Units (LAU) are defined areas within which the impact of a proposal on BCH is spatially assessed (EPA 2016e). LAUs are not standardised, and must be defined individually for each Proposal, although as a guide a LAU in the order of 50 km2 (5000 ha) should be used for assessments in Western Australia (EPA 2016f). A LAU of 5 398 ha has been defined for the ASDP (Figure 7-6) which is inclusive of the zone of impact predicted for the Alkimos WWTP, to allow for a cumulative impact assessment. The LAU for the ASDP encompasses the entire area of BCH mapped in BMT (2018b) (Figure 7-6).