
March 2015 Investor Presentation
35
March 2015
-
Upload
investortyson -
Category
Investor Relations
-
view
4.107 -
download
1
Transcript of March 2015 Investor Presentation

March 2015
Forward-Looking Statements
Certain information contained in this presentation may constitute forward-looking statements, such as statements relating to expected performance. These forward-looking statements are subject to a number of factors and uncertainties which could cause our actual results and experiences to differ materially from the anticipated results and expectations expressed in suchforward-looking statements. We wish to caution readers not to place undue reliance on any forward-looking statements, which speak only as of the date made. Among the factors that may cause actual results and experiences to differ from anticipated results and expectations expressed in such forward-looking statements are the following: (i) the effect of, or changes in, general economic conditions; (ii) fluctuations in the cost and availability of inputs and raw materials, such as live cattle, live swine, feed grains (including corn and soybean meal) and energy; (iii) market conditions for finished products, including competition from other global and domestic food processors, supply and pricing of competing products and alternative proteins and demand for alternative proteins; (iv) successful rationalization of existing facilities and operating efficiencies of the facilities; (v) risks associated with our commodity purchasing activities; (vi) access to foreign markets together with foreign economic conditions, including currency fluctuations, import/export restrictions and foreign politics; (vii) outbreak of a livestock disease (such as avian influenza (AI) or bovine spongiform encephalopathy (BSE)), which could have an adverse effect on livestock we own, the availability of livestock we purchase, consumer perception of certain protein products or our ability to access certain domesticand foreign markets; (viii) changes in availability and relative costs of labor and contract growers and our ability to maintain good relationships with employees, labor unions, contract growers and independent producers providing us livestock; (ix) issues related to food safety, including costs resulting from product recalls, regulatory compliance and any related claims or litigation; (x) changes in consumer preference and diets and our ability to identify and react to consumer trends; (xi) significant marketing plan changes by large customers or loss of one or more large customers; (xii) adverse results from litigation; (xiii) impacts on our operations caused by factors and forces beyond our control, such as natural disasters, fire, bioterrorism, pandemic or extreme weather; (xiv) risks associated with leverage, including cost increases due to rising interest rates or changes in debt ratings or outlook; (xv) compliance with and changes to regulations and laws (both domestic and foreign), including changes in accounting standards, tax laws, environmental laws, agricultural laws and occupational, health and safety laws; (xvi) our ability to make effective acquisitions or joint ventures and successfully integrate newly acquired businesses into existing operations; (xvii) failures or security breaches of our information technology systems; (xviii) effectiveness of advertising and marketing programs; and (xix) those factors listed under Item 1A. “Risk Factors” included in our Annual Report filed on Form 10-K for the period ended September 27, 2014.
Tyson Foods, Inc. Investor Presentation | March 2015 | 2
Dennis Leatherby oversees worldwide finance and accounting functions for Tyson Foods and represents the company on matters involving investors, banks, ratings agencies, auditors and other financial matters. Dennis, who has played an active role in many of Tyson Foods’ acquisitions, was appointed executive vice president and chief financial officer in 2008.
He joined Tyson Foods in 1990 as assistant treasurer and has since held several other finance-related management positions, including Tyson Foods’ senior vice president of finance and treasurer, and interim chief financial officer.
Dennis ensures the company’s fiscal responsibilities are in line with its stated commitment to make great food and make a difference in people’s lives. He has helped Tyson Foods become one of the world’s largest processors and
marketers of chicken, beef, pork and prepared foods, and a leader that takes pride in the safety and quality of its products.
He was named Outstanding Financial Executive of the Year (2009-10) by his alma mater, Kansas State University College of Business Administration. He is currently on the board of the Garrison Financial Institute within the Sam M. Walton College of Business at the University of Arkansas; an advisory council member of the Kansas State University, College of Business Administration; and member of the Staff-Parish Relations Committee at Central United Methodist Church in Fayetteville, Ark. Dennis earned bachelor’s degrees in both accounting and finance from Kansas State University.
Dennis LeatherbyExecutive Vice President & Chief Financial Officer
Tyson Foods, Inc. Investor Presentation | March 2015 | 3
Andy Callahan manages all retail consumer brands, including Hillshire consumer brands (such as Jimmy Dean®, Ball Park®, Hillshire Farm®, and Sara Lee®), Tyson's consumer brands (such as Tyson® frozen, value-added poultry and Wright® Brand bacon) and Hillshire's Gourmet Food Group.
Andy previously served as president, Retail for The Hillshire Brands Company, managing the company's consumer-facing meats and frozen desserts businesses in North America. Prior to this position, he served as senior vice president, chief customer officer for Sara Lee Corporation's North American operations, as well as president of Sara Lee's $1.8 billion North American Foodservice segment and vice president of marketing for Sara Lee's breakfast and snacking business unit.
Andy joined Sara Lee in 2008 from Kraft Foods, Inc., where he spent 13 years in various positions in increasing responsibility in marketing, sales, and general management. His roles at Kraft included vice president, customer development on Kraft's SUPERVALU business, general manager of The Churney Company and leading Kraft's processed cheese portfolio.
Prior to Kraft, Andy spent seven years in the Navy as a Naval Flight Officer.
Andy holds a bachelor of science degree in mechanical engineering from the United States Naval Academy and a master of business administration degree from Florida Institute of Technology.
Andy CallahanPresident, Retail Packaged Brands
Tyson Foods, Inc. Investor Presentation | March 2015 | 4
As vice president of investor relations and assistant secretary for Tyson Foods, Jon Kathol oversees all aspects of the company’s shareholder and investor communications.
Jon has more than 30 years of experience in the food industry. He began his career in 1984 when he joinedIBP, inc. in accounting, and has since held various management roles with IBP, Hudson Foods and Tyson Foods. He has worked in several major business units for Tyson Foods, including beef, pork, prepared foods and chicken. During his time at Tyson Foods, he has worked within finance, accounting, general management and pricing optimization.
Jon is a Nebraska native where he grew up in a rural community. He holds a bachelor’s degree in business administration from the University of South Dakota and an MBA from the University of St. Thomas in St. Paul, Minn.
Jon KatholVice President, Investor Relations& Assistant Secretary
Tyson Foods, Inc. Investor Presentation | March 2015 | 5
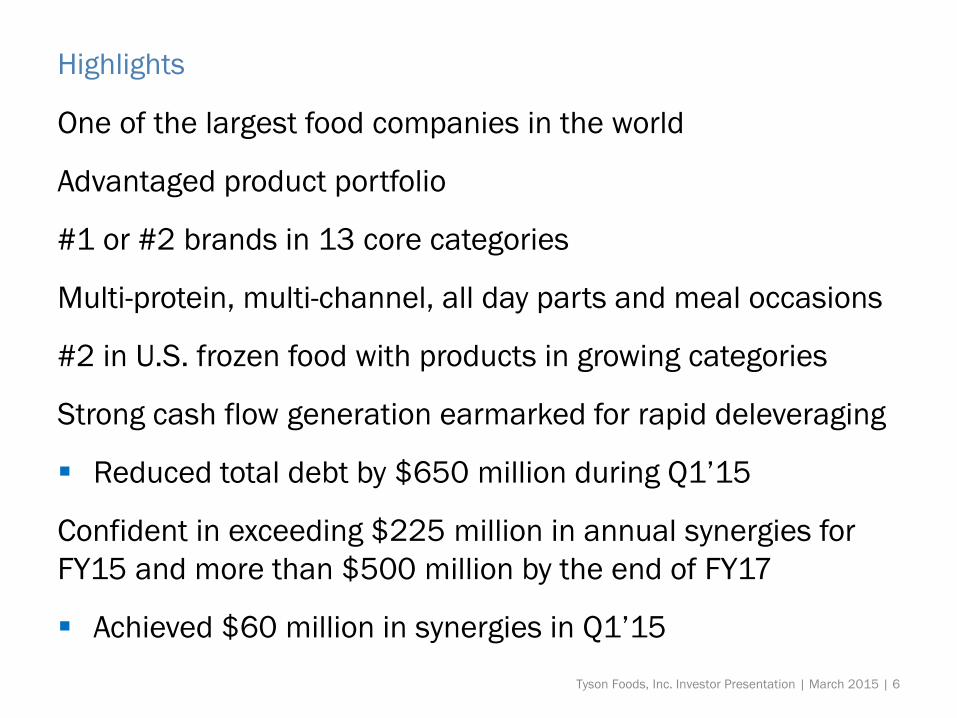
Highlights
One of the largest food companies in the world
Advantaged product portfolio
#1 or #2 brands in 13 core categories
Multi-protein, multi-channel, all day parts and meal occasions
#2 in U.S. frozen food with products in growing categories
Strong cash flow generation earmarked for rapid deleveraging
Reduced total debt by $650 million during Q1’15
Confident in exceeding $225 million in annual synergies for FY15 and more than $500 million by the end of FY17
Achieved $60 million in synergies in Q1’15Tyson Foods, Inc. Investor Presentation | March 2015 | 6
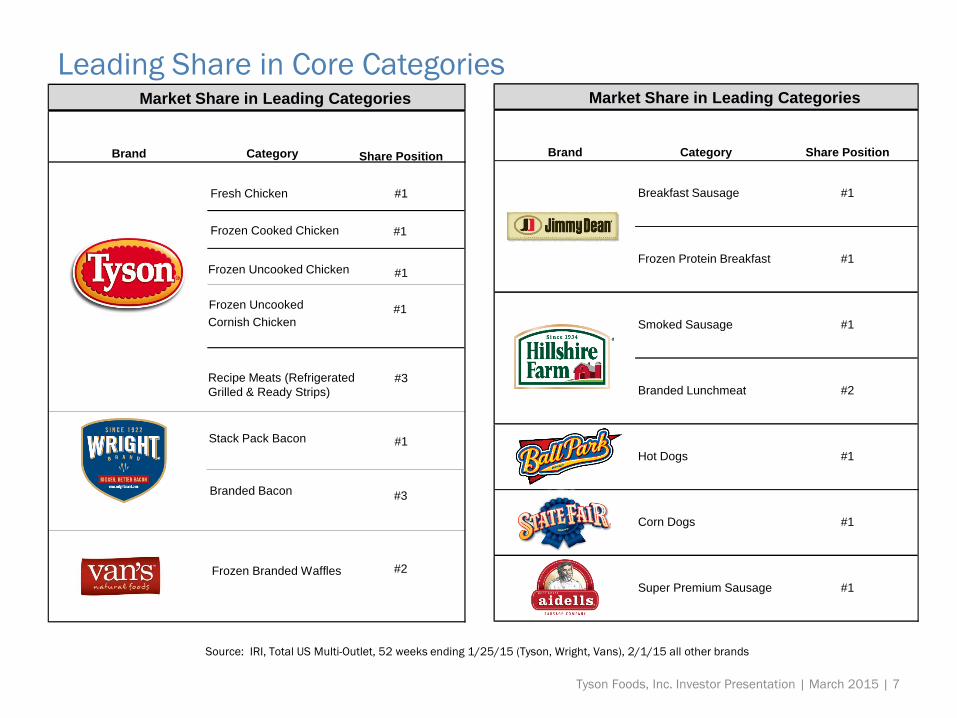
Leading Share in Core Categories
Source: IRI, Total US Multi-Outlet, 52 weeks ending 1/25/15 (Tyson, Wright, Vans), 2/1/15 all other brands
Market Share in Leading Categories
Brand Category Share Position
Fresh Chicken #1
Frozen Cooked Chicken #1
Frozen Uncooked Chicken #1
Frozen Uncooked Cornish Chicken
#1
Recipe Meats (RefrigeratedGrilled & Ready Strips)
#3
Stack Pack Bacon #1
Branded Bacon #3
Frozen Branded Waffles #2
Market Share in Leading Categories
Brand Category Share Position
Breakfast Sausage #1
Frozen Protein Breakfast #1
Smoked Sausage #1
Branded Lunchmeat #2
Hot Dogs #1
Corn Dogs #1
Super Premium Sausage #1
Tyson Foods, Inc. Investor Presentation | March 2015 | 7
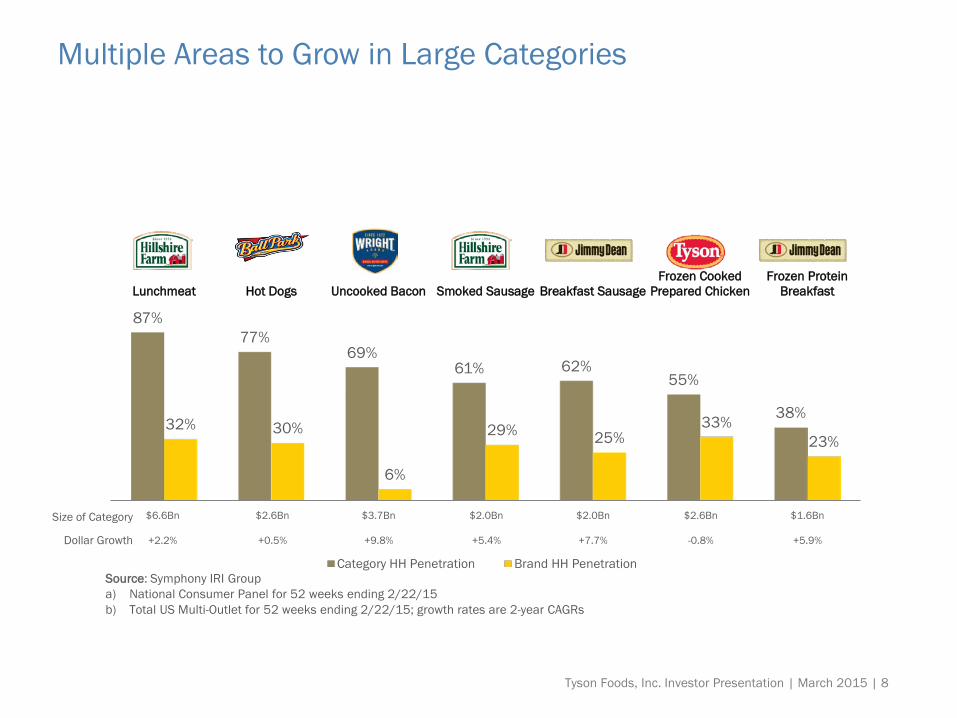
87%77%
69%61% 62%
55%
38%32% 30%
6%
29% 25%33%
23%
Lunchmeat Hot Dogs Uncooked Bacon Smoked Sausage Breakfast SausageFrozen Cooked
Prepared ChickenFrozen Protein
Breakfast
Category HH Penetration Brand HH Penetration
Multiple Areas to Grow in Large Categories
Source: Symphony IRI Group a) National Consumer Panel for 52 weeks ending 2/22/15b) Total US Multi-Outlet for 52 weeks ending 2/22/15; growth rates are 2-year CAGRs
Size of Category
Dollar Growth
$6.6Bn $2.6Bn $3.7Bn $2.0Bn $2.0Bn $2.6Bn $1.6Bn
+2.2% +0.5% +9.8% +5.4% +7.7% -0.8% +5.9%
Tyson Foods, Inc. Investor Presentation | March 2015 | 8
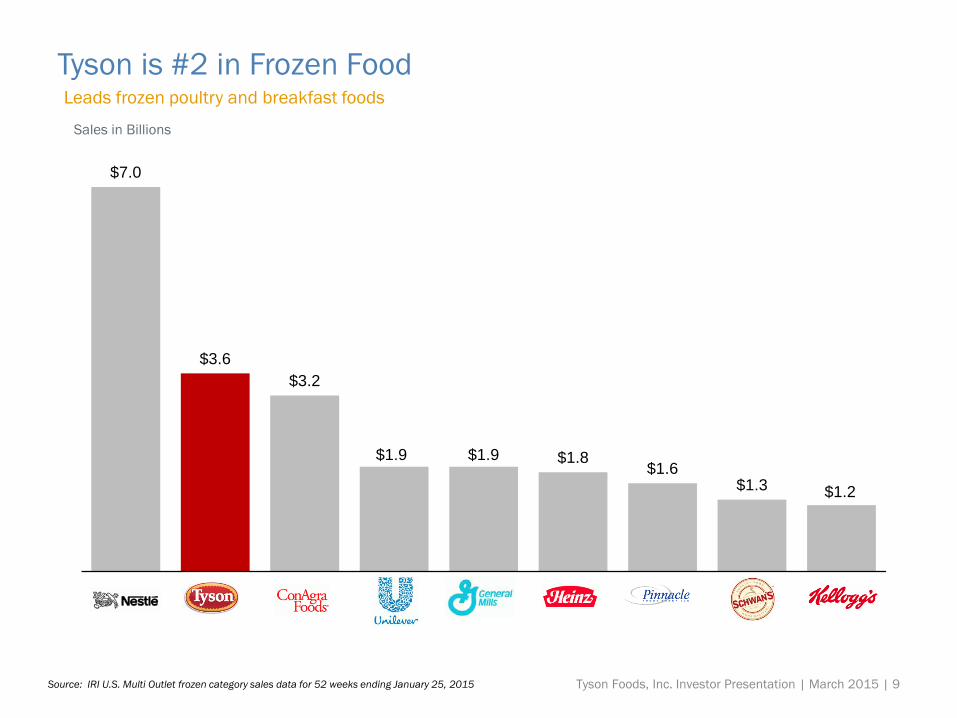
Tyson is #2 in Frozen FoodLeads frozen poultry and breakfast foods
Source: IRI U.S. Multi Outlet frozen category sales data for 52 weeks ending January 25, 2015
$7.0
$3.6$3.2
$1.9 $1.9 $1.8$1.6
$1.3 $1.2
Sales in Billions
Tyson Foods, Inc. Investor Presentation | March 2015 | 9
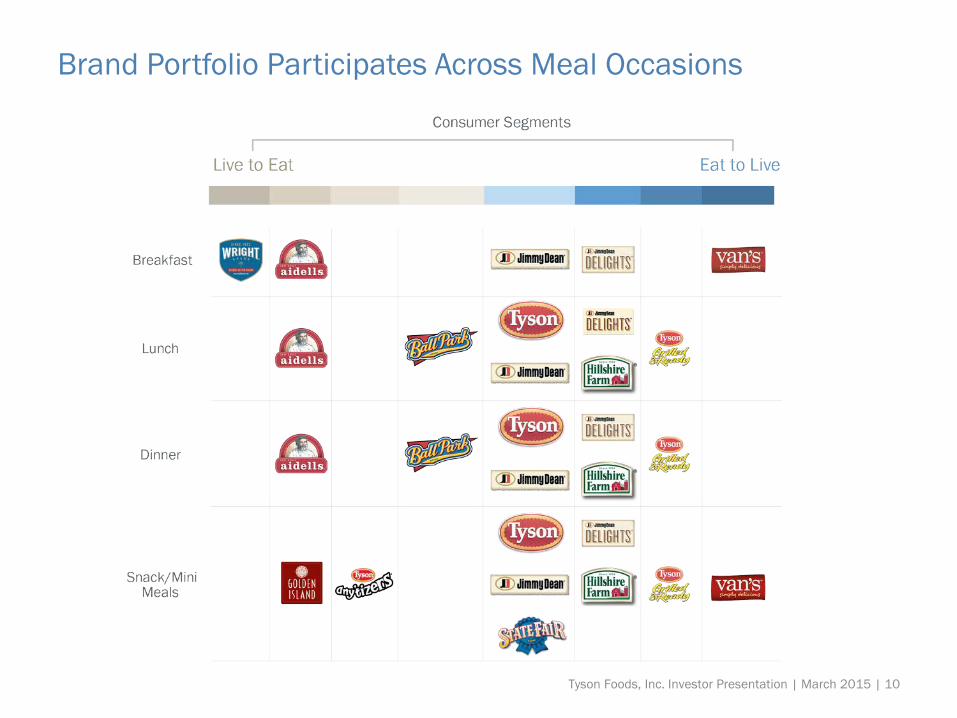
Brand Portfolio Participates Across Meal Occasions
Tyson Foods, Inc. Investor Presentation | March 2015 | 10
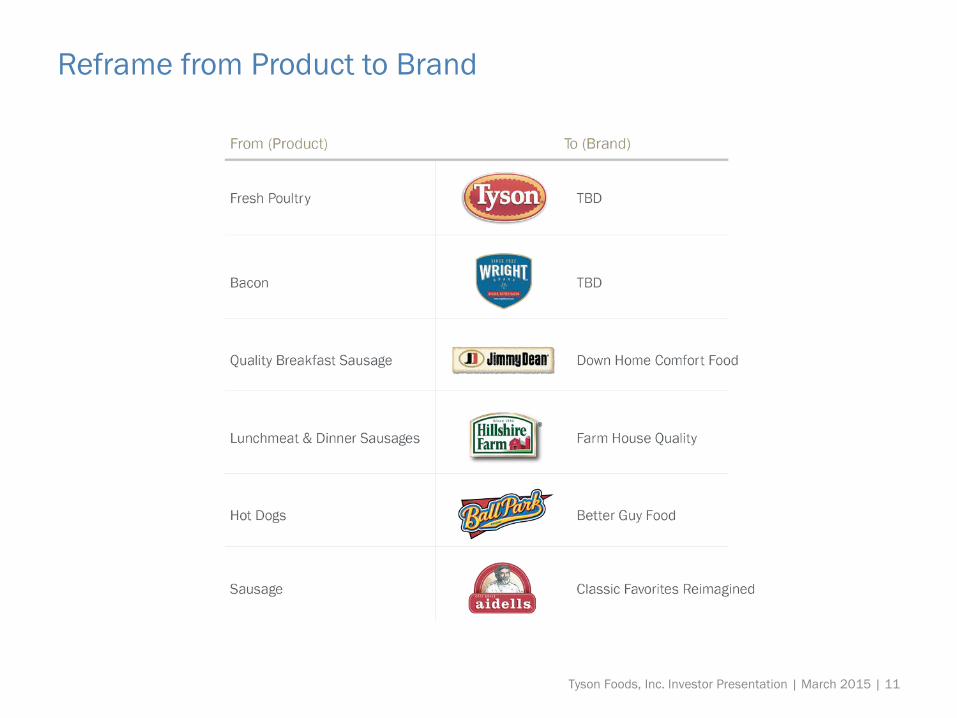
Reframe from Product to Brand
Tyson Foods, Inc. Investor Presentation | March 2015 | 11
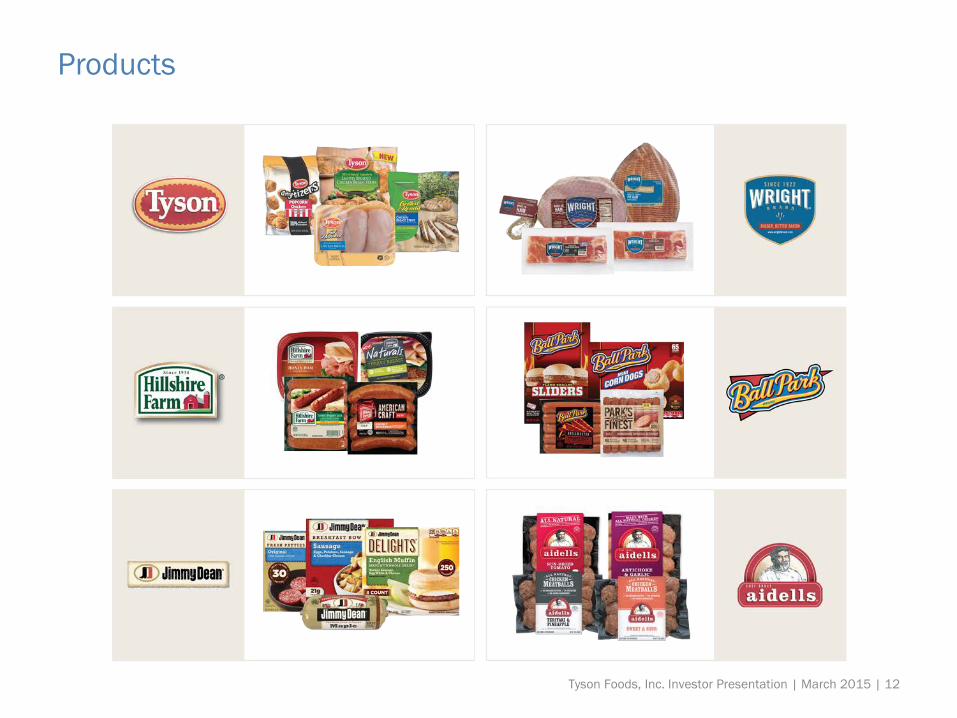
Products
Tyson Foods, Inc. Investor Presentation | March 2015 | 12
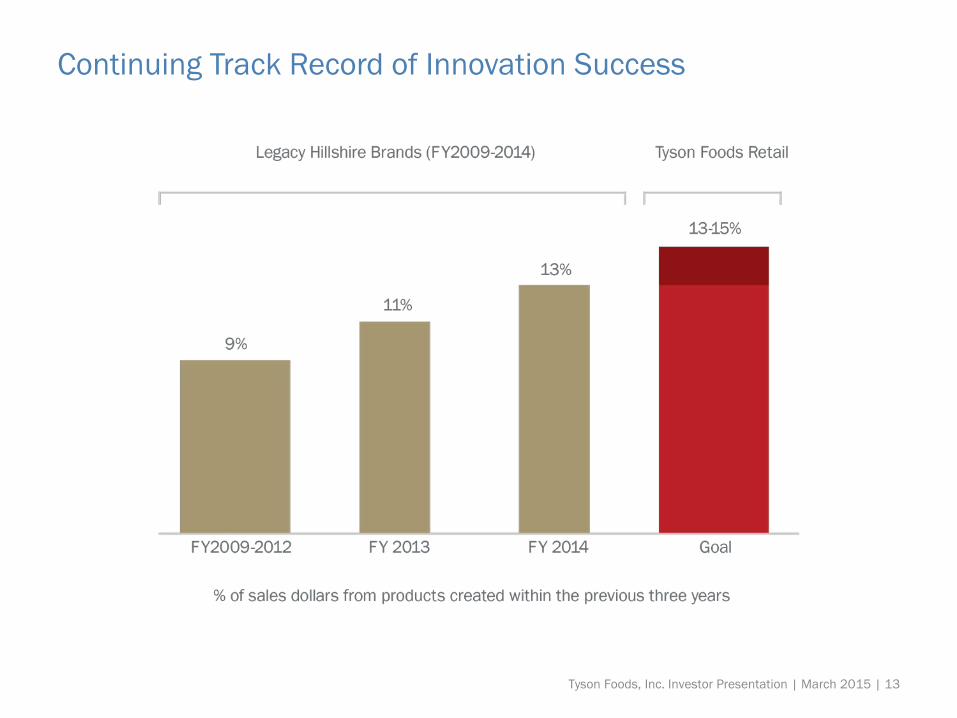
Continuing Track Record of Innovation Success
Tyson Foods, Inc. Investor Presentation | March 2015 | 13
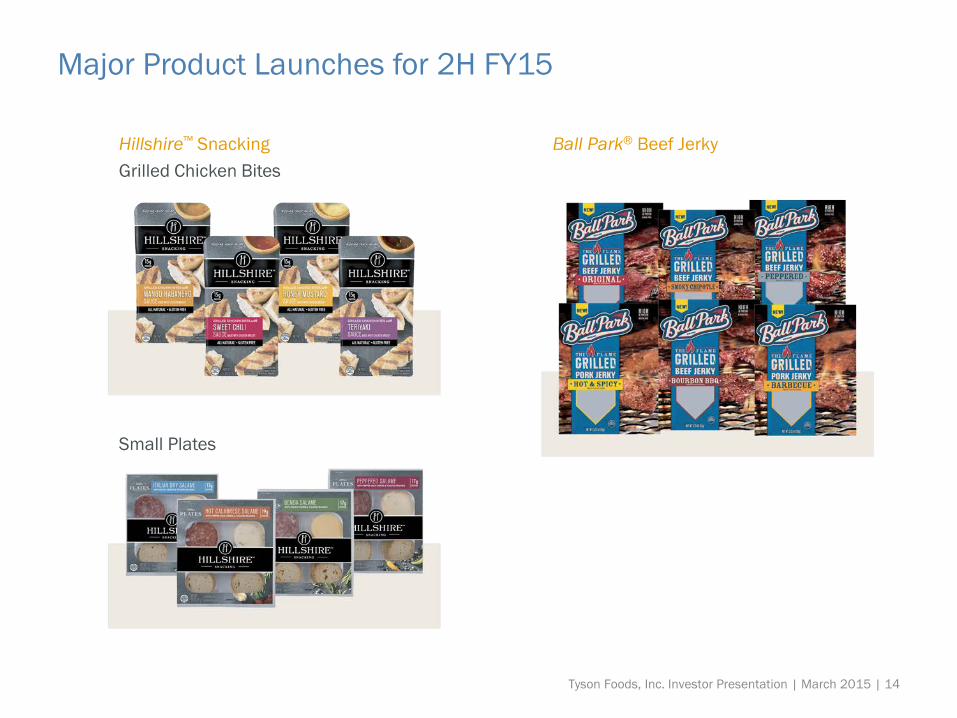
Major Product Launches for 2H FY15
Hillshire™ SnackingGrilled Chicken Bites
Small Plates
Ball Park® Beef Jerky
Tyson Foods, Inc. Investor Presentation | March 2015 | 14
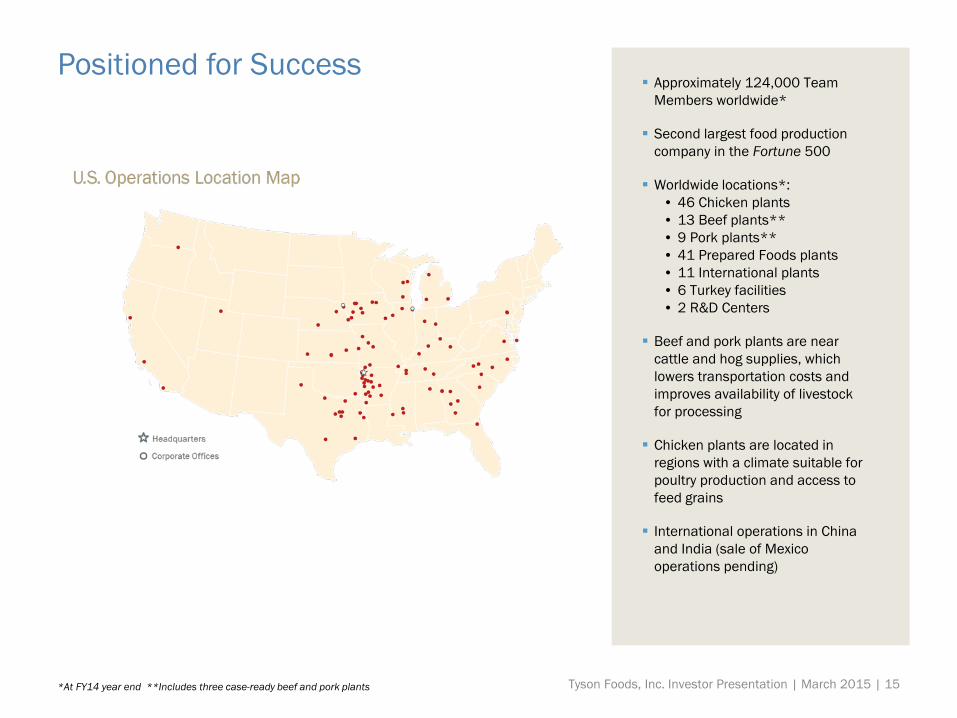
Positioned for Success Approximately 124,000 Team
Members worldwide*
Second largest food production company in the Fortune 500
Worldwide locations*: • 46 Chicken plants • 13 Beef plants** • 9 Pork plants** • 41 Prepared Foods plants • 11 International plants • 6 Turkey facilities • 2 R&D Centers
Beef and pork plants are near cattle and hog supplies, which lowers transportation costs and improves availability of livestock for processing
Chicken plants are located in regions with a climate suitable for poultry production and access to feed grains
International operations in China and India (sale of Mexico operations pending)
*At FY14 year end **Includes three case-ready beef and pork plants Tyson Foods, Inc. Investor Presentation | March 2015 | 15
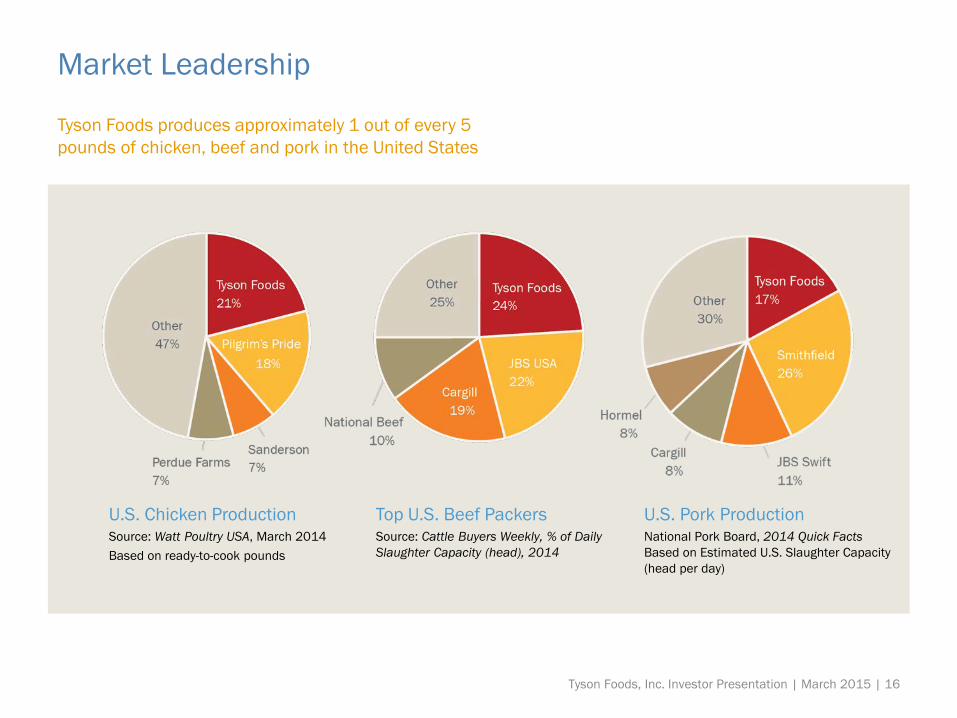
Market Leadership
Tyson Foods produces approximately 1 out of every 5 pounds of chicken, beef and pork in the United States
U.S. Chicken ProductionSource: Watt Poultry USA, March 2014Based on ready-to-cook pounds
Top U.S. Beef PackersSource: Cattle Buyers Weekly, % of Daily Slaughter Capacity (head), 2014
U.S. Pork ProductionNational Pork Board, 2014 Quick FactsBased on Estimated U.S. Slaughter Capacity (head per day)
Tyson Foods, Inc. Investor Presentation | March 2015 | 16
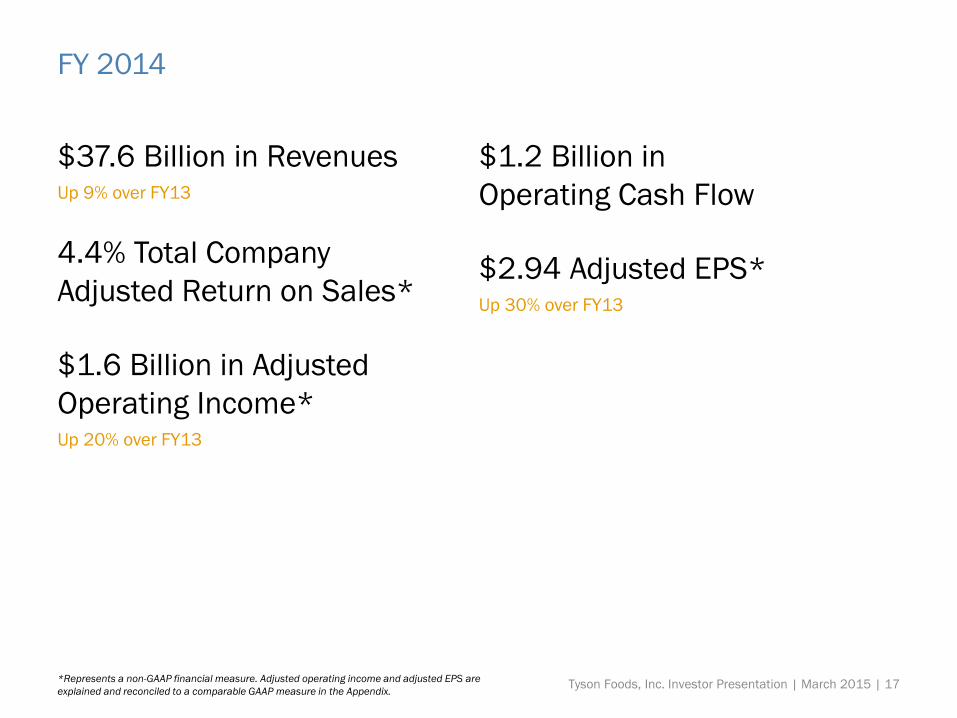
FY 2014
$37.6 Billion in RevenuesUp 9% over FY13
4.4% Total Company Adjusted Return on Sales*
$1.6 Billion in Adjusted Operating Income*Up 20% over FY13
$1.2 Billion in Operating Cash Flow
$2.94 Adjusted EPS*Up 30% over FY13
*Represents a non-GAAP financial measure. Adjusted operating income and adjusted EPS are explained and reconciled to a comparable GAAP measure in the Appendix. Tyson Foods, Inc. Investor Presentation | March 2015 | 17
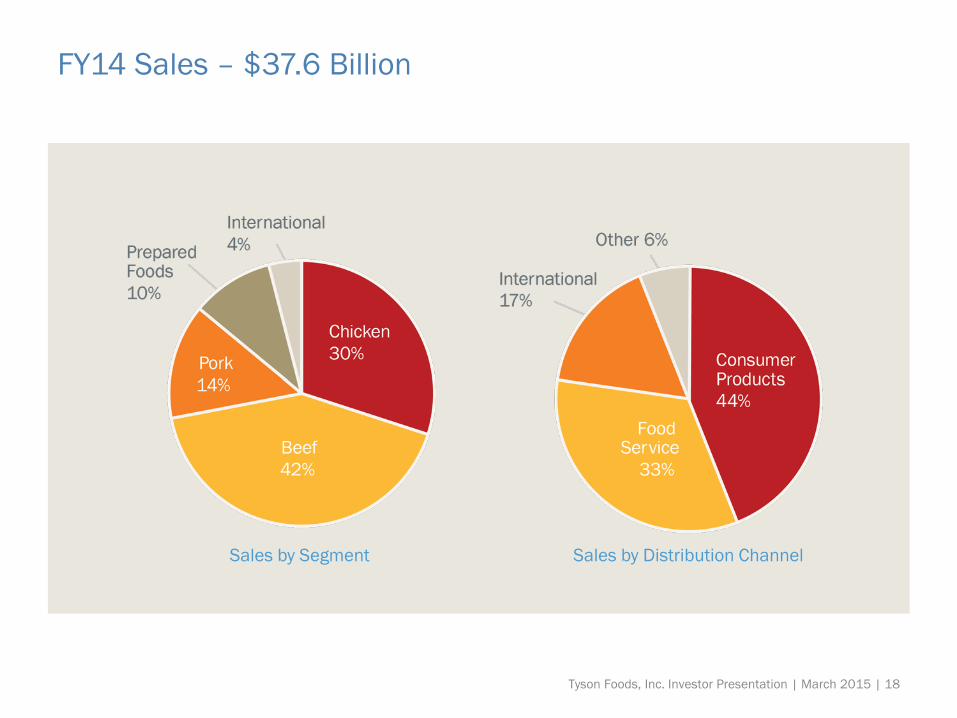
FY14 Sales – $37.6 Billion
Sales by Segment Sales by Distribution Channel
Tyson Foods, Inc. Investor Presentation | March 2015 | 18
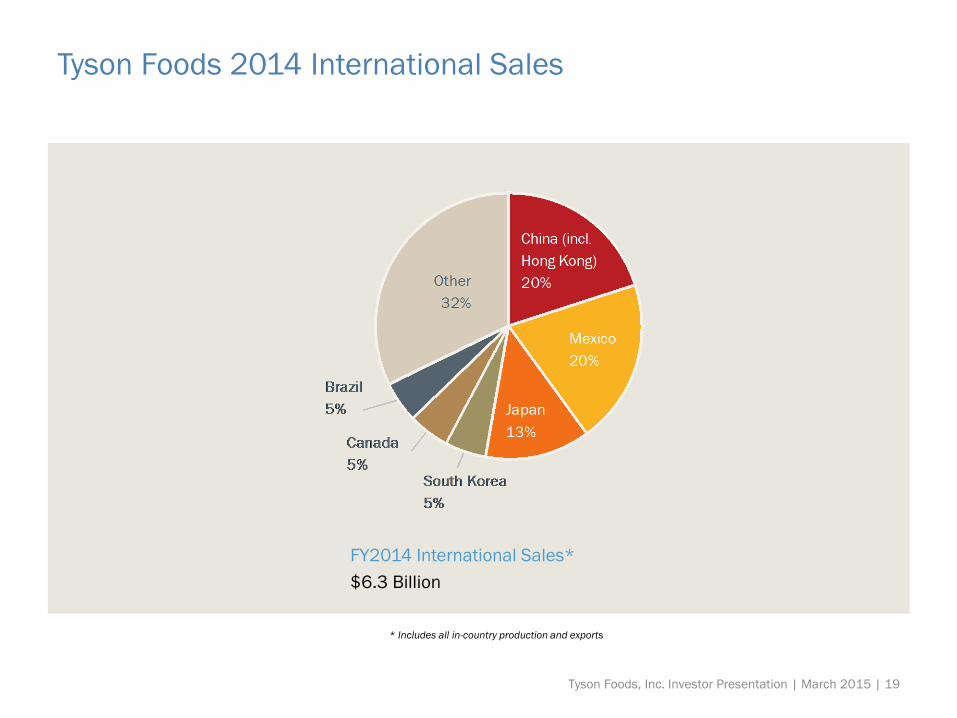
Tyson Foods 2014 International Sales
FY2014 International Sales*$6.3 Billion
* Includes all in-country production and exports
Tyson Foods, Inc. Investor Presentation | March 2015 | 19

Tyson Foods 2014 International Sales
FY2014 International Chicken Sales*$2.4 Billion
* Includes all in-country production and exports
FY2014 International Beef Sales$2.6 Billion
Tyson Foods, Inc. Investor Presentation | March 2015 | 20
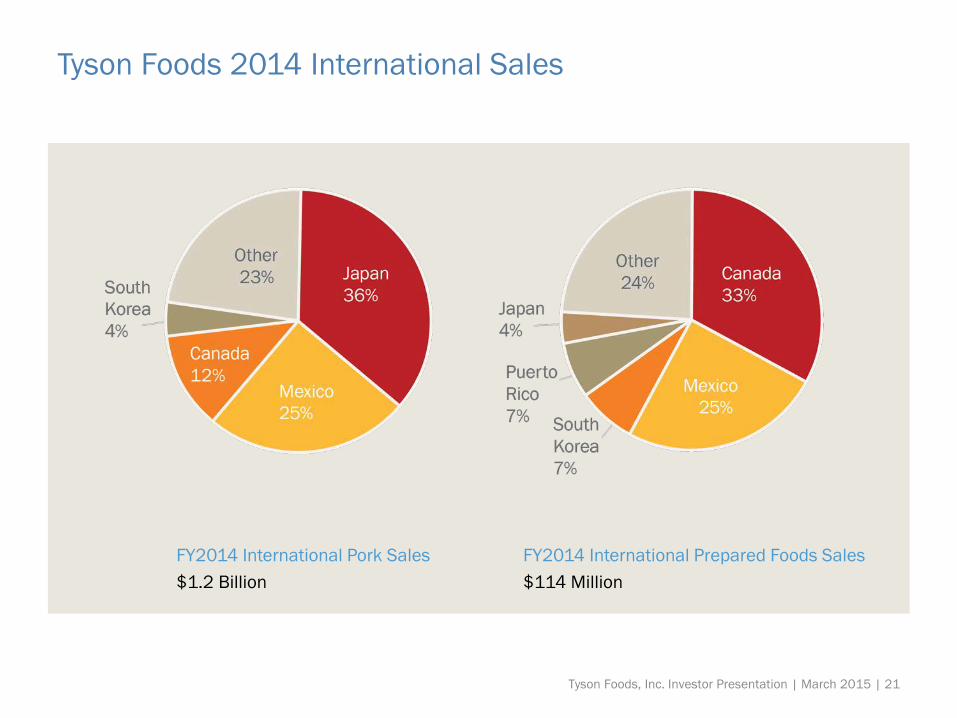
Tyson Foods 2014 International Sales
FY2014 International Pork Sales$1.2 Billion
FY2014 International Prepared Foods Sales$114 Million
Tyson Foods, Inc. Investor Presentation | March 2015 | 21
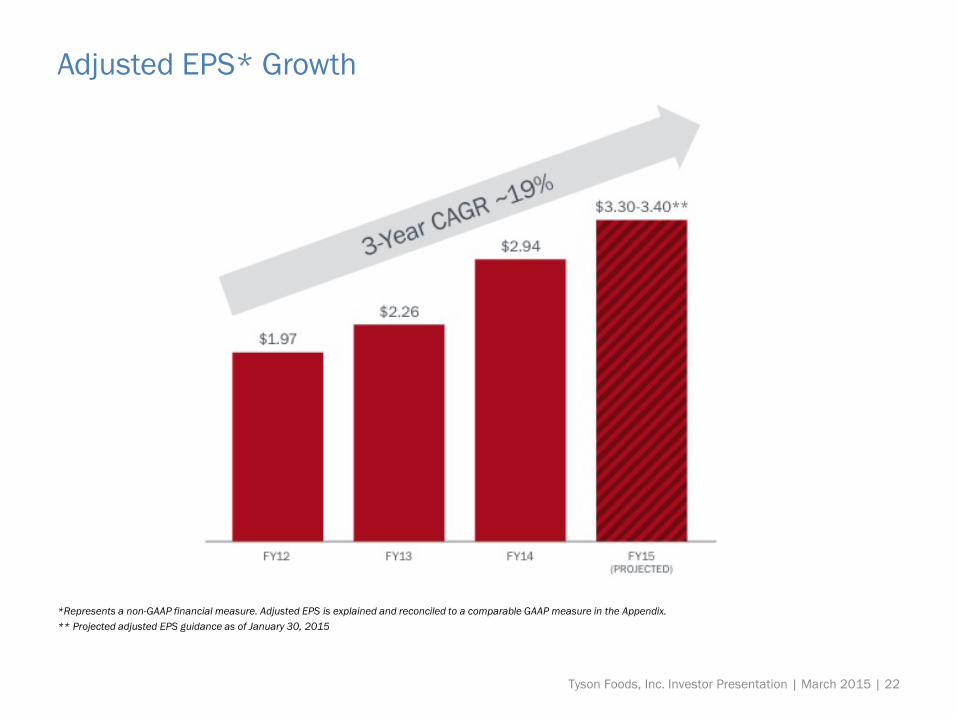
Adjusted EPS* Growth
*Represents a non-GAAP financial measure. Adjusted EPS is explained and reconciled to a comparable GAAP measure in the Appendix.** Projected adjusted EPS guidance as of January 30, 2015
Tyson Foods, Inc. Investor Presentation | March 2015 | 22
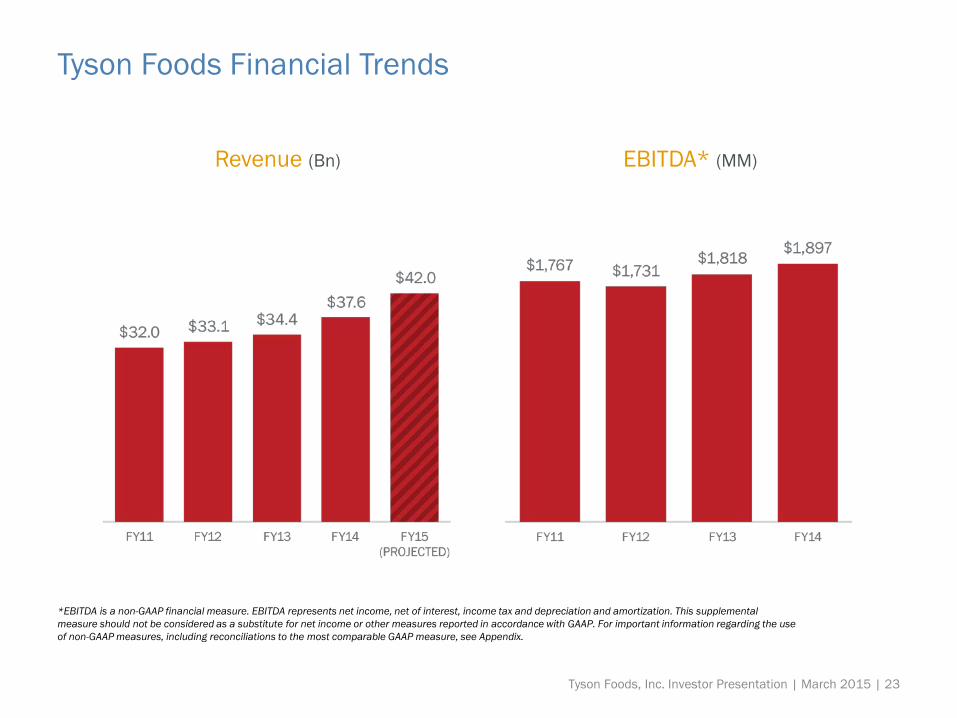
Tyson Foods Financial Trends
*EBITDA is a non-GAAP financial measure. EBITDA represents net income, net of interest, income tax and depreciation and amortization. This supplemental measure should not be considered as a substitute for net income or other measures reported in accordance with GAAP. For important information regarding the use of non-GAAP measures, including reconciliations to the most comparable GAAP measure, see Appendix.
Revenue (Bn) EBITDA* (MM)
Tyson Foods, Inc. Investor Presentation | March 2015 | 23
Net Debt/EBITDA
Previous 5 Years = ~1×
FY 2014 Adjusted Pro Forma Basis = ~3×
FY 2015 = ~2×*
*Based on adjusted pro forma estimateSee the Appendix Tyson Foods, Inc. Investor Presentation | March 2015 | 24
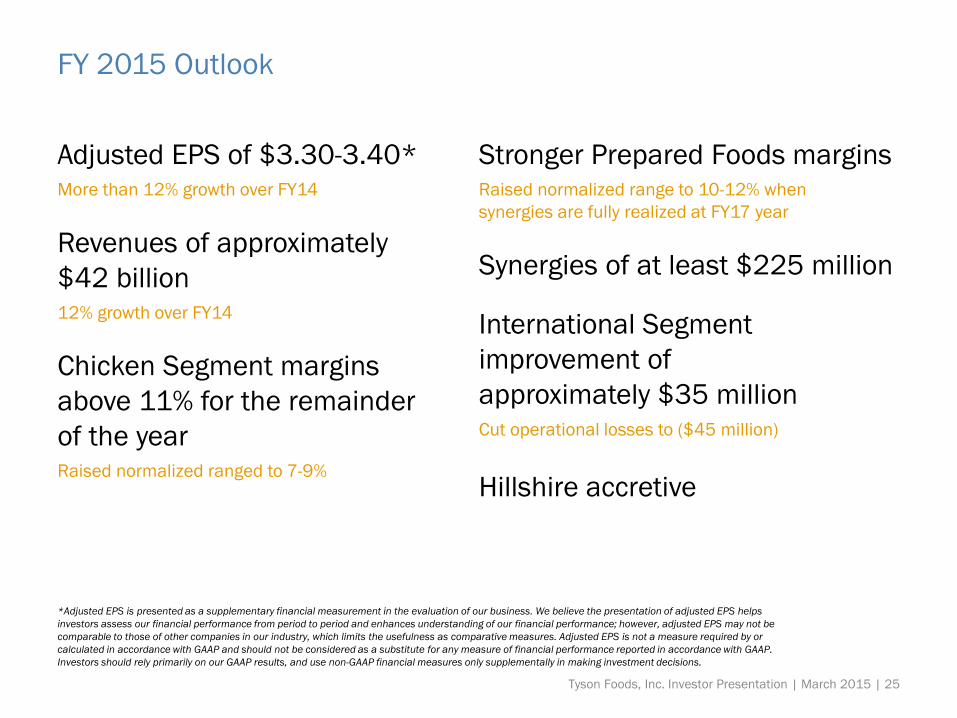
FY 2015 Outlook
Adjusted EPS of $3.30-3.40*More than 12% growth over FY14
Revenues of approximately $42 billion12% growth over FY14
Chicken Segment margins above 11% for the remainder of the yearRaised normalized ranged to 7-9%
Stronger Prepared Foods marginsRaised normalized range to 10-12% when synergies are fully realized at FY17 year
Synergies of at least $225 million
International Segment improvement of approximately $35 millionCut operational losses to ($45 million)
Hillshire accretive
*Adjusted EPS is presented as a supplementary financial measurement in the evaluation of our business. We believe the presentation of adjusted EPS helps investors assess our financial performance from period to period and enhances understanding of our financial performance; however, adjusted EPS may not be comparable to those of other companies in our industry, which limits the usefulness as comparative measures. Adjusted EPS is not a measure required by or calculated in accordance with GAAP and should not be considered as a substitute for any measure of financial performance reported in accordance with GAAP. Investors should rely primarily on our GAAP results, and use non-GAAP financial measures only supplementally in making investment decisions.
Tyson Foods, Inc. Investor Presentation | March 2015 | 25
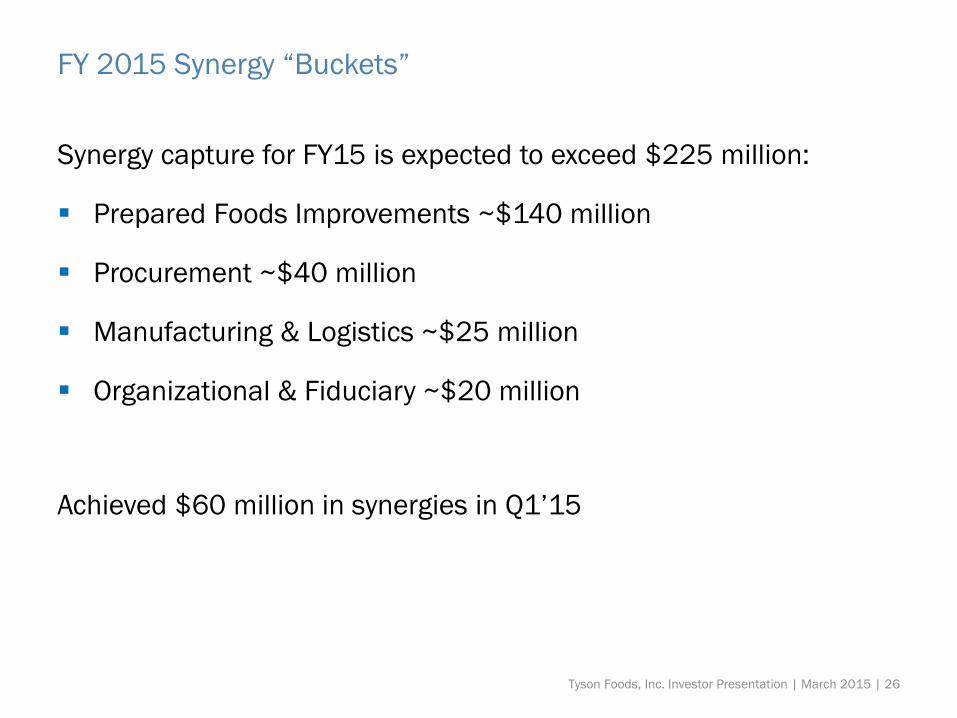
FY 2015 Synergy “Buckets”
Synergy capture for FY15 is expected to exceed $225 million:
Prepared Foods Improvements ~$140 million
Procurement ~$40 million
Manufacturing & Logistics ~$25 million
Organizational & Fiduciary ~$20 million
Achieved $60 million in synergies in Q1’15
Tyson Foods, Inc. Investor Presentation | March 2015 | 26
Priorities for Cash
Rapid de-leveraging from $1B+ cash flows and $500+ million from sale of Latin American operations
Capital allocation to drive long-term shareholder value
Acquisitions to fulfill our growth strategy
Returning cash to shareholders through share repurchasesand dividends
Tyson Foods, Inc. Investor Presentation | March 2015 | 27
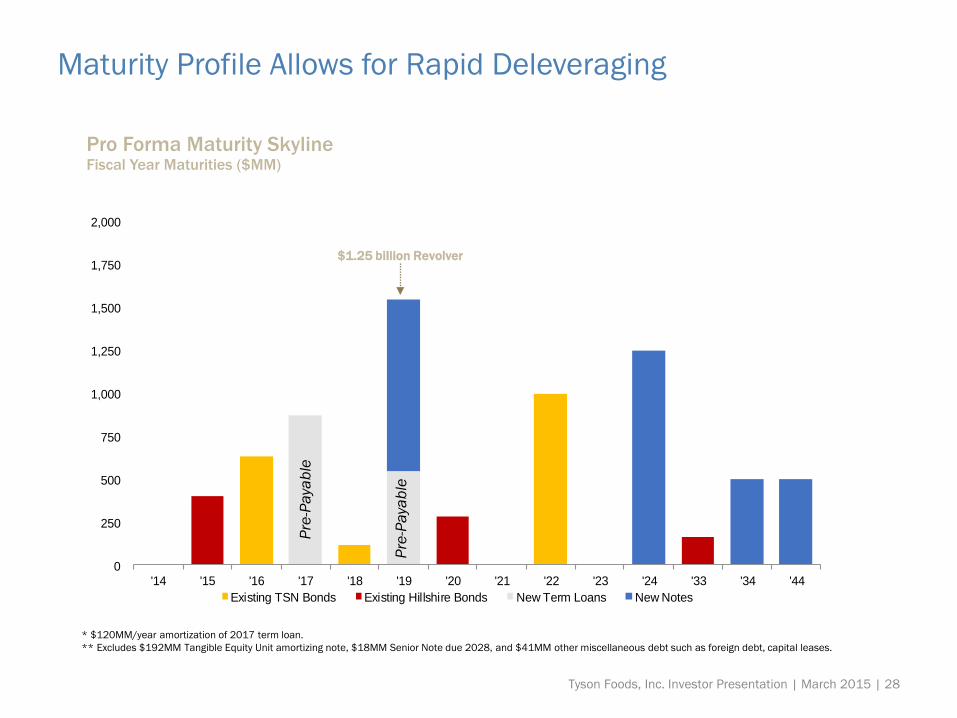
Maturity Profile Allows for Rapid Deleveraging
0
250
500
750
1,000
1,250
1,500
1,750
2,000
'14 '15 '16 '17 '18 '19 '20 '21 '22 '23 '24 '33 '34 '44Existing TSN Bonds Existing Hillshire Bonds New Term Loans New Notes
Pro Forma Maturity Skyline Fiscal Year Maturities ($MM)
* $120MM/year amortization of 2017 term loan.** Excludes $192MM Tangible Equity Unit amortizing note, $18MM Senior Note due 2028, and $41MM other miscellaneous debt such as foreign debt, capital leases.
$1.25 billion Revolver
Pre-
Paya
ble
Pre-
Paya
ble
Tyson Foods, Inc. Investor Presentation | March 2015 | 28

Why TSN?
Consistent growth
Higher, more stable earnings over time
Strong branded presence in growing categories
Advantaged branded portfolio
Innovation and insights
Synergies
Depth and breadth of portfolio to reach consumers at all day parts, all meal occasions, at home and away from home
Built for Growth
Tyson Foods, Inc. Investor Presentation | March 2015 | 29

Appendix
Tyson Foods, Inc. Investor Presentation | March 2015 | 30
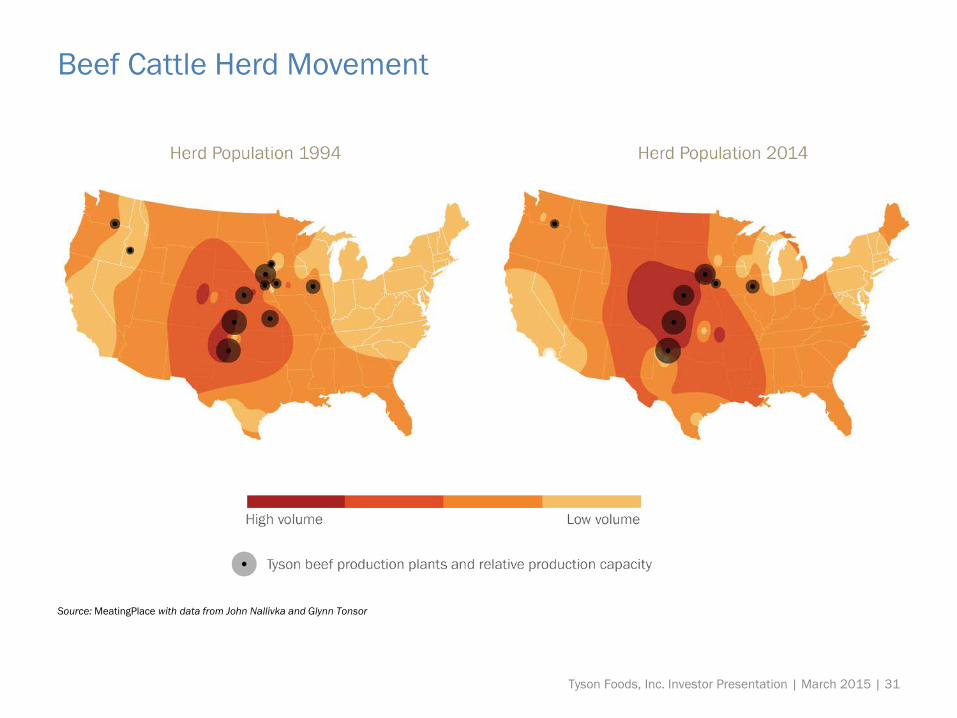
Beef Cattle Herd Movement
Source: MeatingPlace with data from John Nallivka and Glynn Tonsor
Tyson Foods, Inc. Investor Presentation | March 2015 | 31
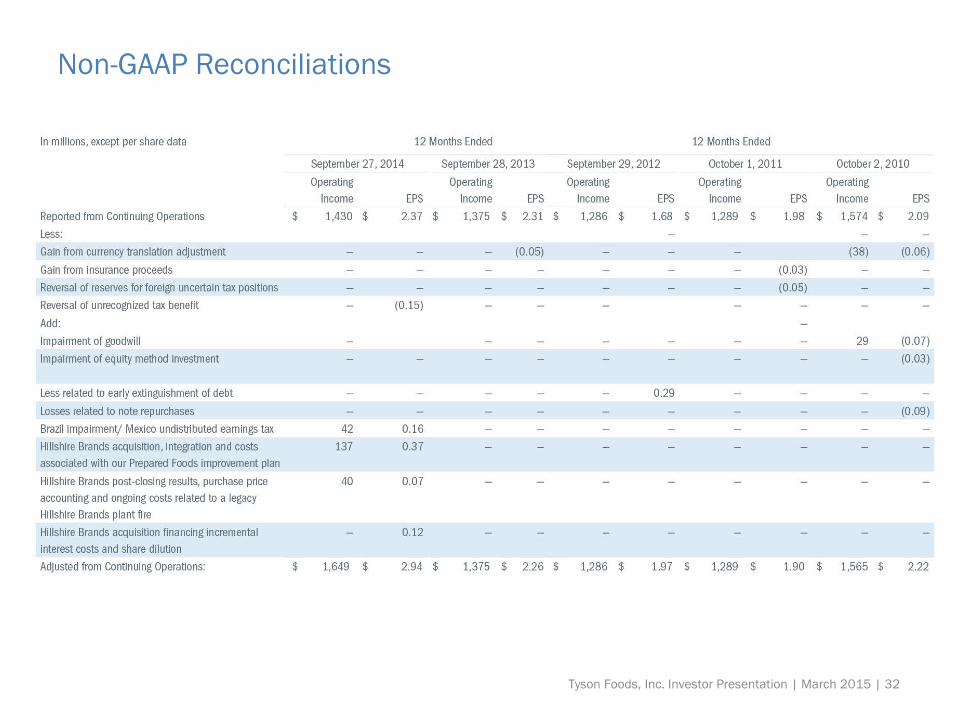
Non-GAAP Reconciliations
Tyson Foods, Inc. Investor Presentation | March 2015 | 32
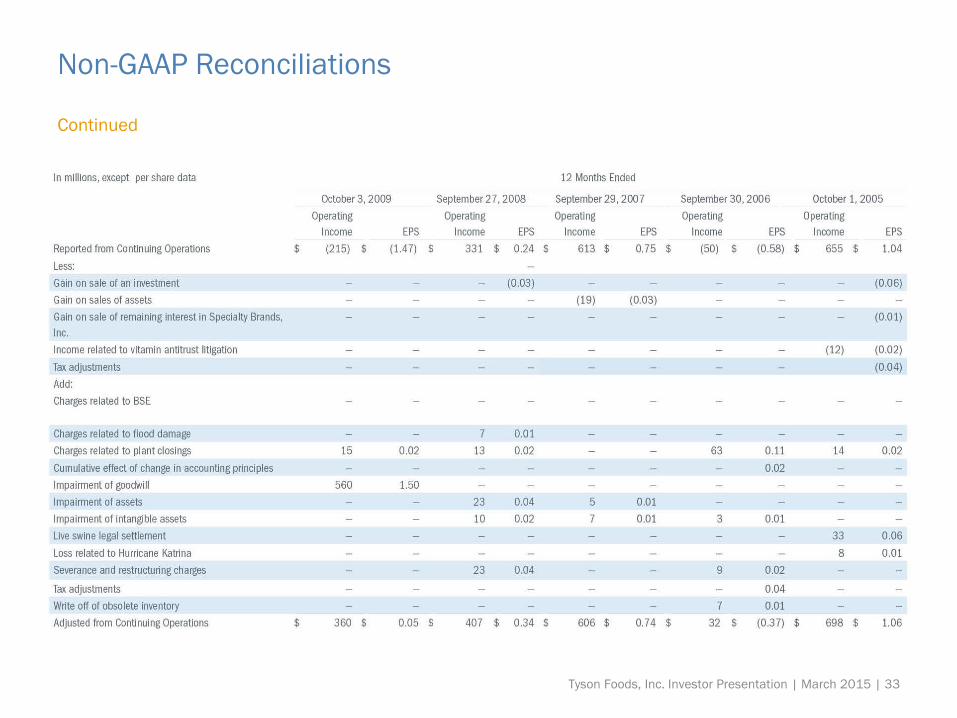
Non-GAAP Reconciliations
Continued
Tyson Foods, Inc. Investor Presentation | March 2015 | 33
Continued
Non-GAAP Reconciliations
Adjusted operating income and adjusted net income from continuing operations per share attributable to Tyson (adjusted EPS) are presented as supplementary financial measurements in the evaluation of our business. We believe the presentations of adjusted operating income and adjusted EPS help investors assess our financial performance from period to period and enhance understanding of our financial performance; however, adjusted operating income and adjusted EPS may not be comparable to those of other companies in our
industry, which limits the usefulness as comparative measures. Adjusted operating income and adjusted EPS are not measures required by or calculated in accordance with GAAP and should not be considered as substitutes for any measures of financial performance reported in accordance with GAAP. Investors should rely primarily on our GAAP results, and use non-GAAP financial measures only supplementally in making investment decisions.
Tyson Foods, Inc. Investor Presentation | March 2015 | 34
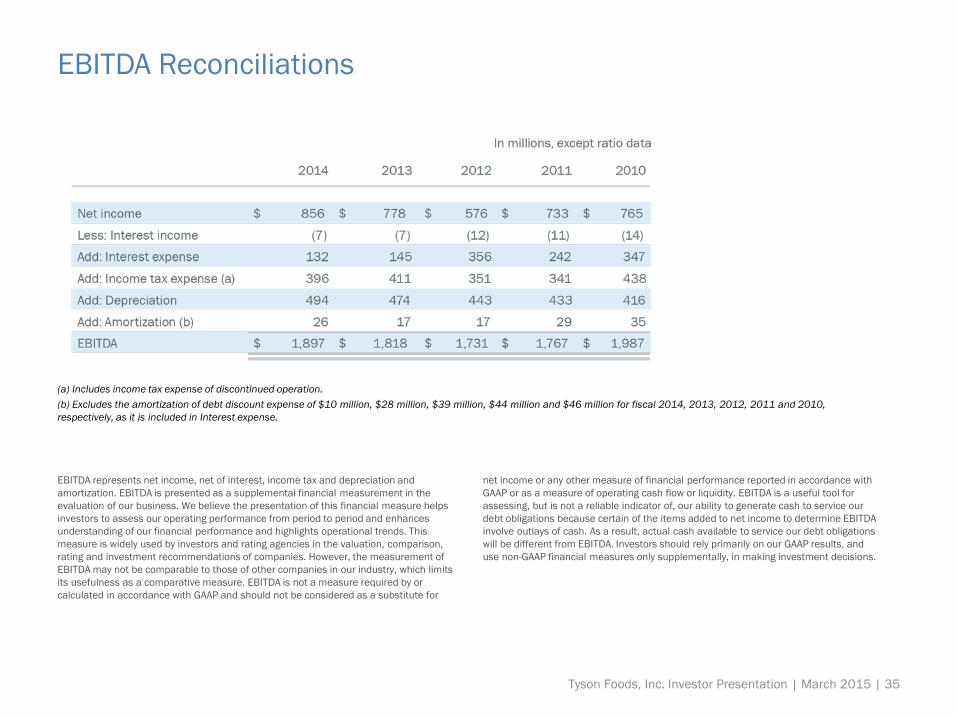
EBITDA Reconciliations
(a) Includes income tax expense of discontinued operation.(b) Excludes the amortization of debt discount expense of $10 million, $28 million, $39 million, $44 million and $46 million for fiscal 2014, 2013, 2012, 2011 and 2010, respectively, as it is included in Interest expense.
EBITDA represents net income, net of interest, income tax and depreciation and amortization. EBITDA is presented as a supplemental financial measurement in the evaluation of our business. We believe the presentation of this financial measure helps investors to assess our operating performance from period to period and enhances understanding of our financial performance and highlights operational trends. This measure is widely used by investors and rating agencies in the valuation, comparison, rating and investment recommendations of companies. However, the measurement of EBITDA may not be comparable to those of other companies in our industry, which limits its usefulness as a comparative measure. EBITDA is not a measure required by or calculated in accordance with GAAP and should not be considered as a substitute for
net income or any other measure of financial performance reported in accordance with GAAP or as a measure of operating cash flow or liquidity. EBITDA is a useful tool for assessing, but is not a reliable indicator of, our ability to generate cash to service our debt obligations because certain of the items added to net income to determine EBITDA involve outlays of cash. As a result, actual cash available to service our debt obligations will be different from EBITDA. Investors should rely primarily on our GAAP results, and use non-GAAP financial measures only supplementally, in making investment decisions.
Tyson Foods, Inc. Investor Presentation | March 2015 | 35