Diebold Investor Presentation - March 2016 - Diebold Nixdorf · Diebold Investor Presentation -...
59
1 Investor Presentation March 2016
Transcript of Diebold Investor Presentation - March 2016 - Diebold Nixdorf · Diebold Investor Presentation -...
1
Investor Presentation
March 2016
2
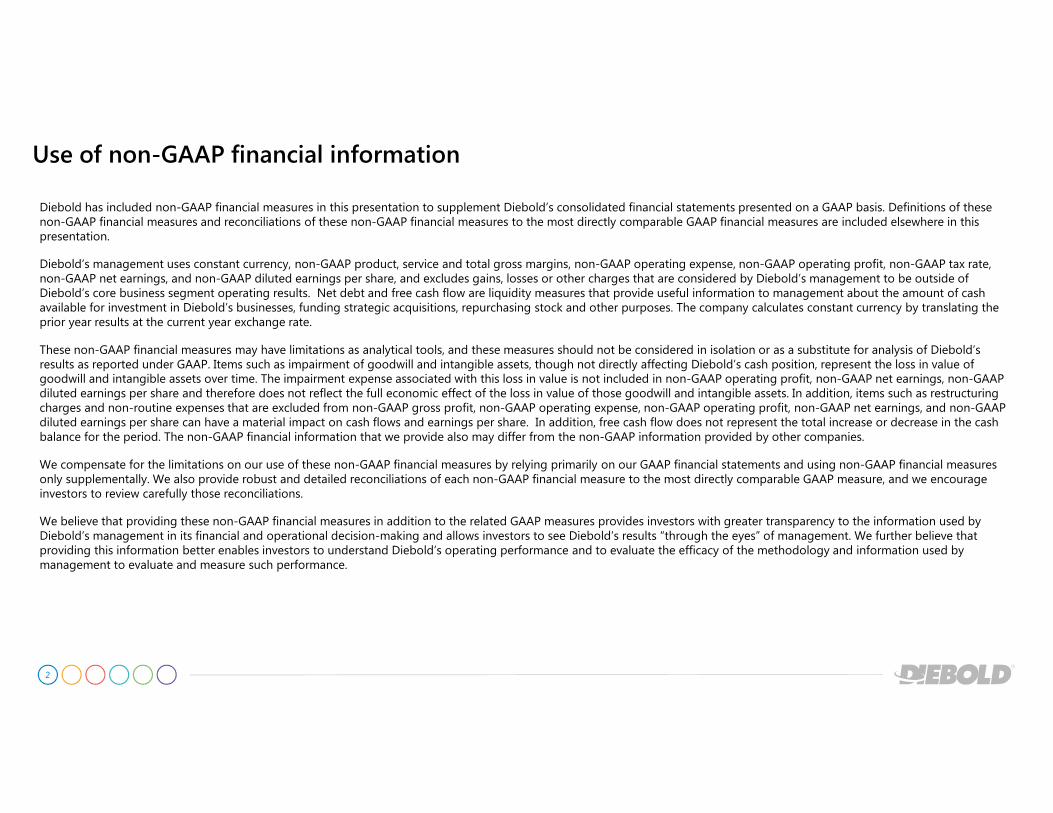
Use of non-GAAP financial information
Diebold has included non-GAAP financial measures in this presentation to supplement Diebold’s consolidated financial statements presented on a GAAP basis. Definitions of these non-GAAP financial measures and reconciliations of these non-GAAP financial measures to the most directly comparable GAAP financial measures are included elsewhere in this presentation.
Diebold’s management uses constant currency, non-GAAP product, service and total gross margins, non-GAAP operating expense, non-GAAP operating profit, non-GAAP tax rate, non-GAAP net earnings, and non-GAAP diluted earnings per share, and excludes gains, losses or other charges that are considered by Diebold’s management to be outside of Diebold’s core business segment operating results. Net debt and free cash flow are liquidity measures that provide useful information to management about the amount of cash available for investment in Diebold’s businesses, funding strategic acquisitions, repurchasing stock and other purposes. The company calculates constant currency by translating the prior year results at the current year exchange rate.
These non-GAAP financial measures may have limitations as analytical tools, and these measures should not be considered in isolation or as a substitute for analysis of Diebold’s results as reported under GAAP. Items such as impairment of goodwill and intangible assets, though not directly affecting Diebold’s cash position, represent the loss in value of goodwill and intangible assets over time. The impairment expense associated with this loss in value is not included in non-GAAP operating profit, non-GAAP net earnings, non-GAAP diluted earnings per share and therefore does not reflect the full economic effect of the loss in value of those goodwill and intangible assets. In addition, items such as restructuring charges and non-routine expenses that are excluded from non-GAAP gross profit, non-GAAP operating expense, non-GAAP operating profit, non-GAAP net earnings, and non-GAAP diluted earnings per share can have a material impact on cash flows and earnings per share. In addition, free cash flow does not represent the total increase or decrease in the cash balance for the period. The non-GAAP financial information that we provide also may differ from the non-GAAP information provided by other companies.
We compensate for the limitations on our use of these non-GAAP financial measures by relying primarily on our GAAP financial statements and using non-GAAP financial measures only supplementally. We also provide robust and detailed reconciliations of each non-GAAP financial measure to the most directly comparable GAAP measure, and we encourage investors to review carefully those reconciliations.
We believe that providing these non-GAAP financial measures in addition to the related GAAP measures provides investors with greater transparency to the information used by Diebold’s management in its financial and operational decision-making and allows investors to see Diebold’s results “through the eyes” of management. We further believe that providing this information better enables investors to understand Diebold’s operating performance and to evaluate the efficacy of the methodology and information used by management to evaluate and measure such performance.
3
Forward-looking statementsIn this presentation, statements that are not reported financial results or other historical information are “forward-looking statements”. Forward-looking statements give current expectations or forecasts of future events and are not guarantees of future performance. These forward-looking statements relate to, among other things, the company’s future operating performance, the company's share of new and existing markets, the company's short- and long-term revenue and earnings growth rates, and the company’s implementation of cost-reduction initiatives and measures to improve pricing, including the optimization of the company’s manufacturing capacity.
The use of the words “will,” “believes,” “anticipates,” “expects,” “intends” and similar expressions is intended to identify forward-looking statements that have been made and may in the future be made by or on behalf of the company. Although the company believes that these forward-looking statements are based upon reasonable assumptions regarding, among other things, the economy, its knowledge of its business, and on key performance indicators that impact the company, these forward-looking statements involve risks, uncertainties and other factors that may cause actual results to differ materially from those expressed in or implied by the forward-looking statements. The company is not obligated to update forward-looking statements, whether as a result of new information, future events or otherwise.
Readers are cautioned not to place undue reliance on these forward-looking statements, which speak only as of the date hereof. Some of the risks, uncertainties & other factors that could cause actual results to differ materially from those expressed in or implied by the forward-looking statements include, but are not limited to:• the company's ability to successfully consummate the purchase of Wincor-Nixdorf, including obtaining the necessary financing and satisfying closing conditions;• the company's ability to realize benefits from the strategic business alliance with Securitas AB;• competitive pressures, including pricing pressures and technological developments;• changes in the company's relationships with customers, suppliers, distributors and/or partners in its business ventures;• changes in political, economic or other factors such as currency exchange rates, inflation rates, recessionary or expansive trends, taxes and regulations and laws affecting the worldwide business in
each of the company's operations;• global economic conditions, including any additional deterioration and disruption in the financial markets, including the bankruptcies, restructurings or consolidations of financial institutions, which
could reduce our customer base and/or adversely affect our customers' ability to make capital expenditures, as well as adversely impact the availability and cost of credit;• acceptance of the company's product and technology introductions in the marketplace; • the company's ability to maintain effective internal controls;• changes in the company's intention to further repatriate cash and cash equivalents and short-term investments residing in international tax jurisdictions could negatively impact foreign and domestic
taxes;• unanticipated litigation, claims or assessments, as well as the outcome/impact of any current/pending litigation, claims or assessments, including but not limited to the company's Brazil tax dispute; • variations in consumer demand for financial self-service technologies, products and services; • potential security violations to the company's information technology systems;• the investment performance of our pension plan assets, which could require us to increase our pension contributions, and significant changes in healthcare costs, including those that may result from
government action;• the amount and timing of repurchases of the company's common shares, if any; and• the company's ability to achieve benefits from its cost-reduction initiatives and other strategic changes.
For a complete listing of risks and other factors, please reference the risk factors and forward-looking statements described in the annual report on form 10-K for December 31, 2015.
4
Important information for investors and shareholders
In connection with the proposed business combination transaction with Wincor Nixdorf, Diebold has filed a Registration Statement on Form S-4 with the SEC that includes a prospectus of Diebold to be used in connection with the offer by Diebold to acquire all outstanding Wincor Nixdorf shares.
INVESTORS AND SHAREHOLDERS ARE URGED TO READ THE PROSPECTUS AND THE OFFER DOCUMENT, AS WELL AS OTHER DOCUMENTS THAT HAVE BEEN OR WILL BE FILED WITH THE SEC OR BAFIN OR PUBLISHED AT DIEBOLD’S WEBSITE AT WWW.DIEBOLD.COM UNDER THE INVESTOR RELATIONS SECTION, REGARDING THE PROPOSED BUSINESS COMBINATION TRANSACTION AND THE OFFER BECAUSE THESE DOCUMENTS CONTAIN OR WILL CONTAIN IMPORTANT INFORMATION. You may obtain a free copy of the prospectus, an English translation of the offer document, and other related documents filed by Diebold with the SEC on the SEC’s website at www.sec.gov. The prospectus, an English translation of the offer document and other documents relating thereto may also be obtained for free by accessing Diebold’s website at www.diebold.com under the Investor Relations section. You may obtain a free copy of the offer document on BaFin’s website at www.bafin.de. Further you may obtain a copy of the offer document free of charge from Deutsche Bank Aktiengesellschaft, by writing to Deutsche Bank Aktiengesellschaft, Taunusanlage 12, 60325 Frankfurt am Main, Germany, by e-mail to [email protected] or by telefax to +49 69 910 38794. European shareholders may contact Georgeson, Inc. with any questions regarding the takeover offer at 00 800 3816 3816 while banks and brokers should call +44 (0) 207 019 7003.
This presentation is neither an offer to purchase nor a solicitation of an offer to sell shares of Wincor Nixdorf or Diebold. Final terms and further provisions regarding the public offer are disclosed in the offer document and in documents filed or that will be filed with the SEC. Investors and holders of Wincor Nixdorf shares, or of such instruments conferring a right to directly or indirectly acquire Wincor Nixdorf shares, are strongly encouraged to read the offer document and all documents in connection with the public offer as soon as they are published because these documents contain or will contain important information.
No offering of securities will be made except by means of a prospectus meeting the requirements of Section 10 of the U.S. Securities Act of 1933, as amended, and applicable European regulations, including the German Securities Acquisition and Takeover Act (Wertpapiererwerbs- und Übernahmegesetz) and the German Securities Prospectus Act (Wertpapierprospektgesetz). Subject to certain exceptions to be approved by the relevant regulators or certain facts to be ascertained, the public offer would not be made directly or indirectly, in or into any jurisdiction where to do so would constitute a violation of the laws of such jurisdiction, or by use of the mails or by any means or instrumentality (including without limitation, facsimile transmission, telephone and the internet) of interstate or foreign commerce, or any facility of a national securities exchange, of any such jurisdiction.
This presentation may outline certain German withholding tax consequences related to the participation in the offer that may be or may become relevant to holders of shares of Wincor Nixdorf. Any discussion of German tax considerations is of a general nature only and does not constitute a comprehensive or definitive explanation of all possible aspects of German taxation that may be relevant for shareholders of Wincor Nixdorf. Furthermore, this presentation does not address non-German tax considerations that may apply to a shareholder that is a tax resident of a jurisdiction other than Germany. In particular, this presentation does not discuss any tax consequences arising out or in connection with potentially applicable double-taxation treatises that may be or may become relevant to holders of shares of Wincor Nixdorf. To the extent that this presentation refers to German tax law, this presentation is based upon domestic German tax laws in effect as of the date hereof. It is important to note that the legal situation may change, possibly with retroactive effect, and that no assurance can be given regarding the tax treatment of the takeover offer by fiscal authorities and the courts.
5
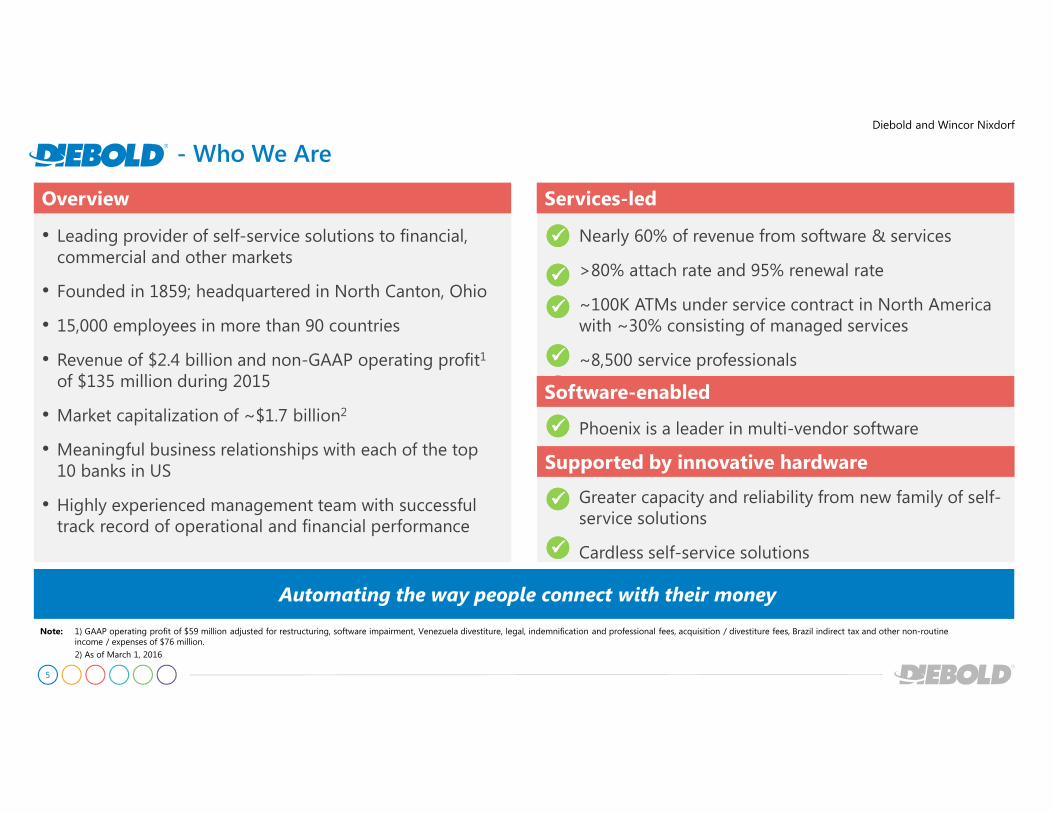
- Who We Are
• Leading provider of self-service solutions to financial, commercial and other markets
• Founded in 1859; headquartered in North Canton, Ohio
• 15,000 employees in more than 90 countries
• Revenue of $2.4 billion and non-GAAP operating profit1
of $135 million during 2015
• Market capitalization of ~$1.7 billion2
• Meaningful business relationships with each of the top 10 banks in US
• Highly experienced management team with successful track record of operational and financial performance
Overview
Automating the way people connect with their money
Services-led
Nearly 60% of revenue from software & services
>80% attach rate and 95% renewal rate
~100K ATMs under service contract in North America with ~30% consisting of managed services
~8,500 service professionals
Phoenix is a leader in multi-vendor software
Greater capacity and reliability from new family of self-service solutions
Cardless self-service solutions
��������
��������
��������
��������
��������
��������
Note: 1) GAAP operating profit of $59 million adjusted for restructuring, software impairment, Venezuela divestiture, legal, indemnification and professional fees, acquisition / divestiture fees, Brazil indirect tax and other non-routine income / expenses of $76 million.
2) As of March 1, 2016
Software-enabled
Supported by innovative hardware
��������
��������
Diebold and Wincor Nixdorf
6
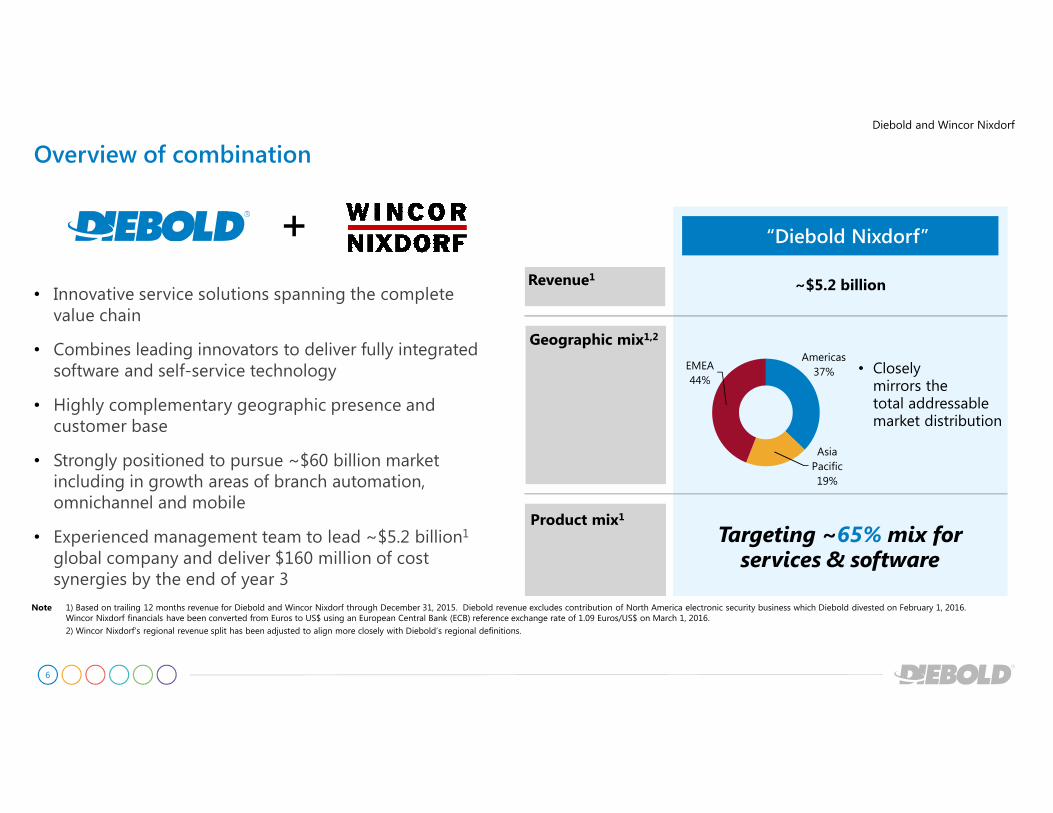
Overview of combination
• Innovative service solutions spanning the complete value chain
• Combines leading innovators to deliver fully integrated software and self-service technology
• Highly complementary geographic presence and customer base
• Strongly positioned to pursue ~$60 billion market including in growth areas of branch automation, omnichannel and mobile
• Experienced management team to lead ~$5.2 billion1
global company and deliver $160 million of cost synergies by the end of year 3
+Revenue1
Geographic mix1,2
Americas37%
Asia Pacific19%
EMEA44%
~$5.2 billion
“Diebold Nixdorf”
Targeting ~65% mix for services & software
• Closely mirrors thetotal addressable market distribution
Product mix1
Note 1) Based on trailing 12 months revenue for Diebold and Wincor Nixdorf through December 31, 2015. Diebold revenue excludes contribution of North America electronic security business which Diebold divested on February 1, 2016. Wincor Nixdorf financials have been converted from Euros to US$ using an European Central Bank (ECB) reference exchange rate of 1.09 Euros/US$ on March 1, 2016.
2) Wincor Nixdorf’s regional revenue split has been adjusted to align more closely with Diebold’s regional definitions.
Diebold and Wincor Nixdorf
7
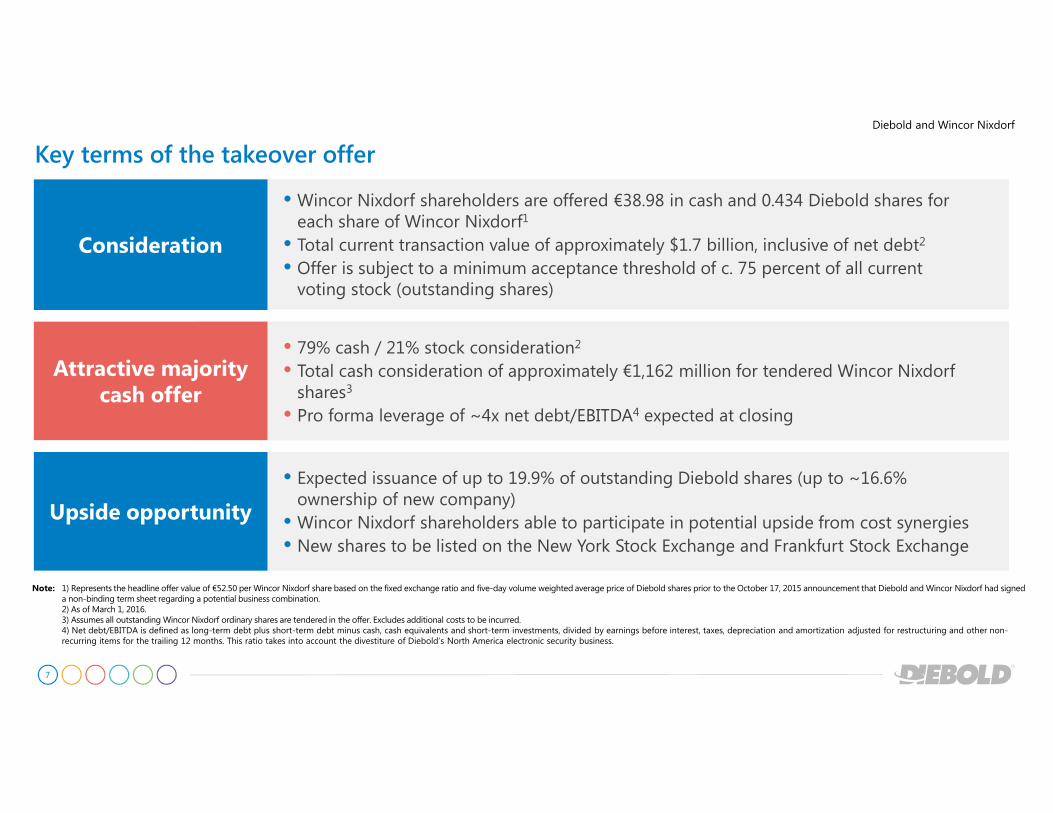
Key terms of the takeover offer
Note: 1) Represents the headline offer value of €52.50 per Wincor Nixdorf share based on the fixed exchange ratio and five-day volume weighted average price of Diebold shares prior to the October 17, 2015 announcement that Diebold and Wincor Nixdorf had signed a non-binding term sheet regarding a potential business combination.2) As of March 1, 2016. 3) Assumes all outstanding Wincor Nixdorf ordinary shares are tendered in the offer. Excludes additional costs to be incurred. 4) Net debt/EBITDA is defined as long-term debt plus short-term debt minus cash, cash equivalents and short-term investments, divided by earnings before interest, taxes, depreciation and amortization adjusted for restructuring and other non-recurring items for the trailing 12 months. This ratio takes into account the divestiture of Diebold’s North America electronic security business.
Consideration
� Wincor Nixdorf shareholders are offered €38.98 in cash and 0.434 Diebold shares for each share of Wincor Nixdorf1
� Total current transaction value of approximately $1.7 billion, inclusive of net debt2
� Offer is subject to a minimum acceptance threshold of c. 75 percent of all current voting stock (outstanding shares)
Attractive majority cash offer
� 79% cash / 21% stock consideration2
� Total cash consideration of approximately €1,162 million for tendered Wincor Nixdorf shares3
� Pro forma leverage of ~4x net debt/EBITDA4 expected at closing
Upside opportunity
� Expected issuance of up to 19.9% of outstanding Diebold shares (up to ~16.6% ownership of new company)
� Wincor Nixdorf shareholders able to participate in potential upside from cost synergies� New shares to be listed on the New York Stock Exchange and Frankfurt Stock Exchange
Diebold and Wincor Nixdorf
8
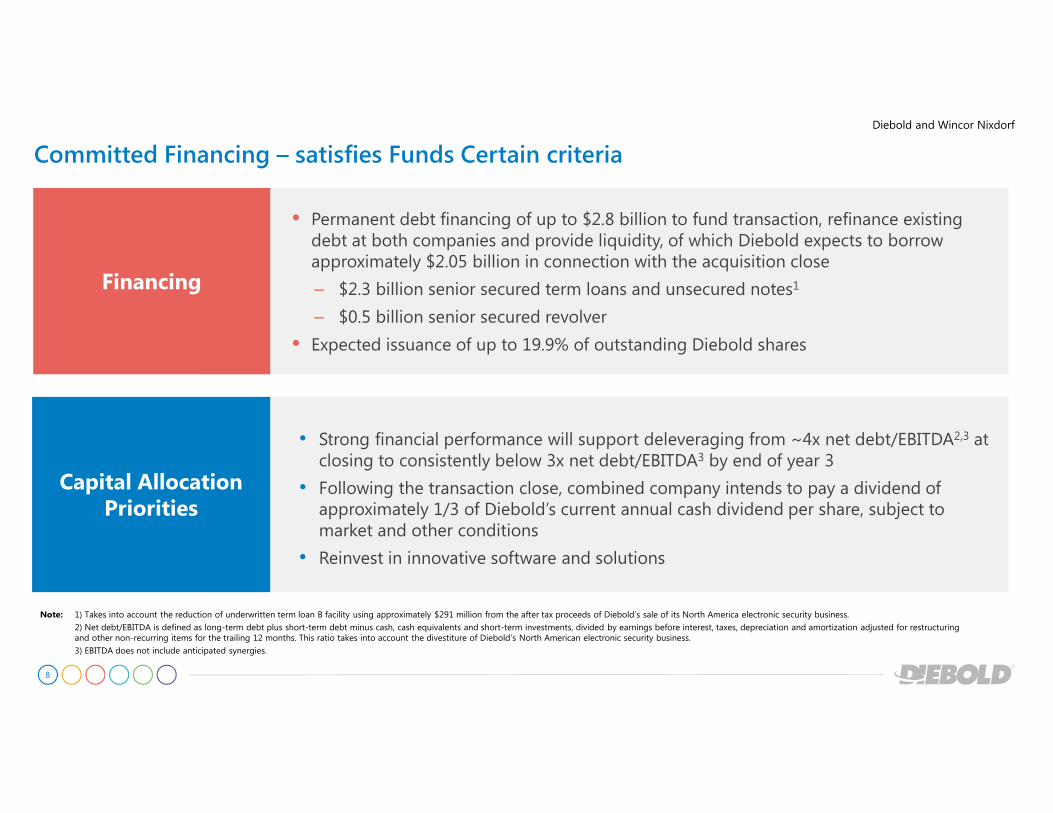
Committed Financing – satisfies Funds Certain criteria
Capital Allocation Priorities
• Strong financial performance will support deleveraging from ~4x net debt/EBITDA2,3 at closing to consistently below 3x net debt/EBITDA3 by end of year 3
• Following the transaction close, combined company intends to pay a dividend of approximately 1/3 of Diebold’s current annual cash dividend per share, subject to market and other conditions
• Reinvest in innovative software and solutions
Note: 1) Takes into account the reduction of underwritten term loan B facility using approximately $291 million from the after tax proceeds of Diebold’s sale of its North America electronic security business.
2) Net debt/EBITDA is defined as long-term debt plus short-term debt minus cash, cash equivalents and short-term investments, divided by earnings before interest, taxes, depreciation and amortization adjusted for restructuring and other non-recurring items for the trailing 12 months. This ratio takes into account the divestiture of Diebold’s North American electronic security business.
3) EBITDA does not include anticipated synergies.
Financing
� Permanent debt financing of up to $2.8 billion to fund transaction, refinance existing debt at both companies and provide liquidity, of which Diebold expects to borrow approximately $2.05 billion in connection with the acquisition close
– $2.3 billion senior secured term loans and unsecured notes1
– $0.5 billion senior secured revolver
� Expected issuance of up to 19.9% of outstanding Diebold shares
Diebold and Wincor Nixdorf
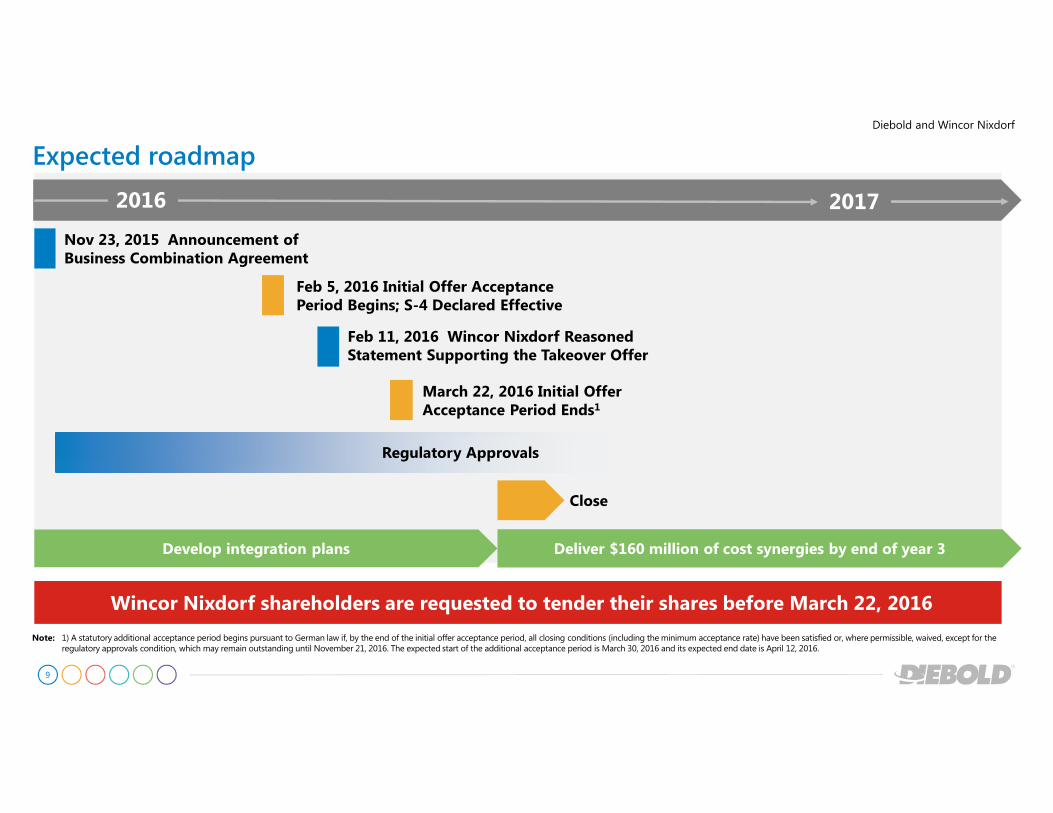
9
Develop integration plans
Expected roadmap
2017
Nov 23, 2015 Announcement of Business Combination Agreement
Feb 5, 2016 Initial Offer Acceptance Period Begins; S-4 Declared Effective
Close
Feb 11, 2016 Wincor Nixdorf Reasoned Statement Supporting the Takeover Offer
Note: 1) A statutory additional acceptance period begins pursuant to German law if, by the end of the initial offer acceptance period, all closing conditions (including the minimum acceptance rate) have been satisfied or, where permissible, waived, except for the regulatory approvals condition, which may remain outstanding until November 21, 2016. The expected start of the additional acceptance period is March 30, 2016 and its expected end date is April 12, 2016.
Wincor Nixdorf shareholders are requested to tender their shares before March 22, 2016
Deliver $160 million of cost synergies by end of year 3
March 22, 2016 Initial Offer Acceptance Period Ends1
Regulatory Approvals
2016
Diebold and Wincor Nixdorf
10
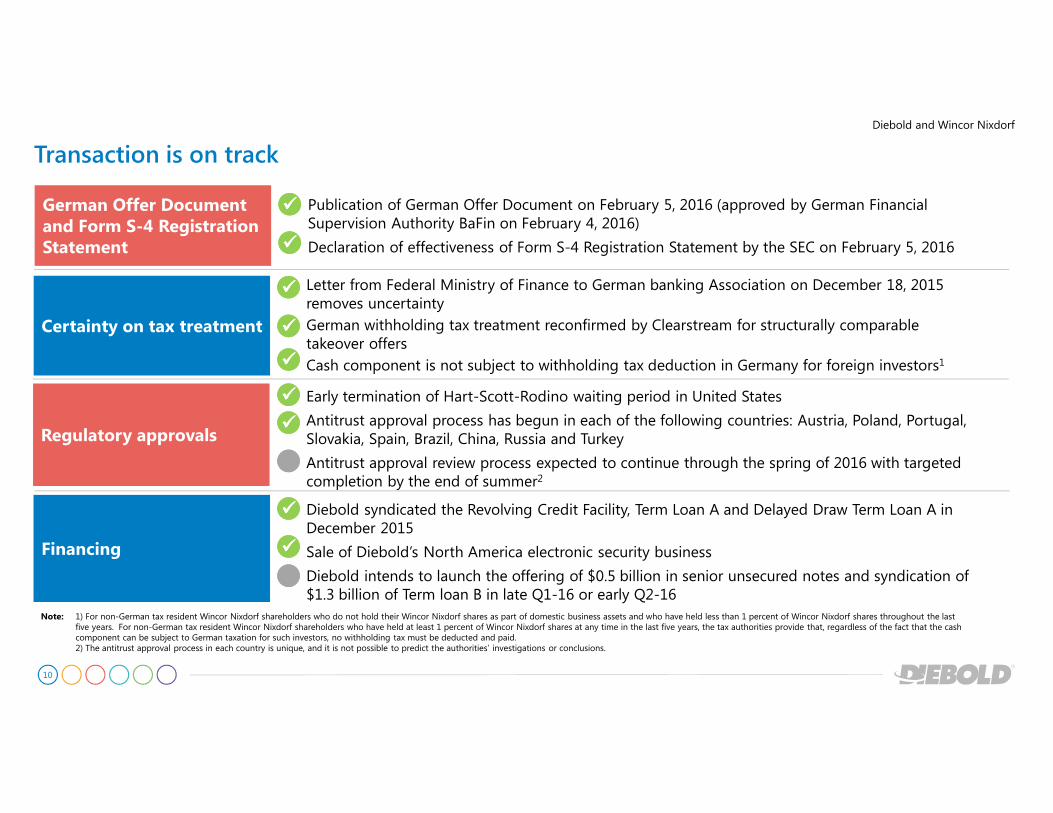
Transaction is on track
German Offer Document and Form S-4 Registration Statement
Publication of German Offer Document on February 5, 2016 (approved by German Financial Supervision Authority BaFin on February 4, 2016)
Declaration of effectiveness of Form S-4 Registration Statement by the SEC on February 5, 2016
Certainty on tax treatment
Letter from Federal Ministry of Finance to German banking Association on December 18, 2015 removes uncertainty
German withholding tax treatment reconfirmed by Clearstream for structurally comparable takeover offers
Cash component is not subject to withholding tax deduction in Germany for foreign investors1
Financing
Diebold syndicated the Revolving Credit Facility, Term Loan A and Delayed Draw Term Loan A in December 2015
Sale of Diebold’s North America electronic security business
Diebold intends to launch the offering of $0.5 billion in senior unsecured notes and syndication of $1.3 billion of Term loan B in late Q1-16 or early Q2-16
Regulatory approvals
Early termination of Hart-Scott-Rodino waiting period in United States
Antitrust approval process has begun in each of the following countries: Austria, Poland, Portugal, Slovakia, Spain, Brazil, China, Russia and Turkey
Antitrust approval review process expected to continue through the spring of 2016 with targeted completion by the end of summer2
Note: 1) For non-German tax resident Wincor Nixdorf shareholders who do not hold their Wincor Nixdorf shares as part of domestic business assets and who have held less than 1 percent of Wincor Nixdorf shares throughout the last five years. For non-German tax resident Wincor Nixdorf shareholders who have held at least 1 percent of Wincor Nixdorf shares at any time in the last five years, the tax authorities provide that, regardless of the fact that the cash component can be subject to German taxation for such investors, no withholding tax must be deducted and paid.2) The antitrust approval process in each country is unique, and it is not possible to predict the authorities’ investigations or conclusions.
��������
��������
��������
��������
��������
��������
��������
��������
��������
Diebold and Wincor Nixdorf
11
Leadership
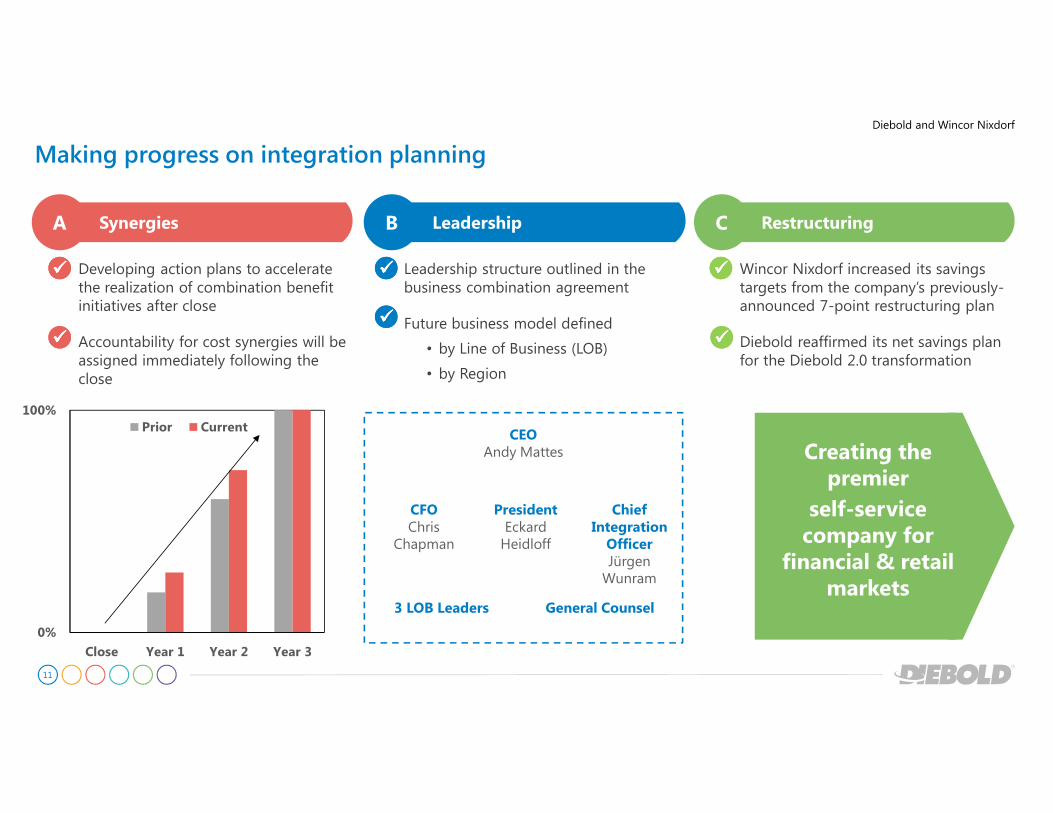
Making progress on integration planning
Synergies B RestructuringC
Developing action plans to accelerate the realization of combination benefit initiatives after close
Accountability for cost synergies will be assigned immediately following the close
Leadership structure outlined in the business combination agreement
Future business model defined
• by Line of Business (LOB)
• by Region
Wincor Nixdorf increased its savings targets from the company’s previously-announced 7-point restructuring plan
Diebold reaffirmed its net savings plan for the Diebold 2.0 transformation
��������
��������
��������
��������
��������
��������
CEOAndy Mattes
Chief Integration
OfficerJürgen Wunram
CFOChris
Chapman
3 LOB Leaders General Counsel
PresidentEckard Heidloff
0%
100%
Close Year 1 Year 2 Year 3
Prior Current
Creating the premier
self-service company for
financial & retail markets
A
Diebold and Wincor Nixdorf
12
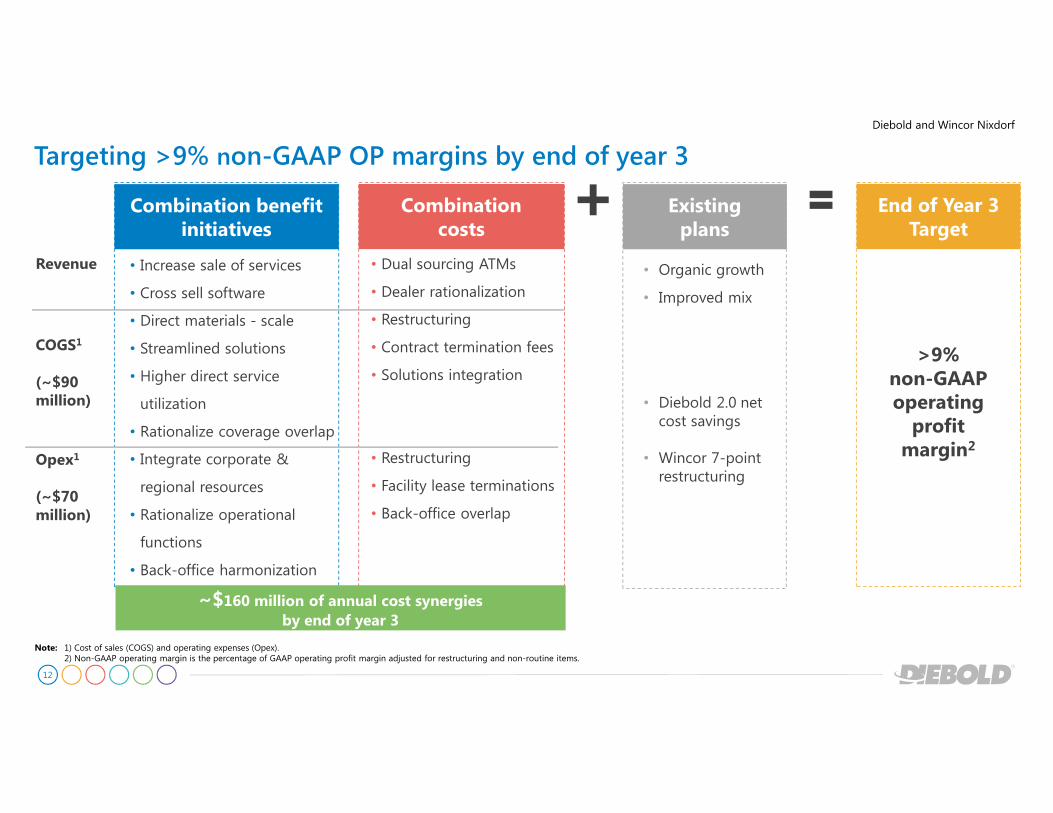
Targeting >9% non-GAAP OP margins by end of year 3
Note: 1) Cost of sales (COGS) and operating expenses (Opex).2) Non-GAAP operating margin is the percentage of GAAP operating profit margin adjusted for restructuring and non-routine items.
Revenue
COGS1
(~$90 million)
Opex1
(~$70 million)
• Increase sale of services
• Cross sell software
• Direct materials - scale
• Streamlined solutions
• Higher direct service
utilization
• Rationalize coverage overlap
• Integrate corporate &
regional resources
• Rationalize operational
functions
• Back-office harmonization
• Dual sourcing ATMs
• Dealer rationalization
• Restructuring
• Contract termination fees
• Solutions integration
• Restructuring
• Facility lease terminations
• Back-office overlap
Combination benefit initiatives
Combination costs
~$160 million of annual cost synergiesby end of year 3
>9% non-GAAP operating
profit margin2
End of Year 3Target
• Organic growth
• Improved mix
• Diebold 2.0 net cost savings
• Wincor 7-point restructuring
Existing plans
Diebold and Wincor Nixdorf
13
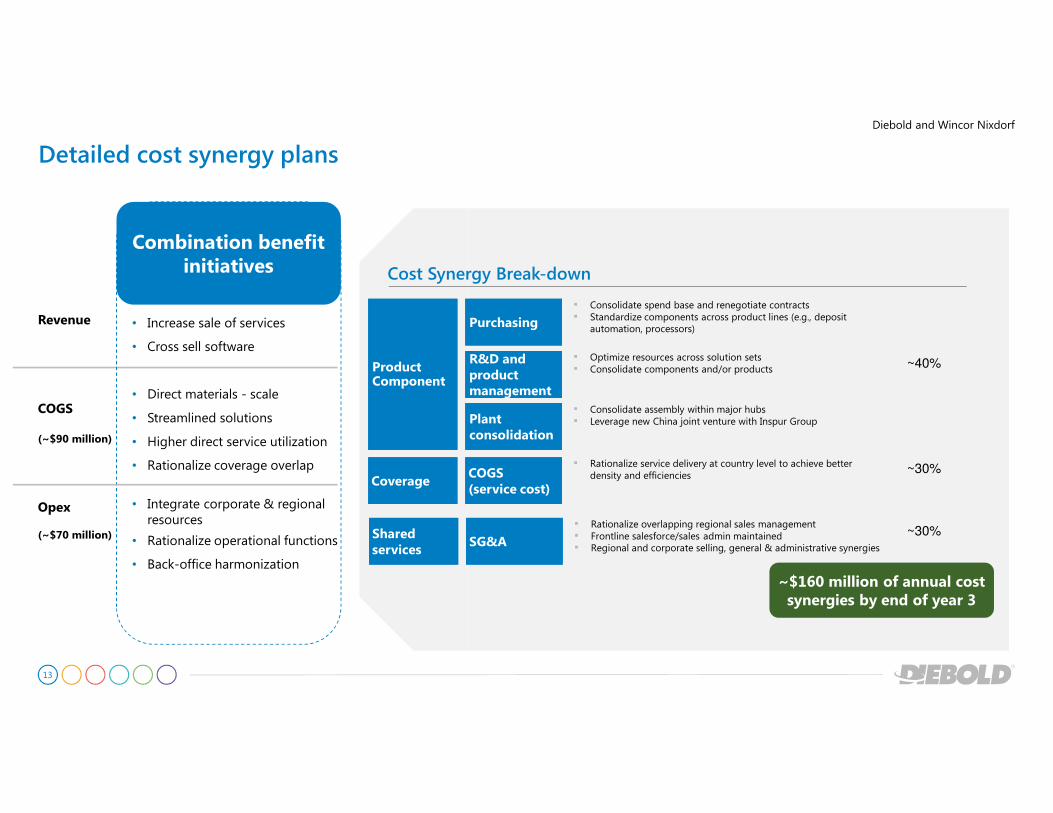
Detailed cost synergy plans
Revenue
COGS
(~$90 million)
Opex
(~$70 million)
• Increase sale of services
• Cross sell software
• Direct materials - scale
• Streamlined solutions
• Higher direct service utilization
• Rationalize coverage overlap
• Integrate corporate & regional resources
• Rationalize operational functions
• Back-office harmonization
Combination benefit initiatives
SG&ASG&A
Plant consolidationPlant consolidation
COGS(service cost)COGS(service cost)
Product ComponentProduct Component
CoverageCoverage
Shared servicesShared services
▪ Consolidate assembly within major hubs▪ Leverage new China joint venture with Inspur Group
▪ Consolidate spend base and renegotiate contracts▪ Standardize components across product lines (e.g., deposit
automation, processors)
▪ Rationalize service delivery at country level to achieve better density and efficiencies
PurchasingPurchasing
▪ Rationalize overlapping regional sales management ▪ Frontline salesforce/sales admin maintained▪ Regional and corporate selling, general & administrative synergies
~40%
~30%
~30%
R&D and product management
R&D and product management
▪ Optimize resources across solution sets ▪ Consolidate components and/or products
Cost Synergy Break-down
~$160 million of annual cost synergies by end of year 3
Diebold and Wincor Nixdorf
14
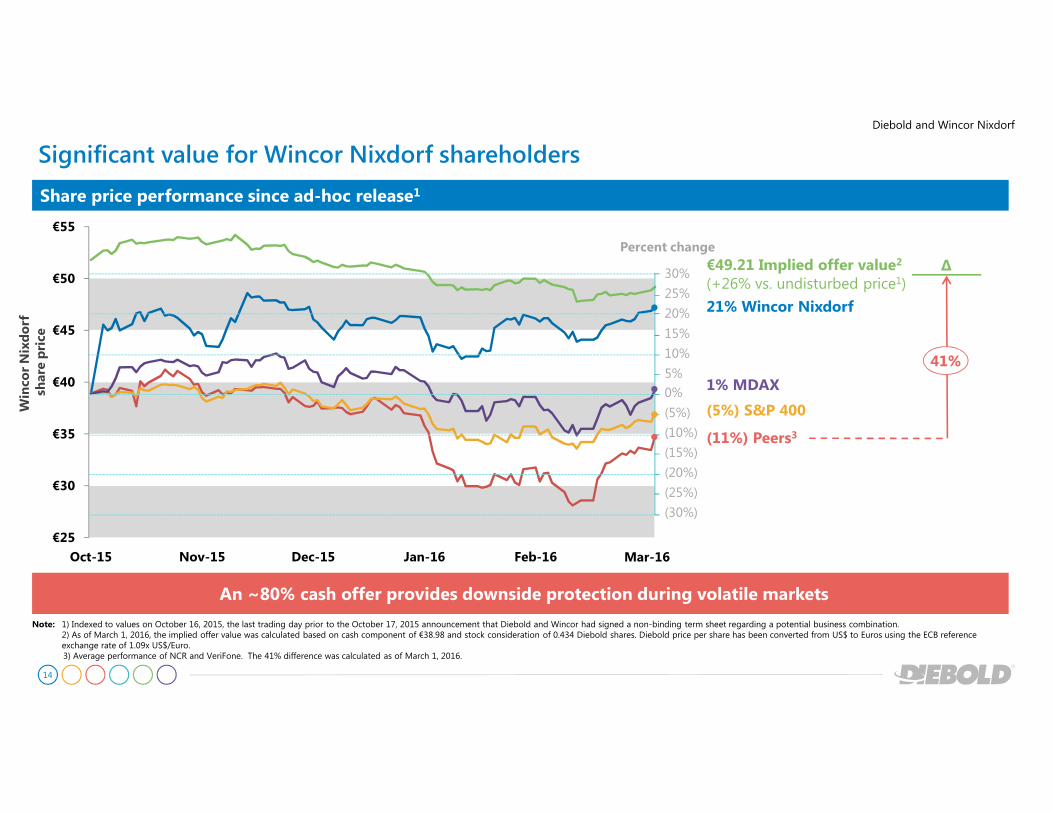
Significant value for Wincor Nixdorf shareholders
Diebold and Wincor Nixdorf
Note: 1) Indexed to values on October 16, 2015, the last trading day prior to the October 17, 2015 announcement that Diebold and Wincor had signed a non-binding term sheet regarding a potential business combination. 2) As of March 1, 2016, the implied offer value was calculated based on cash component of €38.98 and stock consideration of 0.434 Diebold shares. Diebold price per share has been converted from US$ to Euros using the ECB reference exchange rate of 1.09x US$/Euro.3) Average performance of NCR and VeriFone. The 41% difference was calculated as of March 1, 2016.
Share price performance since ad-hoc release1
An ~80% cash offer provides downside protection during volatile markets
€25
€30
€35
€40
€45
€50
€55
Oct-15 Nov-15 Dec-15 Jan-16 Feb-16 Feb-16
Win
cor Nix
dorf
share
price
21% Wincor Nixdorf
(11%) Peers3
(5%) S&P 400
1% MDAX
∆
41%
0%
(5%)
(25%)
(15%)
(30%)
(20%)
(10%)
30%
10%
20%
5%
15%
25%
€49.21 Implied offer value2
(+26% vs. undisturbed price1)
Percent change
Mar-16
15
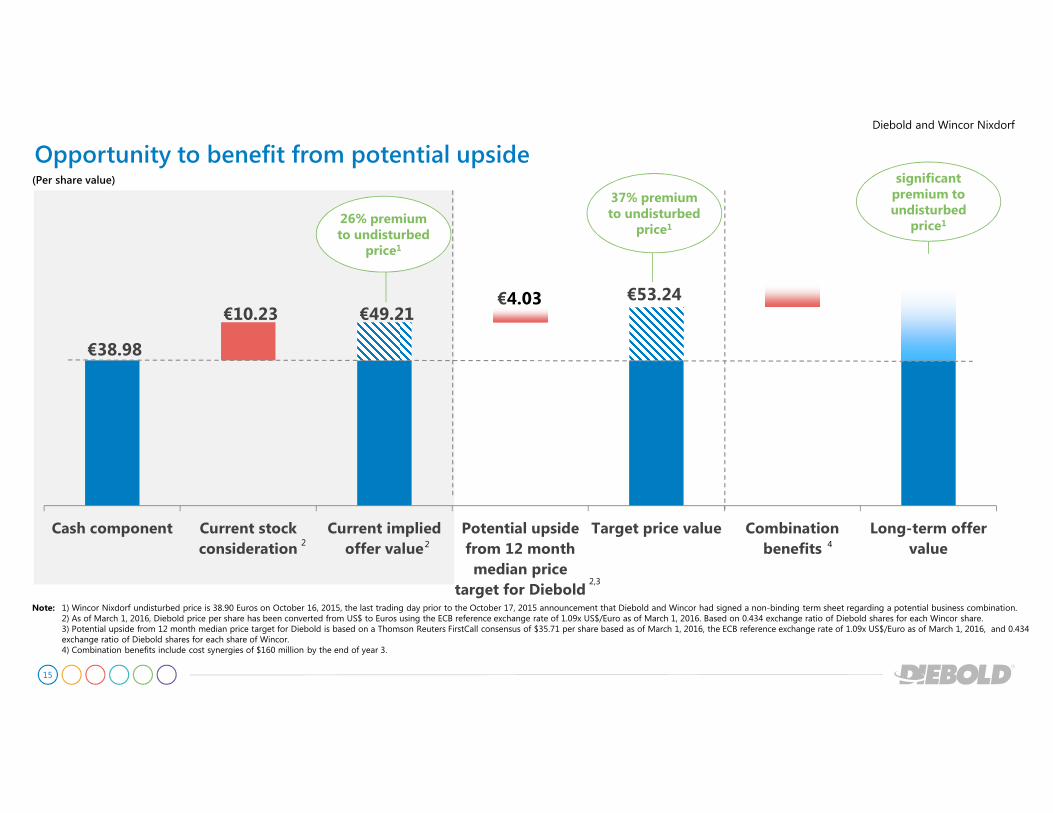
Opportunity to benefit from potential upside
Diebold and Wincor Nixdorf
€38.98
€10.23 €49.21 €53.24
Cash component Current stock
consideration
Current implied
offer value
Potential upside
from 12 month
median price
target for Diebold
Target price value Combination
benefits
Long-term offer
value4
37% premium to undisturbed
price1
Note: 1) Wincor Nixdorf undisturbed price is 38.90 Euros on October 16, 2015, the last trading day prior to the October 17, 2015 announcement that Diebold and Wincor had signed a non-binding term sheet regarding a potential business combination.2) As of March 1, 2016, Diebold price per share has been converted from US$ to Euros using the ECB reference exchange rate of 1.09x US$/Euro as of March 1, 2016. Based on 0.434 exchange ratio of Diebold shares for each Wincor share.3) Potential upside from 12 month median price target for Diebold is based on a Thomson Reuters FirstCall consensus of $35.71 per share based as of March 1, 2016, the ECB reference exchange rate of 1.09x US$/Euro as of March 1, 2016, and 0.434 exchange ratio of Diebold shares for each share of Wincor.4) Combination benefits include cost synergies of $160 million by the end of year 3.
26% premium to undisturbed
price1
2 2
(Per share value)
2,3
€4.03
significant premium to undisturbed
price1
16
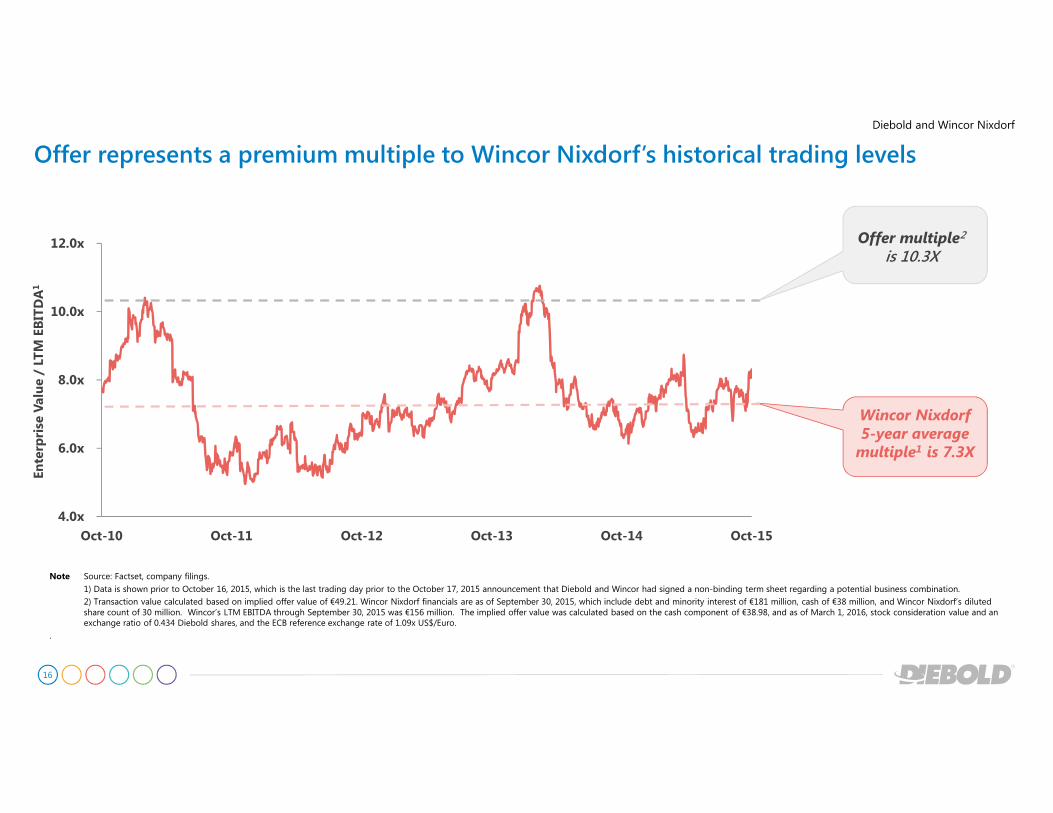
Offer represents a premium multiple to Wincor Nixdorf’s historical trading levels
Diebold and Wincor Nixdorf
4.0x
6.0x
8.0x
10.0x
12.0x
Oct-10 Oct-11 Oct-12 Oct-13 Oct-14 Oct-15
Note Source: Factset, company filings.
1) Data is shown prior to October 16, 2015, which is the last trading day prior to the October 17, 2015 announcement that Diebold and Wincor had signed a non-binding term sheet regarding a potential business combination.
2) Transaction value calculated based on implied offer value of €49.21. Wincor Nixdorf financials are as of September 30, 2015, which include debt and minority interest of €181 million, cash of €38 million, and Wincor Nixdorf’s diluted share count of 30 million. Wincor’s LTM EBITDA through September 30, 2015 was €156 million. The implied offer value was calculated based on the cash component of €38.98, and as of March 1, 2016, stock consideration value and an exchange ratio of 0.434 Diebold shares, and the ECB reference exchange rate of 1.09x US$/Euro.
.
Offer multiple2
is 10.3X
Wincor Nixdorf 5-year average multiple1 is 7.3X
Ente
rprise
Valu
e / LTM
EBIT
DA
1
17
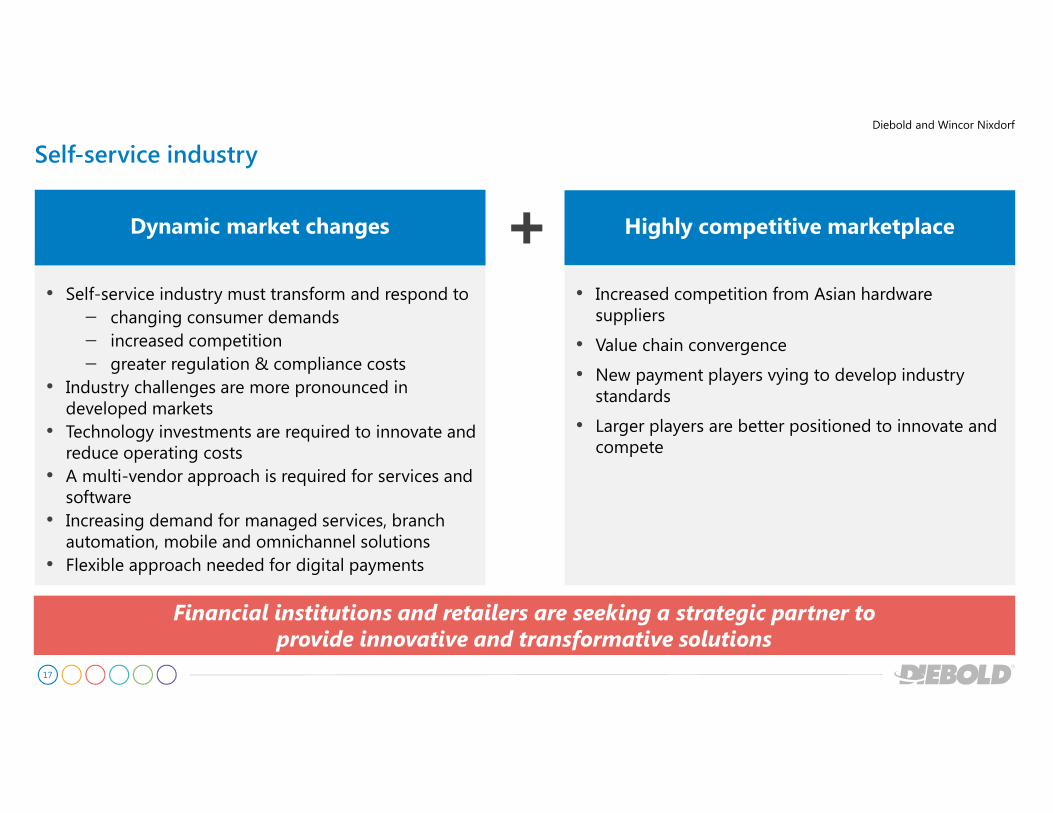
Self-service industry
• Increased competition from Asian hardware suppliers
• Value chain convergence
• New payment players vying to develop industry standards
• Larger players are better positioned to innovate and compete
• Self-service industry must transform and respond to – changing consumer demands – increased competition– greater regulation & compliance costs
• Industry challenges are more pronounced in developed markets
• Technology investments are required to innovate and reduce operating costs
• A multi-vendor approach is required for services and software
• Increasing demand for managed services, branch automation, mobile and omnichannel solutions
• Flexible approach needed for digital payments
Highly competitive marketplaceDynamic market changes
Financial institutions and retailers are seeking a strategic partner to provide innovative and transformative solutions
Diebold and Wincor Nixdorf
18
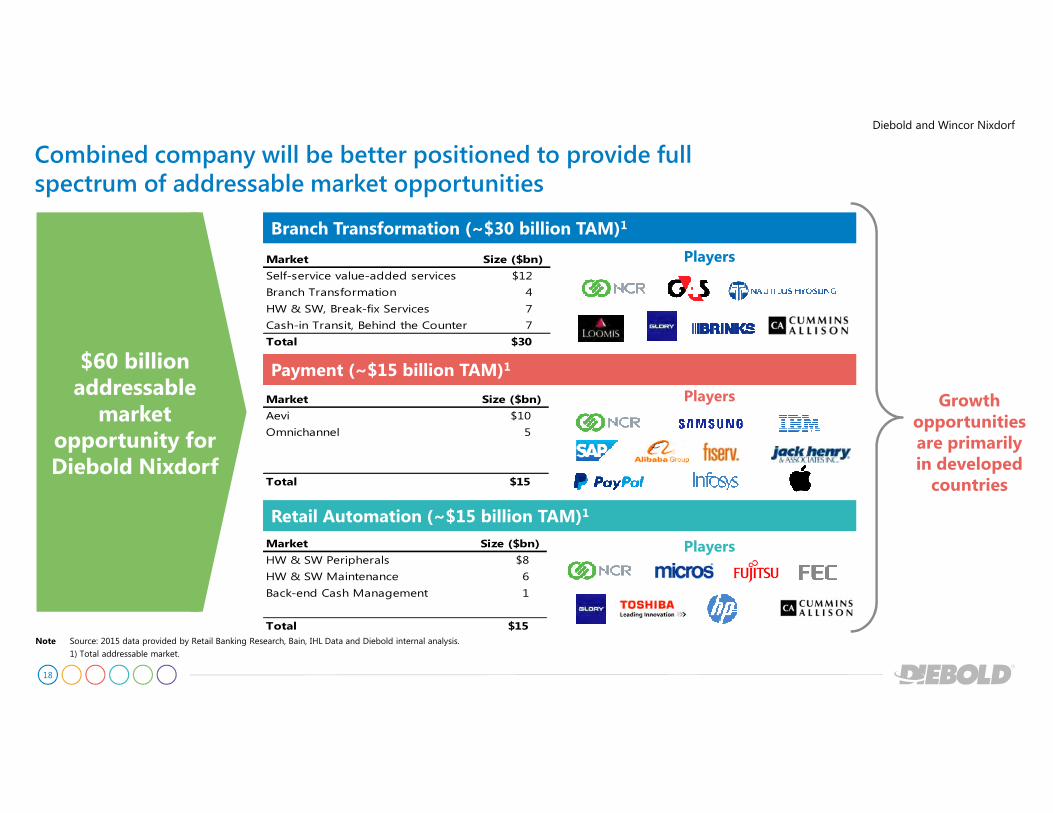
Combined company will be better positioned to provide full spectrum of addressable market opportunities
Branch Transformation (~$30 billion TAM)1
Payment (~$15 billion TAM)1
Retail Automation (~$15 billion TAM)1
Note Source: 2015 data provided by Retail Banking Research, Bain, IHL Data and Diebold internal analysis.
1) Total addressable market.
Players
Players
PlayersMarket Size ($bn)
Self-service value-added services $12
Branch Transformation 4
HW & SW, Break-fix Services 7
Cash-in Transit, Behind the Counter 7
Total $30
Market Size ($bn)
Aevi $10
Omnichannel 5
Total $15
Market Size ($bn)
HW & SW Peripherals $8
HW & SW Maintenance 6
Back-end Cash Management 1
Total $15
Growth opportunities are primarily in developed
countries
$60 billion addressable
market opportunity forDiebold Nixdorf
Diebold and Wincor Nixdorf
19
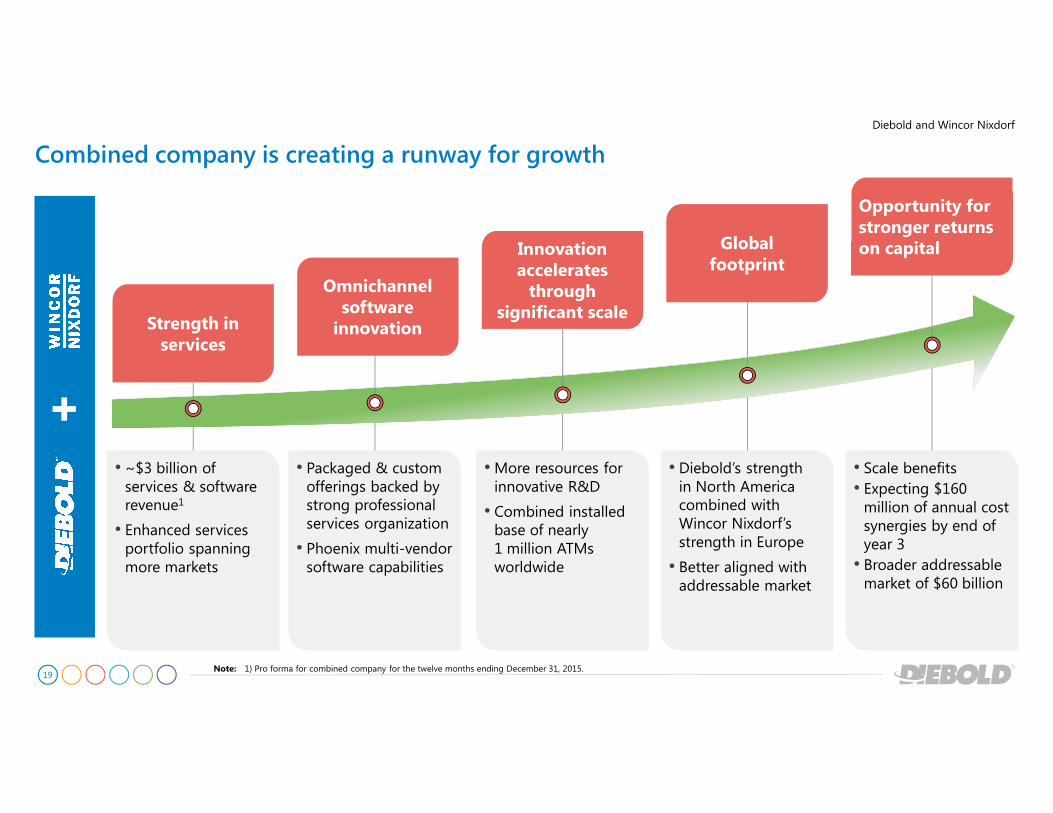
• More resources for innovative R&D
• Combined installed base of nearly 1 million ATMs worldwide
• Diebold’s strength in North America combined with Wincor Nixdorf’s strength in Europe
• Better aligned with addressable market
• Scale benefits• Expecting $160 million of annual cost synergies by end of year 3
• Broader addressable market of $60 billion
• ~$3 billion of services & software revenue1
• Enhanced services portfolio spanning more markets
• Packaged & custom offerings backed by strong professional services organization
• Phoenix multi-vendor software capabilities
Combined company is creating a runway for growth
Note: 1) Pro forma for combined company for the twelve months ending December 31, 2015.
Omnichannel software
innovation
Innovation accelerates through
significant scale
Global footprint
Opportunity for stronger returns on capital
Strength in services
+
Diebold and Wincor Nixdorf
Diebold 2.0 Transformation
21
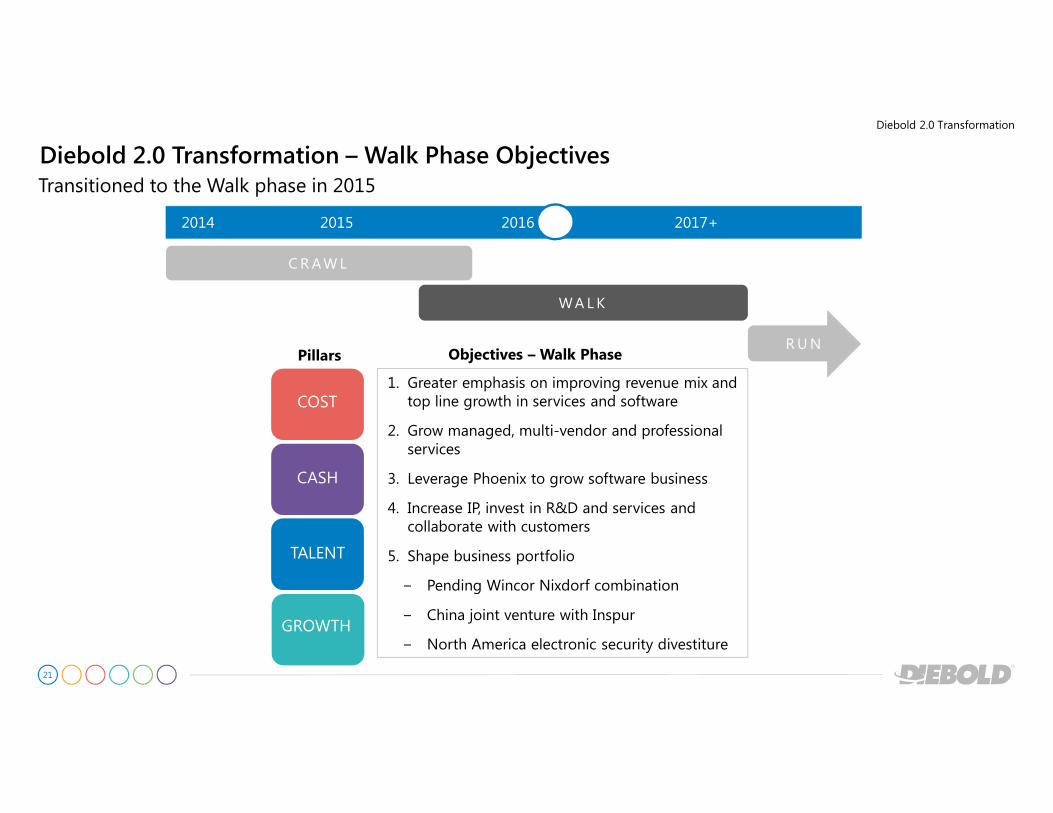
Diebold 2.0 Transformation – Walk Phase Objectives
Diebold 2.0 Transformation
Transitioned to the Walk phase in 2015
Objectives – Walk Phase
1. Greater emphasis on improving revenue mix and top line growth in services and software
2. Grow managed, multi-vendor and professional services
3. Leverage Phoenix to grow software business
4. Increase IP, invest in R&D and services and collaborate with customers
5. Shape business portfolio
− Pending Wincor Nixdorf combination
− China joint venture with Inspur
− North America electronic security divestiture
CRAWL
WALK
2014 2016 2017+2015
RUNPillars
GROWTH
COST
CASH
TALENT
22
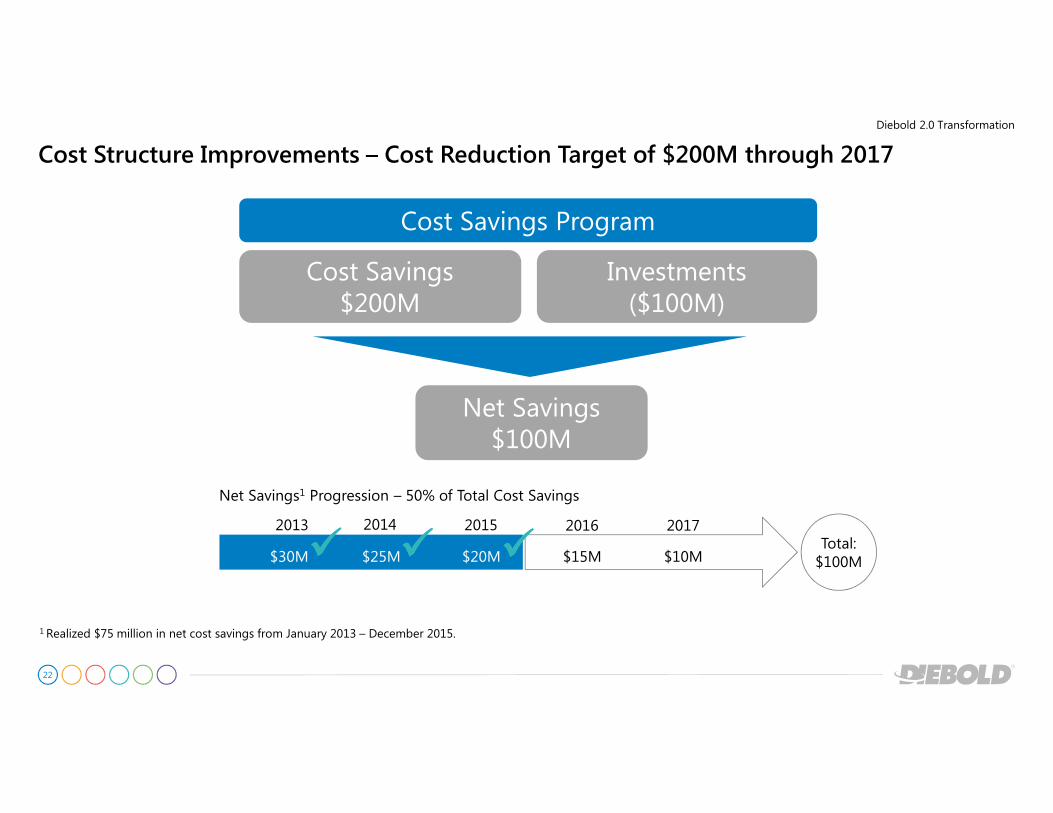
Cost Structure Improvements – Cost Reduction Target of $200M through 2017
1 Realized $75 million in net cost savings from January 2013 – December 2015.
2013 2014 2015
$30M $25M $20M
2016
$15M
2017
$10M
Net Savings1 Progression – 50% of Total Cost Savings
Total: $100M���� ����
Cost Savings Program
Cost Savings$200M
Investments($100M)
Net Savings$100M
Diebold 2.0 Transformation
����
23
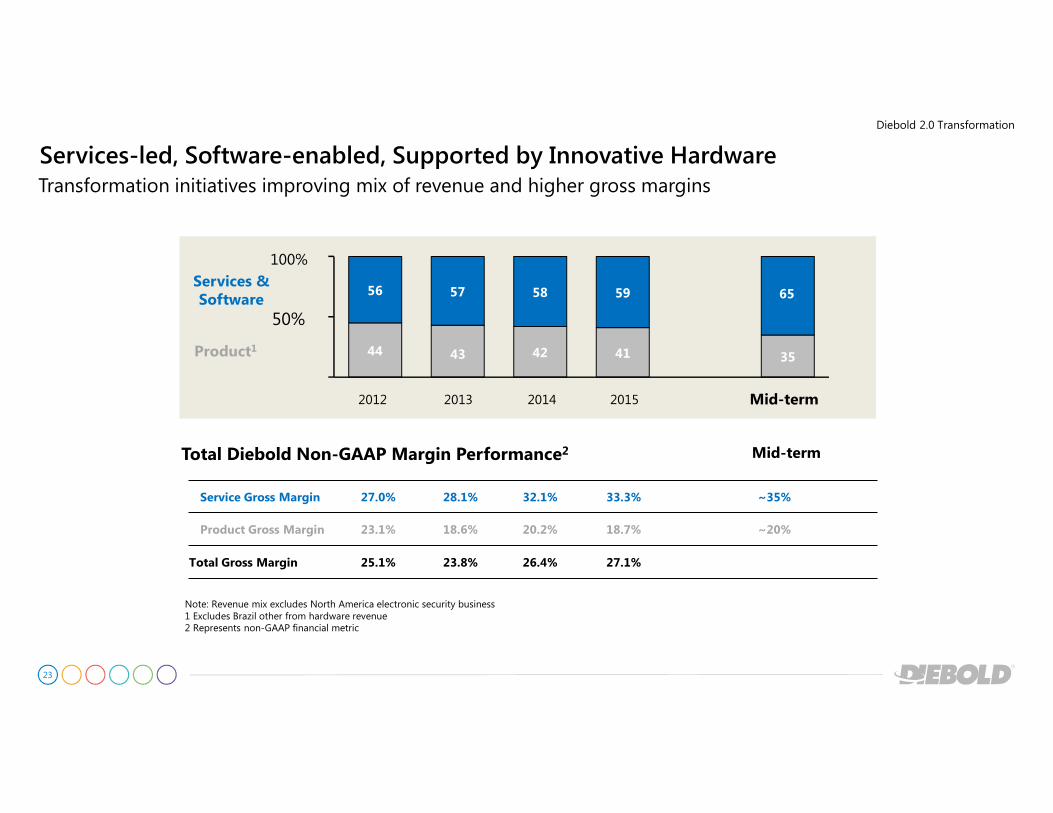
Services-led, Software-enabled, Supported by Innovative HardwareTransformation initiatives improving mix of revenue and higher gross margins
Diebold 2.0 Transformation
Note: Revenue mix excludes North America electronic security business1 Excludes Brazil other from hardware revenue2 Represents non-GAAP financial metric
44 42 41 35
56 57 58 59
100%
50%
43
2013 20142012
Services & Software
Product1
Mid-term
Service Gross Margin 27.0% 28.1% 32.1% 33.3% ~35%
Product Gross Margin 23.1% 18.6% 20.2% 18.7% ~20%
Total Gross Margin 25.1% 23.8% 26.4% 27.1%
Total Diebold Non-GAAP Margin Performance2 Mid-term
65
2015
Financial Self-Service
25
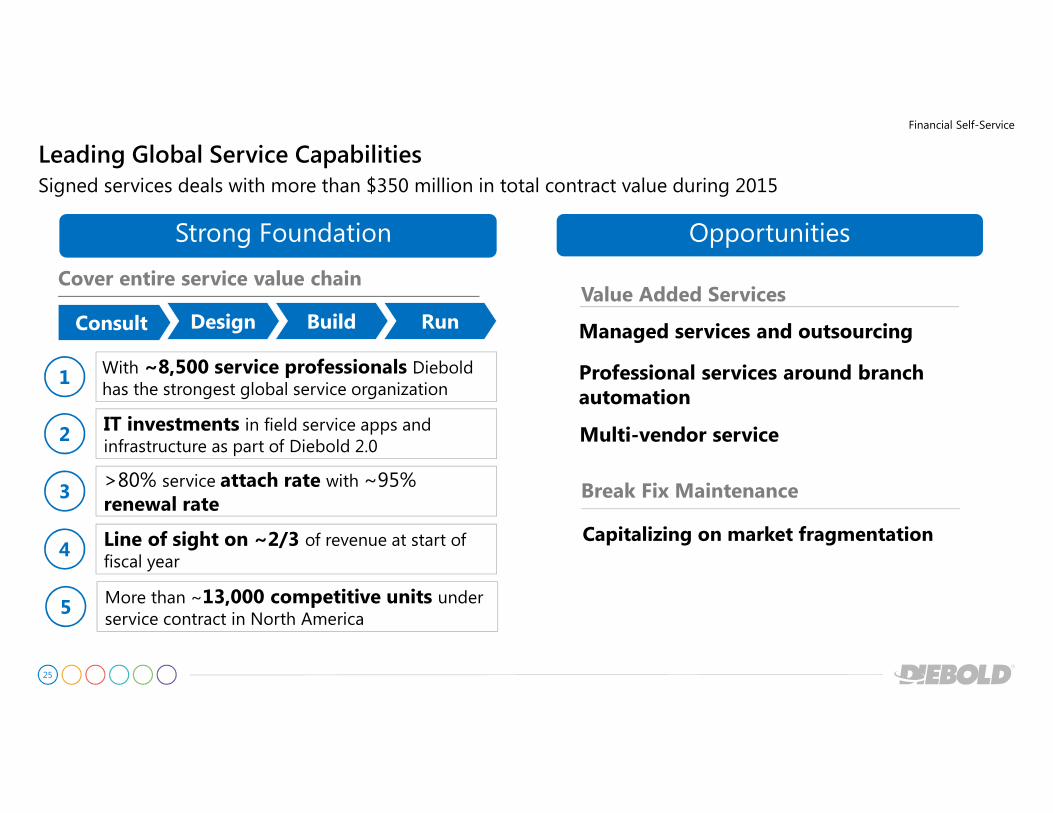
Strong Foundation Opportunities
Managed services and outsourcing
Value Added Services
Break Fix Maintenance
Capitalizing on market fragmentation
Professional services around branch automation
Consult Design Build Run
Cover entire service value chain
IT investments in field service apps and infrastructure as part of Diebold 2.0
>80% service attach rate with ~95% renewal rate
With ~8,500 service professionals Diebold has the strongest global service organization
Line of sight on ~2/3 of revenue at start of fiscal year
1
2
3
4
Leading Global Service Capabilities
Financial Self-Service
Signed services deals with more than $350 million in total contract value during 2015
More than ~13,000 competitive units under service contract in North America
5
Multi-vendor service
26
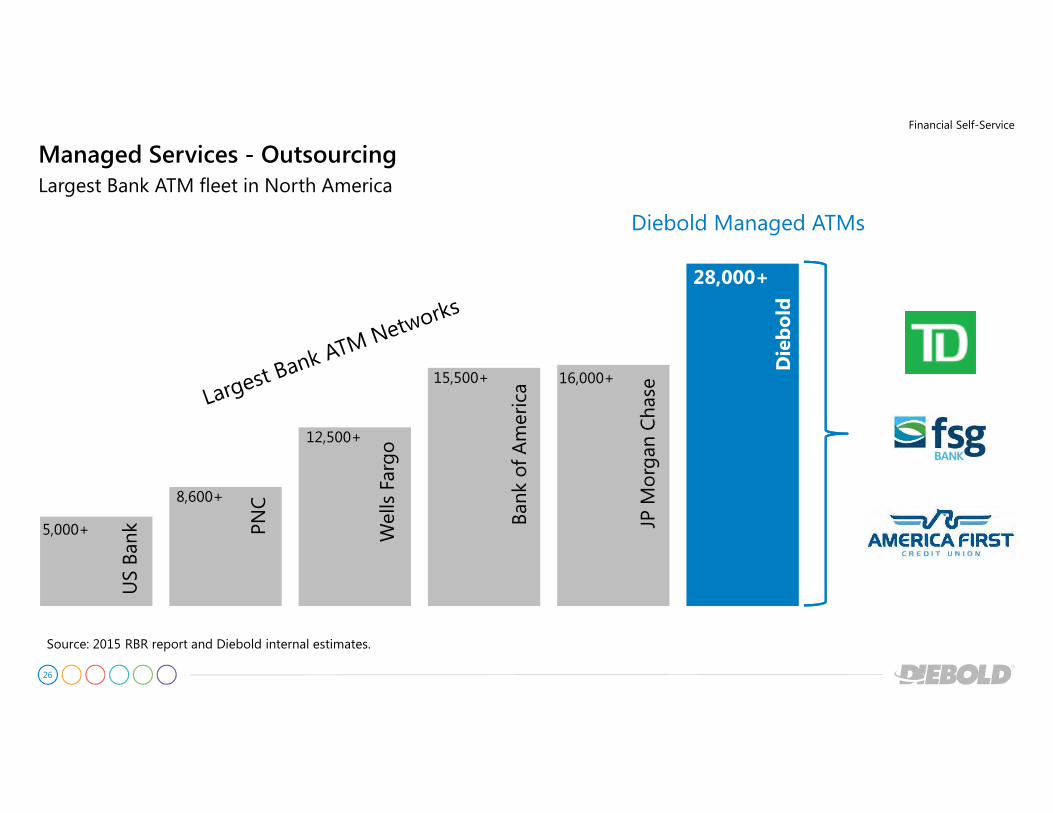
Source: 2015 RBR report and Diebold internal estimates.
Largest Bank ATM fleet in North America
Financial Self-Service
Managed Services - Outsourcing
Diebold Managed ATMs
Die
bold
Ban
k of America
JP M
organ
Chase
Wells Fargo
PNC
US Ban
k5,000+
8,600+
12,500+
15,500+ 16,000+
28,000+
27
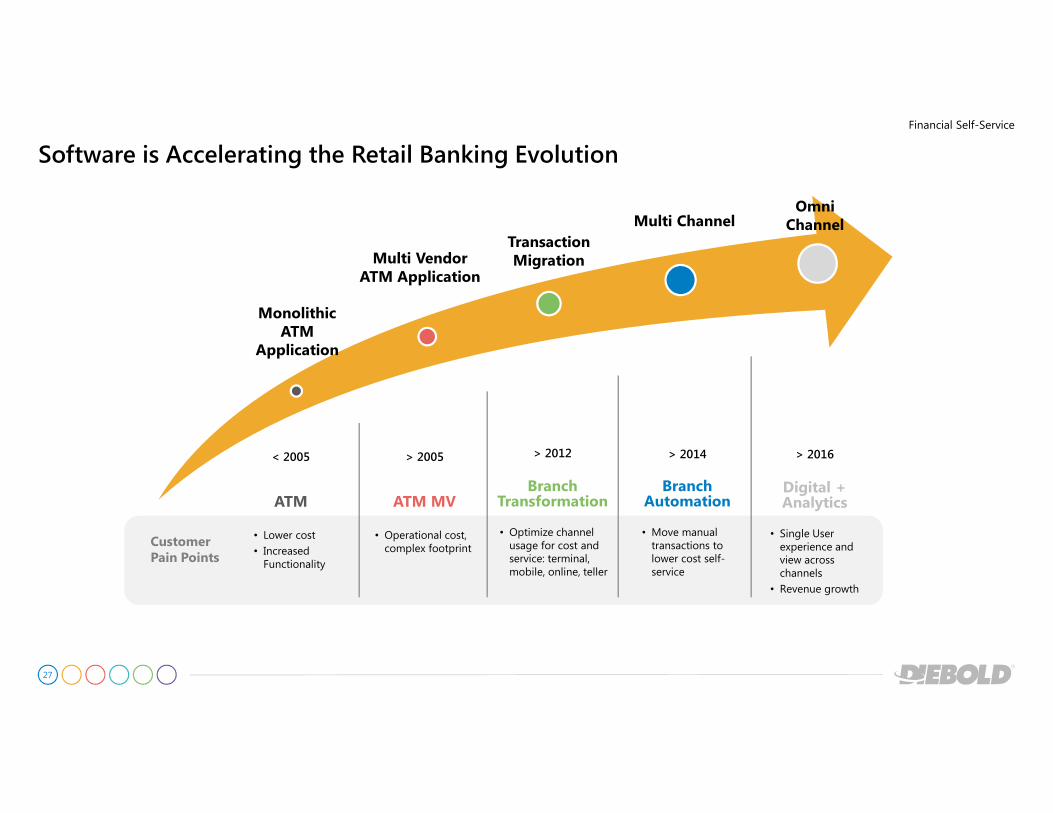
Software is Accelerating the Retail Banking Evolution
Financial Self-Service
Monolithic ATM
Application
Multi Vendor ATM Application
Transaction Migration
Multi ChannelOmni
Channel
• Lower cost
• Increased Functionality
Customer Pain Points
• Operational cost, complex footprint
• Move manual transactions to lower cost self-service
• Optimize channel usage for cost and service: terminal, mobile, online, teller
• Single User experience and view across channels
• Revenue growth
< 2005 > 2005 > 2012 > 2014 > 2016
ATM ATM MVBranch
TransformationBranch
AutomationDigital + Analytics
28
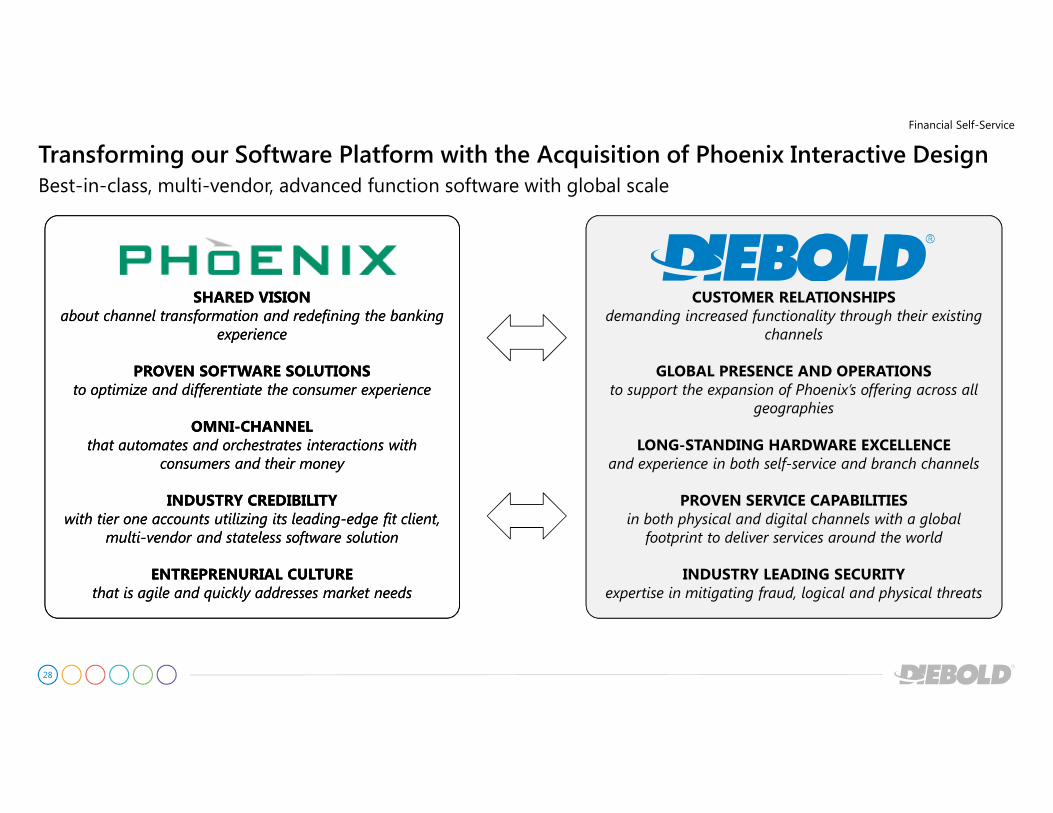
Transforming our Software Platform with the Acquisition of Phoenix Interactive Design
Financial Self-Service
Best-in-class, multi-vendor, advanced function software with global scale
SHARED VISIONabout channel transformation and redefining the banking
experience
PROVEN SOFTWARE SOLUTIONSto optimize and differentiate the consumer experience
OMNI-CHANNEL that automates and orchestrates interactions with
consumers and their money
INDUSTRY CREDIBILITYwith tier one accounts utilizing its leading-edge fit client,
multi-vendor and stateless software solution
ENTREPRENURIAL CULTUREthat is agile and quickly addresses market needs
CUSTOMER RELATIONSHIPSdemanding increased functionality through their existing
channels
GLOBAL PRESENCE AND OPERATIONSto support the expansion of Phoenix’s offering across all
geographies
LONG-STANDING HARDWARE EXCELLENCEand experience in both self-service and branch channels
PROVEN SERVICE CAPABILITIESin both physical and digital channels with a global footprint to deliver services around the world
INDUSTRY LEADING SECURITY expertise in mitigating fraud, logical and physical threats
29
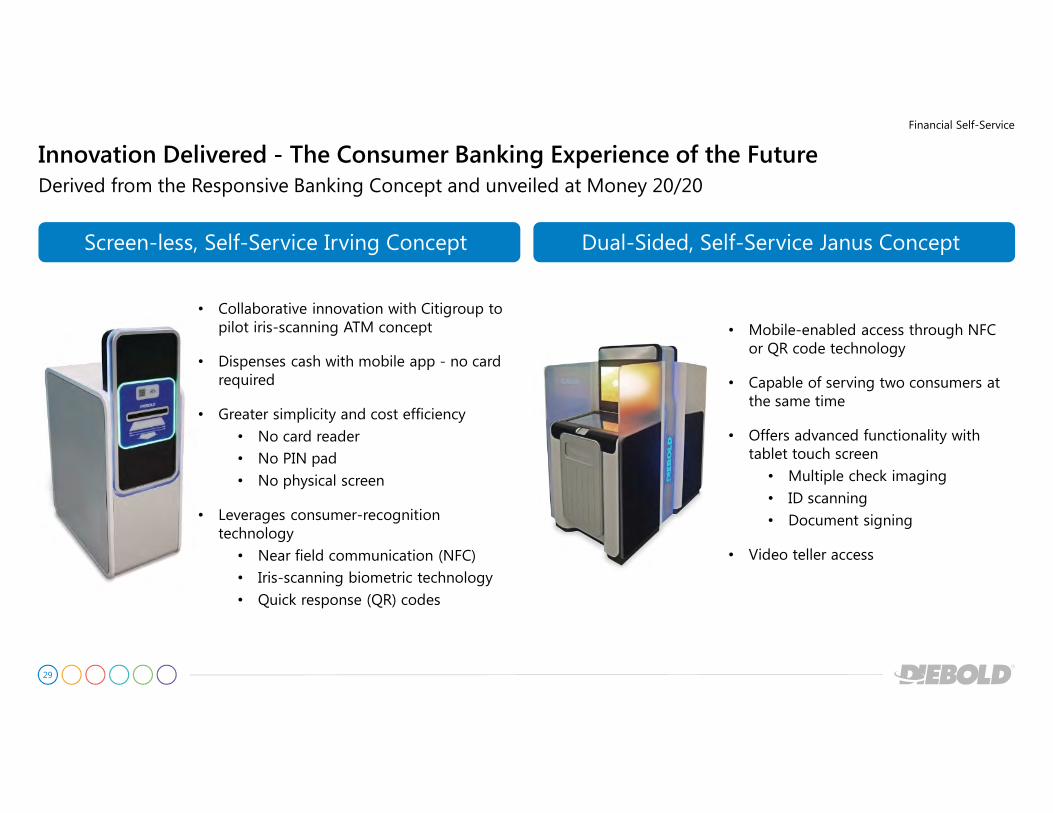
Innovation Delivered - The Consumer Banking Experience of the Future
Financial Self-Service
Derived from the Responsive Banking Concept and unveiled at Money 20/20
Dual-Sided, Self-Service Janus ConceptScreen-less, Self-Service Irving Concept
• Collaborative innovation with Citigroup to pilot iris-scanning ATM concept
• Dispenses cash with mobile app - no card required
• Greater simplicity and cost efficiency
• No card reader
• No PIN pad
• No physical screen
• Leverages consumer-recognition technology
• Near field communication (NFC)
• Iris-scanning biometric technology
• Quick response (QR) codes
• Mobile-enabled access through NFC or QR code technology
• Capable of serving two consumers at the same time
• Offers advanced functionality with tablet touch screen
• Multiple check imaging
• ID scanning
• Document signing
• Video teller access
30
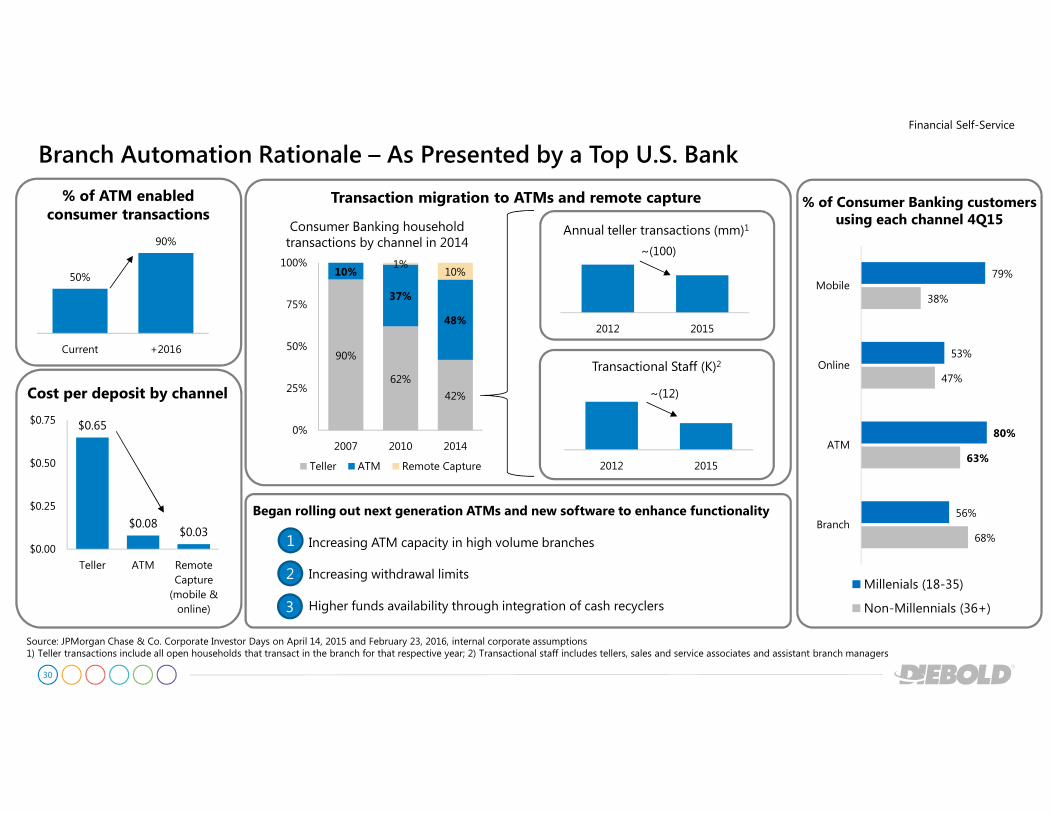
$0.65
$0.08$0.03
$0.00
$0.25
$0.50
$0.75
Teller ATM RemoteCapture(mobile &online)
90%
62%
42%
10%
37%
48%
1%10%
0%
25%
50%
75%
100%
2007 2010 2014
Teller ATM Remote Capture
Transaction migration to ATMs and remote capture
Consumer Banking household transactions by channel in 2014
50%
90%
Current +2016
Source: JPMorgan Chase & Co. Corporate Investor Days on April 14, 2015 and February 23, 2016, internal corporate assumptions1) Teller transactions include all open households that transact in the branch for that respective year; 2) Transactional staff includes tellers, sales and service associates and assistant branch managers
1
Began rolling out next generation ATMs and new software to enhance functionality
Increasing ATM capacity in high volume branches
Increasing withdrawal limits
Higher funds availability through integration of cash recyclers
1
2
3
Cost per deposit by channel
% of ATM enabled consumer transactions
Branch Automation Rationale – As Presented by a Top U.S. Bank
Financial Self-Service
2012 2015
Annual teller transactions (mm)1
2012 2015
Transactional Staff (K)2
~(12)
~(100)
68%
63%
47%
38%
56%
80%
53%
79%
Branch
ATM
Online
Mobile
Millenials (18-35)
Non-Millennials (36+)
% of Consumer Banking customers using each channel 4Q15
31
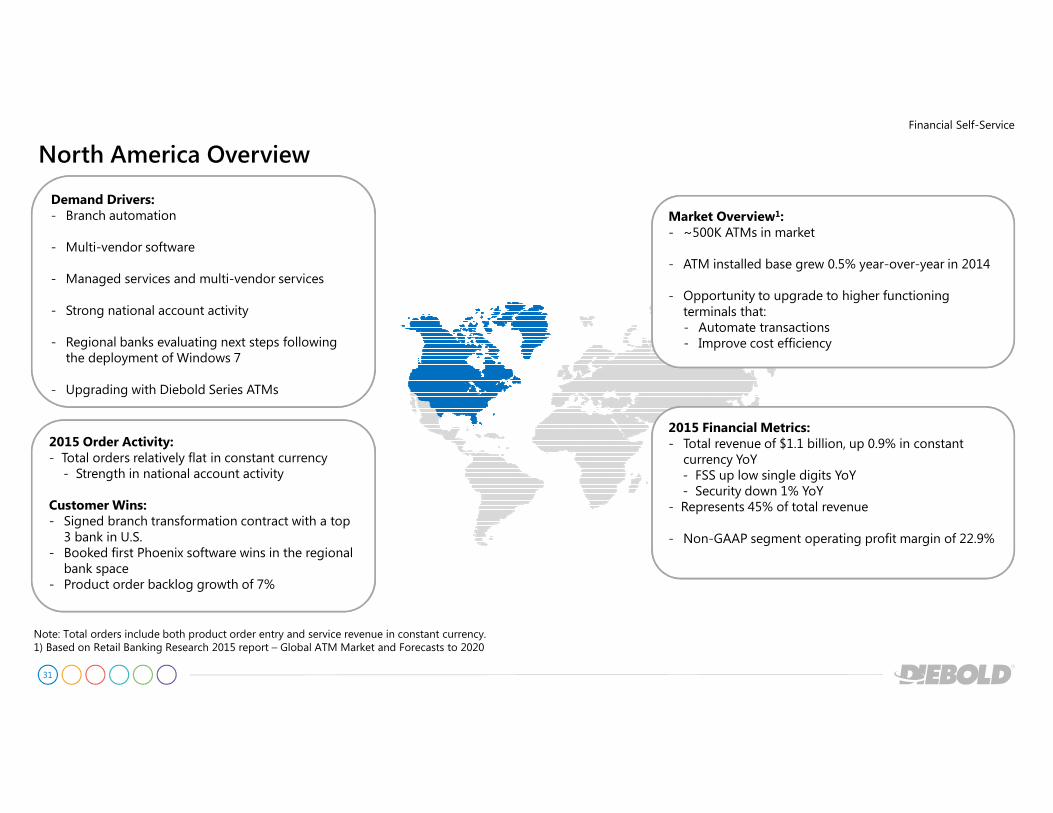
North America Overview
Financial Self-Service
Note: Total orders include both product order entry and service revenue in constant currency.1) Based on Retail Banking Research 2015 report – Global ATM Market and Forecasts to 2020
2015 Financial Metrics:- Total revenue of $1.1 billion, up 0.9% in constant
currency YoY- FSS up low single digits YoY- Security down 1% YoY
- Represents 45% of total revenue
- Non-GAAP segment operating profit margin of 22.9%
2015 Order Activity:- Total orders relatively flat in constant currency
- Strength in national account activity
Customer Wins:- Signed branch transformation contract with a top
3 bank in U.S.- Booked first Phoenix software wins in the regional
bank space - Product order backlog growth of 7%
Market Overview1:- ~500K ATMs in market
- ATM installed base grew 0.5% year-over-year in 2014
- Opportunity to upgrade to higher functioning terminals that:- Automate transactions- Improve cost efficiency
Demand Drivers:- Branch automation
- Multi-vendor software
- Managed services and multi-vendor services
- Strong national account activity
- Regional banks evaluating next steps following the deployment of Windows 7
- Upgrading with Diebold Series ATMs
32
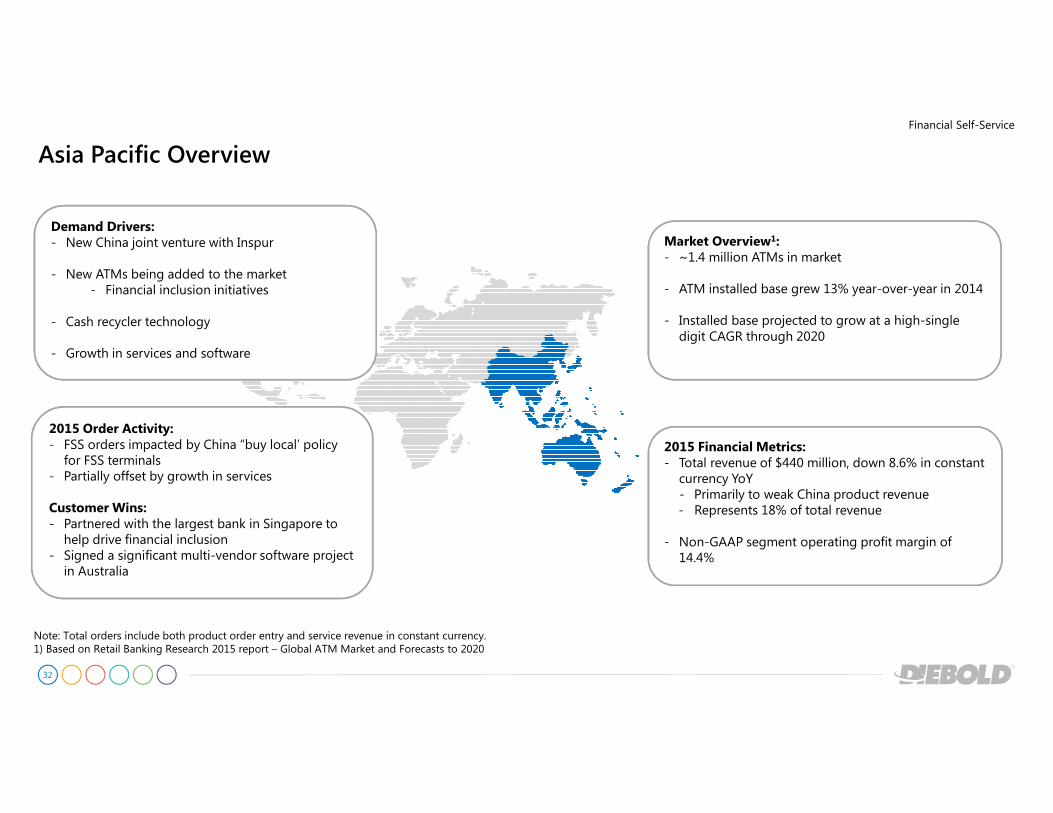
Asia Pacific Overview
Note: Total orders include both product order entry and service revenue in constant currency.1) Based on Retail Banking Research 2015 report – Global ATM Market and Forecasts to 2020
2015 Financial Metrics:- Total revenue of $440 million, down 8.6% in constant
currency YoY- Primarily to weak China product revenue- Represents 18% of total revenue
- Non-GAAP segment operating profit margin of 14.4%
2015 Order Activity:- FSS orders impacted by China “buy local’ policy
for FSS terminals- Partially offset by growth in services
Customer Wins:- Partnered with the largest bank in Singapore to
help drive financial inclusion- Signed a significant multi-vendor software project
in Australia
Market Overview1:- ~1.4 million ATMs in market
- ATM installed base grew 13% year-over-year in 2014
- Installed base projected to grow at a high-single digit CAGR through 2020
Demand Drivers:- New China joint venture with Inspur
- New ATMs being added to the market- Financial inclusion initiatives
- Cash recycler technology
- Growth in services and software
Financial Self-Service
33
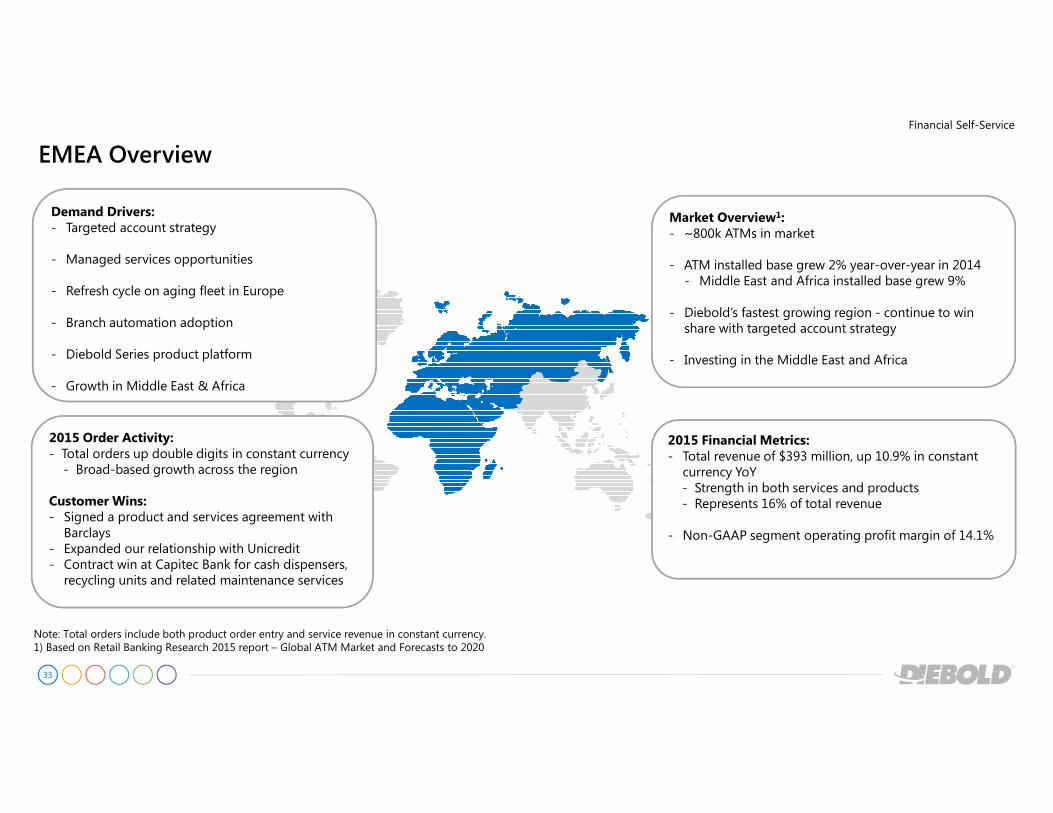
EMEA Overview
Note: Total orders include both product order entry and service revenue in constant currency.1) Based on Retail Banking Research 2015 report – Global ATM Market and Forecasts to 2020
2015 Financial Metrics:- Total revenue of $393 million, up 10.9% in constant
currency YoY- Strength in both services and products- Represents 16% of total revenue
- Non-GAAP segment operating profit margin of 14.1%
2015 Order Activity:- Total orders up double digits in constant currency
- Broad-based growth across the region
Customer Wins:- Signed a product and services agreement with
Barclays - Expanded our relationship with Unicredit- Contract win at Capitec Bank for cash dispensers,
recycling units and related maintenance services
Market Overview1:- ~800k ATMs in market
- ATM installed base grew 2% year-over-year in 2014- Middle East and Africa installed base grew 9%
- Diebold’s fastest growing region - continue to win share with targeted account strategy
- Investing in the Middle East and Africa
Demand Drivers:- Targeted account strategy
- Managed services opportunities
- Refresh cycle on aging fleet in Europe
- Branch automation adoption
- Diebold Series product platform
- Growth in Middle East & Africa
Financial Self-Service
34
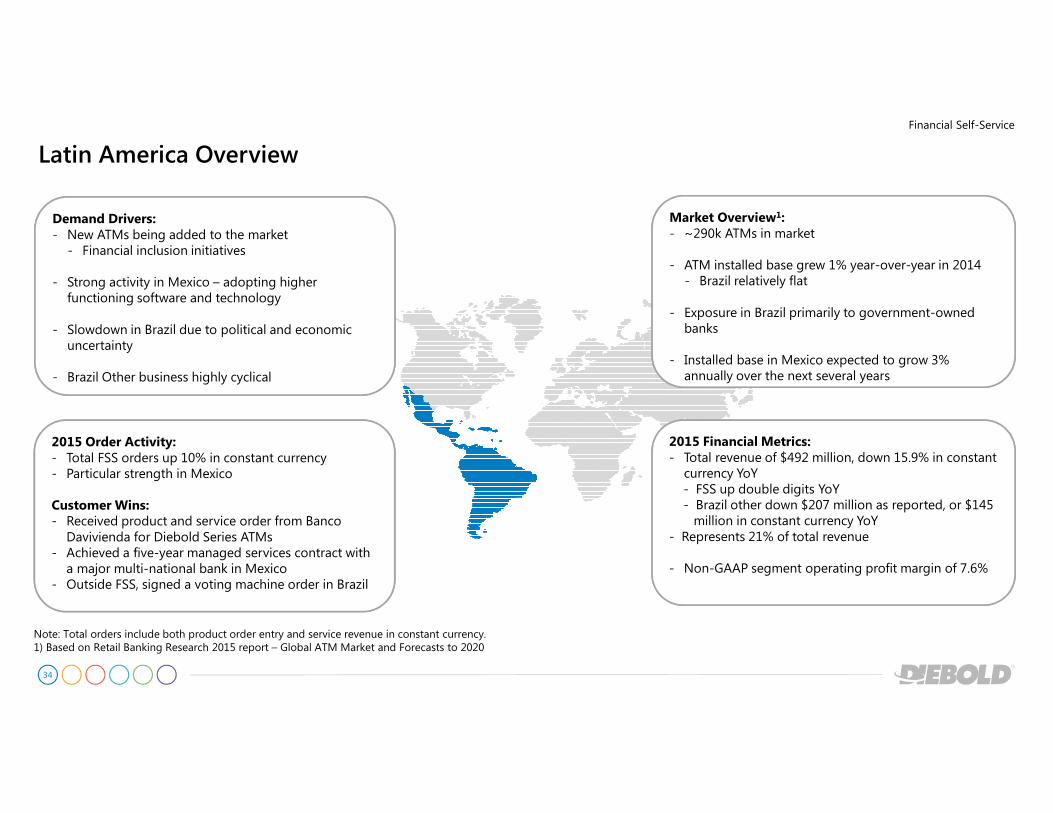
Latin America Overview
Note: Total orders include both product order entry and service revenue in constant currency.1) Based on Retail Banking Research 2015 report – Global ATM Market and Forecasts to 2020
2015 Financial Metrics:- Total revenue of $492 million, down 15.9% in constant
currency YoY- FSS up double digits YoY- Brazil other down $207 million as reported, or $145 million in constant currency YoY
- Represents 21% of total revenue
- Non-GAAP segment operating profit margin of 7.6%
2015 Order Activity:- Total FSS orders up 10% in constant currency- Particular strength in Mexico
Customer Wins:- Received product and service order from Banco
Davivienda for Diebold Series ATMs- Achieved a five-year managed services contract with
a major multi-national bank in Mexico- Outside FSS, signed a voting machine order in Brazil
Market Overview1:- ~290k ATMs in market
- ATM installed base grew 1% year-over-year in 2014- Brazil relatively flat
- Exposure in Brazil primarily to government-owned banks
- Installed base in Mexico expected to grow 3% annually over the next several years
Demand Drivers:- New ATMs being added to the market
- Financial inclusion initiatives
- Strong activity in Mexico – adopting higher functioning software and technology
- Slowdown in Brazil due to political and economic uncertainty
- Brazil Other business highly cyclical
Financial Self-Service
35
Financial Self-Service
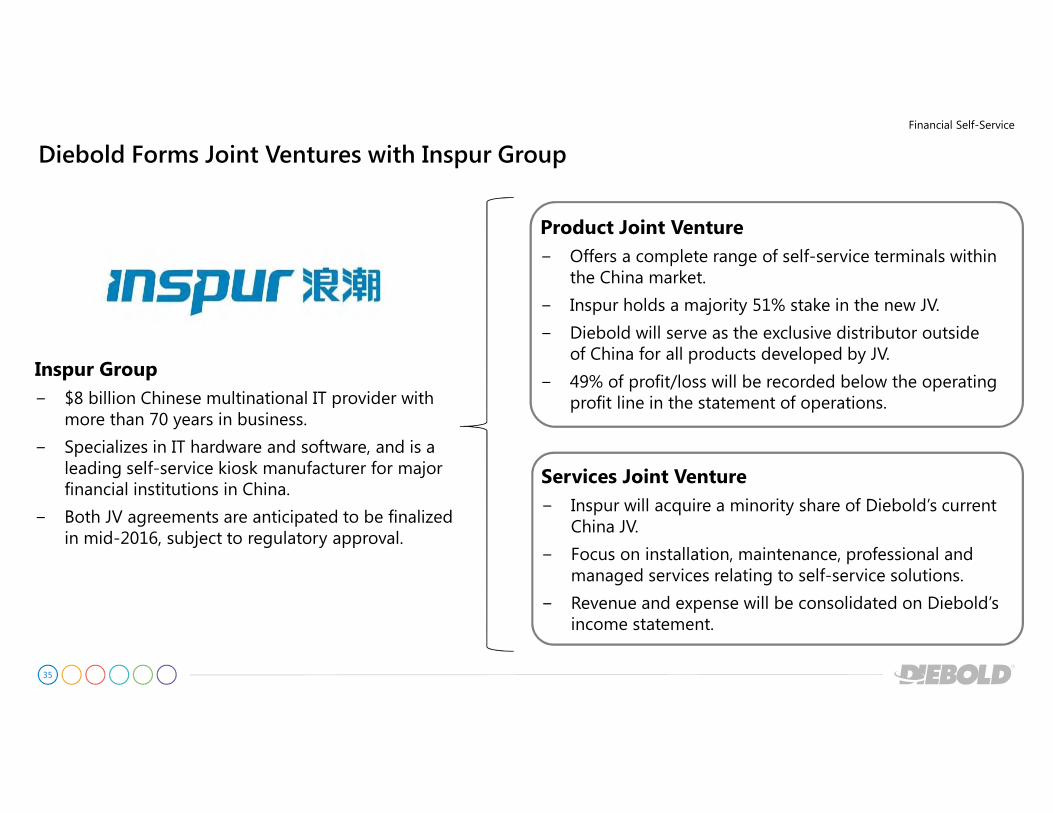
Diebold Forms Joint Ventures with Inspur Group
Inspur Group
− $8 billion Chinese multinational IT provider with more than 70 years in business.
− Specializes in IT hardware and software, and is a leading self-service kiosk manufacturer for major financial institutions in China.
− Both JV agreements are anticipated to be finalized in mid-2016, subject to regulatory approval.
Product Joint Venture
− Offers a complete range of self-service terminals within the China market.
− Inspur holds a majority 51% stake in the new JV.
− Diebold will serve as the exclusive distributor outside of China for all products developed by JV.
− 49% of profit/loss will be recorded below the operating profit line in the statement of operations.
Services Joint Venture
− Inspur will acquire a minority share of Diebold’s current China JV.
− Focus on installation, maintenance, professional and managed services relating to self-service solutions.
− Revenue and expense will be consolidated on Diebold’s income statement.
36
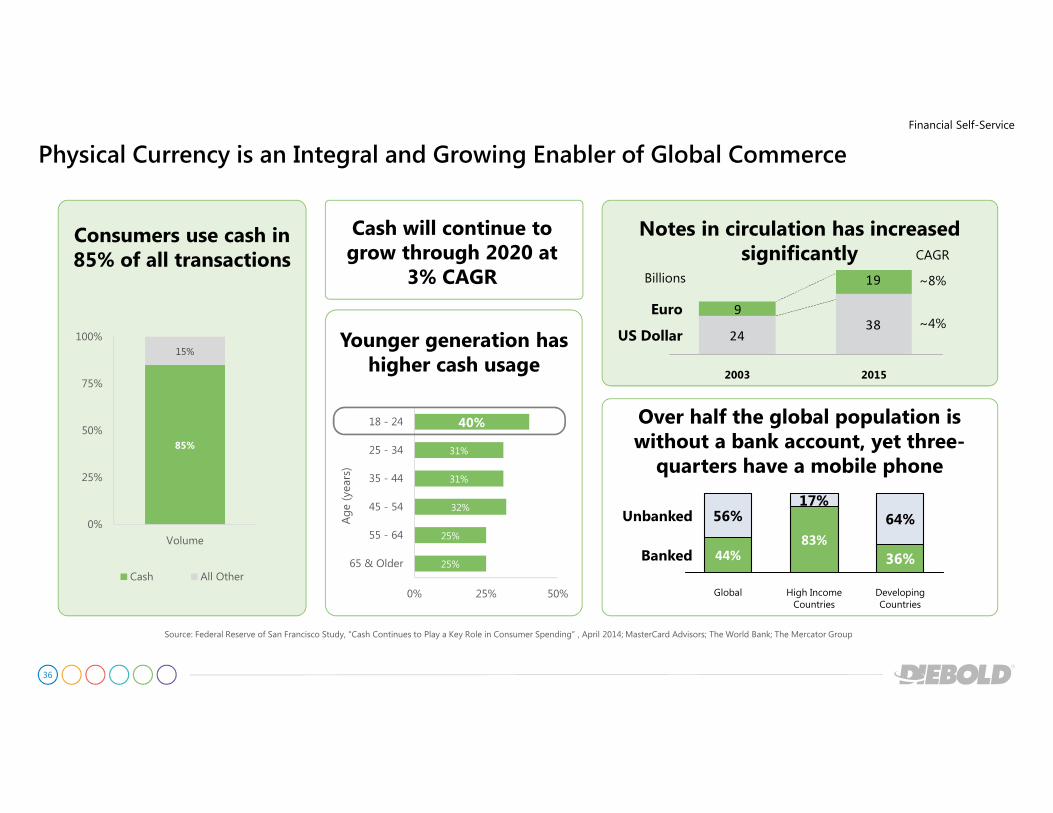
Source: Federal Reserve of San Francisco Study, “Cash Continues to Play a Key Role in Consumer Spending” , April 2014; MasterCard Advisors; The World Bank; The Mercator Group
Consumers use cash in 85% of all transactions
85%
15%
0%
25%
50%
75%
100%
Volume
Cash All Other
Over half the global population is without a bank account, yet three-
quarters have a mobile phone
Younger generation has higher cash usage
25%
25%
32%
31%
31%
40%
0% 25% 50%
65 & Older
55 - 64
45 - 54
35 - 44
25 - 34
18 - 24
Age (yea
rs)
2438
9
19
2015
US Dollar
Euro
2003
Notes in circulation has increased significantly
56% 64%
36%
Developing Countries
83%
17%
Global
44%
High Income Countries
Banked
Unbanked
Physical Currency is an Integral and Growing Enabler of Global Commerce
Financial Self-Service
Cash will continue to grow through 2020 at
3% CAGR Billions
CAGR
~8%
~4%
37
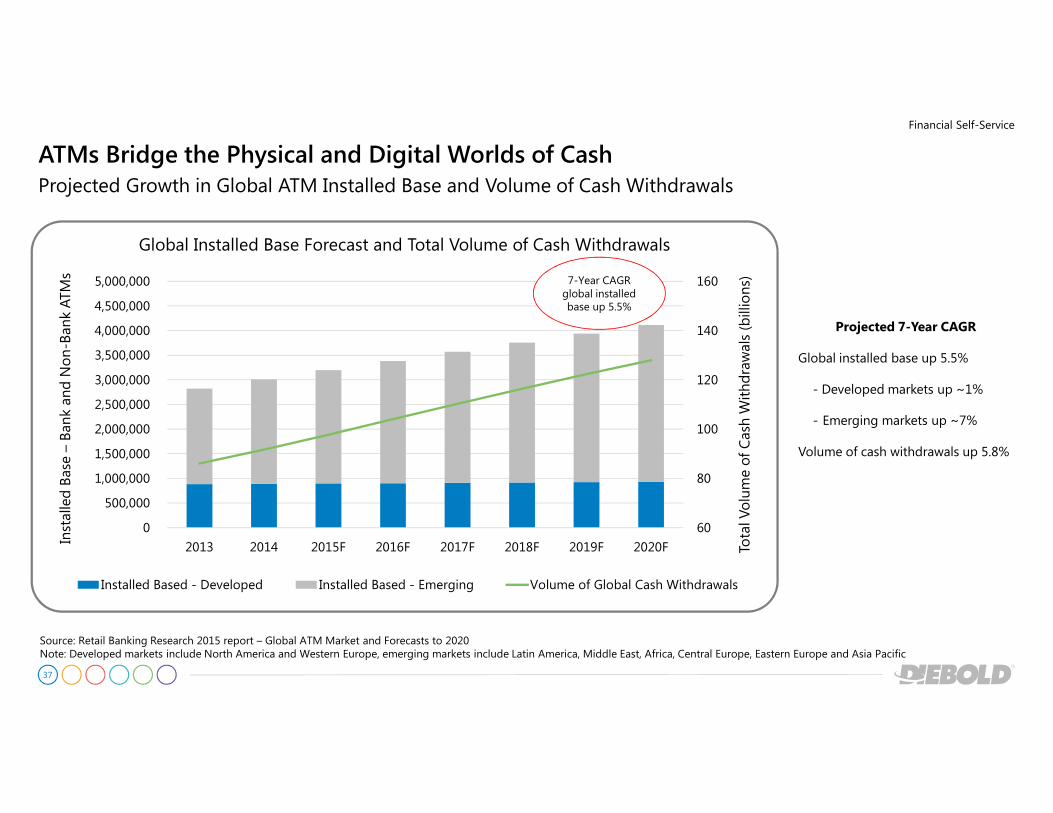
Financial Self-Service
ATMs Bridge the Physical and Digital Worlds of CashProjected Growth in Global ATM Installed Base and Volume of Cash Withdrawals
Source: Retail Banking Research 2015 report – Global ATM Market and Forecasts to 2020Note: Developed markets include North America and Western Europe, emerging markets include Latin America, Middle East, Africa, Central Europe, Eastern Europe and Asia Pacific
60
80
100
120
140
160
0
500,000
1,000,000
1,500,000
2,000,000
2,500,000
3,000,000
3,500,000
4,000,000
4,500,000
5,000,000
2013 2014 2015F 2016F 2017F 2018F 2019F 2020F Total V
olume of Cash W
ithdrawals (billions)
Installed Base –Ban
k an
d N
on-B
ank ATM
s
Global Installed Base Forecast and Total Volume of Cash Withdrawals
Installed Based - Developed Installed Based - Emerging Volume of Global Cash Withdrawals
7-Year CAGR global installed base up 5.5%
Projected 7-Year CAGR
Global installed base up 5.5%
- Developed markets up ~1%
- Emerging markets up ~7%
Volume of cash withdrawals up 5.8%

Security
39
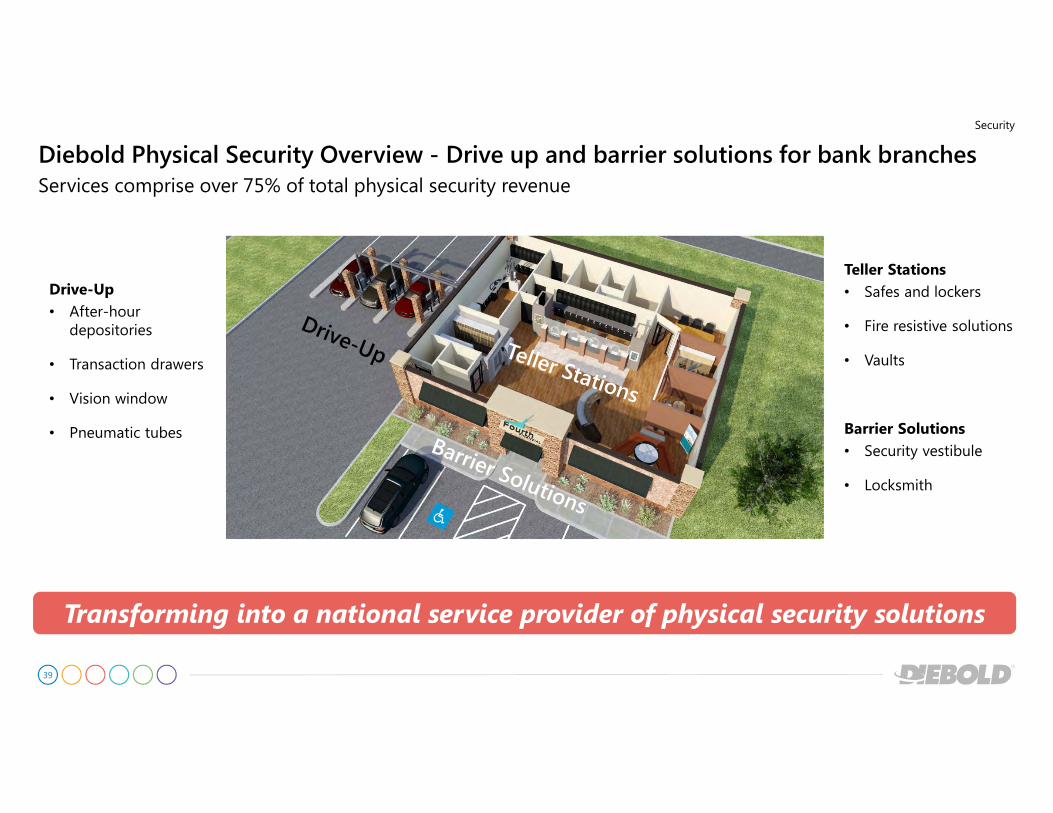
Security
Diebold Physical Security Overview - Drive up and barrier solutions for bank branchesServices comprise over 75% of total physical security revenue
Drive-Up
• After-hour depositories
• Transaction drawers
• Vision window
• Pneumatic tubes
Teller Stations
• Safes and lockers
• Fire resistive solutions
• Vaults
Barrier Solutions
• Security vestibule
• Locksmith
Transforming into a national service provider of physical security solutions
40
Security
Diebold Completes Sale of North America Electronic Security Business to Securitas AB
− Divestiture accelerates Diebold's transformation, enhancing focus on opportunities in dynamic self-service industry
− Securitas agreed to acquire the business for a purchase price of approximately $350 million, 10 percent of which is contingent on the successful transfer of certain customer relationships to Securitas.
− Management expects full payment of $35 million in the first quarter now that all contingencies have been achieved
− Signed a strategic business alliance
− Securitas to serve as Diebold's preferred electronic security provider in North America, combining expertise and facilitating a smooth transition for Diebold customers
− Diebold will serve as Securitas’ preferred provider of ATM-related solutions and services
Net proceeds from sale will support funding of the pending Wincor Nixdorf business combination
2015 Financial Recap
42
Full Year 2015 Key Takeaways
2015 Financial Recap
Re-shaping the Portfolio• Launched Next Gen – most modern family of self-service solutions
• Established leadership in multi vendor software with Phoenix• Divested North America electronic security business to Securitas AB
• Formed new joint venture for China market with Inspur• Business combination agreement with Wincor Nixdorf
Responding to Difficult Market Conditions in Brazil and China
Financial Results (non-GAAP)
• Increased our mix of high value services and software
– Increased services revenue 4% in constant currency and service gross margin by 120 bps
• Free cash flow performance was disappointing
– Committed to recovering in 2016
43
2015 Financial Results (non-GAAP)
Revenue down 3% in constant currency, excluding Brazil other total revenue increased 3%
� Financial self-service +4% (service revenue +4%, product revenue +3%)
� Security down 4% (physical security down 3%)
� Brazil other decreased approximately $207 million, or $145 million in constant currency
Total gross margin up 70 basis points to 27.1%
� Service gross margin up 120 basis points to 33.3%
� Product gross margin down 150 basis points to 18.7%
Operating expense down $34 million year-over-year as a result of cost actions, foreign currency and lower level of reinvestment
Non-GAAP EPS including discontinued operations of $1.83
Year-over-year comparisons
2015 Financial Recap
44
* See reconciliation of GAAP to non-GAAP measures at the end of this presentation
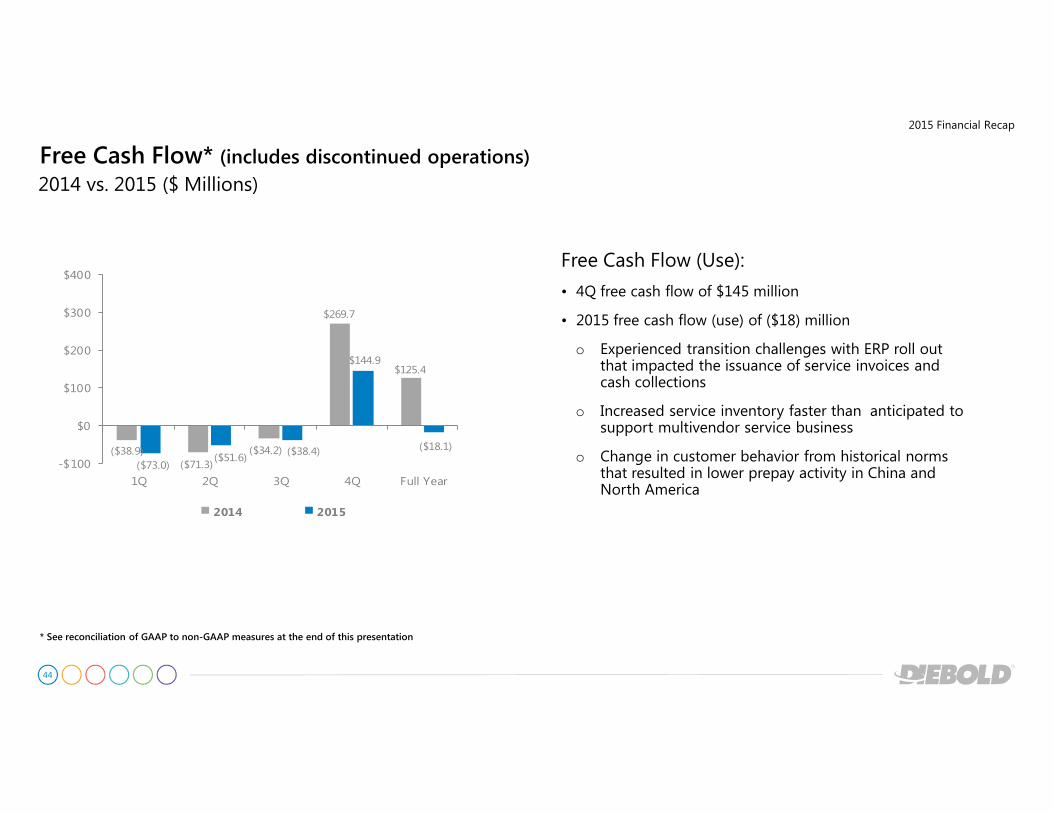
Free Cash Flow (Use):
• 4Q free cash flow of $145 million
• 2015 free cash flow (use) of ($18) million
o Experienced transition challenges with ERP roll out that impacted the issuance of service invoices and cash collections
o Increased service inventory faster than anticipated to support multivendor service business
o Change in customer behavior from historical norms that resulted in lower prepay activity in China and North America
($38.9)($71.3)
($34.2)
$269.7
$125.4
($73.0)($51.6)
($38.4)
$144.9
($18.1)
-$100
$0
$100
$200
$300
$400
1Q 2Q 3Q 4Q Full Year
2014 2015
Free Cash Flow* (includes discontinued operations)2014 vs. 2015 ($ Millions)
2015 Financial Recap
45
2016 Outlook*
2015 Financial Recap
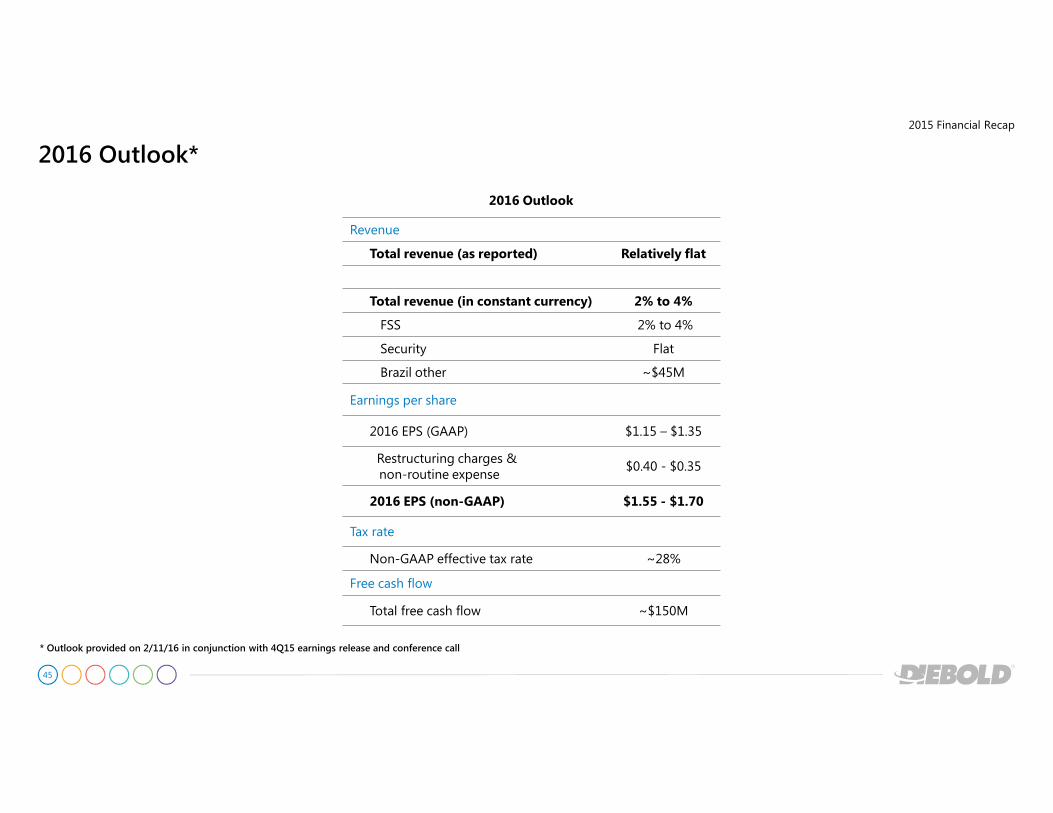
2016 Outlook
Revenue
Total revenue (as reported) Relatively flat
Total revenue (in constant currency) 2% to 4%
FSS 2% to 4%
Security Flat
Brazil other ~$45M
Earnings per share
2016 EPS (GAAP) $1.15 – $1.35
Restructuring charges & non-routine expense
$0.40 - $0.35
2016 EPS (non-GAAP) $1.55 - $1.70
Tax rate
Non-GAAP effective tax rate ~28%
Free cash flow
Total free cash flow ~$150M
* Outlook provided on 2/11/16 in conjunction with 4Q15 earnings release and conference call
46
Note: 1) The company's 2016 outlook excludes the recently divested North America electronic security business, assumes the successful completion of the planned China joint venture and does not include any effect from the pending business combination with Wincor Nixdorf.2) As of February 11, 2016, the company expects full-year 2016 revenue to be relatively flat on an as-reported basis, or up 2% to 4% in constant currency, with earnings per share of approximately $1.55 to $1.70 on a non-GAAP basis. The company expects a non-GAAP effective tax rate of approximately 28% for the full year. Restructuring charges and non-routine expense include M&A and legal fees.
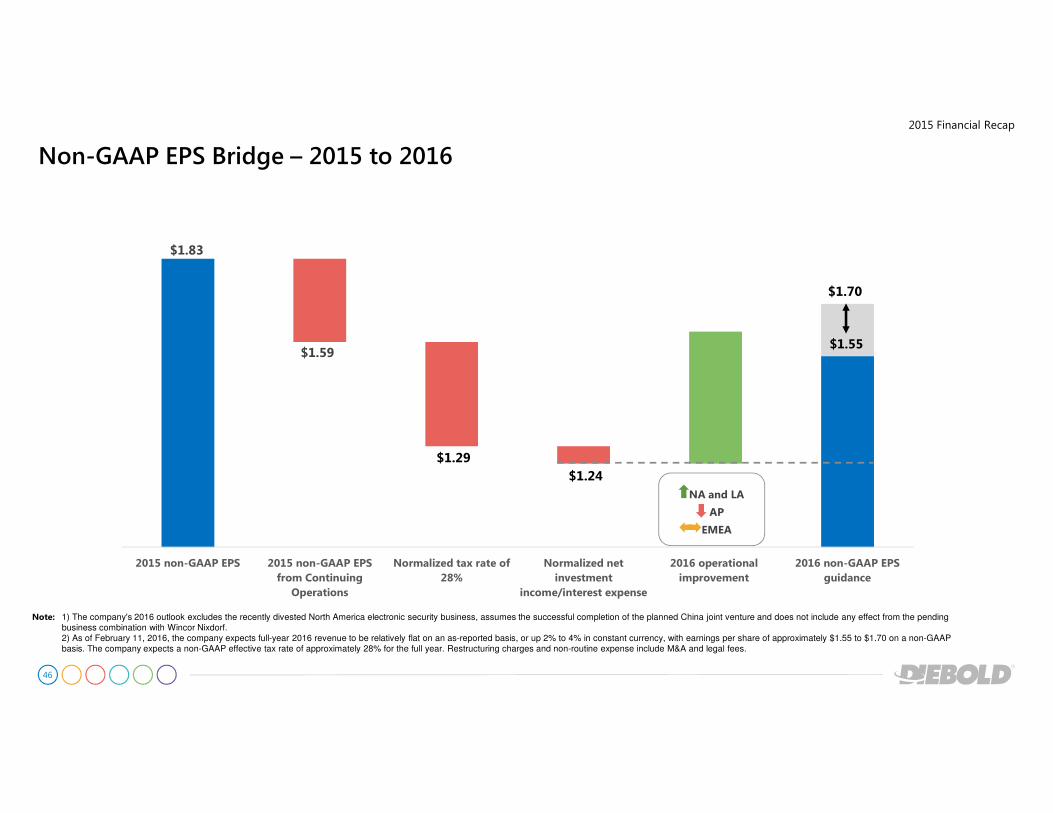
$1.83
$1.59$1.55
$1.00
$1.25
$1.50
$1.75
$2.00
2015 non-GAAP EPS 2015 non-GAAP EPS
from Continuing
Operations
Normalized tax rate of
28%
Normalized net
investment
income/interest expense
2016 operational
improvement
2016 non-GAAP EPS
guidance
$1.70
$1.29
$1.24
NA and LA
AP
EMEA
Non-GAAP EPS Bridge – 2015 to 2016
2015 Financial Recap

Appendix
48
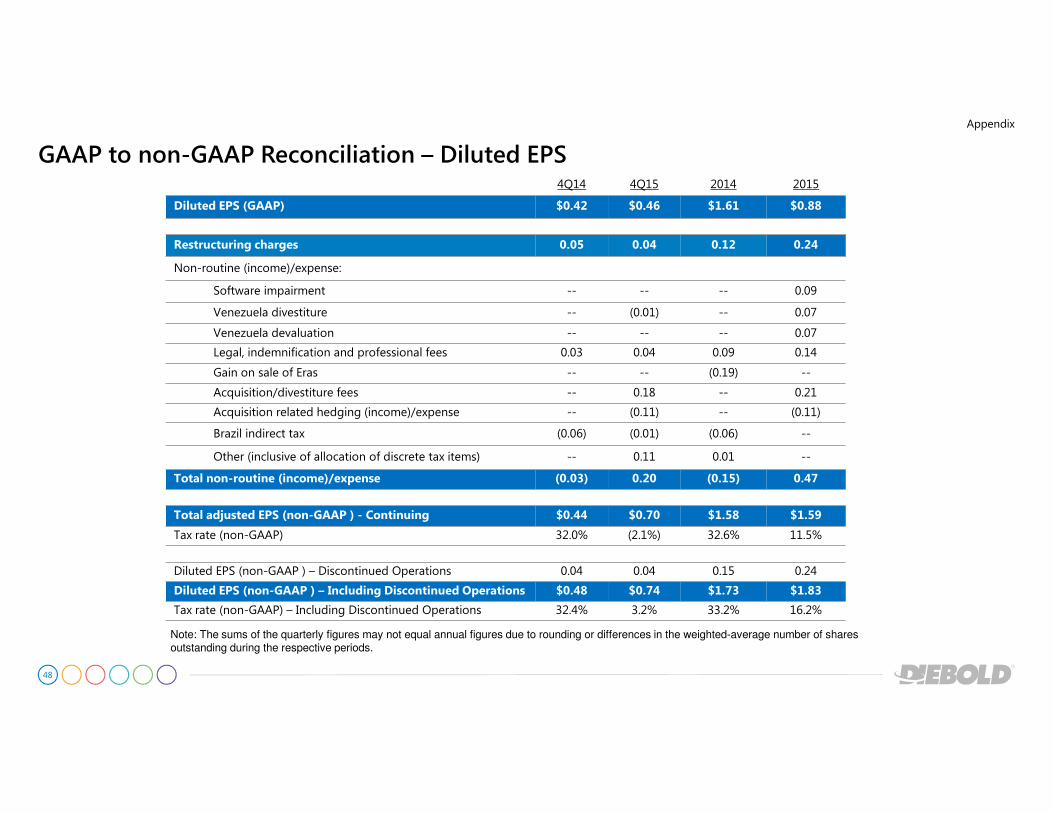
GAAP to non-GAAP Reconciliation – Diluted EPS
Note: The sums of the quarterly figures may not equal annual figures due to rounding or differences in the weighted-average number of shares outstanding during the respective periods.
Appendix
4Q14 4Q15 2014 2015
Diluted EPS (GAAP) $0.42 $0.46 $1.61 $0.88
Restructuring charges 0.05 0.04 0.12 0.24
Non-routine (income)/expense:
Software impairment -- -- -- 0.09
Venezuela divestiture -- (0.01) -- 0.07
Venezuela devaluation -- -- -- 0.07
Legal, indemnification and professional fees 0.03 0.04 0.09 0.14
Gain on sale of Eras -- -- (0.19) --
Acquisition/divestiture fees -- 0.18 -- 0.21
Acquisition related hedging (income)/expense -- (0.11) -- (0.11)
Brazil indirect tax (0.06) (0.01) (0.06) --
Other (inclusive of allocation of discrete tax items) -- 0.11 0.01 --
Total non-routine (income)/expense (0.03) 0.20 (0.15) 0.47
Total adjusted EPS (non-GAAP ) - Continuing $0.44 $0.70 $1.58 $1.59
Tax rate (non-GAAP) 32.0% (2.1%) 32.6% 11.5%
Diluted EPS (non-GAAP ) – Discontinued Operations 0.04 0.04 0.15 0.24
Diluted EPS (non-GAAP ) – Including Discontinued Operations $0.48 $0.74 $1.73 $1.83
Tax rate (non-GAAP) – Including Discontinued Operations 32.4% 3.2% 33.2% 16.2%
49
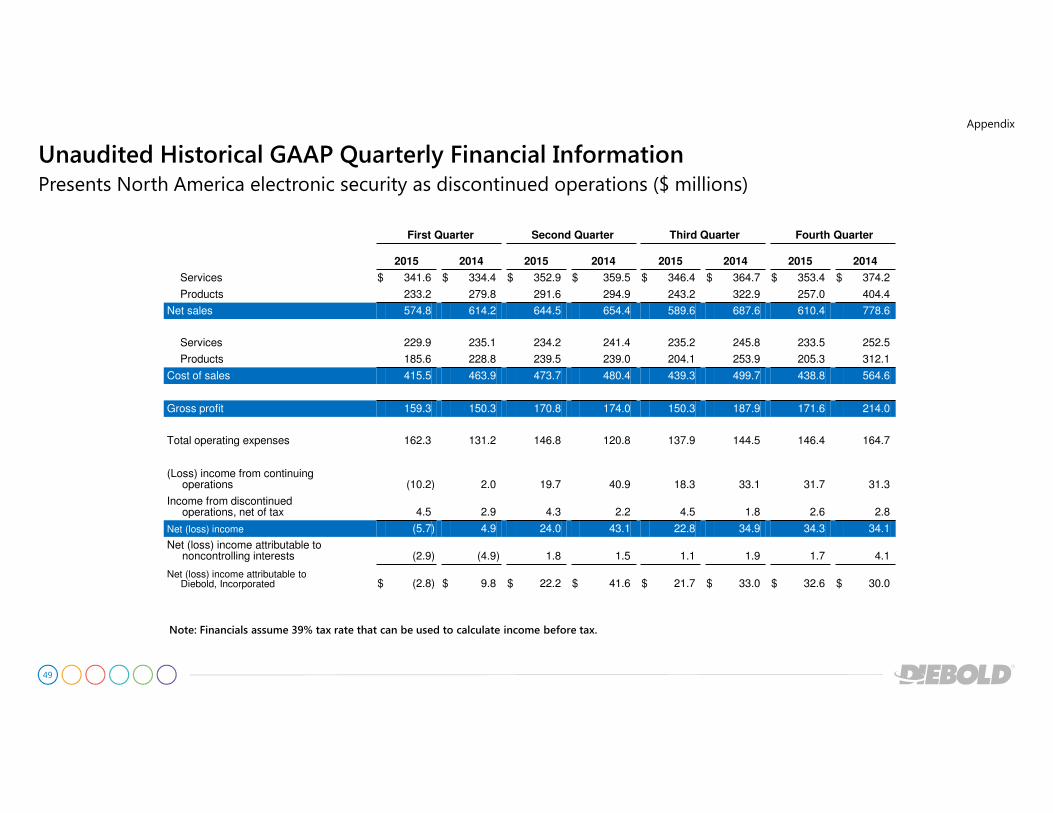
Unaudited Historical GAAP Quarterly Financial Information
Appendix
Presents North America electronic security as discontinued operations ($ millions)
First Quarter Second Quarter Third Quarter Fourth Quarter
2015 2014 2015 2014 2015 2014 2015 2014
Services $ 341.6 $ 334.4 $ 352.9 $ 359.5 $ 346.4 $ 364.7 $ 353.4 $ 374.2
Products 233.2 279.8 291.6 294.9 243.2 322.9 257.0 404.4
Net sales 574.8 614.2 644.5 654.4 589.6 687.6 610.4 778.6
Services 229.9 235.1 234.2 241.4 235.2 245.8 233.5 252.5
Products 185.6 228.8 239.5 239.0 204.1 253.9 205.3 312.1
Cost of sales 415.5 463.9 473.7 480.4 439.3 499.7 438.8 564.6
Gross profit 159.3 150.3 170.8 174.0 150.3 187.9 171.6 214.0
Total operating expenses 162.3 131.2 146.8 120.8 137.9 144.5 146.4 164.7
(Loss) income from continuing operations (10.2) 2.0 19.7 40.9 18.3 33.1 31.7 31.3
Income from discontinued operations, net of tax 4.5 2.9 4.3 2.2 4.5 1.8 2.6 2.8
Net (loss) income (5.7) 4.9 24.0 43.1 22.8 34.9 34.3 34.1
Net (loss) income attributable to noncontrolling interests (2.9) (4.9) 1.8 1.5 1.1 1.9 1.7 4.1
Net (loss) income attributable to Diebold, Incorporated $ (2.8) $ 9.8 $ 22.2 $ 41.6 $ 21.7 $ 33.0 $ 32.6 $ 30.0
Note: Financials assume 39% tax rate that can be used to calculate income before tax.
50
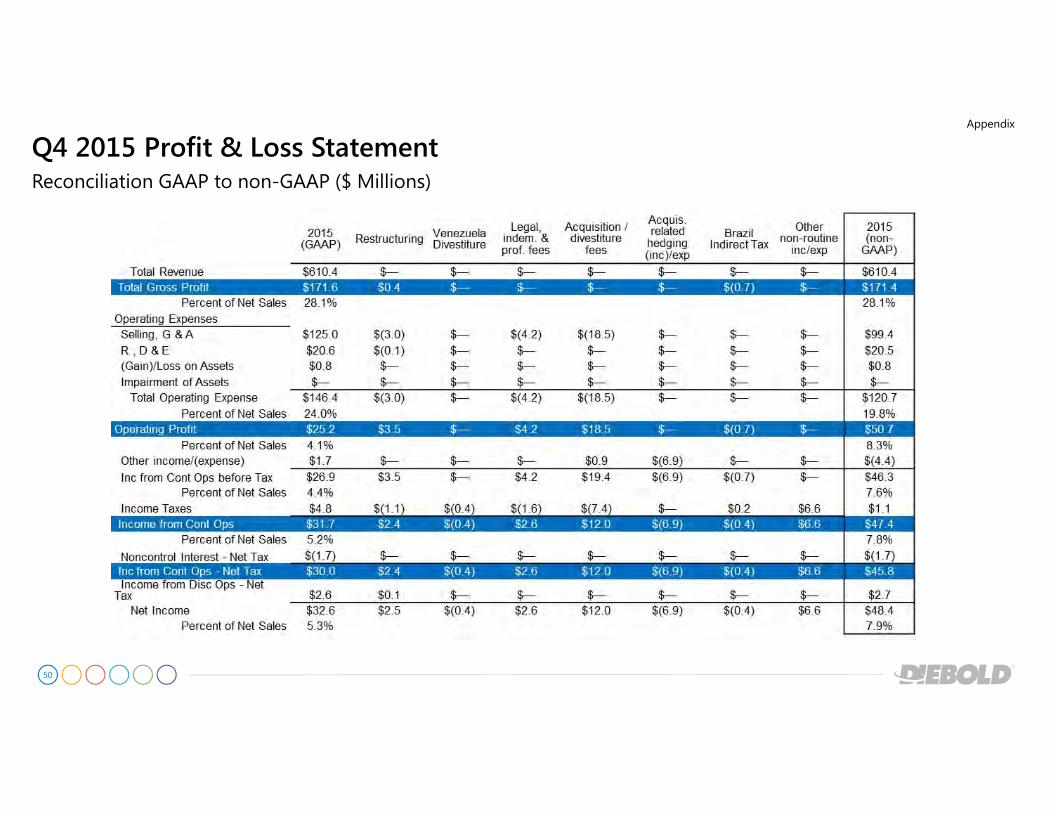
Reconciliation GAAP to non-GAAP ($ Millions)
Q4 2015 Profit & Loss StatementAppendix
51
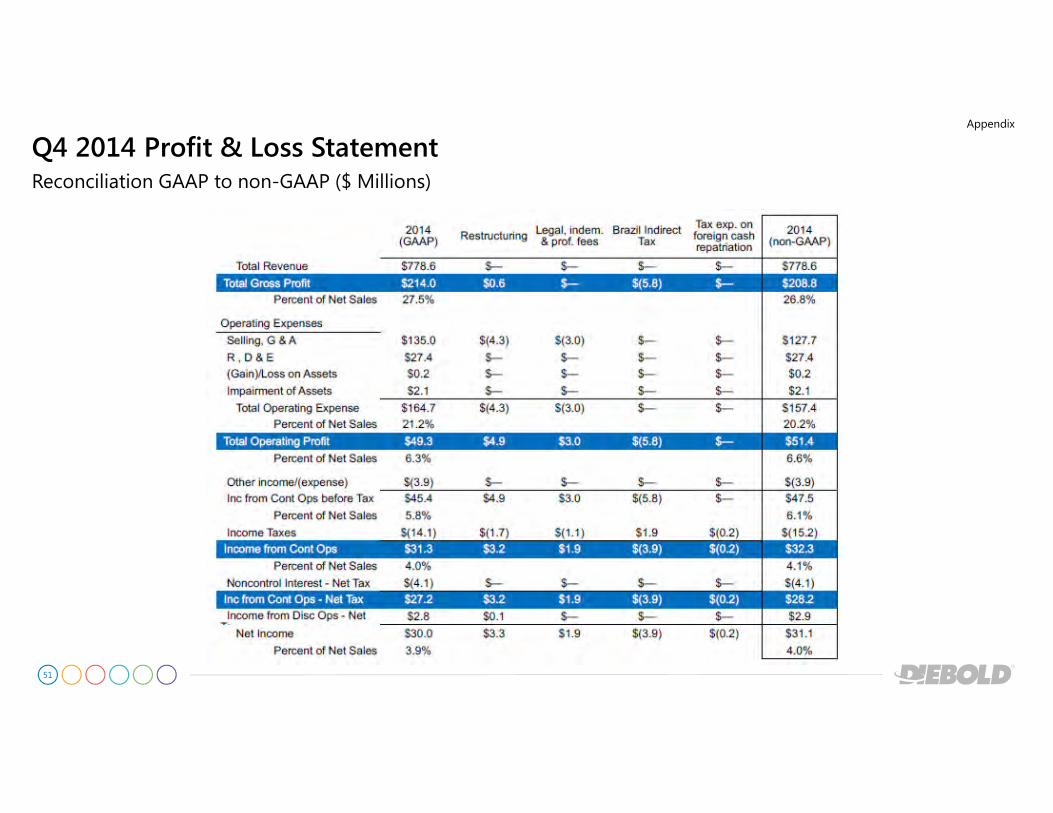
Reconciliation GAAP to non-GAAP ($ Millions)
Q4 2014 Profit & Loss StatementAppendix
52
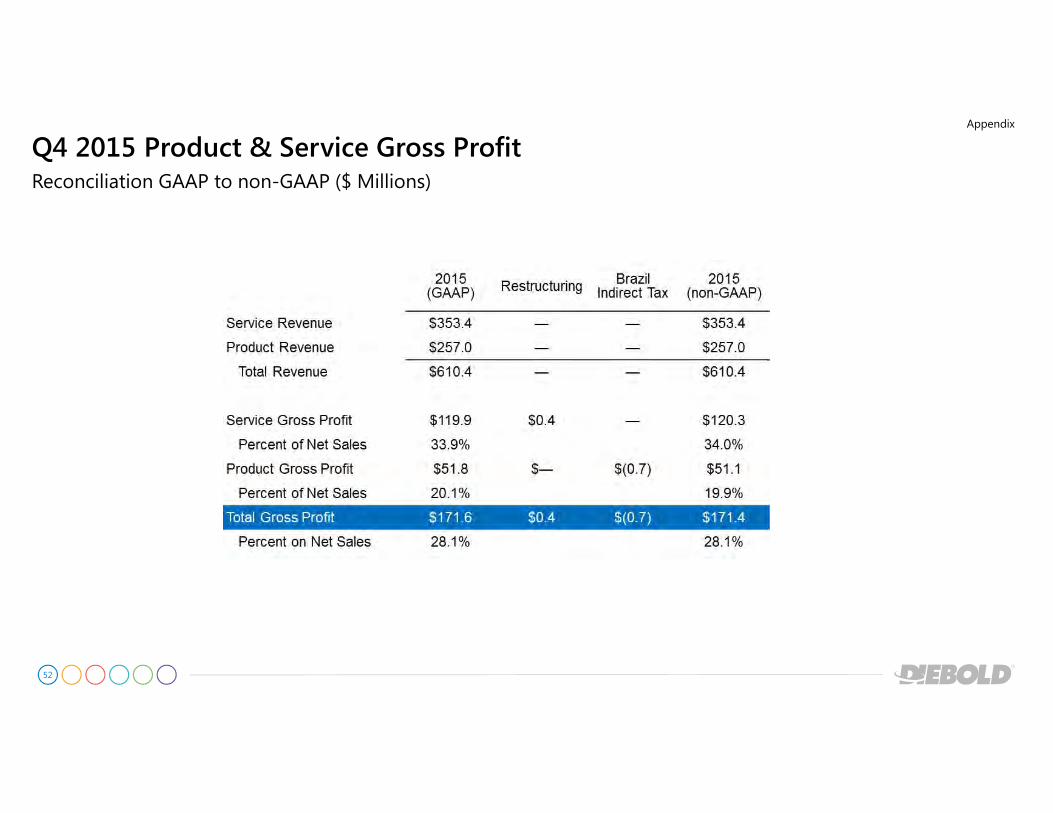
Reconciliation GAAP to non-GAAP ($ Millions)
Q4 2015 Product & Service Gross ProfitAppendix
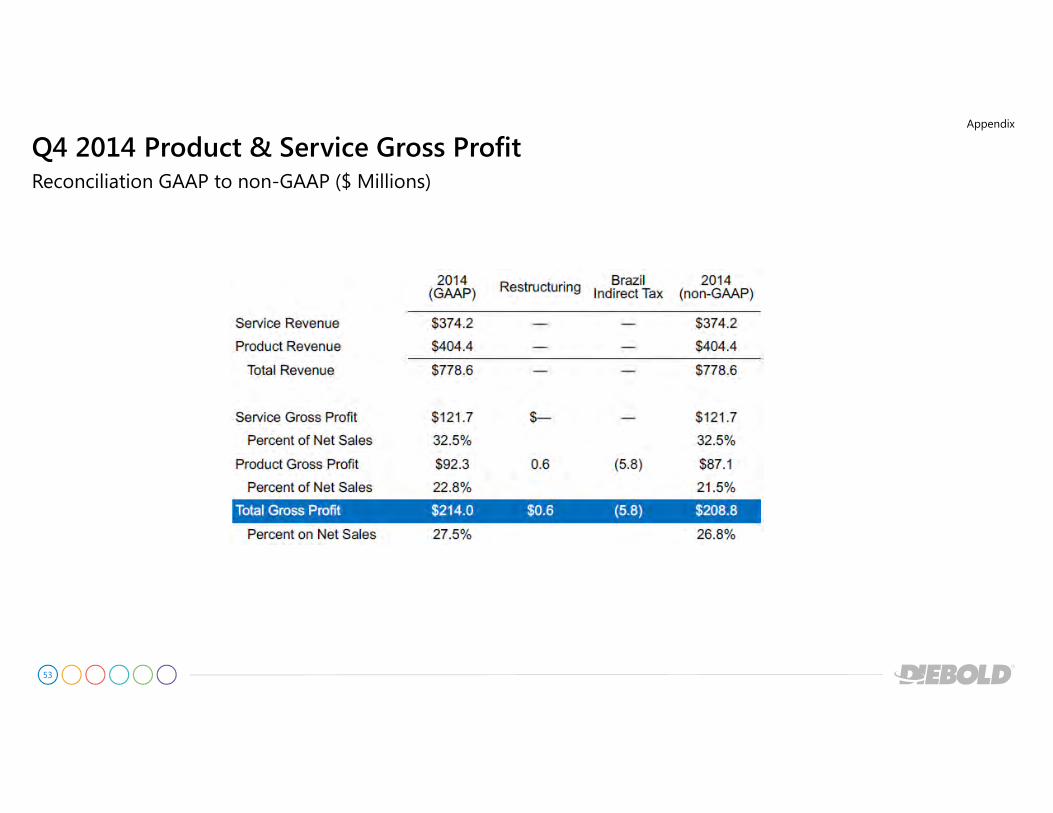
53
Reconciliation GAAP to non-GAAP ($ Millions)
Q4 2014 Product & Service Gross ProfitAppendix
54
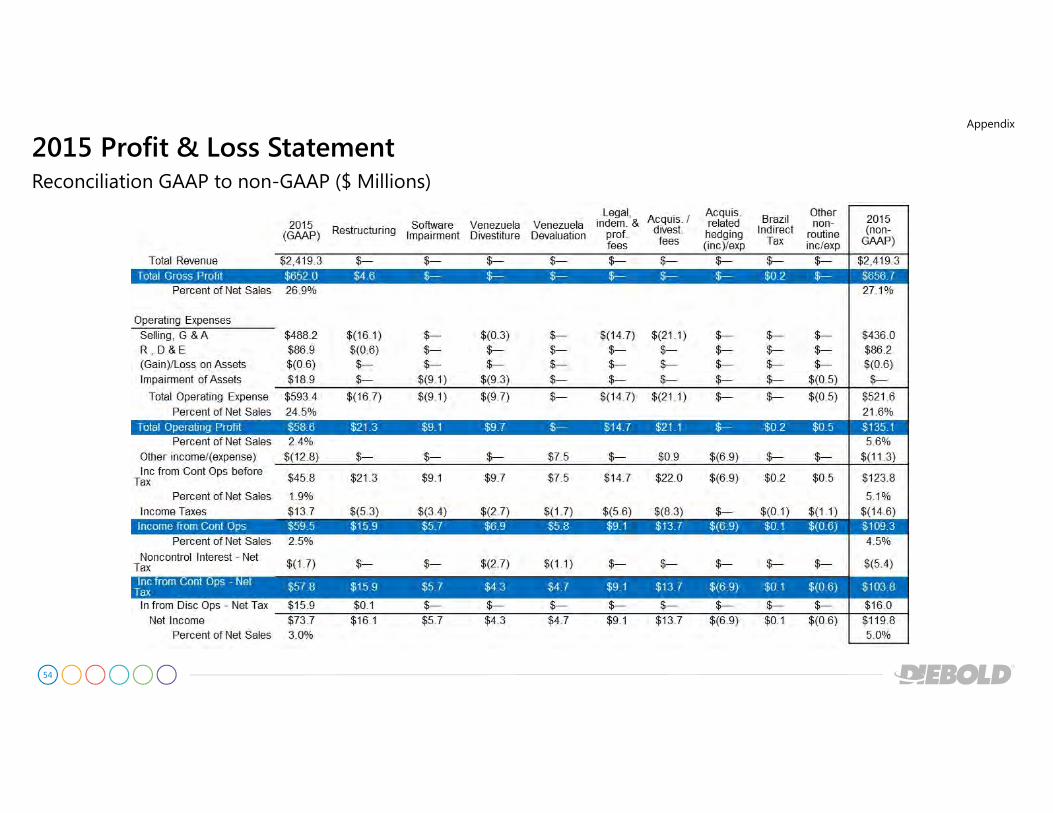
Reconciliation GAAP to non-GAAP ($ Millions)
2015 Profit & Loss StatementAppendix
55
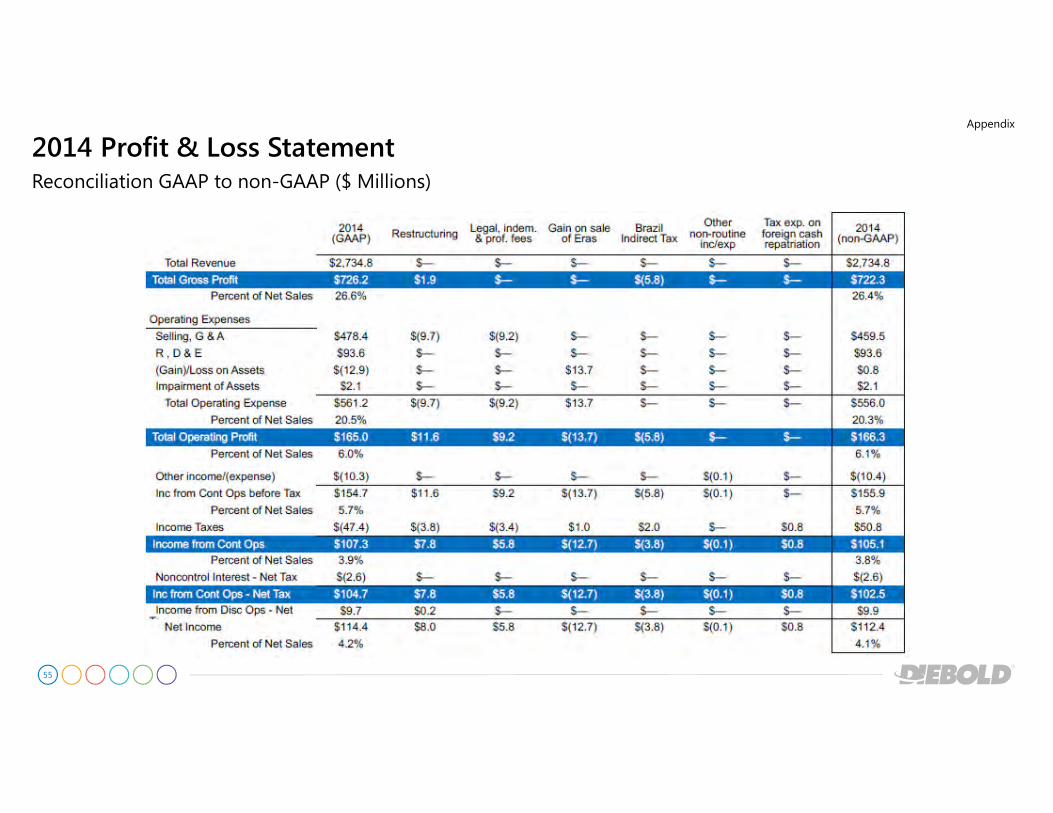
Reconciliation GAAP to non-GAAP ($ Millions)
2014 Profit & Loss StatementAppendix
56
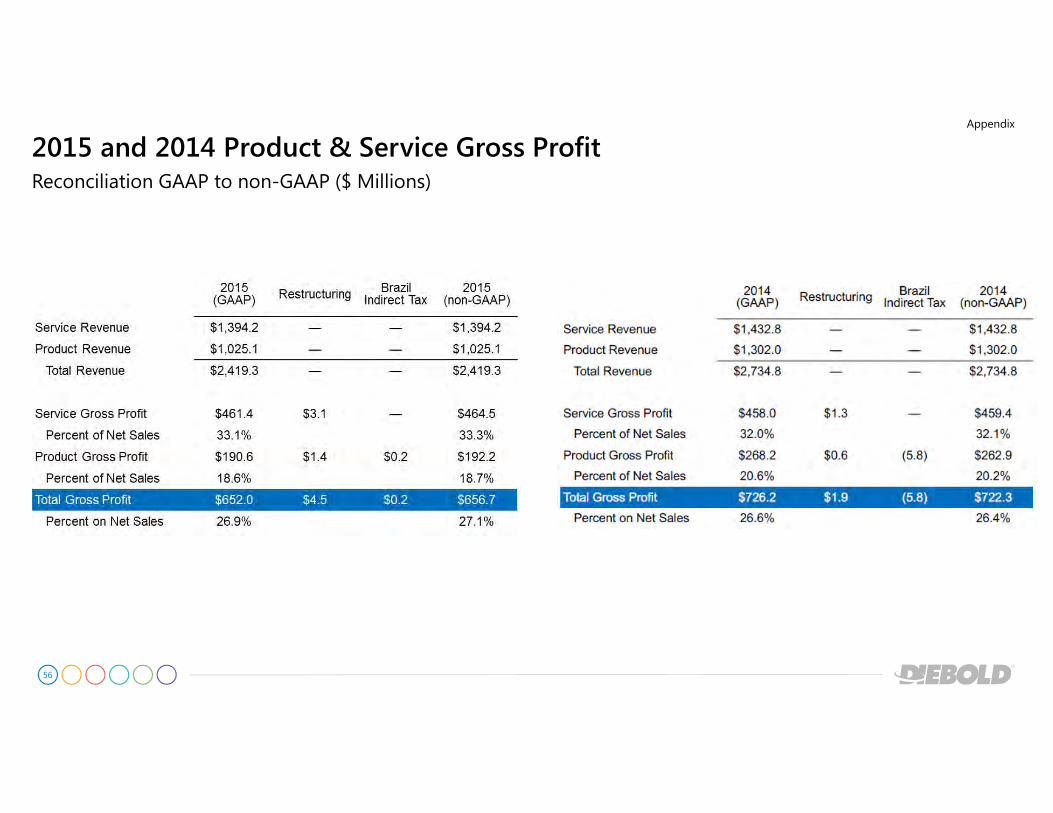
Reconciliation GAAP to non-GAAP ($ Millions)
2015 and 2014 Product & Service Gross ProfitAppendix
57
Reconciliation GAAP to non-GAAP ($ Millions)
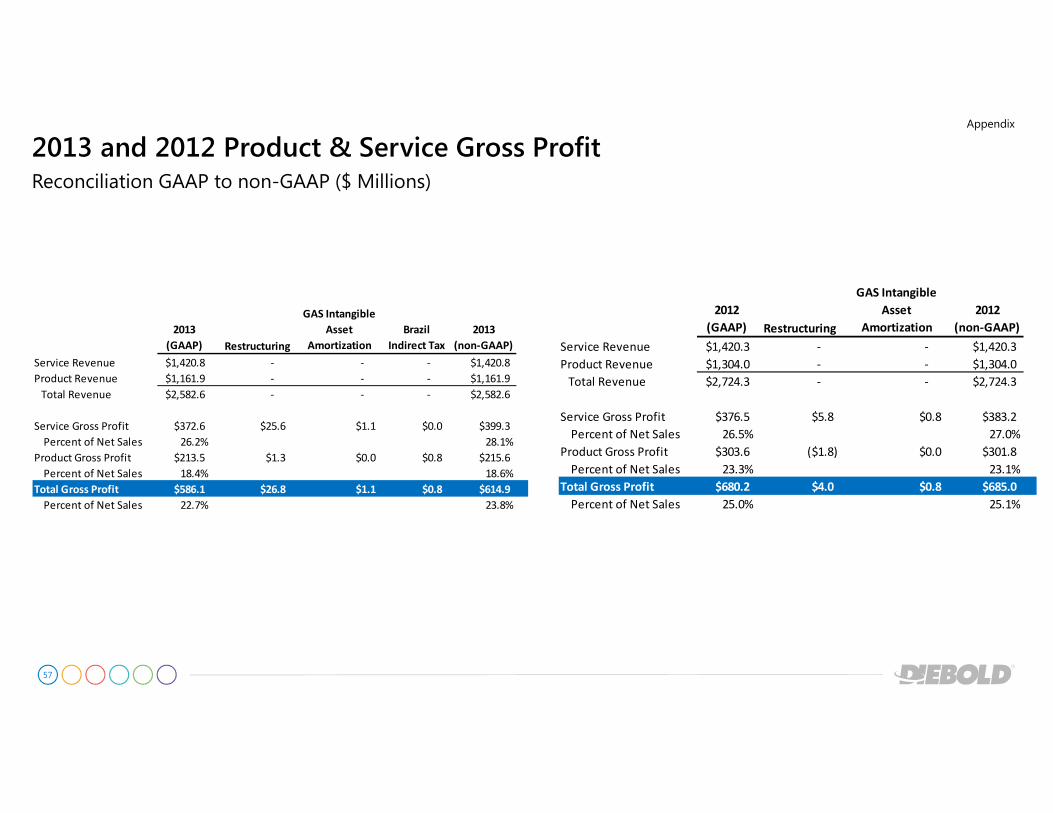
2013 and 2012 Product & Service Gross ProfitAppendix
2013
(GAAP) Restructuring
GAS Intangible
Asset
Amortization
Brazil
Indirect Tax
2013
(non-GAAP)
Service Revenue $1,420.8 - - - $1,420.8
Product Revenue $1,161.9 - - - $1,161.9
Total Revenue $2,582.6 - - - $2,582.6
Service Gross Profit $372.6 $25.6 $1.1 $0.0 $399.3
Percent of Net Sales 26.2% 28.1%
Product Gross Profit $213.5 $1.3 $0.0 $0.8 $215.6
Percent of Net Sales 18.4% 18.6%
Total Gross Profit $586.1 $26.8 $1.1 $0.8 $614.9
Percent of Net Sales 22.7% 23.8%
2012
(GAAP) Restructuring
GAS Intangible
Asset
Amortization
2012
(non-GAAP)
Service Revenue $1,420.3 - - $1,420.3
Product Revenue $1,304.0 - - $1,304.0
Total Revenue $2,724.3 - - $2,724.3
Service Gross Profit $376.5 $5.8 $0.8 $383.2
Percent of Net Sales 26.5% 27.0%
Product Gross Profit $303.6 ($1.8) $0.0 $301.8
Percent of Net Sales 23.3% 23.1%
Total Gross Profit $680.2 $4.0 $0.8 $685.0
Percent of Net Sales 25.0% 25.1%
58
($ Millions)
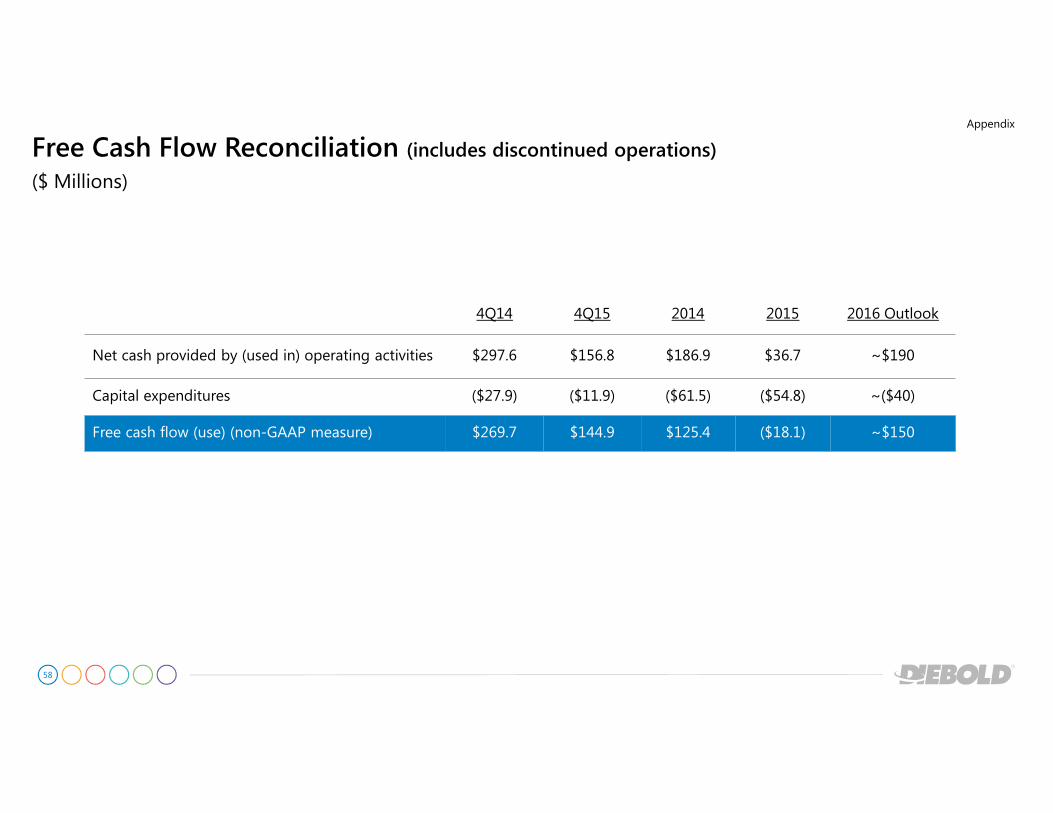
Free Cash Flow Reconciliation (includes discontinued operations)Appendix
4Q14 4Q15 2014 2015 2016 Outlook
Net cash provided by (used in) operating activities $297.6 $156.8 $186.9 $36.7 ~$190
Capital expenditures ($27.9) ($11.9) ($61.5) ($54.8) ~($40)
Free cash flow (use) (non-GAAP measure) $269.7 $144.9 $125.4 ($18.1) ~$150
59
Steve VirostekVice President, Investor Relations
Phone: +1 330-490-6319
E-mail: [email protected]
Chris SikoraManager, Investor Relations
Phone: +1 330-490-6870
E-mail: [email protected]
Investor Relations Contact Information
Appendix