2015 March Investor Presentation
13
INVESTOR PRESENTATION 03.15 1
-
Upload
goldenstarresources -
Category
Investor Relations
-
view
785 -
download
2
Transcript of 2015 March Investor Presentation

I N V E S T O R P R E S E N T A T I O N0 3 . 1 5
1

DISCLAIMER AND OTHER MATTERS SAFE HARBOR: Some statements contained in this presentation are forward-looking statements within the meaning of the Private Securities Litigation Reform Act of 1995 andapplicable Canadian securities laws. Investors are cautioned that forward-looking statements are inherently uncertain and involve risks and uncertainties that could cause actualresults to differ materially. Such statements include comments regarding: transformation of Golden Star to a non-refractory miner with a declining cash cost profile; gradeforecasts, strip ratios and production expectations for 2015, including our cash operating costs and expected operational improvements; life of mine cash operating costs forcombined operations from the start of 2016; the timing for completing refractory mining at Bogoso and placing refractory operations on care and maintenance; estimated capitalexpenditures; the timing for continuing processing at Bogoso; expectations regarding the impact of weather in 2015; expectations regarding production from tailings retreatment;use of the existing Wassa processing plant and Bogoso oxide and sulfide processing plants; matters relating to the PEA for Wassa, including estimated post-tax internal rate ofreturn and net present value of Wassa underground (including assumed discount rates), the timing for first production from Wassa underground, pre-production capitalexpenditures, and the life of mine cash operating costs and sustaining costs at Wassa underground; matters relating to the PEA for Prestea, including estimated post-tax internalrate of return and net present value of Prestea (including assumed discount rates), the timing for first production from Prestea, pre-production capital expenditures, and the life ofmine cash operating costs and sustaining costs at Prestea; cost contraction and margin growth; timing for receiving underground mining permits; timing of feasibility studies atWassa and Prestea; timing for commencing construction at Wassa Underground and commencing development at Prestea; timing for updated mineral reserves and resources;; andour mineral reserve and mineral resource estimates. Factors that could cause actual results to differ materially include timing of and unexpected events at the Bogoso oxide andsulfide processing plants and/or at the Wassa processing plant; variations in ore grade, tonnes mined, crushed or milled; variations in relative amounts of refractory, non-refractoryand transition ores; delay or failure to receive board or government approvals and permits; the availability and cost of electrical power; timing and availability of external financingon acceptable terms; technical, permitting, mining or processing issues, including difficulties in establishing the infrastructure for Wassa Underground; changes in U.S. andCanadian securities markets; and fluctuations in gold price and input costs and general economic conditions. There can be no assurance that future developments affecting theCompany will be those anticipated by management. Please refer to the discussion of these and other factors in our Annual Information Form for the year ended December 31,2013. Additional factors, if applicable, will be included in our Annual Information Form for the year ended December 31, 2014, which will be filed on SEDAR at www.sedar.com.The forecasts contained in this presentation constitute management's current estimates, as of the date of this presentation, with respect to the matters covered thereby. We expectthat these estimates will change as new information is received and that actual results will vary from these estimates, possibly by material amounts. While we may elect to updatethese estimates at any time, we do not undertake to update any estimate at any particular time or in response to any particular event. Investors and others should not assume thatany forecasts in this presentation represent management's estimate as of any date other than the date of this presentation.
NON-GAAP FINANCIAL MEASURES: In this presentation, we use the terms "cash operating cost per ounce" or “CoC per ounce” and "all-in sustaining cost per ounce“ or “AISCper ounce”. These terms should be considered as Non-GAAP Financial Measures as defined in applicable Canadian and United States securities laws and should not be considered inisolation or as a substitute for measures of performance prepared in accordance with GAAP. "Cash operating cost per ounce" for a period is equal to the cost of sales excludingdepreciation and amortization for the period less royalties and production taxes, minus the cash component of metals inventory net realizable value adjustments and severancecharges divided by the number of ounces of gold sold during the period. "All-in sustaining costs per ounce" commences with cash operating costs and then adds sustaining capitalexpenditures, corporate general and administrative costs, mine site exploratory drilling and greenfield evaluation costs and environmental rehabilitation costs. This measure seeksto represent the total costs of producing gold from operations. These measures are not representative of all cash expenditures as they do not include income tax payments orinterest costs. These measures are not necessarily indicative of operating profit or cash flow from operations as would be determined under International Financial ReportingStandards. Changes in numerous factors including, but not limited to, mining rates, milling rates, gold grade, gold recovery, and the costs of labor, consumables and mine sitegeneral and administrative activities can cause these measures to increase or decrease. We believe that these measures are the same or similar to the measures of other goldmining companies, but may not be comparable to similarly titled measures in every instance. In order to indicate to stakeholders the company's earnings excluding the non-cash(gain)/loss on the fair value of debentures, non-cash impairment charges and severance charges, the Company calculates adjusted net loss attributable to Golden Starshareholders" and "adjusted net loss per share attributable to Golden Star shareholders" to supplement the condensed interim consolidated financial statements.
INFORMATION: The information contained in this presentation has been obtained by Golden Star from its own records and from other sources deemed reliable, however norepresentation or warranty is made as to its accuracy or completeness. The technical information relating to Golden Star's material properties disclosed herein is based upontechnical reports prepared and filed pursuant to National Instrument 43-101 Standards for Disclosure of Mineral Properties ("NI 43-101") and other publicly available informationregarding the Company, including the following: (i) “NI 43-101 Technical Report on a Preliminary Economic Assessment of the Wassa Open Pit Mine and Underground Project inGhana” effective October 30, 2014 prepared by SRK Consulting (UK) Limited; (ii) “NI 43-101 Technical Report on Resources and Reserves, Golden Star Resources Ltd., BogosoPrestea Gold Mine, Ghana” effective December 31, 2013 prepared by SRK Consulting (UK) Limited, and (iii) “NI 43-101 Technical Report on Preliminary Economic Assessment ofShrinkage Mining of the West Reef Resource, Prestea Underground Mine, Ghana”. Additional information is included in Golden Star's Annual Information Form for the year endedDecember 31, 2013 which is filed on SEDAR. Mineral Reserves were prepared under the supervision of Dr. Martin Raffield, Senior Vice President Technical Services for theCompany. Dr. Raffield is a "Qualified Person" as defined by Canada's National Instrument 43-101. The Qualified Person reviewing and validating the estimation of the MineralResources is S. Mitchel Wasel, Golden Star Resources Vice President of Exploration.
CURRENCY: All monetary amounts refer to United States dollars unless otherwise indicated.
March 20152

— 15 year history in Ghana
— Located on Ashanti gold belt close to major gold producers
— Three mines – Wassa, Bogoso and Prestea
— Total processing capacity of 6.9 mtpa
— 2014 production of 260,000 oz, 2015E production of 265,000 oz
— Listed on the NYSE, TSX and in Ghana
INTRODUCTION TO GOLDEN STAR
3 March 2015
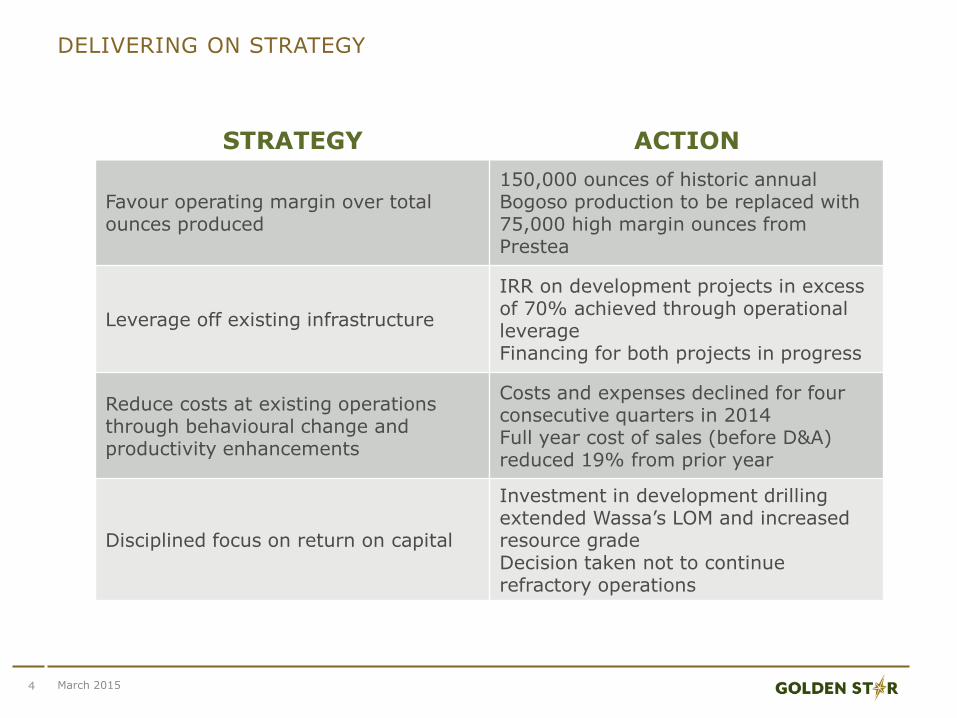
DELIVERING ON STRATEGY
4
STRATEGY ACTION
Favour operating margin over total ounces produced
150,000 ounces of historic annual Bogoso production to be replaced with 75,000 high margin ounces from Prestea
Leverage off existing infrastructure
IRR on development projects in excess of 70% achieved through operationalleverageFinancing for both projects in progress
Reduce costs at existing operationsthrough behavioural change and productivity enhancements
Costs and expenses declined for four consecutive quarters in 2014Full year cost of sales (before D&A) reduced 19% from prior year
Disciplined focus on return on capital
Investment in development drilling extended Wassa’s LOM and increased resource gradeDecision taken not to continue refractory operations
March 2015

Q4 2014 FINANCIALS MARK RETURN TO PROFITABILITY
5
REVENUE MARKEDLY HIGHER
Revenue for Q4 2014 increased 11% , with 18% more ounces at 6% lower realised price thanQ3 2014
COSTS CONTINUE TO REDUCE
Total mine operating expenses were flat quarter over quarter at $71 M
COC per ounce1 reduced 13% from prior quarter to $919
IMPROVED PROFITABILITY
Adjusted net income to shareholders of $8.8 M
1. See note on slide 2 regarding Non-GAAP Financial Measures
March 2015

— Cash operating costs per ounce1 declined consistently through 2014
— Q4 2014 cost performance bodes well for 2015 guidance
— FY 2014 cash operating costs per ounce higher than prior year, but AISC 6% lower
— LOM cash costs expected to reduce to below $700/oz from 20163
CASH OPERATING COSTS PER OUNCE REDUCING
1. See note on slide 2 regarding Non-GAAP Financial Measures2. AISC is All-in Sustaining Costs. See note on slide 2 regarding Non-GAAP Financial Measures.3. LOM is from 2016 onwards and assumes Wassa construction and Prestea development proceed as per respective PEA reports.
6 March 2015
$1,222
$1,059

GOLDEN STAR IN 2015
7 March 2015
— Mining in single large Wassa open pit
— 2015E production of 113k oz. at cash operating costs per oz. of $850–990
— Grade improvement and lower strip planned for 2015
— Two refractory pits mined out in Q3 2015, tailings retreatment continue
— 2015E production of 135k oz. from hard rock and 17k oz. from tailings
— Combined cash operating cost per oz. of $870 – 960
— Weather not expected to impact mining in 2015
— Rehabilitation on existing infrastructure to take place in 2015
— More than 16 surface and six underground shafts
— Dewatering will continue in advance of mine development

BROWNFIELD PROJECTS LEVERAGE OFF EXISTING INFRASTRUCTURE
PROJECTWASSA
UNDERGROUND PRESTEA COMBINED
MININGUnderground mining
below existing open pitUnderground mining inwell established mine
Low risk development at established mines
PROCESSINGExisting Wassa
processing plantModified Bogoso processing plant
Operational leverage achieved
SUPPORT INFRASTRUCTURE
Fully in place 15km haul road improvements
Minimal new infrastructure required
CAPEX $41M $40M Low capex projects
FIRST GOLD H1 2016 H2 2016 Near term production
8
*Assumption of a gold price of $1,200 per ounce used in these calculations. For further critical assumptions used in these assessments, please refer to the reports titled “NI 43-101 Technical Report on a Preliminary Economic Assessment of the Wassa Open Pit Mine and Underground Project in Ghana” and “NI 43-101 Technical Report on Preliminary Economic Assessment of Shrinkage Mining of the West Reef Resource, Prestea Underground Mine, Ghana” both of which are filed on SEDAR.
March 2015
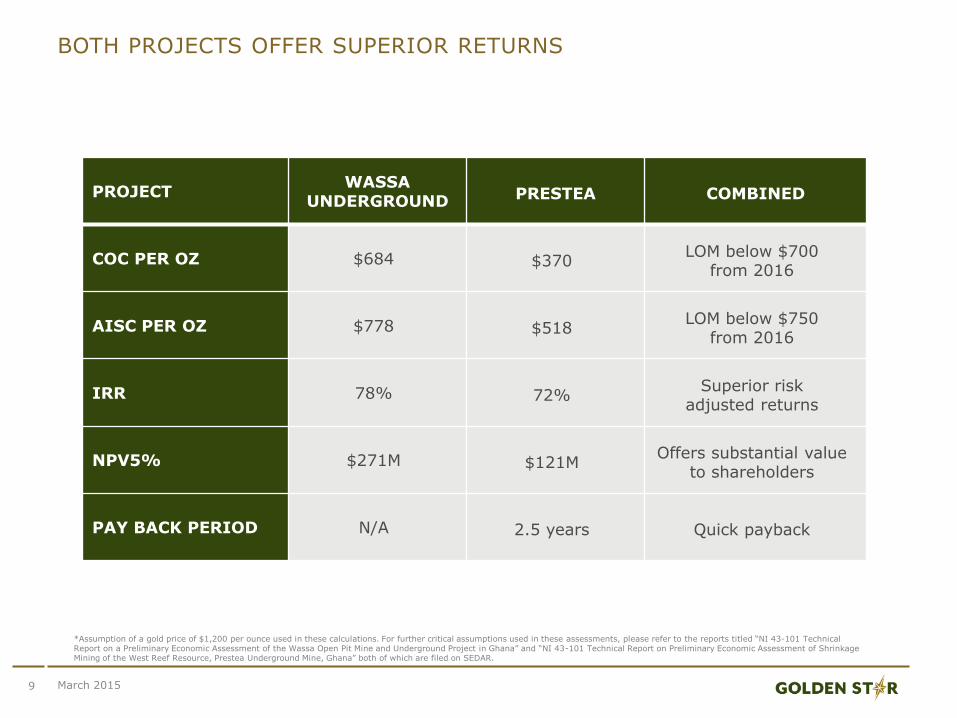
BOTH PROJECTS OFFER SUPERIOR RETURNS
9
PROJECTWASSA
UNDERGROUND PRESTEA COMBINED
COC PER OZ $684 $370LOM below $700
from 2016
AISC PER OZ $778 $518LOM below $750
from 2016
IRR 78% 72%Superior risk
adjusted returns
NPV5% $271M $121MOffers substantial value
to shareholders
PAY BACK PERIOD N/A 2.5 years Quick payback
*Assumption of a gold price of $1,200 per ounce used in these calculations. For further critical assumptions used in these assessments, please refer to the reports titled “NI 43-101 Technical Report on a Preliminary Economic Assessment of the Wassa Open Pit Mine and Underground Project in Ghana” and “NI 43-101 Technical Report on Preliminary Economic Assessment of Shrinkage Mining of the West Reef Resource, Prestea Underground Mine, Ghana” both of which are filed on SEDAR.
March 2015

WASSA PROJECT – POTENTIAL FOR SIGNIFICANTLY LONGER MINE LIFE
10
BSDD342 10.7m @ 30.1g/t
BSDD34816.9m @ 4.7g/t
BSDD3356.3m @ 8.5g/t
BSDD3339.7m @ 6.5g/t
BSDD34754.1m @
4.2g/t
BSDD331 17.3m @
3.9g/t
BSDD33013.9m @ 15.6g/t
BSDD328 8.6m @ 3.2g/t
BSDD34478.9m @ 5.3g/t
BSDD3477.5m @ 15.7g/t
BSDD290BD1 39.4m @ 9.0g/t
BSDD0337.6m @ 14.7g/t
BSDD18122.1m @ 29.8g/t
19800 N
BSDD31560.2m @ 3.4 g/t

March 201511
PRESTEA WEST REEF LOCATION AND SHAFT INFRASTRUCTURE
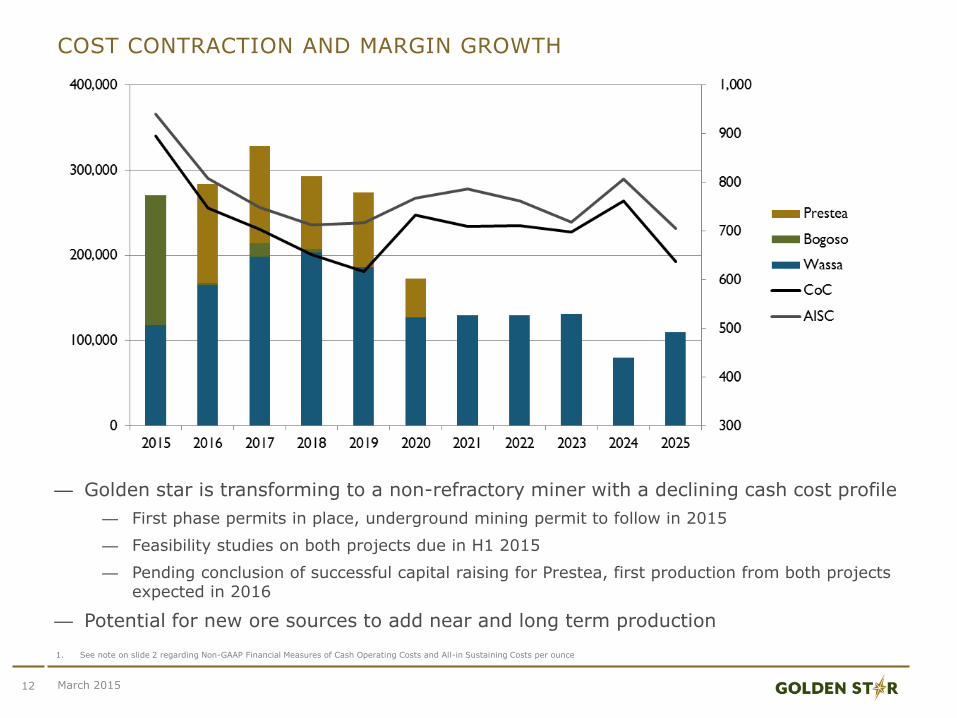
— Golden star is transforming to a non-refractory miner with a declining cash cost profile
— First phase permits in place, underground mining permit to follow in 2015
— Feasibility studies on both projects due in H1 2015
— Pending conclusion of successful capital raising for Prestea, first production from both projects expected in 2016
— Potential for new ore sources to add near and long term production
COST CONTRACTION AND MARGIN GROWTH
12
1. See note on slide 2 regarding Non-GAAP Financial Measures of Cash Operating Costs and All-in Sustaining Costs per ounce
March 2015

Investment Case
Established gold mining company with
15 years of production history in Ghana
Successfully reduced overall operating
costs over last two years
Development projects to deliver low cost
ounces through 2026
Largest land package on the Ashanti
Gold belt
Low political risk in a stable African
mining jurisdiction
Significant exploration & development
upside development
Offers investors leveraged, un-hedged
exposure to the gold price