AbstractMany of the 1918 Sinn Féin leadership had participated in the Easter Rising. 4 ......
65
1 REPRESENTATION OF THE PEOPLE: FRANCHISE EXTENSION AND THE ‘SINN FÉIN ELECTION’ IN IRELAND, 1918 Abstract Do large franchise extensions bring about dramatic electoral changes? Electoral reforms in 1918 nearly tripled the number of people eligible to vote in Ireland. Following the reforms – the largest franchise extension in UK history – the previously obscure Sinn Féin party secured 73 of Ireland’s 105 seats, an outcome that precipitated a guerrilla war and ultimately independence from the United Kingdom. However, our analysis finds little evidence that the franchise reforms benefited Sinn Féin. New female electors appear less likely to have supported Sinn Féin while new male electors were no more likely to vote for Sinn Féin than the existing electorate. Women also appear less likely to have cast a vote at all. Economic and social factors did matter when it came to voting however, as did public opinion in relation to armed rebellion. These results remind us that dramatic political changes, such as those that took place in Ireland 1918, do not require dramatic changes in political participation. Sinn Féin’s electoral success was more likely driven by a change of heart on behalf of the Irish electorate, rather than a change in its composition.
Transcript of AbstractMany of the 1918 Sinn Féin leadership had participated in the Easter Rising. 4 ......

1
REPRESENTATION OF THE PEOPLE: FRANCHISE EXTENSION AND
THE ‘SINN FÉIN ELECTION’ IN IRELAND, 1918
Abstract
Do large franchise extensions bring about dramatic electoral changes?
Electoral reforms in 1918 nearly tripled the number of people eligible
to vote in Ireland. Following the reforms – the largest franchise
extension in UK history – the previously obscure Sinn Féin party
secured 73 of Ireland’s 105 seats, an outcome that precipitated a
guerrilla war and ultimately independence from the United Kingdom.
However, our analysis finds little evidence that the franchise reforms
benefited Sinn Féin. New female electors appear less likely to have
supported Sinn Féin while new male electors were no more likely to
vote for Sinn Féin than the existing electorate. Women also appear less
likely to have cast a vote at all. Economic and social factors did matter
when it came to voting however, as did public opinion in relation to
armed rebellion. These results remind us that dramatic political
changes, such as those that took place in Ireland 1918, do not require
dramatic changes in political participation. Sinn Féin’s electoral
success was more likely driven by a change of heart on behalf of the
Irish electorate, rather than a change in its composition.

2
Introduction
Do large franchise extensions bring about dramatic electoral changes? In this paper we examine
the relationship between major franchise reform and one of the most important political events
in British and Irish history: the 1918 General Election in Ireland.
In early 1918, towards the end of World War One, the United Kingdom extended its electoral
franchise. All men over the age of 21 and most women over the age of 30 were now entitled to
vote, a right previously reserved for adult male householders. Ireland, at the time still part of
the United Kingdom, saw its electorate grow from under 700,000 to over 1.9 million.
The 1918 Election in Ireland also saw a relatively new party, Sinn Féin, contest a general
election for the first time. Founded in 1905 but operating at a small scale for the first decade of
their existence, by 1918 Sinn Féin were a radical republican, pro-independence party (Sinn
Féin means “Ourselves” in Irish). Its leadership was closely (and openly) aligned with the
armed paramilitary group that would come to be known as the Irish Republican Army (IRA).
The party’s intent was clear: withdrawal from the British Parliament, the establishment of an
Irish Republic, and a promise to use “any and every means available” to do so (Sinn Féin,
1918). Sinn Féin’s revolutionary streak contrasted with the moderately conservative Irish
Parliamentary Party (IPP), who were steadfastly committed to constitutional nationalist
politics.
The result was a landslide victory for Sinn Féin. The IPP, the dominant party for decades, were
decimated. Though they had not even contested the prior election, Sinn Féin won 73 out of 105
seats in Ireland. Within two months, Sinn Féin’s MPs had declared independence from the UK
and the armed conflict that would become Ireland’s War of Independence began.
As the “Sinn Féin Election” immediately followed franchise extension, it is tempting to
attribute a principal role to the franchise extension in the party’s electoral victory. But were the

3
newly enfranchised voters the same people who supported dramatic political upheaval? This
paper quantitatively assesses how changes in voting rights shaped the outcome of the election.
Perhaps surprisingly, we find that changes in voting rights cannot explain the Sinn Féin victory.
Our results indicate that constituencies with greater numbers of newly enfranchised electors,
all else being equal, did not return a higher Sinn Féin vote share. In fact, in constituencies
where the share of female electors was higher, support for Sinn Féin was lower.
If not the expansion of the franchise, what then could explain the remarkable rise of Sinn Féin?
Could it be that traditional socioeconomic factors have more explanatory power, or perhaps it
was the effect the “Easter Rising” of 1916 had on public opinion?1 In this paper, we consider
franchise changes in conjunction with several alternative hypotheses. These hypotheses
explore economic factors, such as occupation and wealth, public opinion relating to events
between 1916 and 1918 as well as long run factors, such as the impact of the Great Famine,
details of which we set out in subsequent sections.
Under these alternative hypotheses, the franchise extension was not a substantial cause of the
electoral shift, and variables such as the number of new electors should not have a significant
effect on the Sinn Féin vote. We consider both the relationship between these categories and
the decision to vote for Sinn Féin, and also the decision to cast a vote at all. We find that all of
the alternative hypotheses have some explanatory role, with varying importance. The franchise
extension explains about one-tenth of the overall variation in Sinn Féin vote share. For context,
the economic hypothesis/category explains about twice that. Based on this evidence, we
conclude that franchise changes did not drive the Sinn Féin victory in 1918.
1 The Easter Rising was an armed insurgency against British rule that started on Easter Monday in 1916. The
Rising was a military failure but is seen as a pivotal moment in Irish history due to its impact on public opinion.
Many of the 1918 Sinn Féin leadership had participated in the Easter Rising.

4
That changes in voting rights can have implications for political outcomes in some contexts is
well recognised. Related work has previously examined the effects of franchise extensions,
inter alia, on stock markets (Lehmann-Hasemeyer et al. 2014), on health expenditures (Aidt et
al. 2010; Fujiwara, 2015), and on the political budget cycle (Aidt and Mooney, 2014). These
papers highlight that the enfranchisement of poorer voters is often associated with higher
welfare spending.2 Greater female political participation has been linked to areas as disparate
as international trade and social policy (inter alia de Bromhead, 2017; Miller, 2008, Aidt and
Dallal, 2008; Lott and Kenny, 1999, Voucharas and Xefteris, 2018). The question of how
universal franchise affected the growth of social democracy and the nationalisation of politics
has been raised more broadly (Caramani, 2004 p.249; Polanyi, 1944). Our paper highlights the
context specific nature of franchise extension as a catalyst for economic, social and political
change.
Drawing a link between franchise extension and political change is particularly tempting in the
context of Ireland in 1918 because the franchise extension was so large, and the apparent
implications (violent rebellion) were so significant. Furthermore, and perhaps lost in the
context of the political violence, the economic consequences of the election result were also
substantial. Consistent with radical nationalism, economic self-sufficiency had been a central
tenet of Sinn Féin policy from its foundation (Neary, 1984). Once ultimately in power, Éamon
de Valera, leader of Sinn Féin in 1918, would go on to adopt a policy of economic nationalism
in the newly independent Ireland. This policy arguably held back Irish economic development
for decades (Honohan and Walsh, 2002).
The analysis in this paper was made possible by our digitisation of census records and other
historical data. Our empirical approach links electoral results with demographic data from the
2 Aidt et al. (2010) however find evidence of a “u-shaped” relationship between franchise extension and
spending.

5
1911 census at the constituency level for the entire country. This permits us to analyse the
effects not just of franchise extension itself like Berlinski and Dewan (2011), but also control
for a rich set of constituency-level factors like literacy rates, occupation, and religious
affiliation. We go further and collect data relating to the alternative hypotheses of the rise of
Sinn Féin, ranging from economic and long-run factors, such as the impact of the Great Famine,
to the radicalisation of the Irish electorate by the events of 1916-18, to the characteristics of
the candidates themselves. In addition to the natural focus on Sinn Féin, we also examine the
relationships for votes for the IPP and the Unionist Party, the other major political parties of
the period. Our analysis indicates that Sinn Féin did not benefit from the extension of the
franchise in 1918, and may have even fared better had women not been enfranchised. We
conclude that a widespread change in public opinion, most likely brought about by the
revolutionary uprising in 1916 and the British attempts to conscript Irish men into wartime
military service, and indeed the British reaction to these events, are crucial to understanding
the Sinn Féin victory in 1918.3 Finally we examine the factors associated with turnout in the
election and find that new female voters and turnout rates were negatively associated, perhaps
accounting for a muted effect of women’s enfranchisement.
Our paper makes a number of contributions. Firstly, we quantitatively address a long-standing
question in Irish history and find that franchise extension does not explain the Sinn Féin victory
in 1918. Secondly, we provide evidence that the events between the Easter Rising of 1916 and
the General Election in 1918 (such as deportation of participants and donations to the 1916
veterans’ fund) were associated with support for Sinn Féin. Thirdly, our research connects to a
wider literature on the impact of franchise extension on politics and policy. Fourthly, we make
a contribution by assembling a dataset at constituency level that brings together a number of
3 Irish public opinion was so strongly opposed to British efforts of conscription that this episode is popularly
referred to as the ‘Conscription Crisis’.

6
variables that are important to understanding a pivotal moment in Irish and British history,
events which are the focus of considerable public interest in the midst of Ireland’s ‘Decade of
Centenaries’.4 Finally, our research explores the broad question of how economic,
demographic and social aspects drive radical political change. We emphasize that franchise
extension alone need not result in substantial shifts in electoral politics.
The paper will proceed as follows: the next section provides some important historical and
political background to the period, outlining the rise of Sinn Féin as a political force and the
social and political context in which the election of 1918 took place. Section 3 describes the
electoral, socioeconomic and other data employed in our empirical analysis of section 4, while
the robustness of our results is tested in section 5. Finally section 6 outlines some general
conclusions.
Background
Historical Context
The Sinn Féin victory in 1918 was a remarkable result for a party that had never before
contested a general election.5 Founded in 1905, until the revolutionary events of 1916-1918
Sinn Féin were a marginal political movement and “a mere nationalist faction” (Lee, 1989, p.
8). By 1918 however the party was a major political force, winning 73 of the 105 Irish
parliamentary seats with the estimated support of between 52-64% of voters (Coakley, 1994
pp.163-64).6
4 An official Irish government programme of commemoration events, accompanied by a joint statement of the
UK and Irish governments are available https://www.decadeofcentenaries.com/ 5 Although the party contested some by-elections in the years following its founding, it did not contest either of
the parliamentary elections held in 1910 (Laffan, 2005). 6 Sinn Féin won 47% of votes cast but were uncontested in 25 constituencies. Assuming turnout and support
were similar in uncontested and contested districts gives an estimate of 51.5%, assuming all votes went to Sinn
Féin in uncontested areas yields a figure of 64%. Success however varied geographically, with Sinn Féin
7
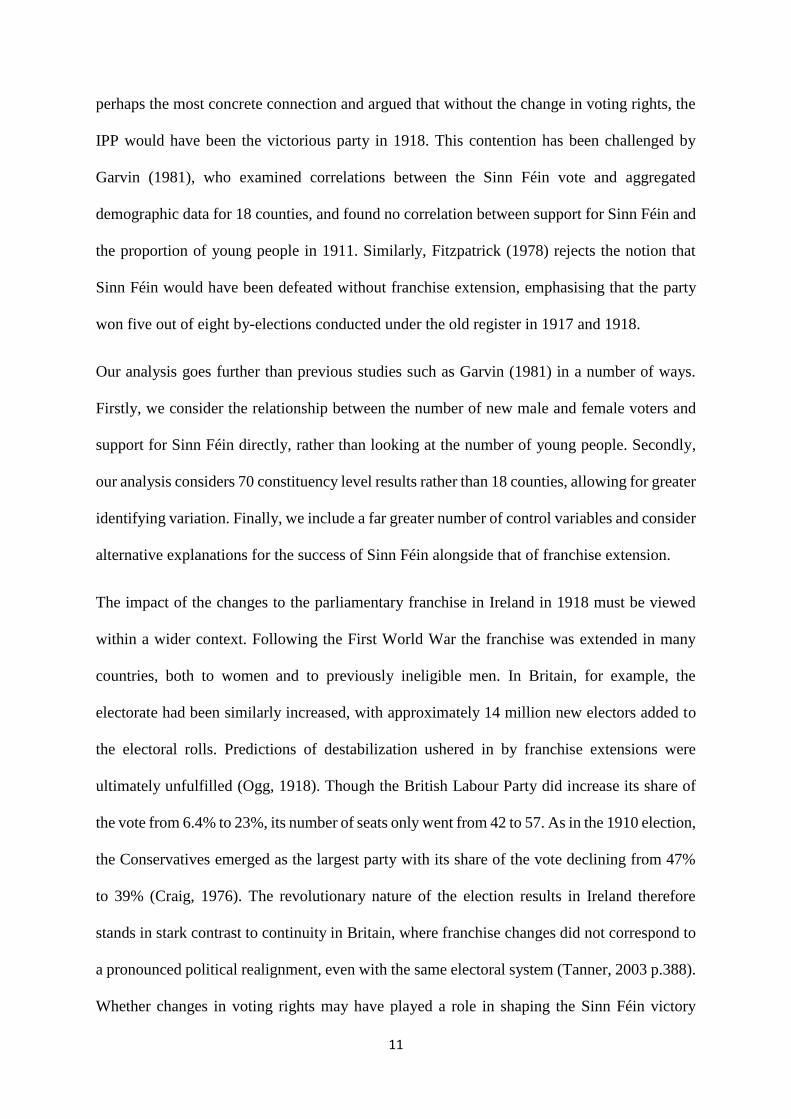
The collapse of the Irish Parliamentary Party (IPP) was perhaps as dramatic as the Sinn Féin
victory. The IPP (and their rivals, the Unionists) had dominated Irish politics in the last decades
of the 19th century. The IPP achieved a comprehensive victory in the last pre-war election of
December 1910, securing 73 of 103 Irish parliamentary seats, including 49 seats where the IPP
candidate was elected unopposed. In contrast, they returned only six seats in 1918. Whether
changes in the franchise can help us explain this dramatic electoral shift is the principal
question of this paper. The unionist parties, who were defined by their opposition to Irish self-
rule, secured twenty seats in 1910 and twenty-six seats in 1918, solidifying its position as the
dominant party in the north of Ireland.7
Despite the IPP’s electoral success in 1910, the eight years between general elections – the
longest period without a general election in UK parliamentary history – had witnessed a marked
shift in the political landscape.8 After the 1910 election, the IPP’s reward for supporting the
Liberal government was the Home Rule Bill of 1912. The Home Rule Bill, scheduled to come
into force in 1914, provided limited self-government (“Home Rule”) for Ireland while
remaining part of the United Kingdom. The Bill was opposed by Unionists, and the
establishment of the Ulster Volunteers in 1913 indicated a willingness to resist its imposition
by force. Nationalists responded by forming their own militia force, the Irish Volunteers.
Ireland – and indeed the UK – was on the brink of civil war.
Home Rule was shelved when events on the European continent led to war breaking out in the
late summer of 1914. The leaderships of both the Unionists and the IPP supported the war
effort, with the IPP believing they would be rewarded once hostilities ceased (Miller, 1973). A
minority within the nationalist movement – perhaps 12,000 of the 180,000 members of the Irish
winning 69 of the 72 seats in the majority Catholic south of Ireland, while only securing 19% of the votes cast in
the six counties that would go on to constitute Northern Ireland. 7 The Irish Unionist party won 22 seats with other unionist candidates winning 4 seats in 1918. 8 Elections had been postponed with the outbreak of war in 1914.

8
Volunteers – rejected the leadership’s position. This smaller group coalesced around the leaders
of the clandestine revolutionary group, the Irish Republican Brotherhood (IRB). The IRB
advocated the overthrow of British rule in Ireland by any means necessary, including violence
(Wheatley, 2005). Its membership included Éamon de Valera, who would go on to lead Sinn
Féin in the 1918 General Election.
Shifting Public Opinion, 1916-1918
With the British authorities preoccupied with the war on the continent, the insurgents saw their
opportunity.9 In Easter week, 1916, they staged a rising in Dublin, occupying key buildings
and proclaiming Irish independence in front of the General Post Office. The rising was quickly
put down by the British authorities and fifteen of the leaders court-martialled and shot
following the rebel surrender. Although the rising had failed militarily, the perceived severity
of the British reaction in its aftermath bred discontent among many sections of the population
and helped turn public opinion towards sympathy for the rebels (Laffan, 2005). Despite the fact
that Sinn Féin had very little to do with the Rising directly, they capitalised on the shift in
public opinion that occurred in its aftermath.10 This relationship between public opinion
towards the 1916 Rising and electoral support for Sinn Féin will be tested as an important
alternative hypothesis in the analysis that follows.
British attempts to introduce conscription in Ireland also boosted Sinn Féin's profile and further
undermined the IPP's position as the preeminent force in Irish nationalist politics. Conscription
had been enacted in Britain in 1916 and the German offensive of 1918 had induced the cabinet
9 Only about 2,500 rebels took part in the Easter Rising, representing about 20% of the Irish Volunteers in
Ireland in 1916 (Collins, 2016). The volunteers that took part in the 1916 Rising were therefore a minority
within a minority among those who had joined in 1913/14. 10 The British and Irish press, as well as the public in general, inaccurately dubbed the rising the 'Sinn Féin'
rebellion. (Henry, 1920). The IRB and Sinn Féin were distinct entities, but with considerable overlap in
membership.

9
to finally extend conscription to Ireland (Ward, 1974). The attempt to introduce conscription
in Ireland was, not unexpectedly, deeply unpopular. The various disparate strings of Irish
Nationalism were united in opposition, with the IPP even going as far as withdrawing from
parliament in protest (Coakley, 1994). Despite this demonstration, the conscription issue
reinforced the link between the IPP and the war effort while Sinn Féin claimed the role of the
most vociferous opponent of conscription, declaring that the conscription bill was tantamount
to a declaration of war on Ireland (Townshend, 2013). We will also attempt to evaluate the
impact of the events of 1918 on public opinion towards Sinn Féin in our empirical analysis.
The fallout from the Easter Rising and the prospect of general conscription set the scene for
Sinn Féin's first electoral successes. First in Roscommon in February 1917, followed by
victories in Longford, Clare, Kilkenny, and Cavan, Sinn Féin gained seats in a series of by-
elections. However the IPP was able to defeat Sinn Féin in three by-elections in 1918, restoring
some optimism to the party leadership (Laffan, 2005).
Nevertheless, the IPP had little success between 1910 and 1918. The constitutional approaches
of the IPP ultimately failed to achieve even limited self-government for Ireland. This fuelled
the idea that the party had taken parliamentary nationalism as far as it could, and that a new
force was needed to carry on the struggle for Irish self-determination. The IPP election
manifesto for 1918 pled for continuity rather than change, with reference to past achievements
rather than future reforms (United Irish League & IPP, 1918).11 Sinn Féin had positioned itself
as a serious and determined alternative movement. The Sinn Féin manifesto of 1918 clearly
sets out the party's aims: to withdraw representation from Westminster, establish an Irish
assembly, to use "any and every means" to resist British power in Ireland, and to appeal to the
Paris Peace Conference to recognise Ireland as an independent nation (Sinn Féin, 1918). The
11 It is noteworthy that both the IPP and the Sinn Féin election manifestos are devoid of policy pledges beyond
those relating to the issue of Irish nationalism.

10
decision by the Irish Labour Party not to contest the election ensured the 1918 election
represented a relatively clear cut choice between two different versions of Irish nationalism –
the incremental achievement of modest independence pursued by the IPP and the radical and
revolutionary republicanism offered by Sinn Féin.
The Franchise Hypothesis: The Representation of the People Act (1918)
The choice between a continuation of the constitutional approach of the IPP and the radical
republicanism of Sinn Féin was before an electorate that had expanded dramatically since 1910.
The Representation of the People Act of 1918 emerged during the First World War, noting that
the sacrifices made during the war should be acknowledged in the enfranchisement of the
remaining disqualified men (Blackburn, 2011). Although there was a general consensus across
political parties that universal suffrage should apply to men, the provisions granting women
the vote were more contentious (Ogg, 1918). The final Act did not achieve universal suffrage,
but did increase the UK electorate from eight to 21 million. All men over the age of 21 and
women over 30 who met a property requirement would be entitled to vote
In Ireland, the Act resulted in a near tripling of the Irish electorate, from 698,000 to 1,931,000
(Laffan, 2005). The fact that many constituencies had not been contested for a number of
decades and an eight-year gap between elections meant the electorate was inexperienced with
voting. It is estimated that only 360,000 people—less than 20% of the electorate—had voted
in a previous parliamentary election (Coakley, 1994). Many within the IPP worried that this
new electorate would be easily radicalised and would not remember the political achievements
of the party of the previous decades, most notably in the area of land reform (McConnel, 2004).
Historians have previously cited the franchise extension as a factor in understanding the Sinn
Féin victory in 1918 (McConnel, 2004; Laffan, 2005; Coakley, 1994; Farrell, 1971), but its
importance has not been subject to a rigorous quantitative assessment. Farrell (1971) drew
11
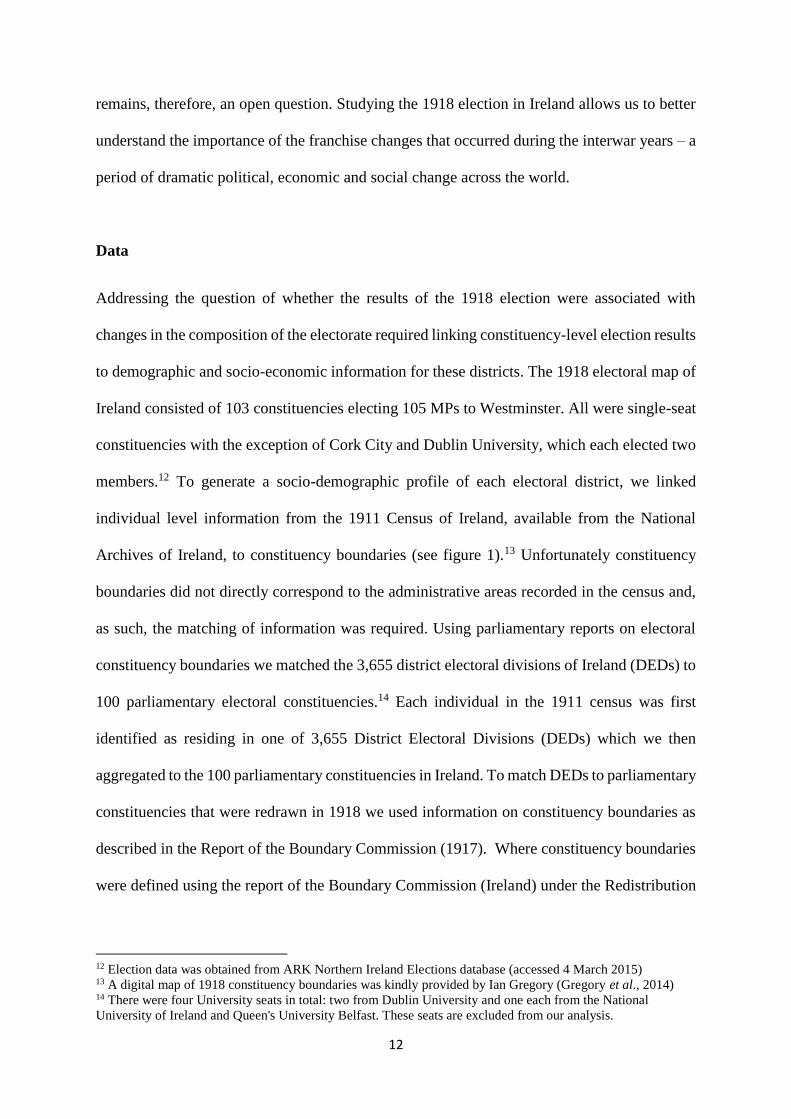
perhaps the most concrete connection and argued that without the change in voting rights, the
IPP would have been the victorious party in 1918. This contention has been challenged by
Garvin (1981), who examined correlations between the Sinn Féin vote and aggregated
demographic data for 18 counties, and found no correlation between support for Sinn Féin and
the proportion of young people in 1911. Similarly, Fitzpatrick (1978) rejects the notion that
Sinn Féin would have been defeated without franchise extension, emphasising that the party
won five out of eight by-elections conducted under the old register in 1917 and 1918.
Our analysis goes further than previous studies such as Garvin (1981) in a number of ways.
Firstly, we consider the relationship between the number of new male and female voters and
support for Sinn Féin directly, rather than looking at the number of young people. Secondly,
our analysis considers 70 constituency level results rather than 18 counties, allowing for greater
identifying variation. Finally, we include a far greater number of control variables and consider
alternative explanations for the success of Sinn Féin alongside that of franchise extension.
The impact of the changes to the parliamentary franchise in Ireland in 1918 must be viewed
within a wider context. Following the First World War the franchise was extended in many
countries, both to women and to previously ineligible men. In Britain, for example, the
electorate had been similarly increased, with approximately 14 million new electors added to
the electoral rolls. Predictions of destabilization ushered in by franchise extensions were
ultimately unfulfilled (Ogg, 1918). Though the British Labour Party did increase its share of
the vote from 6.4% to 23%, its number of seats only went from 42 to 57. As in the 1910 election,
the Conservatives emerged as the largest party with its share of the vote declining from 47%
to 39% (Craig, 1976). The revolutionary nature of the election results in Ireland therefore
stands in stark contrast to continuity in Britain, where franchise changes did not correspond to
a pronounced political realignment, even with the same electoral system (Tanner, 2003 p.388).
Whether changes in voting rights may have played a role in shaping the Sinn Féin victory
12
remains, therefore, an open question. Studying the 1918 election in Ireland allows us to better
understand the importance of the franchise changes that occurred during the interwar years – a
period of dramatic political, economic and social change across the world.
Data
Addressing the question of whether the results of the 1918 election were associated with
changes in the composition of the electorate required linking constituency-level election results
to demographic and socio-economic information for these districts. The 1918 electoral map of
Ireland consisted of 103 constituencies electing 105 MPs to Westminster. All were single-seat
constituencies with the exception of Cork City and Dublin University, which each elected two
members.12 To generate a socio-demographic profile of each electoral district, we linked
individual level information from the 1911 Census of Ireland, available from the National
Archives of Ireland, to constituency boundaries (see figure 1).13 Unfortunately constituency
boundaries did not directly correspond to the administrative areas recorded in the census and,
as such, the matching of information was required. Using parliamentary reports on electoral
constituency boundaries we matched the 3,655 district electoral divisions of Ireland (DEDs) to
100 parliamentary electoral constituencies.14 Each individual in the 1911 census was first
identified as residing in one of 3,655 District Electoral Divisions (DEDs) which we then
aggregated to the 100 parliamentary constituencies in Ireland. To match DEDs to parliamentary
constituencies that were redrawn in 1918 we used information on constituency boundaries as
described in the Report of the Boundary Commission (1917). Where constituency boundaries
were defined using the report of the Boundary Commission (Ireland) under the Redistribution
12 Election data was obtained from ARK Northern Ireland Elections database (accessed 4 March 2015) 13 A digital map of 1918 constituency boundaries was kindly provided by Ian Gregory (Gregory et al., 2014) 14 There were four University seats in total: two from Dublin University and one each from the National
University of Ireland and Queen's University Belfast. These seats are excluded from our analysis.
13
of Seats Act (1885), we used the 1901 census summary reports to firstly link DEDs to Baronies
(the next level of aggregation up from DEDs, c.330 baronies in Ireland) and then matched
Baronies to 1918 electoral constituencies using Baronies and Electoral Constituencies (1885).15
Our principal variables of interest are those relating to newly enfranchised voters. The female
share of the electorate variable, Share female electors, is defined as the share of female electors
in the total electorate in each constituency, as described in UK parliamentary papers (UK
Parliament, 1918). Unfortunately this source does not list the number of male electors in each
constituency who are ‘new’ and ‘old’ but simply categorises by gender and type of franchise
(e.g. local or parliamentary). To estimate the new male franchise for each constituency we use
the difference between the male local government franchise and the male parliamentary
franchise in 1918 as shown in equation 1.
(1) 𝑁𝑒𝑤 𝑚𝑎𝑙𝑒 𝑒𝑙𝑒𝑐𝑡𝑜𝑟𝑎𝑡𝑒 = 1918 𝑚𝑎𝑙𝑒 𝑝𝑎𝑟𝑙. 𝑒𝑙𝑒𝑐𝑡𝑜𝑟𝑎𝑡𝑒 − 1918 𝑚𝑎𝑙𝑒 𝑙𝑜𝑐𝑎𝑙 𝑒𝑙𝑒𝑐𝑡𝑜𝑟𝑎𝑡𝑒
Put simply, we use the 1918 male local electorate as a proxy for the pre-1918 parliamentary
electorate, and from this, infer the increase in male voters in each constituency. We consider
this a suitable proxy for a number of reasons. Under the 1898 Local Government Act, the local
government franchise was extended to include all male householders or occupiers (McManus,
2013). However the local government franchise was applied at the household level and
therefore disenfranchised, among others, younger, single men who lived with their fathers.16
These men were also unable to vote in parliamentary elections before 1918, when a similar
‘household’ qualification was employed. Indeed according to Tanner (2003 p.119) “there was
considerable continuity between the pre-war parliamentary franchise and the post-war
15 The constituent DEDs of a parliamentary constituency were not listed in the 1885 volume. When a barony
straddled a constituency boundary we endeavoured to include the barony in the constituency in which the
majority of the barony was located. 16 Most male householders had gained the vote before 1918 under the 1867 and 1884 Reform Acts. The
proportion of adult males disenfranchised before 1918 varied across the UK however, ranging from one-third in
England and Wales to one-half in Ireland (Cunningham, 2014).

14
municipal franchise”. According to the Handbook of Local Government in Ireland, the local
electorate was “all Parliamentary electors and of all peers and women who, but for their being
peers or women, would be entitled to be Parliamentary electors” (Clancy, 1899 p.4).17 As a
further robustness check on the use of male local electors in 1918 as a proxy for the previous
male parliamentary electorate, we compare the figures for the male parliamentary electorate in
1910 to male local electorate in 1918 for the constituencies where boundaries remained the
same between elections – comparing the ‘true’ old electorate with our local electorate proxy.
Although this leaves us with only 57 constituencies that we can reasonably compare, the
correlation between the male parliamentary electorate in 1910 and the male local electorate in
1918 is extremely high at 0.9, providing reassurance regarding the use of this proxy measure.18
From the information on men entitled to vote in local elections we generate a variable, Share
new males, which is our estimate of new male electors as a proportion of the total electorate.
The inclusion of this variable can help us identify whether newly enfranchised male electors
gave disproportionate support to Sinn Féin.
The census information allows us to consider the socio-economic characteristics of each
constituency.19 We classify occupations by HISCO codes originally created by Fernihough, Ó
Gráda, and Walsh (2015) which are then categorised as a HISCLASS codes (van Leeuwen and
Maas, 2011). The HISCLASS coding scheme is then further matched to the occupational
classifications used in Connor (2019). For example the variable Share Farmers is the
proportion of the male voting-age population that listed their occupation as “farmer” in the
1911 Census.20 From the census information we also construct variables that capture religious
17 The 1918 act did simplify the qualifications for local government electors but it was still fundamentally a
household franchise. 18 One important change to the franchise qualification brought in by the 1918 act was the reduction of the
residency period from 12 months to six months. 19 Of course the demographic profile of a constituency in 1911 may differ somewhat from that of 1918. We will
address this point in the robustness section. 20 A full list of variables and definitions is presented in the appendix.

15
composition, average age, household size, land values and the share of Irish Speakers. For the
analysis of turnout in the election we also consider female literacy and participation rates.
The descriptive statistics (Table 1) reveal some of the differences in the demographic profiles
of the constituencies. The proportion of new female electors varies considerably, from 30% to
44%, while the proportion of new male electors varies between 3% and 34%. With respect to
socio-economic variables, the proportion of the voting-age male population who are farmers
ranges from 0% to 71% while Skilled Workers ranges from 5% to 53%. Likewise the religious
divisions are evident, with some constituencies being as high as 99% Roman Catholic while
others are as low as 7%.
Analysis
Understanding Sinn Fein Support: Regression Analysis
As discussed above, contrasting explanations have been provided for the success of Sinn Féin
in the 1918 General Election. Broadly categorized, we can separate the divergent theses
explaining the electoral swing to militant republicanism in 1918 into several hypotheses. The
first explanation – the franchise extension hypothesis – could be considered within the
framework of traditional theories of non-random franchise extension. Under this hypothesis,
the extension of voting rights to previously non-franchised groups permitted a more
representative 'latent mandate' to emerge from the Irish people. This proposes that those groups
enfranchised in 1918 were disproportionately likely to support Sinn Féin, with the existing
literature, and indeed contemporaries, suggesting that new voters tended to be younger and
poorer and that Sinn Féin support was greater among young people (Farrell, 1971; McConnel,
2004). If true, then we should expect to see greater support for Sinn Féin in areas with relatively
larger numbers of enfranchised men and women. The alternative explanations imply that the
electoral success of Sinn Féin was the result of a change in preferences on behalf of the

16
electorate – that is the events of Easter 1916 and its aftermath, the conscription crisis, the
perceived failure of the IPP to achieve Home Rule, or perhaps some other factor, led to a switch
in voter allegiance within the Nationalist movement, from constitutional to republican. In the
analysis that follows we will test these various hypotheses in an effort to better understand the
determinants of the Sinn Féin victory in 1918.
As a first pass, looking at the simple correlation between the share of female electors and the
Sinn Féin vote in contested constituencies as shown in figure 2 is informative. The graph shows
a strong negative relationship between the share of women in the electorate and support for
Sinn Féin, with a correlation coefficient of -0.59. Generally speaking, where women made up
a greater proportion of the electorate, the Sinn Féin vote share was lower. Figure 3 shows the
correlation between the share of new male electors and Sinn Féin vote shares. Here, the
opposite relationship is apparent. A higher proportion of new male electors is positively
associated with the Sinn Féin vote share, albeit with a weaker correlation coefficient of 0.32.
Of course, these bivariate relationships, however revealing, cannot be interpreted as direct
proof of differential voting as the observed relationship may be a product of confounding
factors related to both the number of new electors and support for Sinn Féin. The multivariate
regression results reported in table 2 address this issue. The extent to which franchise extension
can explain the observed voting patterns of the Irish electorate sheds light on whether the 'latent
mandate' or 'preference change' theories of 1918 carry more statistical weight. Equation (2)
illustrates the testing framework:
(2) 𝑆𝑖𝑛𝑛 𝐹é𝑖𝑛 𝑣𝑜𝑡𝑒𝑖 = 𝛼 + 𝛽1𝑆ℎ𝑎𝑟𝑒 𝑛𝑒𝑤 𝑚𝑎𝑙𝑒𝑠𝑖 + 𝛽2𝑆ℎ𝑎𝑟𝑒 𝑓𝑒𝑚𝑎𝑙𝑒 𝑣𝑜𝑡𝑒𝑟𝑠𝑖 + 𝛾𝑋𝑖 + 𝜀𝑖
Where Sinn Féin vote is the vote share of Sinn Féin in constituency 𝑖. On the right-hand-side
we include our variables of interest to test ‘franchise extension’ hypothesis while 𝑋 is a vector

17
of control variables.21 Column 1 of table 2 examines the relationship between the share of new
electors and support for Sinn Féin after including some baseline controls: turnout, average age,
the mean and standard deviation of household size and the proportion of the constituency that
are Catholic.22 In our analysis we restrict our sample to those constituencies actively contested
by Sinn Féin.23 The results in column 1 are consistent with the relationships between the Sinn
Féin vote share and new electors represented in figures 2 and 3. There is a weak and statistically
insignificant positive relationship between the Sinn Féin vote share and the share of new male
electors. The relationship between female electors and Sinn Féin vote is negative although
statistically insignificant. The implied magnitude is relatively large however a one standard
deviation increase (0.03) in new female electors associated with a 2 percentage-point decrease
in the Sinn Féin vote share.
We next turn to the relationship between support for Sinn Féin and economic characteristics at
the constituency level to explore whether support for Sinn Féin varied according to the
socioeconomic makeup of the constituency. Column 2 of table 2 includes variables capturing
economic characteristics of constituencies, such as the occupational structure and the rateable
value of land and building assets, as reported in the 1911 census. The baseline controls from
regression 1 are maintained. While our proxy for wealth (rateable value) does not, all else
equal, appear to be related to support for Sinn Féin, we do observe something of a class
gradient, with white-collar and skilled occupations negatively associated with Sinn Féin
support.
21 We note that as Sinn Féin did not contest the prior General Election, the vote level mechanically equals the
change in the vote. Similarly, the share of new electors variable is also a change relative to the last election. We
can thus implicitly interpret these coefficients in a similar manner to a first-difference framework. This implicit
interpretation does not extend to the analysis of parties that contested the previous elections. 22 These variables are considered as baseline controls due to the mechanical way in which they may be related to
the franchise and support for Sinn Féin. For example, Sinn Féin’s vote share may rise as turnout falls. The
relationship between new electors and turnout is explored in table 5. 23 In 25 constituencies Sinn Féin were unopposed while they did not contest another 5 constituencies due to an
electoral pact with the IPP in Ulster (Laffan, 2005).

18
Column 3 tests the hypothesis that support for Sinn Féin in 1918 was driven by the impact of
1916 and its aftermath on public opinion. Estimating public sentiment is clearly a difficult task
and as such we must rely on proxy variables to test this hypothesis. The first variable we
construct to understand 1916 sentiment is the number of 1916 prisoners deported from a
constituency. In the immediate aftermath of the 1916 Rising, the British authorities imposed
martial law and rounded up almost 2,500 individuals from across the country thought to have
had some involvement in the rebellion and deported them to prisoner-of-war camps in Britain.
Although many of the deportees had little direct involvement in the events of 1916, their arrest
and deportation is thought to have alienated public opinion and contributed to the increase in
support for the political inheritors of the 1916 Rising, namely Sinn Féin. We use the geocoded
addresses of these deportees and place them within electoral constituency boundaries (Travers,
2017).
A second measure of sentiment is also included in the regression: donations made to the Irish
National Aid Association and Volunteer’s Dependants Fund (INAAVDF) in 1916 and 1917.
The Irish National Aid Association (INAA) was founded the month after the Easter Rising to
solicit donations to support the veterans of 1916 and their dependents. Shortly after its creation,
the INAA merged with the more militant Veterans’ Dependents’ Fund (VDF) founded by
Kathleen Clarke, whose husband Tom had been executed for his part in the Rising. Michael
Collins, a veteran of 1916 and a member of the IRB, was appointed Secretary and used it as
the financial basis for the renewal of the revolutionary movement and as such, the INAAVDF
was firmly associated with the radical republican movement (Murphy, 2014).24 According to
Nic Dháibhéid (2012) the INAAVDF “played a decisive role in shaping the popular memory
24 We refer to the donations here simply as “INAA”.

19
of the Easter Rising as well as laying the foundations for a reinvigorated political and military
campaign after 1917.”
The notionally benevolent nature of the INAA permitted them to publish lists of donors. We
scanned and transcribed these donations and, where feasible, geolocated their source. After
excluding donations from diasporic groups, we were left with approximately 17,000
observations of individual donations that we linked to individual constituencies.25 We then
were able to aggregate the total value of donations made in each constituency.
The results presented in column 3 offer support to the hypothesis that the 1916 Rising and its
aftermath radicalised public opinion and drove support for Sinn Féin. Both the number of post-
1916 deportees and the value of donations made to the INAA (both scaled by population) are
positively associated with support for Sinn Féin. The legacy of the 1916 Rising appears
important to understanding voting in the 1918 election.
Column 4 in table 2 considerers the additional hypothesis that the events of 1918 itself were
crucial to the Sinn Féin victory. The Conscription crisis and the imprisonment of prominent
Sinn Féin figures following the supposed discovery of a ‘German Plot’ between Sinn Féin and
the German Empire to stage an insurrection in Ireland is thought to have shifted public opinion
in favour of Sinn Féin. Indeed the IPP complained that without the arrests, in so far as they
positioned Sinn Féin as the most stalwart opponent of conscription, they would have decisively
beaten Sinn Féin in the East Cavan by-election in June 1918 (Laffan, 2005). To test the
hypothesis that the events of 1918 were associated with support for Sinn Féin we consider two
variables in column 4. The first variable is the share of Military Voters in a constituency. In
1918 voters still on active service were entitled to an absentee ballot in the constituency in
which they would have otherwise been entitled to vote. The number of Military voters in each
25 Addresses relating to donations outside of Ireland were excluded from the analysis.

20
constituency is recorded in the UK parliamentary papers. In terms of a proxy for attitudes
towards conscription, we assume that this be interpreted as a rough measure of support for the
war and correspondingly, a more favourable inclination towards conscription. As such we
might expect that military voters would be negatively related to support for Sinn Féin.
We also include in column 4 a dummy variable to capture whether or not the Sinn Féin
candidate was in prison at the time of the election to examine whether this gave any electoral
benefit to Sinn Féin. The results indicate that, all else equal, support for Sinn Féin was lower
where military voters constituted a great share of the electorate, lending support to the
hypothesis that the conscription crisis may have played a role in determining the results of the
election of 1918, while the imprisonment of a Sinn Féin candidate did not appear to bring any
electoral benefit, all else equal.
The relationship between long-run factors and support for Sinn Féin is tested in column 5 of
table 2. The regression includes a measure of the impact of the Irish Famine that occurred in
the mid-19th century. Specifically our measure of famine distress is the change in population
between 1841 and 1851 (Fernihough and Ó Gráda, 2018). As can be seen from the descriptive
statistics in table 1, the famine was a demographic catastrophe, with the average decline of
population experienced being 18% while some areas experienced a decline of 45% over the
period. That the British authorities failed to save Ireland from the famine was a recurring theme
among many Irish nationalists, including Sinn Féin (Laffan, 2005). Indeed a recent paper by
Narciso and Severgnini (2017) explicitly makes the link between famine experience and the
probability of engaging in rebellious activities. Likewise, the impact of the famine may have
had a bearing on support for Sinn Féin in 1918.
Also included are variables intended to capture cultural nationalism. In the late 19th century,
Irish culture witnessed a popular revival, with the Irish language and traditional Irish games
and cultural activities seeing a sustained recovery following centuries of decline. At the
21
forefront of this movement was the Gaelic League, a society founded in 1893 to promote
traditional Irish culture. Although not politically aligned to either nationalist party, radical
republicans and Sinn Féin leaders featured among the ranks of the League. To assess the
relationship between the emergence of cultural nationalism and support for Sinn Féin we
include the number of Gaelic League branches as well the share of the population that speaks
the Irish language alongside our measure of famine distress. The coefficients in column 5 of
table 2 suggest that where the impact of the famine was demographically most severe, Sinn
Féin support was higher. In contrast, there is little evidence that Gaelic League branches or
Irish speakers were associated with higher Sinn Féin vote shares, all else equal.26 The fact that
the famine experience is associated with greater support for Sinn Féin suggests long-run factors
mattered for Sinn Féin support and is consistent with the intergenerational transmission of
radicalisation suggested in Narciso and Severgnini (2017).
The final column in table 2 presents a regression in which all variables are considered jointly.
Although collinearity is likely present, the results are largely consistent with the specifications
that tested the various hypotheses in turn.27 Changes in the franchise do not appear to have
benefitted Sinn Féin. In fact the enfranchisement of women may have worked against the party
in 1918.
The Irish Parliamentary Party and Unionists
Having tested the various hypothesis related to support for Sinn Féin, we also consider the vote
shares of the IPP (Table 3) and Unionist (Table 4) parties as outcomes of interest.28 Many of
26 Although perhaps surprising given the overlapping memberships between the Gaelic League and radical
republican organisations, the Gaelic League was non-political and non-sectarian, with Protestants prominent
among its leadership. It should also be noted that we control for religion in the regressions and that dropping this
variable changes the sign of the Gaelic League coefficient. 27 The issue of collinearity and variable selection is considered in the robustness section. 28 In the robustness section we consider the vote shares of each party (and non-voting) as a system using a
Seemingly Unrelated Regression model.
22
these results complement those for Sinn Féin. Where more new voters were present the IPP
had a higher vote share, all else equal, although this is not statistically significant. Furthermore
the IPP had a higher vote share where the impact of the famine was less pronounced, mirroring
the result found for Sinn Féin. Finally the results in table 5 reveal that where more new male
electors were present the Unionists vote share was lower. Taken together with those for Sinn
Féin, these results suggest that the franchise did play a role in the outcome of the 1918 election,
although not quite that suggested in the literature. Women electors were associated with lower
support for Sinn Féin while new male electors were associated with lower support for
Unionists.
Understanding Turnout
The final section of the electorate not yet considered is those that did not vote in the 1918
election at all: non-voters. What constituency-level characteristics and conditions were
associated with non-voting? Table 5 considers a number of factors that may have been
associated with turnout in the election. Firstly, we examine the relationship between non-voting
(or equivalently, voter turnout) and the new electors. If voting is a habit, then the relative
inexperience of the Irish electorate in 1918 may be related to turnout. Column 1 of table 5
considers non-voters as a share of the electorate as the dependent variable with the measure of
new male and female franchise as explanatory variables. The positive and significant
coefficient on Share Female Electors indicates that where there were more female electors,
non-voting was higher (or equivalently turnout was lower). Indeed a one standard deviation
increase in the share of female electors is associated with a three percentage point increase in
non-voting, a sizeable effect. In contrast, the coefficient corresponding to new male electors is
small and not statistically significant.
23
Following from the results in model 1, we explore the relationship between the new electorate
and non-voting further by including measures of women’s labour market participation and
literacy. We also control for overall constituency wealth, as captured by valuation per acre. We
find a strong and statistically significant negative relationship between these variables and non-
voting. Where female labour force participation and literacy are higher, non-voting is lower.
This again is suggestive of a link between female electors and overall turnout.
Column 3 considers the impact of the pre-war women’s suffrage movement on turnout in 1918.
Based on Ward (2017), we geocoded the locations of suffrage society branches and their events
and activities in 1913. From this we constructed variables that capture the number of branches
and the number of pro-women’s suffrage activities recorded in 1913 in each constituency,
scaled by area. Our results suggest that non-voting was lower in areas that saw greater pre-war
suffrage activity, again highlighting a link between women electors and turnout.
Finally column 4 considers environmental factors that may have influenced turnout in 1918,
namely terrain (as measured by ruggedness), transport connectivity (as measured by the
number of train stations) and rainfall in December 1918. A final variable that we construct is
intended to capture a unique aspect of the election: that it took place during the ‘Spanish Flu’
pandemic of 1918. As the outbreak of influenza led to the cancellation of number of public
meeting (including political rallies), as well as high rates of mortality and illness, it may have
played a part in determining turnout in 1918. As such we measure the impact of the 1918
influenza outbreak by death rates recorded by the Registrar-General (Registrar General, 1919).
Figure 4 shows the geographic variation in death rates from influenza (and pneumonia) in 1918.
The regressions in column 4 suggest that while rainfall, the number of train stations and terrain
ruggedness were not related to turnout, the influenza pandemic may have indeed reduced
turnout in 1918.

24
The regression results in table 2 tell a consistent story. The estimated coefficients do not
support the hypothesis that Sinn Féin’s dramatic electoral success was driven by newly
enfranchised voters. If anything, female enfranchisement went against Sinn Féin. We find
evidence that the differences in constituencies’ propensity to vote Sinn Féin was underpinned
by economic and social factors. Using the Z-score transformation allows us to directly compare
the effect size of each explanatory variable individually. However, the individual and collective
explanatory power of these variables is still not completely captured by this framework.
Table 6 addresses this shortcoming by providing a measure of both the relative influence of
each individual regressor and also groups of regressors, where our groups match the four broad
explanatory categories. The first column in table 6 displays the coefficient estimates alongside
clustered standard errors associated with Sinn Féin support across the 70 contested
constituencies. These results are identical to those listed in the last column of table 2. The 𝑅2
value indicates that approximately 92% of the Sinn Féin vote is accounted for by the model’s
explanatory variables. The second column of table 6 decomposes the 𝑅2 statistic using the lmg
method proposed by Groemping (2006). This method, originally conceived by Lindeman et al.
(1980), yields relative 𝑅2 contributions by averaging across all orderings of the explanatory
variables or, as in column 3, groups of explanatory variables. This approach is superior to more
ad-hoc approaches such as partial-𝑅2 statistic comparisons because it calculates relative
importance measures that are invariant to regressor multicollinearity.
Our collection of baseline control variables appear, unsurprisingly, to account for most of the
model’s explanatory power. Column 3 indicates that 37% of the explained variation is
accounted for by these factors.29 Column 2 reveals that the Catholic variable is the most
29 The column totals in both columns (2) and (3) add to 100 so the numbers here indicate what share of the 92%
of the model variation is accounted for by the various explanatory variables.

25
influential, accounting for one-third of the total explained variation.30 The second single largest
contributor to the model’s explanatory power in the variable measuring INAA donations. By
this metric the 1916 rising can be seen as an important element underling Sinn Féin’s success.
Broadly speaking, economic circumstances appear to matter and contribute to around 20 per
cent of the explained variation. Comparing across the occupational distribution, Sinn Féin
support dwindled as the share of those in skilled occupations rose. Also noteworthy is relevance
of population change related to the Great Famine. Constituencies that were worse hit, in terms
of population loss, were more likely to lend support to the Sinn Féin cause at the ballot box.
Finally, these results, as before, indicate that franchise effects were important. As tempting as
it is to assume that a dramatic change in the electorate caused an equally dramatic change in
the composition of Ireland’s parliamentary representatives our results on this front suggest the
reverse. Newly enfranchised female electors can account for approximately 8% of the
explained variation. Under the counterfactual of “no female enfranchisement,” our model
predicts that Sinn Féin’s vote share may have actually increased.
Robustness
Demographic Change
A criticism that may be levelled at our linking of census data to election results is that our
electoral data is from 1918 while our demographic and economic data comes from the 1911
census. Although this is the closest census year available, our picture of the electorate of a
constituency may not be accurate if demographics shifted significantly in the seven years
between 1911 and 1918. Indeed there are obvious factors that may have influenced the
demographics of a constituency over the period, such as the impact of wartime recruitment,
30 Columns (2) and (3) are comparable but not equal. The reason for this is that column (2) extracts the relative
importance of each regressor by averaging across all model permutations wherein each explanatory variable
enters as a singleton. Column (3) applies the same procedure but assesses influence on the basis that the
variables are groups and enter and exit model partitions in blocks.

26
disruption of migration patterns or simply changes resulting from long-run demographic forces.
However we do have some demographic information for 1918: the size of the male and female
electorates. We can use this to test the accuracy of demographic data by estimating the number
of male and female electors using the census data from 1911 and comparing it to the actual
number of electors in each constituency in 1918. Specifically, we estimate the male electorate
by counting the number of men over 20 years of age and the number of women over 30 in each
constituency. Of course this is a relatively rough estimate of the male and female electorates;
many otherwise eligible male electors would have been disqualified due to various registration
restrictions such as a minimum residency requirement. Likewise, not all women over 30 would
have been entitled to vote as this was restricted to rate payers or the wives of male rate payers.
Nonetheless the exercise represents a useful test of the accuracy of our data. Figures 5 and 6
show the correlations between the actual electorate in 1918 and our estimate based on the 1911
census.
Clearly there is a very strong correlation between our estimates based on the 1911 census and
the actual electorates in 1918. For men the correlation is 0.85 and for women, 0.83. These close
relationships, despite the various reasons that these figures may legitimately diverge, reassures
us that our matching exercise is valid and that any demographic shifts between 1911 and 1918
are not likely to invalidate our results.
Variable Selection
As we have seen, the results presented earlier are somewhat sensitive to the exact specification
of the regression equation. This is inevitable when restricted to aggregated data with 70
observations and potentially correlated variables. To determine the robustness of the results,
there is an argument for excluding some variables on statistical grounds. While we argue our
themed regression analysis that tests each hypothesis in turn provides a logically coherent way
27
to interpret the data, we include a battery of robustness checks using several recently developed
machine learning algorithms.
Tables A1 to A4 in the Appendix explore the determinants of voting patterns using four
separate statistical objective functions.31 Column 1 is the baseline OLS specification, included
for comparison. Although OLS minimizes prediction error conditional on unbiased point
estimates, this commitment to unbiasedness may come at a cost of large variance. An
alternative approach permits a more flexible specification where bias in the point estimates is
permitted if it reduces variance "enough", as defined by some statistical measure like the AIC
or BIC. With this approach in mind, column 2 presents Ridge regression results, a technique
that minimizes prediction error while maintaining the same set of variables. The ridge point
estimates are in general biased. If the point estimates do not deviate much from the OLS results,
it is instructive that the OLS results provide good predictive power as well being unbiased.
Columns 3 through 5 of Tables A1 to A4 perform lasso estimation. Like ridge regression, the
lasso minimizes a statistic (e.g. residual sum of squares) but also has the advantage of
producing sparse solutions i.e. variable selection. We provide three variants implemented by
the Ahrens et al. (2018) LASSOPACK program. Overall these robustness checks support the
main findings of our baseline analysis. With respect to Sinn Féin support, the ridge regression
provides point estimates very similar to the OLS results. The lasso variable selection methods
differ in their analysis, but overall they suggest that, consistent with our earlier results, female
31 Most machine learning algorithms do not have well-defined clustered standard errors, so we report point
estimates alone.

28
electors (negatively), INAA donations (positively), and Famine-era population change
(negatively) are associated with support for Sinn Féin.
Constituencies where Sinn Féin was Unopposed
As highlighted earlier, Sinn Féin faced no electoral competition for 25 seats in Ireland in 1918
and their candidate was therefore deemed elected automatically. Although we exclude these
constituencies from our analysis and only consider electoral contests, it is possible to analyse
what characteristics increased the odds that a constituency was uncontested, in particular
whether the same factors that are associated with the Sinn Féin vote share are also related to
whether opposing parties decided not to run against Sinn Fein. Table A5 presents results of a
logistic regression where a dummy variable indicating when Sinn Féin was unopposed as the
dependent variable. The table suggests that, although certain characteristics increased the odds
of a constituency being contested, such as the share of Catholics (not reported), contested and
non-contested districts were not statistically different across many aspects. However it does
appear experiencing a greater population decline between 1841 and 1851 increased the odds
that Sinn Féin was unopposed.
Seemingly Unrelated Regression
In our previous analysis we examined the vote shares of Sinn Féin and other parties
independently when in practice vote shares of different parties are jointly determined.
Seemingly Unrelated Regression (SUR) models offer an alternative econometric approach. The
advantage of the SUR approach is that it models the election outcomes in a multivariate
framework, which is particularly of interest to scholars analysing multiparty elections (Jackson,
29
2002). Thus, we model the respective vote shares for Sinn Féin, the IPP, and Unionists (all
unionist parties) alongside the share of non-voters in following system of equations:
𝑆𝐹𝑉𝑜𝑡𝑒 = 𝛼𝑆𝐹 + 𝑿𝜷𝑺𝑭 + 𝜀𝑆𝐹
𝐼𝑃𝑃𝑉𝑜𝑡𝑒 = 𝛼𝐼𝑃𝑃 + 𝑿𝜷𝑰𝑷𝑷 + 𝜀𝐼𝑃𝑃
𝑈𝑁𝑉𝑜𝑡𝑒 = 𝛼𝑈𝑁 + 𝑿𝜷𝑼𝑵 + 𝜀𝑈𝑁
where the number of explanatory variables in the matrix X changes according to the model
specification and the error terms 𝜀 correlate. As in Wooldridge (pp. 167-8, 2004) we indirectly
estimate the intercept and slope coefficients of the non-voting equation via the following
restrictions:
𝛼𝑁𝑉 = 1 − 𝛼𝑆𝐹 − 𝛼𝐼𝑃𝑃 − 𝛼𝑈𝑁
𝜷𝑵𝑽 = −𝜷𝑺𝑭 − 𝜷𝑰𝑷𝑷 − 𝜷𝑼𝑵
which ensures that vote shares in each constituency, by definition, sum to one. These
coefficient restrictions and the correlation of the error terms means that variables that increases
the vote share for one party must decrease the vote share for others in equal measure.32
The results of the SUR estimation can be seen in tables A6 to A11 of the appendix. Again our
conclusions based on the individual regression analyses are basically unchanged. Support for
Sinn Féin is negatively associated with new female voters while INAA donations and the
severity of population decline over the period of the Irish famine are positively associated with
the Sinn Féin vote share. Where there are more women electors, turnout is also lower. Taken
together, these reinforce our view that the franchise extension was not responsible for the Sinn
32 To ensure concordance with our previous model results we calculated the standard errors using a cluster
bootstrap.

30
Féin victory in 1918 and that understanding the change in public opinion in the aftermath of
the 1916 Rising is crucial to understanding Sinn Féin’s electoral success.
Discussion
The finding that franchise extension to women in 1918 may have in fact have worked against
Sinn Féin should perhaps not be surprising. Evidence from other countries during the interwar
period suggests that women voters were anti-extremist and more conservative (Boak, 1989;
Turner, 1987). The radicalism of Sinn Féin's position therefore may have had relatively less
appeal to women. Indeed that the vote was restricted to women over 30 may have reinforced
this. The assertion that the Sinn Féin victory was, in the words of an often referenced
contemporary observer, ‘a triumph of the young over the old’ is not reflected in the age of the
1918 electorate (Ferriter, 2018). Although the new male voters were younger than average than
the old electorate, the new female voters were older, leaving the average age of the electorate
almost unchanged.33 The 1918 reforms not only disenfranchised by age but also by class due
to the property requirement that was applied. In fact it is estimated that as many as 2 million
working-class women over 30 (or over 20% of the population over 30) were disenfranchised
by these provisions across the UK (Muggeridge, 2018). Finally new electors may not have
voted in large numbers in 1918, a finding consistent with the fact that the UK 1918 election
turnout rate (57%) was lower than any election since (UK Parliament, 2016).34 Indeed our
analysis suggests a relatively strong link between the share of women voters in a constituency
and turnout in Ireland.35 Taken together the results suggest that newly-enfranchised male voters
33 Using the census information we estimated the average age of male household-heads over 21 (old electorate)
at 51. The average of non-household head males (new male voters) was 36 while the average age of women
over thirty was 51. Overall the average age for the 1918 electorate was 47. 34 Turnout in Ireland was 66% in contested constituencies. It should also be noted that uncontested seats were not
unique to Ireland in 1918. 107 out of 707 seats were uncontested across the UK (Audickas et al., 2017). 35 In a supplementary analysis we included enfranchisement-turnout interactions as additional explanatory
variables. The effect of new male enfranchisement was not conditional upon turnout (i.e. there was no statistical
association found across the board). It appears that new female electors support was conditional upon turnout. In
constituencies where turnout was higher the new female electors were even less likely to vote for Sinn Féin

31
did not give disproportionate support to Sinn Féin, while new women voters were associated
with a lower Sinn Féin vote.
What can explain support for Sinn Féin in 1918? We test alternative hypothesis and find
evidence that public opinion was radicalised by the 1916 Rising. We also show that Sinn Féin
won a greater share of the vote where the impact of the Great Irish Famine was most keenly
felt. In addition we explore the nature of turnout in 1918 and find that where more women
voters were present, turnout was lower. We also find however that areas with higher female
literacy, female labour force participation rates and more pre-war women’s suffrage activities
had higher rates of turnout, all else equal.
Conclusion
On the eve of the 1918 election, the IPP MP for West Mayo, William Doris, wrote to the party
leader, John Dillon, speculating how new voters would cast their votes:
“On the old register we were perfectly safe and the question is how the extended
franchise will affect us. I am satisfied that a majority of the women over thirty will
be with us, but the vast majority of the boys from 21 to 30 will be against us. They
appear to have gone mad and no doubt we will have all kinds of intimidation,
personation, etc.” (Doris, 1918, cited in McConnel, 2004 p.375)
The comment about female electors may well have been accurate and is broadly consistent
with our findings, although our result don’t support the claim that new male electors would
favour Sinn Féin. However the claim that the IPP under the old register would have been safe
is less convincing. Indeed Doris himself polled 2,363 fewer votes than 1910, even under a
compared to their counterparts in other constituencies. However, this interaction effect disappears in the fully
specified model. These results are available upon request.

32
vastly enlarged electorate. Clearly, absolute support for the IPP had declined in the face of Sinn
Féin's triumph.
A little more than a month after the election, the Sinn Féin deputies followed through on the
policy of abstentionism put forward in their election manifesto and convened the first meeting
of an independent Irish Parliament, Dáil Éireann, on 21 January 1919.36 With the ratification
that day of the 1916 proclamation of independence and the adoption of a new constitution,
Ireland began the journey to formal independence and ultimately the establishment of the 26-
county Irish Republic. The members of the First Dáil firmly believed that their convincing
victory in 1918 had given them a mandate to sever political ties with Britain (Coleman, 2013).
It is of course impossible to know what issues motivated individual voters in 1918. Nonetheless
the election was ultimately framed as a clear-cut choice about the future direction of Irish
nationalism. As the Meath Chronicle (21 December 1918, p.1) put it:
“…the ballot boxes will reveal whether the people of Ireland support the historic
claim that our nation should enjoy her rights as an unfettered and independent
Republic or whether Ireland is content to return to the wilderness of
Parliamentarian opportunism.”
That the election was more akin to a referendum on the future direction of Irish Nationalism is
perhaps most evident in the returns for the two-seat constituency of Cork City, where each
voter was given two votes to distribute to any of the six candidates (two Sinn Féin, two IPP
and two Unionists). In the end, 94% of voters chose two candidates from the same party
(Coakley, 1994 p.43).37 It is clear that the events between 1916 and 1918 led an increasing
number of people to abandon support for the IPP and back the more radical form of nationalism
36 In fact less than one third of the 103 Irish MPs returned in 1918 attended. The Unionists, although invited, did
not attend. Many other Sinn Féin MPs were unable to attend, it was noted, as they were declared 'faoi ghlas ag
Gallaibh' – imprisoned by the foreigner (Farrell, 1994 p.2). 37 Sinn Féin took both seats with 68% of the votes cast.

33
offered by Sinn Féin. Although it is difficult to say with certainty how and why people voted
in 1918, the results of this paper suggest that, even without a change in the franchise, the
election of 1918 would still have marked a turning point in Irish history. In short, the Sinn Féin
victory in 1918 can be seen as a change of heart among the Irish electorate, not a change in
composition. More generally, it demonstrates that dramatic electoral outcomes do not require
dramatic changes in political participation.
References
Ahrens, A., Hansen, C.B., & Schaffer, M.E. (2019). lassopack: Model selection and prediction
with regularized regression in Stata. arxiv:1901.05397.
Aidt, T. S. and B. Dallal (2008). Female voting power: the contribution of women's suffrage to
the growth of social spending in Western Europe (1869-1960). Public Choice 134 (3), 391-
417.
Aidt, T. S., M. Daunton, and J. Dutta (2010). The retrenchment hypothesis and the extension
of the franchise in England and Wales. The Economic Journal 120 (547), 990-1020.
Aidt, T. S. and P. S. Jensen (2013). Democratization and the size of government: evidence from
the long 19th century. Public Choice 157 (3), 511-542.
Aidt, T. S., and Mooney, G. (2014). Voting suffrage and the political budget cycle: Evidence
from the London Metropolitan Boroughs 1902–1937. Journal of Public Economics, 112, 53-
71.
Audickas, L., Hawkins, O. and Cracknell, R. (2017). UK Election Statistics: 1918-2017. House
of Commons briefing paper, CBP7529.

34
Berlinski, S. and T. Dewan (2011), "The Political Consequences of Franchise Extension:
Evidence from the Second Reform Act", Quarterly Journal of Political Science Vol. 6: No. 3–
4, 329-376.
Blackburn, R. (2011), Laying the Foundations of the Modern Voting System: The
Representation of the People Act 1918. Parliamentary History, 30 33-52.
Boak, H. L. (1989). Our last hope; women's votes for Hitler: A reappraisal. German Studies
Review 12 (2), 289-310.
Caramani, D. (2004). The Nationalization of Politics: The Formation of National Electorates
and Party Systems in Western Europe. Cambridge Studies in Comparative Politics. Cambridge
University Press.
Clancy, J.J. (1899). A Handbook of Local Government in Ireland, Sealy, Bryers and Walker,
Dublin.
Coakley, J. (1994). The election that made the first Dáil. In B. Farrell (Ed.), The Creation of
the Dáil, Chapter 3, pp. 31-44. Dublin: Blackwater Press.
Coleman, M. (2013). The Irish Revolution, 1916-1923. Seminar Studies in History. Taylor &
Francis.
Collins, L. (2016). 1916: The Rising Handbook. O'Brien Press.
Corder, J. K., and Wolbrecht, C. (2006). Political Context and the Turnout of New Women
Voters after Suffrage. Journal of Politics, 68 (1), 34-49.
Craig, F. (1976). British Electoral Facts 1885-1975. Palgrave Macmillan UK.
Cunningham, H. (2014). The Challenge of Democracy: Britain 1832-1918. New History of
Britain. Taylor & Francis.

35
de Bromhead, A. (2018). Women voters and trade protectionism in the interwar years. Oxford
Economic Papers 70 (1), 22-46.
Doris, W. (1918). Letter to John Dillon, 13 December. TCD, DP, MS 6753/362.
Evans, G. (1999). The End of Class Politics? Class Voting in Comparative Context. Oxford
scholarship online. Oxford University Press.
Farrell, B. (1971). The founding of Dáil Éireann: parliament and nation building, Volume 2.
Gill and Macmillan.
Ferriter, D. (2018). Sinn Féin and the Conscription Crisis, The Irish Times, 24 April.
Fernihough, A. and Ó'Gráda, C. (2018). Population and Poverty in Ireland on the Eve of the
Great Famine. Available at SSRN 3296291.
Fernihough, A., Ó'Gráda, C. and Walsh, B.M. (2015). Intermarriage in a divided society:
Ireland a century ago, Explorations in Economic History, vol. 56, 1-14.
Fitzpatrick, D. (1978). The geography of Irish nationalism 1910-1921. Past & Present (78),
113-144.
Fujiwara, T. (2015). Voting technology, political responsiveness, and infant health: Evidence
from Brazil. Econometrica, 83(2), 423-464.
Garvin, T. (1981). The Evolution of Irish Nationalist Politics. Holmes & Meier.
Gerould, K. F. (1925). Some American Women and the Vote. Scribner’s Magazine 127 (May),
449–52.
Gregory, I, Cunningham, N, Lloyd, C, Shuttleworth, I & Ell, P (2014). Troubled geographies:
a spatial history of religion and society in Ireland. Spatial Humanities, Indiana University Press,
Bloomington, Ind.

36
Groemping, U. (2006) Relative Importance for Linear Regression in R: The Package relaimpo,
Journal of Statistical Software17, Issue 1. Downloadable at http://www.jstatsoft.org/v17/i01
Henry, R.M. (1920). The Evolution of Sinn Fein. NY Huebsch, London.
Honohan, Patrick, and Brendan Walsh (2002). "Catching up with the leaders: the Irish
hare." Brookings Papers on Economic Activity 2002.1 (2002): 1-57.
Jackson, J.E. (2002). “A Seemingly Unrelated Regression Model for Analyzing Multiparty
Elections.” Political Analysis, vol. 10, no. 1, 49–65.
Johnson, S. (19917). Johnson’s Atlas & Gazetteer of the Railways of Ireland, Leicester, UK:
Midland.
Laffan, M. (2005). The Resurrection of Ireland: The Sinn Féin Party, 1916-1923. Cambridge
University Press.
Lee, J. J. (1989). Ireland, 1912-1985: Politics and Society. Cambridge University Press.
Lehmann-Hasemeyer, S., Hauber, P., and Opitz, A. (2014). The Political Stock Market in the
German Kaiserreich — Do Markets Punish the Extension of the Suffrage to the Benefit of the
Working Class? Evidence from Saxony. The Journal of Economic History, 74(4), 1140-1167
Lindeman, R.H., Merenda, P.F. and Gold, R.Z. (1980) Introduction to Bivariate and
Multivariate Analysis, Glenview IL: Scott, Foresman.
Lindert, P. (2004). Growing Public: Volume 1, The Story: Social Spending and Economic
Growth Since the Eighteenth Century. Growing Public. Cambridge University Press.
Lott, Jr, J. R. and L. W. Kenny (1999). Did women's suffrage change the size and scope of
government? Journal of Political Economy 107 (6), 1163-1198.
37
McConnel, J. (2004). The franchise factor in the defeat of the Irish Parliamentary Party, 1885-
1918. The Historical Journal 47 (2), 355-377.
McManus, M. (2013). The Republic of Ireland in Chandler, J.A. (ed.), Local Government in
Liberal Democracies: An Introductory Survey. Routledge, 28-52.
Merriam, C. E., and H. F. Gosnell (1924). Non-voting: Causes and Methods of Control.
University of Chicago Press.
Mill, H.R. and M. de Carle S. Salter (1919) British Rainfall, 1918 available from UK Met
Office, https://digital.nmla.metoffice.gov.uk/ accessed Sept 2018.
Miller, D. (1973). Church, State, and Nation in Ireland, 1898-1921. University of Pittsburgh
Press.
Miller, G. (2008). Women's suffrage, political responsiveness, and child survival in American
history. The Quarterly Journal of Economics, 123 (3), 1287-1327.
Muggeridge, A., (2018). The Missing Two Million: The Exclusion of Working-class Women
from the 1918 Representation of the People Act. Revue Française de Civilisation Britannique.
French Journal of British Studies, 23(XXIII-1).
Murphy, W. (2017). Imprisonment, 1915-1918 in J. Crowley, D. O Drisceoil, and M. Murphy
(eds) Atlas of the Irish Revolution, NYU Press, 319-322.
Murphy, W. (2014). Political Imprisonment and the Irish, 1912-1921, Oxford University Press.
Neary, P. (1984). The Failure of Economic Nationalism. The Crane Bag, 8 (1), 68-77.
Nic Dháibhéid, C. (2012). The Irish National Aid Association and the radicalization of public
opinion in Ireland, 1916–1918, The Historical Journal, 55, 705–729

38
Niemi, R. G., H. W. Stanley, and C. L. Evans (1984). Age and Turnout Among the Newly
Enfranchised: Life Cycle versus Experience Effects. European Journal of Political Research
12 (December): 371-386.
Ogg, F. A. (1918). The British Representation of the People Act. The American Political
Science Review 12 (3), 498-503.
Polanyi, K. (1944). The great transformation: The political and economic origin of our time.
Beacon Press.
Registrar-General for Ireland (1919). Annual Report of the Registrar-General for Ireland,
HMSO available at https://www.nisra.gov.uk/sites/nisra.gov.uk/files/publications/1918.pdf
(accessed October 2018).
Sinn Féin (1918). General election manifesto to the Irish people - an mórthoghadh feisirí
gairmscoile do mhuintir na heireann. Sinn Féin.
Tanner, D. (2003). Political Change and the Labour Party 1900-1918. Cambridge University
Press.
Townshend, C. (2013). The Republic: The Fight for Irish Independence, 1918-1923. Penguin
Books Limited.
Travers, P. (2017). The Conscription Crisis and the General Election of 1918 in J. Crowley, D.
O Drisceoil, and M. Murphy (eds) Atlas of the Irish Revolution, NYU Press, 323-329.
Turner, J. (1987). The labour vote and the franchise after 1918: an investigation of the English
evidence. In P. Denley and D. Hopkin (Eds.), History and Computing, Chapter 23, p. 136-146.
Manchester University Press.
39
UK Parliament (1918). Parliamentary and Local Government Electors (United Kingdom).
Return to an Address of the Honourable the House of Commons, (138) xix, 925, 16 October.
House of Commons accounts and papers. Proquest LLC.
UK Parliament (2016). General election turnout. www.parliament.uk. Accessed Jan 2018.
van Leeuwen, M. and I. Maas (2011). Hisclass: A Historical International Social Class
Scheme. G – Reference Information and Interdisciplinary Subjects Series. Leuven University
Press.
United Irish League, & Irish Parliamentary Party (1918). Irish Party manifesto: Appeal to the
people. Dublin: United Irish League.
Ward, A. J. (1974). Lloyd George and the 1918 Irish conscription crisis. The Historical Journal
17 (1), 107-129.
Ward, M. (2017). Feminism and Nationalism: women and political activism in J. Crowley, D.
O Drisceoil, and M. Murphy (eds) Atlas of the Irish Revolution, NYU Press, 134-137.
Wheatley, M. (2005). Nationalism and the Irish Party: Provincial Ireland 1910-1916. OUP
Oxford.
Wilson, M.F.J., O'Connell, B., Brown, C., Guinan, J.C., Grehan, A.J. (2007). Multiscale terrain
analysis of multibeam bathymetry data for habitat mapping on the continental slope. Marine
Geodesy 30: 3-35).
Wooldridge, J.M. (2004). Econometric Analysis of Cross Section and Panel Data. Boston,
MA: Massachusetts Institute of Technology.
Voucharas, G. and D. Xefteris (2018) Women's Political Power and Environmental Outcomes,
University of Cyprus Working Papers in Economics 07-2018, University of Cyprus Department
of Economics.
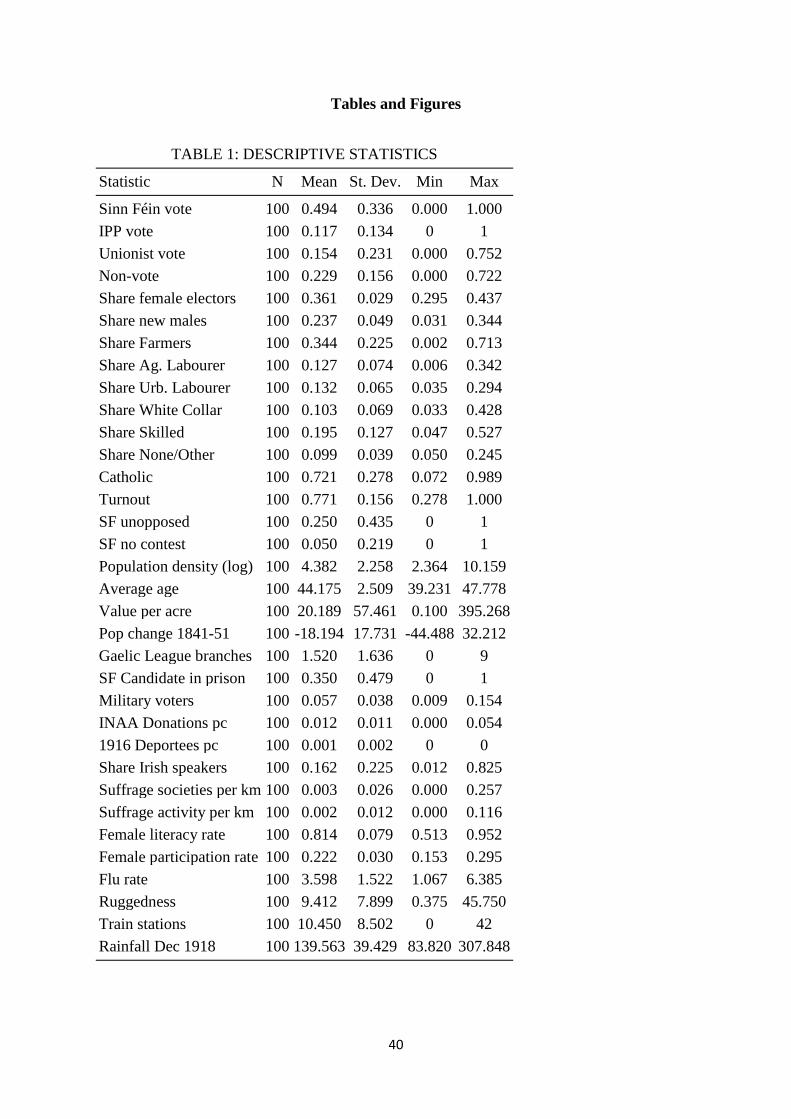
40
Tables and Figures
TABLE 1: DESCRIPTIVE STATISTICS
Statistic N Mean St. Dev. Min Max
Sinn Féin vote 100 0.494 0.336 0.000 1.000
IPP vote 100 0.117 0.134 0 1
Unionist vote 100 0.154 0.231 0.000 0.752
Non-vote 100 0.229 0.156 0.000 0.722
Share female electors 100 0.361 0.029 0.295 0.437
Share new males 100 0.237 0.049 0.031 0.344
Share Farmers 100 0.344 0.225 0.002 0.713
Share Ag. Labourer 100 0.127 0.074 0.006 0.342
Share Urb. Labourer 100 0.132 0.065 0.035 0.294
Share White Collar 100 0.103 0.069 0.033 0.428
Share Skilled 100 0.195 0.127 0.047 0.527
Share None/Other 100 0.099 0.039 0.050 0.245
Catholic 100 0.721 0.278 0.072 0.989
Turnout 100 0.771 0.156 0.278 1.000
SF unopposed 100 0.250 0.435 0 1
SF no contest 100 0.050 0.219 0 1
Population density (log) 100 4.382 2.258 2.364 10.159
Average age 100 44.175 2.509 39.231 47.778
Value per acre 100 20.189 57.461 0.100 395.268
Pop change 1841-51 100 -18.194 17.731 -44.488 32.212
Gaelic League branches 100 1.520 1.636 0 9
SF Candidate in prison 100 0.350 0.479 0 1
Military voters 100 0.057 0.038 0.009 0.154
INAA Donations pc 100 0.012 0.011 0.000 0.054
1916 Deportees pc 100 0.001 0.002 0 0
Share Irish speakers 100 0.162 0.225 0.012 0.825
Suffrage societies per km 100 0.003 0.026 0.000 0.257
Suffrage activity per km 100 0.002 0.012 0.000 0.116
Female literacy rate 100 0.814 0.079 0.513 0.952
Female participation rate 100 0.222 0.030 0.153 0.295
Flu rate 100 3.598 1.522 1.067 6.385
Ruggedness 100 9.412 7.899 0.375 45.750
Train stations 100 10.450 8.502 0 42
Rainfall Dec 1918 100 139.563 39.429 83.820 307.848

41
TABLE 2: UNDERSTANDING THE SINN FÉIN VOTE
Dependent variable:
SF Share Franchise Economic 1916 Opinion 1918 Opinion Long Run All (1) (2) (3) (4) (5) (6)
Share new males 0.001 0.005 (0.007) (0.010)
Share female electors -0.020 -0.027** (0.012) (0.012)
Share Ag. Labourer -0.021 -0.010 (0.019) (0.024)
Share Urb. Labourer 0.003 0.012 (0.016) (0.019)
Share White Collar -0.037** -0.018 (0.015) (0.020)
Share Skilled -0.105** -0.044 (0.043) (0.043)
Share None/Other 0.017 0.021* (0.012) (0.012)
Value per acre (log) 0.015 0.051 (0.025) (0.032)
1916 Deportees pc 0.015** 0.014* (0.006) (0.007)
INAA Donations pc 0.025* 0.021 (0.013) (0.015)
SF Candidate in prison 0.003 -0.002 (0.011) (0.009)
Military voters -0.027* -0.012 (0.016) (0.032)
Pop change 1841-51 -0.054*** -0.051** (0.020) (0.021)
Gaelic League branches -0.025** -0.029** (0.009) (0.013)
Share Irish speakers -0.011 -0.013 (0.013) (0.018)
Baseline Controls Yes Yes Yes Yes Yes Yes
Observations 70 70 70 70 70 70
R2 0.856 0.873 0.866 0.855 0.882 0.920
OLS regressions weighted by electorate. All explanatory variables are standardised using the Z-score
transformation. Cluster robust standard errors in parentheses. All regressions include a constant. Baseline
Controls: Share Catholic, Turnout, Average Age, mean and standard deviation of Household Size. ***p<0.01,
**p<0.05, *p<0.1
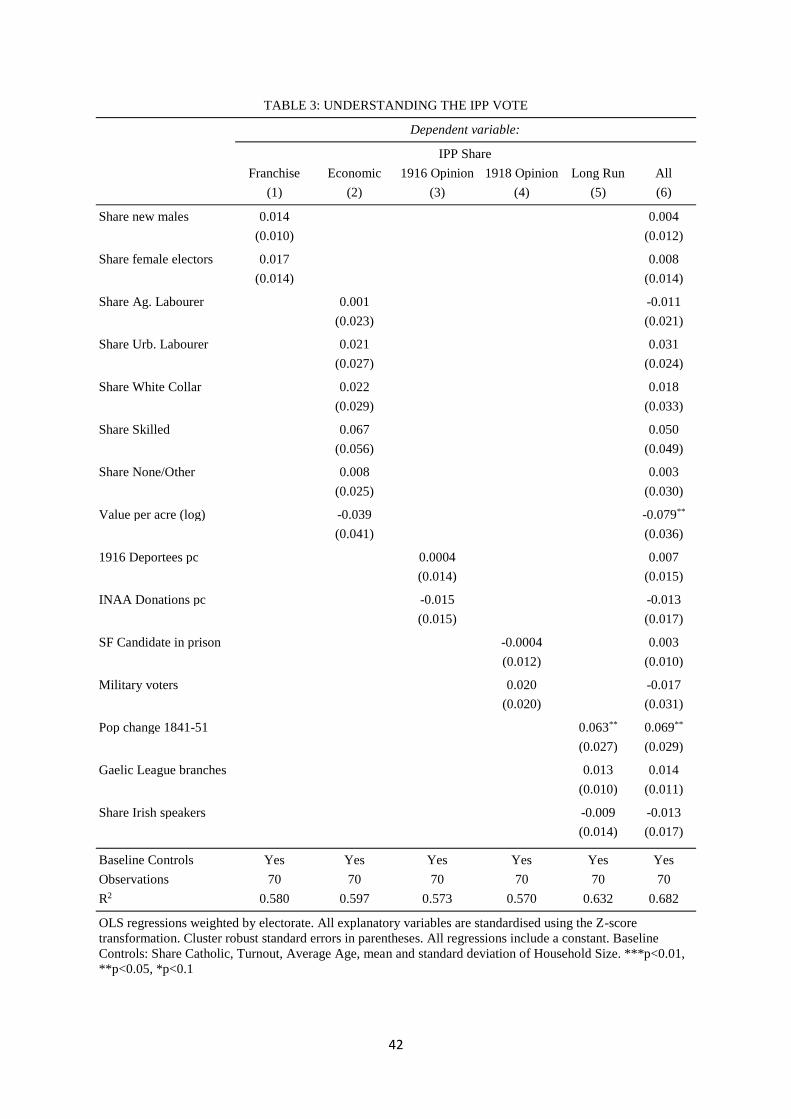
42
TABLE 3: UNDERSTANDING THE IPP VOTE
Dependent variable:
IPP Share Franchise Economic 1916 Opinion 1918 Opinion Long Run All (1) (2) (3) (4) (5) (6)
Share new males 0.014 0.004 (0.010) (0.012)
Share female electors 0.017 0.008 (0.014) (0.014)
Share Ag. Labourer 0.001 -0.011 (0.023) (0.021)
Share Urb. Labourer 0.021 0.031 (0.027) (0.024)
Share White Collar 0.022 0.018 (0.029) (0.033)
Share Skilled 0.067 0.050 (0.056) (0.049)
Share None/Other 0.008 0.003 (0.025) (0.030)
Value per acre (log) -0.039 -0.079** (0.041) (0.036)
1916 Deportees pc 0.0004 0.007 (0.014) (0.015)
INAA Donations pc -0.015 -0.013 (0.015) (0.017)
SF Candidate in prison -0.0004 0.003 (0.012) (0.010)
Military voters 0.020 -0.017 (0.020) (0.031)
Pop change 1841-51 0.063** 0.069** (0.027) (0.029)
Gaelic League branches 0.013 0.014 (0.010) (0.011)
Share Irish speakers -0.009 -0.013 (0.014) (0.017)
Baseline Controls Yes Yes Yes Yes Yes Yes
Observations 70 70 70 70 70 70
R2 0.580 0.597 0.573 0.570 0.632 0.682
OLS regressions weighted by electorate. All explanatory variables are standardised using the Z-score
transformation. Cluster robust standard errors in parentheses. All regressions include a constant. Baseline
Controls: Share Catholic, Turnout, Average Age, mean and standard deviation of Household Size. ***p<0.01,
**p<0.05, *p<0.1
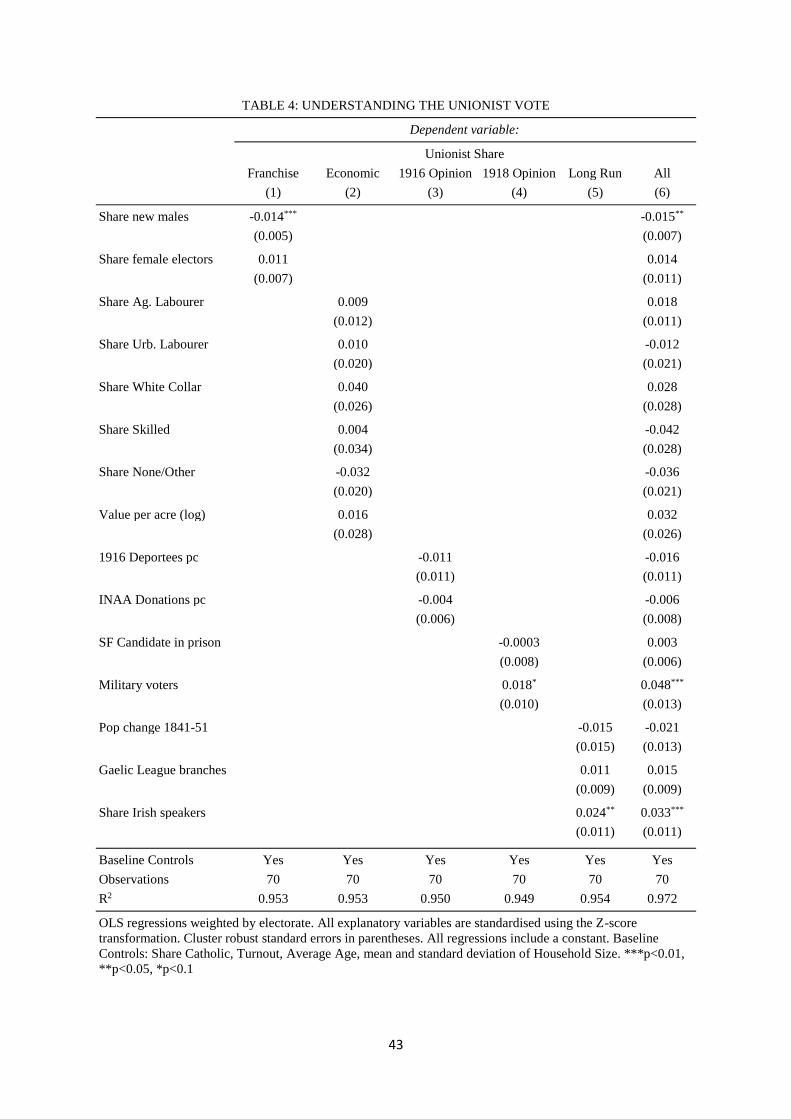
43
TABLE 4: UNDERSTANDING THE UNIONIST VOTE
Dependent variable:
Unionist Share Franchise Economic 1916 Opinion 1918 Opinion Long Run All (1) (2) (3) (4) (5) (6)
Share new males -0.014*** -0.015** (0.005) (0.007)
Share female electors 0.011 0.014 (0.007) (0.011)
Share Ag. Labourer 0.009 0.018 (0.012) (0.011)
Share Urb. Labourer 0.010 -0.012 (0.020) (0.021)
Share White Collar 0.040 0.028 (0.026) (0.028)
Share Skilled 0.004 -0.042 (0.034) (0.028)
Share None/Other -0.032 -0.036 (0.020) (0.021)
Value per acre (log) 0.016 0.032 (0.028) (0.026)
1916 Deportees pc -0.011 -0.016 (0.011) (0.011)
INAA Donations pc -0.004 -0.006 (0.006) (0.008)
SF Candidate in prison -0.0003 0.003 (0.008) (0.006)
Military voters 0.018* 0.048*** (0.010) (0.013)
Pop change 1841-51 -0.015 -0.021 (0.015) (0.013)
Gaelic League branches 0.011 0.015 (0.009) (0.009)
Share Irish speakers 0.024** 0.033*** (0.011) (0.011)
Baseline Controls Yes Yes Yes Yes Yes Yes
Observations 70 70 70 70 70 70
R2 0.953 0.953 0.950 0.949 0.954 0.972
OLS regressions weighted by electorate. All explanatory variables are standardised using the Z-score
transformation. Cluster robust standard errors in parentheses. All regressions include a constant. Baseline
Controls: Share Catholic, Turnout, Average Age, mean and standard deviation of Household Size. ***p<0.01,
**p<0.05, *p<0.1

44
TABLE 5: UNDERSTANDING TURNOUT
Dependent variable:
Non-Voting Franchise Economic Suffrage Movement Environment All (1) (2) (3) (4) (5)
Share new males 0.001 -0.007 (0.007) (0.008)
Share female electors 0.032** 0.036** (0.015) (0.014)
Female literacy rate -0.043*** -0.034*** (0.015) (0.012)
Female participation rate -0.027*** -0.029*** (0.010) (0.009)
Value per acre (log) 0.001 -0.021 (0.018) (0.027)
Suffrage societies per km 0.005 -0.004 (0.005) (0.003)
Suffrage activity per km -0.008** -0.019*** (0.004) (0.005)
Flu rate 0.034* 0.026 (0.019) (0.019)
Ruggedness -0.018 -0.011 (0.011) (0.009)
Train stations 0.002 0.004 (0.013) (0.014)
Rainfall Dec 1918 0.004 0.009 (0.011) (0.012)
Baseline Controls Yes Yes Yes Yes Yes
Observations 75 75 75 75 75
R2 0.172 0.227 0.120 0.162 0.337
OLS regressions weighted by electorate. All explanatory variables are standardised using the Z-score
transformation. Cluster robust standard errors in parentheses. All regressions include a constant. Baseline
Controls: Share Catholic, Turnout, Average Age, mean and standard deviation of Household Size. ***p<0.01,
**p<0.05, *p<0.1

45
TABLE 6: DECOMPOSITION OF SINN FEIN VOTE R-SQUARED BY HYPOTHESES
OLS Ind. Contribution (%) Group Contribution (%) (1) (2) (3)
Share new males 0.008 (0.008) 2.158 10.304
Share female voters -0.027** (0.012) 7.722
Share Ag. Labourer -0.016 (0.020) 1.740 19.534
Share Urb. Labourer 0.011 (0.019) 2.521
Share White Collar -0.020 (0.022) 1.620
Share Skilled -0.050 (0.043) 8.034
Share None/Other 0.022* (0.012) 2.269
Value per acre (log) 0.045 (0.030) 3.445
1916 Deportees 0.012 (0.007) 2.461 14.299
INAA Donations pc 0.019 (0.014) 12.318
SF Candidate in prison -0.003 (0.008) 1.426 7.053
Military voters -0.014 (0.031) 4.979
Pop change 1841-51 -0.050** (0.019) 9.109 11.645
Gaelic League branches -0.026** (0.011) 1.836
Share Irish speakers -0.014 (0.017) 1.402
Catholic 0.111*** (0.019) 32.966 37.165
Turnout 0.016 (0.010) 0.570
Mean Household size 0.006 (0.014) 0.323
SD Household size -0.005 (0.004) 0.380
Average age -0.009 (0.029) 2.720
Constant 0.349*** (0.007)
Observations 70
R2 0.918
Table depicts individual variables’ contribution to the overall R2 from the “Understanding
Sinn Féin Vote” analysis. Column 1 replicates that analysis. Columns 2 and 3 present the
individual variables’ and group hypotheses’ share of the R2 statistic from Column 1.
***p<0.01, **p<0.05, *p<0.1
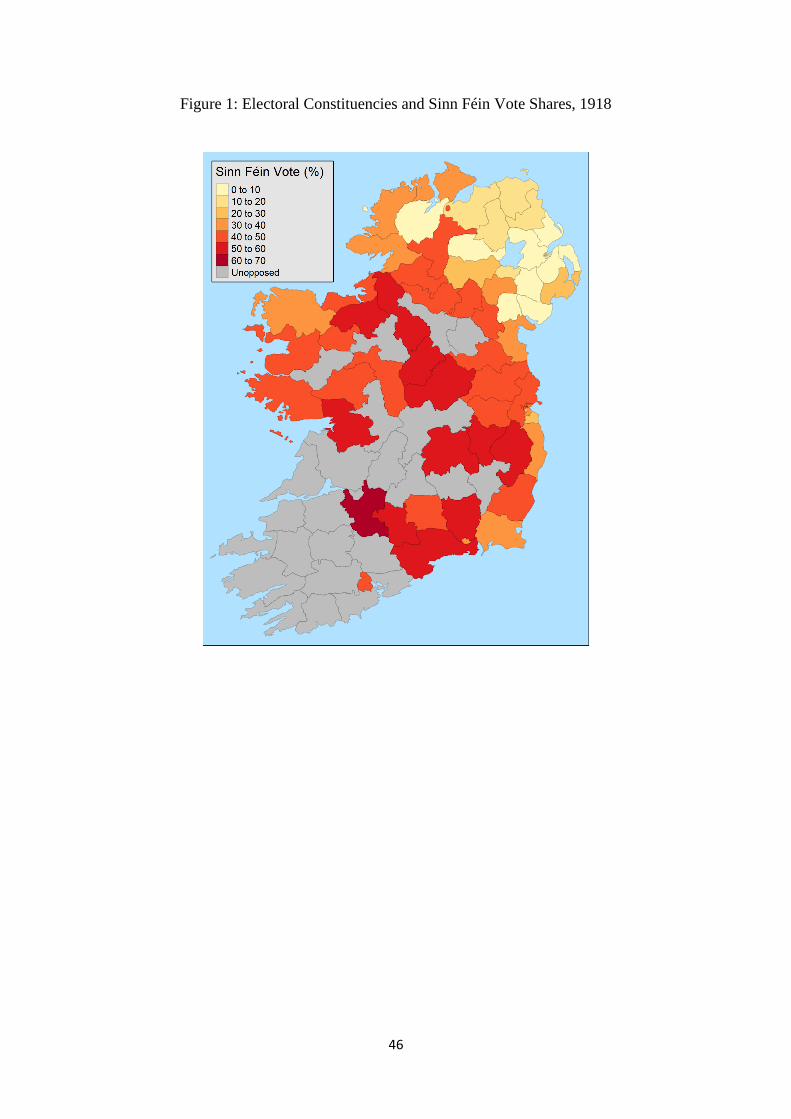
46
Figure 1: Electoral Constituencies and Sinn Féin Vote Shares, 1918
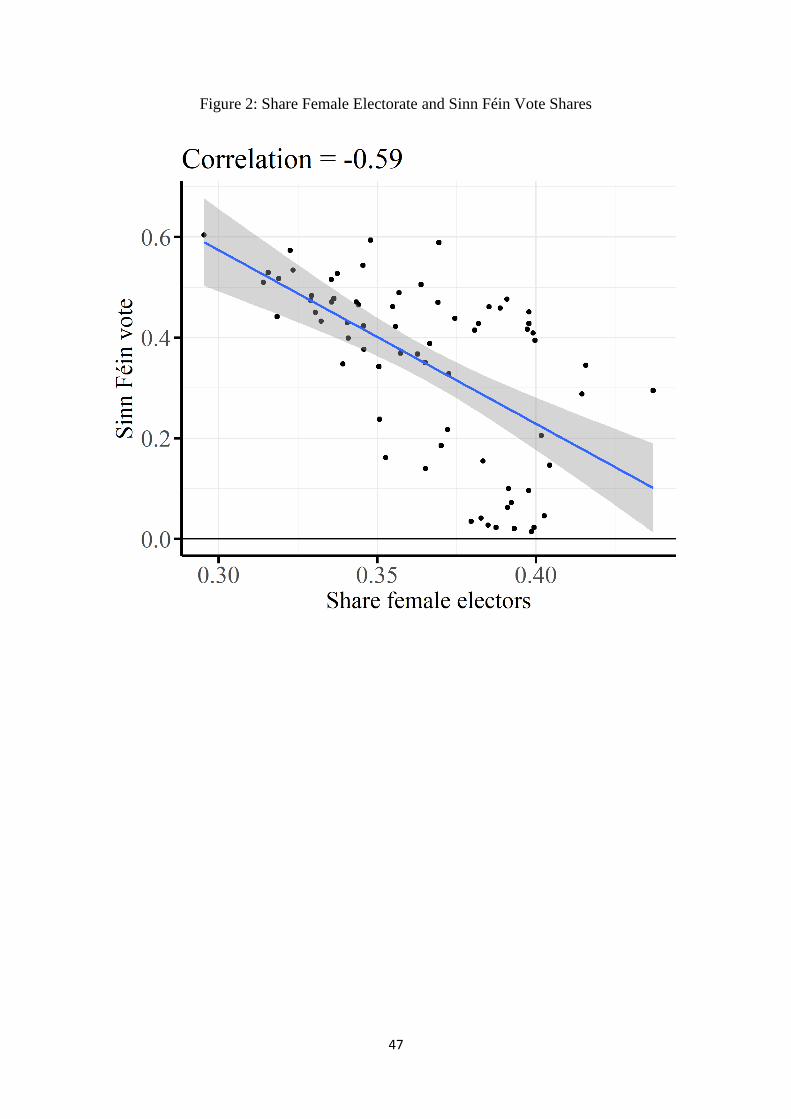
47
Figure 2: Share Female Electorate and Sinn Féin Vote Shares
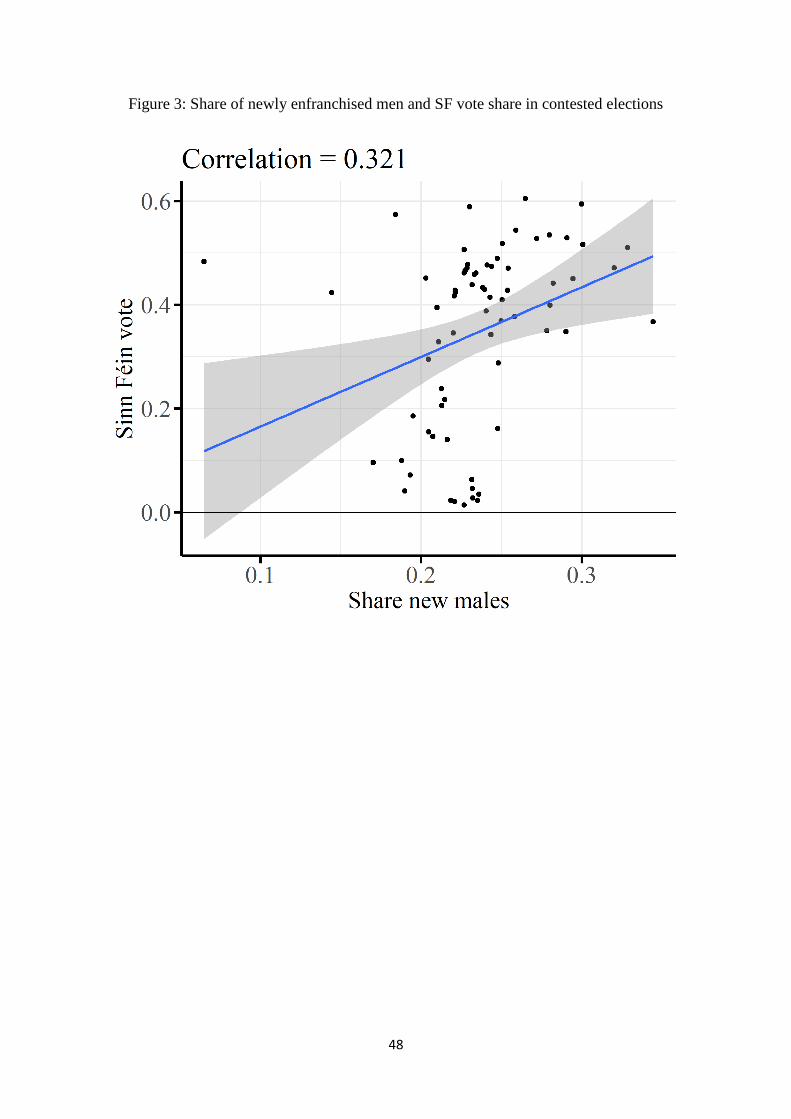
48
Figure 3: Share of newly enfranchised men and SF vote share in contested elections
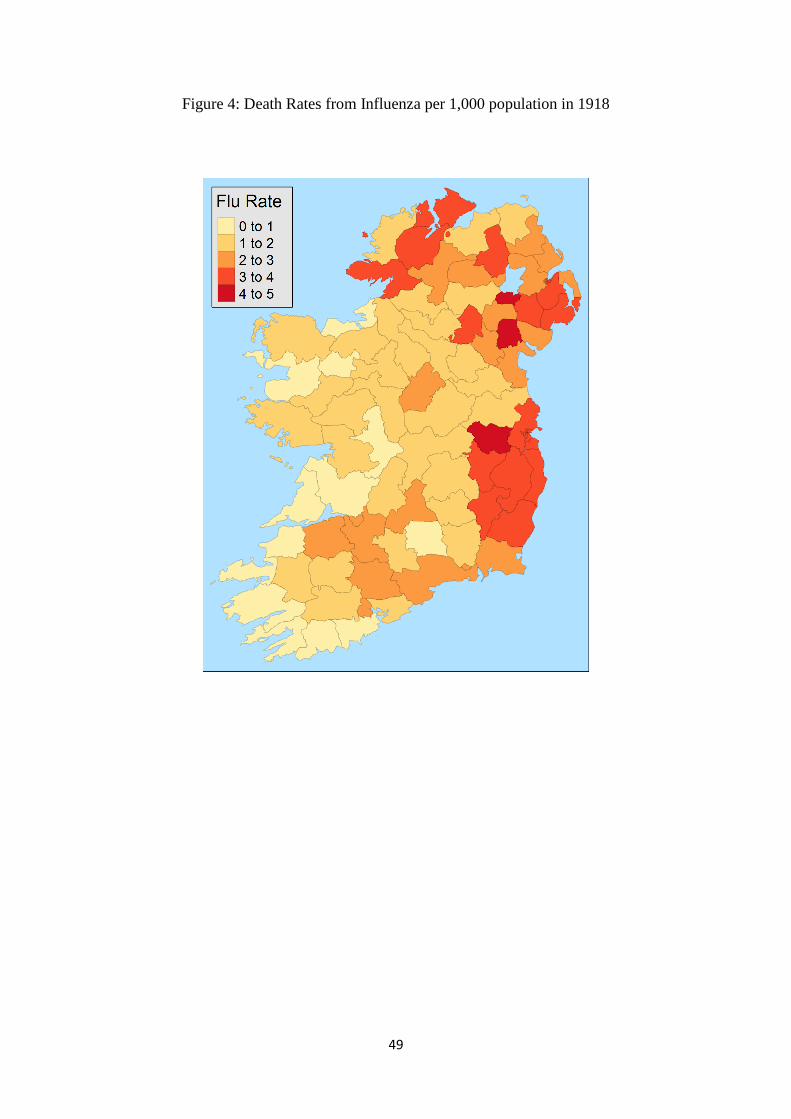
49
Figure 4: Death Rates from Influenza per 1,000 population in 1918

50
Figure 5: Actual versus predicted male electorate
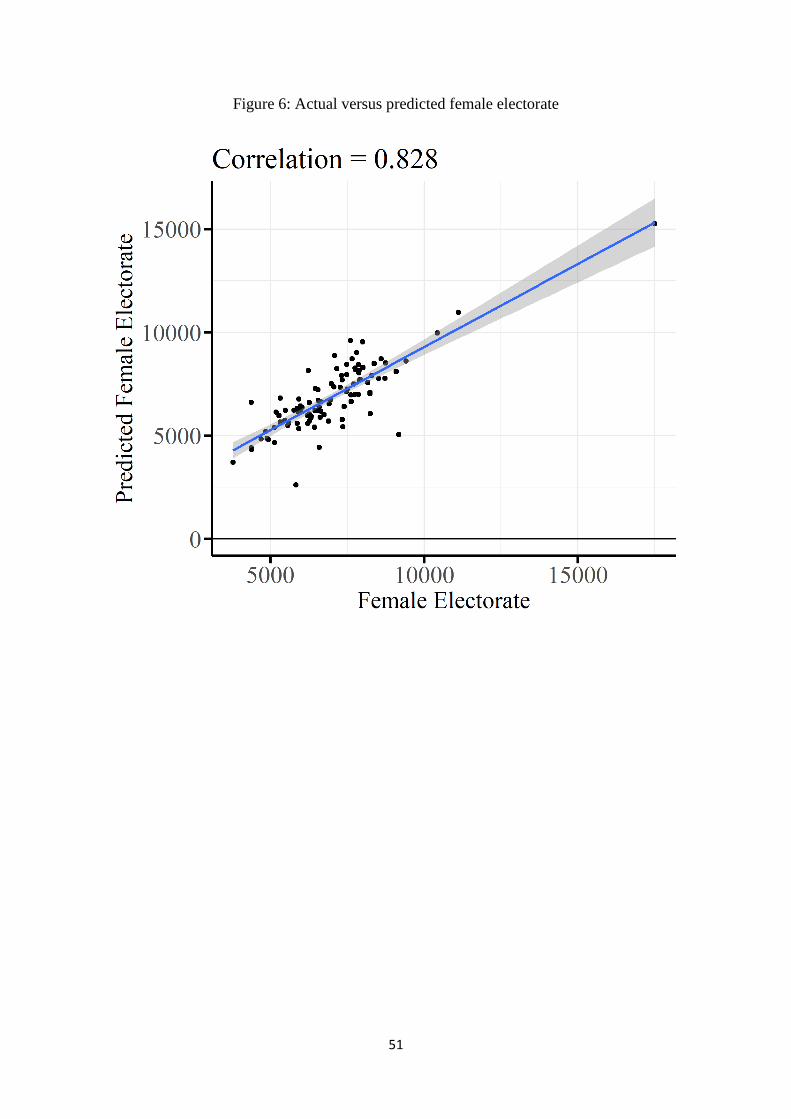
51
Figure 6: Actual versus predicted female electorate

52
Appendix
Table A1: Machine Learning Variable Selection – Sinn Féin
(1) (2) (3) (4) (5)
Baseline
OLS
Ridge
Regression
Baseline
Lasso
Square-root
Lasso
Heteroskedastic
Lasso
Share new males 0.19 0.24
Share female voters -0.89 -1.05 -0.44 -0.82 -0.38
Share Ag. Labourer -0.20 -0.11
Share Urb. Labourer 0.16 0.16
Share White Collar -0.25 -0.068
Share Skilled -0.36 -0.14
Share None/Other 0.50 0.38 0.29
Value per acre (log) 0.020 0.0076
1916 Deportees 4.12 5.62 3.73
INAA Donations pc 2.10 2.87 2.37 1.78 1.23
SF Candidate in prison -0.0071 0.0063
Military voters -0.34 -0.42
Pop change 1841-51 -0.0027 -0.0020 -0.00091 -0.0019 -0.00035
Gaelic League branches -0.019 -0.013 -0.011
Share Irish speakers -0.063 -0.024 -0.028
Constant 0.34 0.40 0.22 0.24 0.20
Observations 70 70 70 70 70
Table A2: Machine Learning Variable Selection – IPP
(1) (2) (3) (4) (5)
Baseline
OLS
Ridge
Regression
Baseline
Lasso
Square-root
Lasso
Heteroskedastic
Lasso
Share new males 0.10 0.29 0.13
Share female voters 0.26 0.038
Share Ag. Labourer -0.14 -0.0074
Share Urb. Labourer 0.44 0.22 0.053
Share White Collar 0.24 -0.0021
Share Skilled 0.36 -0.014
Share None/Other 0.069 0.088
Value per acre (log) -0.036 -0.0024
1916 Deportees 2.41 1.77
INAA Donations pc -1.40 0.90
SF Candidate in prison 0.0057 0.0094
Military voters -0.44 0.018
Pop change 1841-51 0.0038 0.0012 0.0020
Gaelic League branches 0.010 0.0041
Share Irish speakers -0.059 0.018
Constant -0.43 -0.0071 0.016 0.069 0.028
Observations 70 70 70 70 70
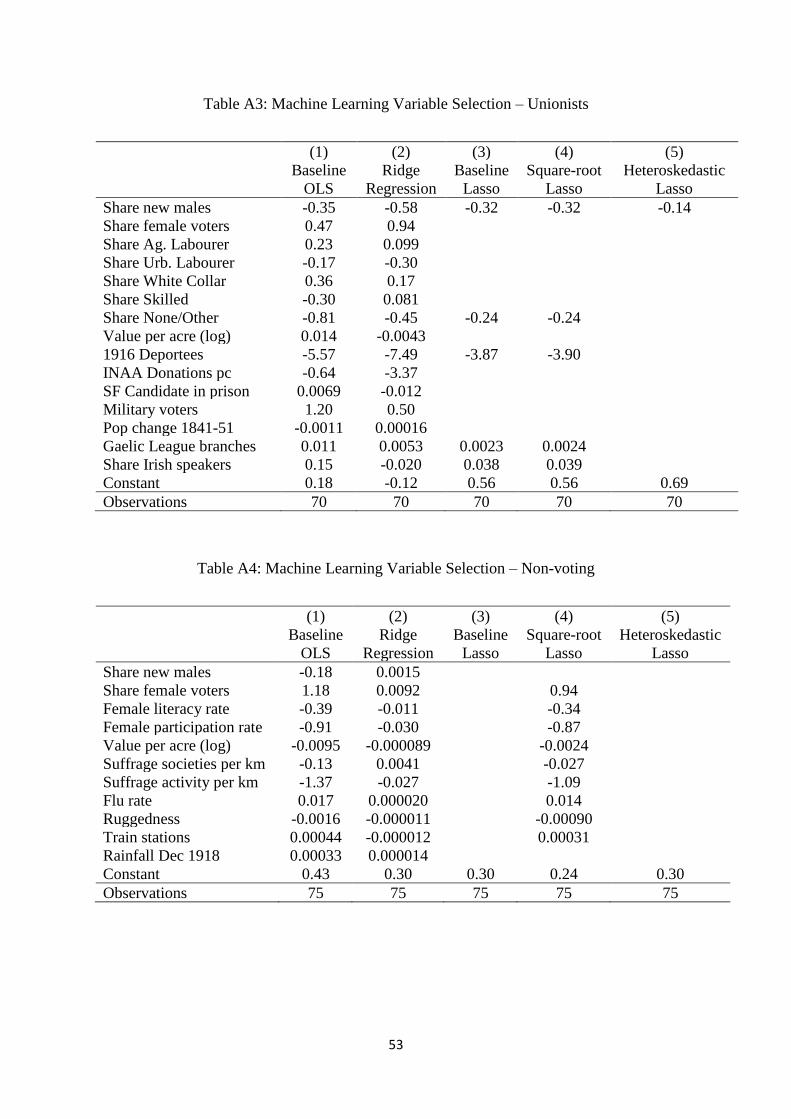
53
Table A3: Machine Learning Variable Selection – Unionists
(1) (2) (3) (4) (5)
Baseline
OLS
Ridge
Regression
Baseline
Lasso
Square-root
Lasso
Heteroskedastic
Lasso
Share new males -0.35 -0.58 -0.32 -0.32 -0.14
Share female voters 0.47 0.94
Share Ag. Labourer 0.23 0.099
Share Urb. Labourer -0.17 -0.30
Share White Collar 0.36 0.17
Share Skilled -0.30 0.081
Share None/Other -0.81 -0.45 -0.24 -0.24
Value per acre (log) 0.014 -0.0043
1916 Deportees -5.57 -7.49 -3.87 -3.90
INAA Donations pc -0.64 -3.37
SF Candidate in prison 0.0069 -0.012
Military voters 1.20 0.50
Pop change 1841-51 -0.0011 0.00016
Gaelic League branches 0.011 0.0053 0.0023 0.0024
Share Irish speakers 0.15 -0.020 0.038 0.039
Constant 0.18 -0.12 0.56 0.56 0.69
Observations 70 70 70 70 70
Table A4: Machine Learning Variable Selection – Non-voting
(1) (2) (3) (4) (5)
Baseline
OLS
Ridge
Regression
Baseline
Lasso
Square-root
Lasso
Heteroskedastic
Lasso
Share new males -0.18 0.0015
Share female voters 1.18 0.0092 0.94
Female literacy rate -0.39 -0.011 -0.34
Female participation rate -0.91 -0.030 -0.87
Value per acre (log) -0.0095 -0.000089 -0.0024
Suffrage societies per km -0.13 0.0041 -0.027
Suffrage activity per km -1.37 -0.027 -1.09
Flu rate 0.017 0.000020 0.014
Ruggedness -0.0016 -0.000011 -0.00090
Train stations 0.00044 -0.000012 0.00031
Rainfall Dec 1918 0.00033 0.000014
Constant 0.43 0.30 0.30 0.24 0.30
Observations 75 75 75 75 75

54
TABLE A5: Understanding where Sinn Féin was unopposed
Dependent variable:
SF Unopposed Franchise Economic 1916 Opinion 1918 Opinion Long Run All (1) (2) (3) (4) (5) (6)
Share new males -0.010 -0.006 (0.013) (0.012)
Share female electors -0.050 0.001 (0.043) (0.030)
Share Ag. Labourer 0.051 0.046 (0.059) (0.035)
Share Urb. Labourer -0.059 -0.066 (0.087) (0.080)
Share White Collar 0.023 0.042 (0.085) (0.063)
Share Skilled 0.037 0.077 (0.155) (0.140)
Share None/Other -0.017 0.027 (0.091) (0.031)
Value per acre (log) -0.026 -0.012 (0.075) (0.084)
1916 Deportees pc -0.081 -0.046 (0.059) (0.050)
INAA Donations pc 0.047 0.013 (0.032) (0.016)
SF Candidate in prison 0.0002 -0.008 (0.054) (0.034)
Military voters -0.068 -0.001 (0.061) (0.043)
Pop change 1841-51 -0.141 -0.088 (0.089) (0.055)
Gaelic League branches -0.004 -0.006 (0.020) (0.013)
Share Irish speakers -0.039 -0.010 (0.040) (0.019)
Baseline Controls Yes Yes Yes Yes Yes Yes
Observations 100 100 100 100 100 100
Logit regression marginal effects. All explanatory variables are standardised using the Z-score transformation.
Cluster robust standard errors in parentheses. All regressions include a constant. Baseline Controls: Share
Catholic, Average Age, mean and standard deviation of Household Size. ***p<0.01, **p<0.05, *p<0.1

55
Table A6: Seemingly Unrelated Regressions – Franchise
Vote Shares
SF IPP Unionist Non-voting (1) (2) (3) (4)
Share new males -0.008 0.023 -0.016** 0.002 (0.014) (0.017) (0.008) (0.012)
Share female electors -0.042* 0.025 -0.014 0.031 (0.025) (0.025) (0.010) (0.021)
Baseline Controls Yes Yes Yes Yes
Observations 75 75 75 75
R2 0.714 0.409 0.937 0.135
Restricted SUR regressions. All explanatory variables are standardised using the Z-score
transformation. Cluster bootstrap standard errors in parentheses. All regressions include a
constant. Baseline Controls: Share Catholic, Turnout, Average Age, mean and standard
deviation of Household Size. ***p<0.01, **p<0.05, *p<0.1

56
Table A7: Seemingly Unrelated Regressions – Economic
Vote Shares
SF IPP Unionist Non-voting (1) (2) (3) (4)
Share Ag. Labourer 0.007 -0.005 0.031** -0.034 (0.031) (0.032) (0.014) (0.027)
Share Urb. Labourer -0.009 0.042 -0.017 -0.015 (0.037) (0.033) (0.023) (0.027)
Share White Collar -0.039 0.061 0.034 -0.055 (0.065) (0.056) (0.028) (0.055)
Share Skilled -0.110* 0.102* 0.046 -0.038 (0.066) (0.060) (0.051) (0.066)
Share None/Other 0.022 -0.004 -0.037* 0.020 (0.030) (0.032) (0.019) (0.030)
Value per acre (log) 0.036 -0.062 0.030 -0.004 (0.043) (0.046) (0.033) (0.039)
Baseline Controls Yes Yes Yes Yes
Observations 75 75 75 75
R2 0.725 0.457 0.948 0.163
Restricted SUR regressions. All explanatory variables are standardised using the Z-score
transformation. Cluster bootstrap standard errors in parentheses. All regressions include a
constant. Baseline Controls: Share Catholic, Turnout, Average Age, mean and standard
deviation of Household Size. ***p<0.01, **p<0.05, *p<0.1
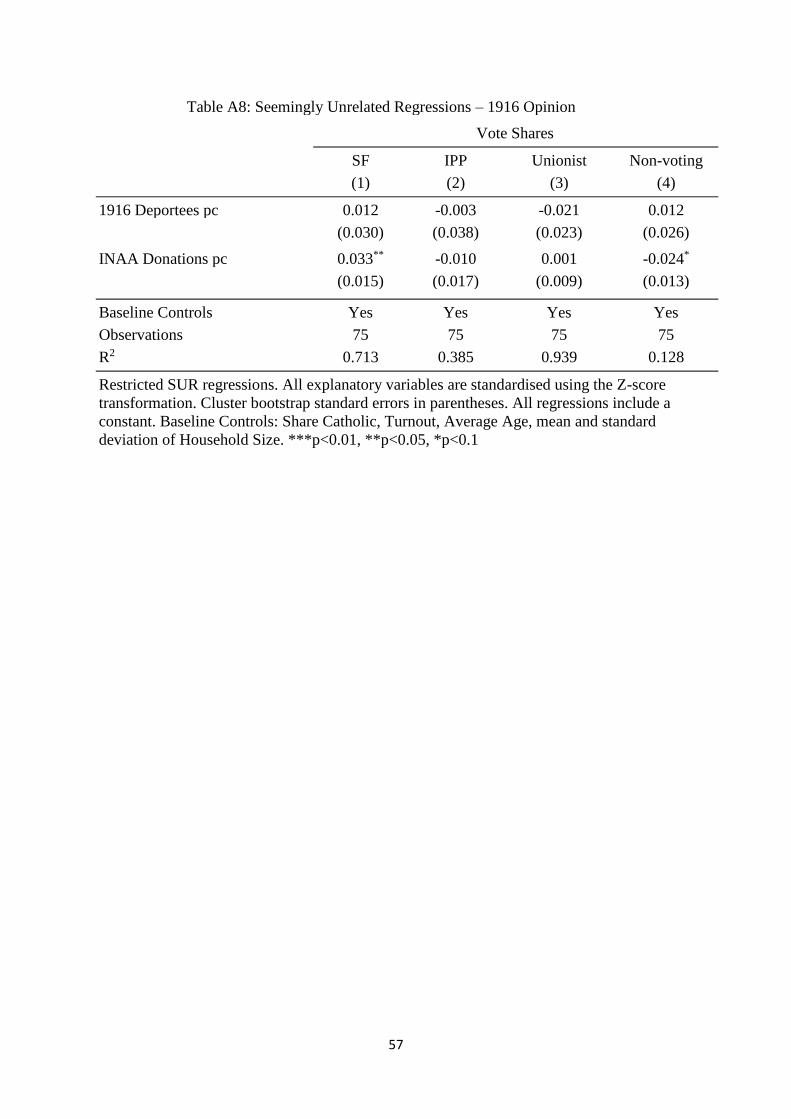
57
Table A8: Seemingly Unrelated Regressions – 1916 Opinion
Vote Shares
SF IPP Unionist Non-voting (1) (2) (3) (4)
1916 Deportees pc 0.012 -0.003 -0.021 0.012 (0.030) (0.038) (0.023) (0.026)
INAA Donations pc 0.033** -0.010 0.001 -0.024* (0.015) (0.017) (0.009) (0.013)
Baseline Controls Yes Yes Yes Yes
Observations 75 75 75 75
R2 0.713 0.385 0.939 0.128
Restricted SUR regressions. All explanatory variables are standardised using the Z-score
transformation. Cluster bootstrap standard errors in parentheses. All regressions include a
constant. Baseline Controls: Share Catholic, Turnout, Average Age, mean and standard
deviation of Household Size. ***p<0.01, **p<0.05, *p<0.1
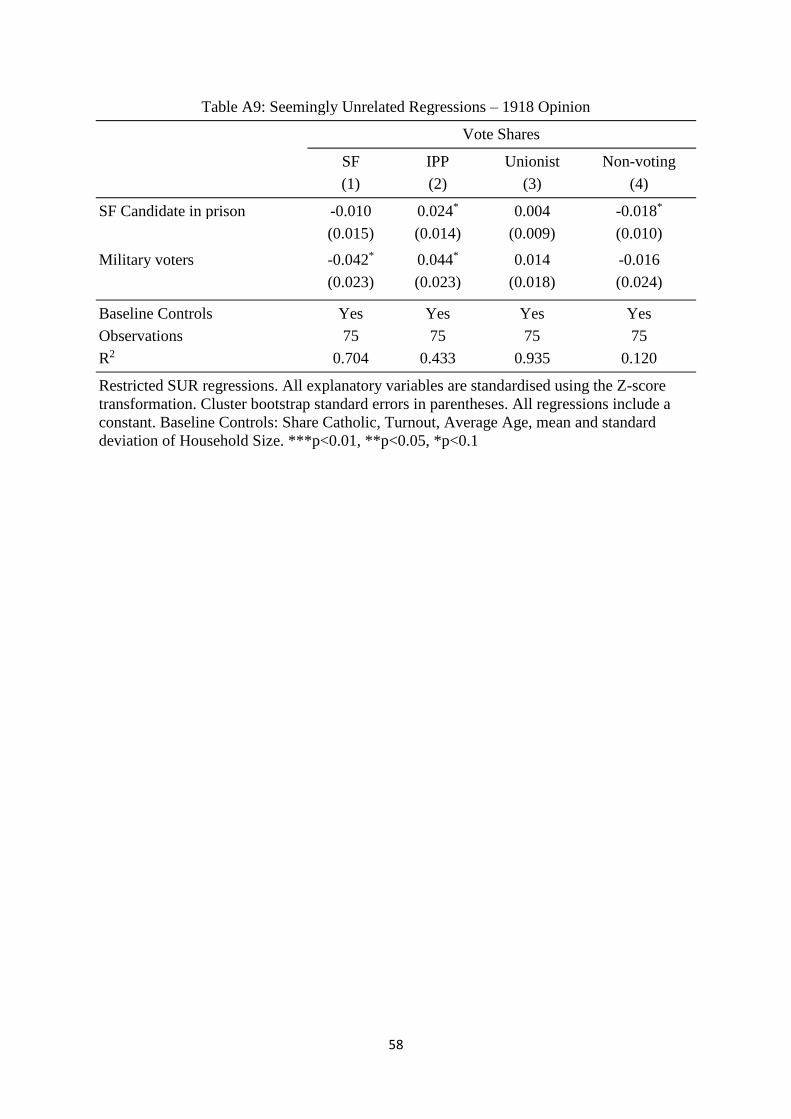
58
Table A9: Seemingly Unrelated Regressions – 1918 Opinion
Vote Shares
SF IPP Unionist Non-voting (1) (2) (3) (4)
SF Candidate in prison -0.010 0.024* 0.004 -0.018* (0.015) (0.014) (0.009) (0.010)
Military voters -0.042* 0.044* 0.014 -0.016 (0.023) (0.023) (0.018) (0.024)
Baseline Controls Yes Yes Yes Yes
Observations 75 75 75 75
R2 0.704 0.433 0.935 0.120
Restricted SUR regressions. All explanatory variables are standardised using the Z-score
transformation. Cluster bootstrap standard errors in parentheses. All regressions include a
constant. Baseline Controls: Share Catholic, Turnout, Average Age, mean and standard
deviation of Household Size. ***p<0.01, **p<0.05, *p<0.1

59
Table A10: Seemingly Unrelated Regressions – Long Run
Vote Shares
SF IPP Unionist Non-voting (1) (2) (3) (4)
Pop change 1841-51 -0.087** 0.085** -0.017 0.019 (0.034) (0.034) (0.020) (0.032)
Gaelic League branches -0.038** 0.020 0.010 0.008 (0.015) (0.016) (0.010) (0.014)
Share Irish speakers -0.019 -0.024 -0.003 0.046* (0.027) (0.022) (0.017) (0.025)
Baseline Controls Yes Yes Yes Yes
Observations 75 75 75 75
R2 0.771 0.485 0.937 0.192
Restricted SUR regressions. All explanatory variables are standardised using the Z-score
transformation. Cluster bootstrap standard errors in parentheses. All regressions include a
constant. Baseline Controls: Share Catholic, Turnout, Average Age, mean and standard
deviation of Household Size. ***p<0.01, **p<0.05, *p<0.1
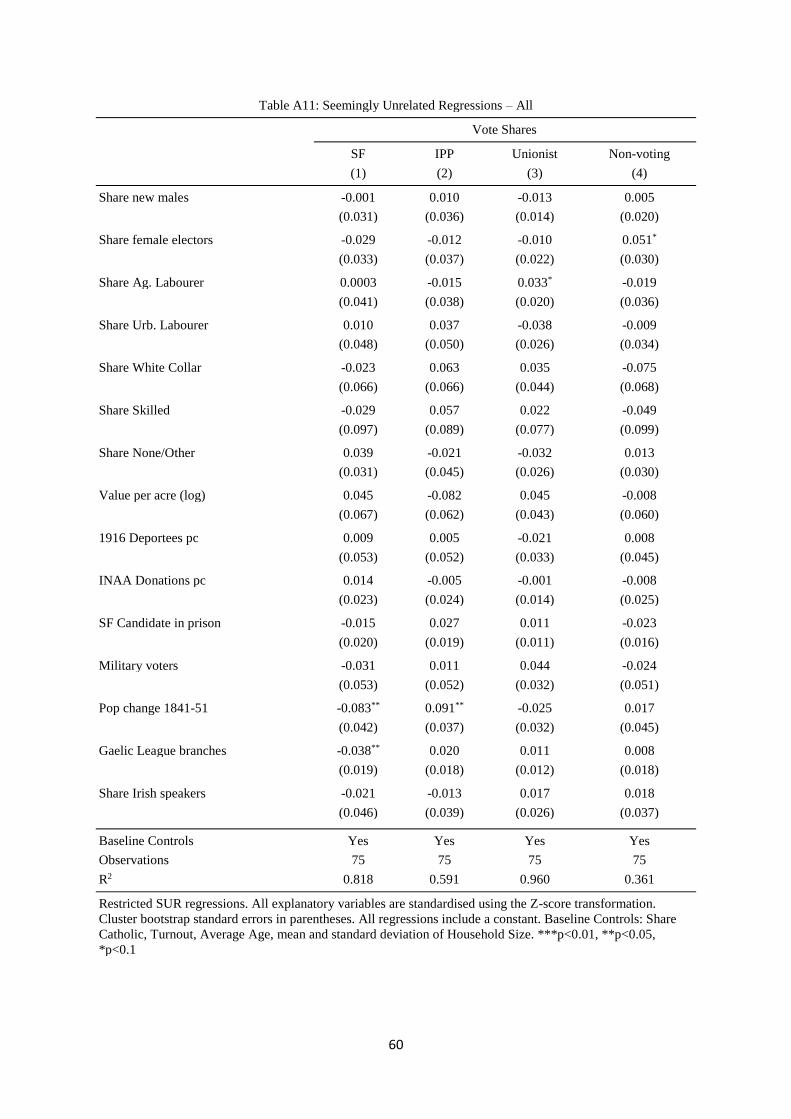
60
Table A11: Seemingly Unrelated Regressions – All
Vote Shares
SF IPP Unionist Non-voting (1) (2) (3) (4)
Share new males -0.001 0.010 -0.013 0.005 (0.031) (0.036) (0.014) (0.020)
Share female electors -0.029 -0.012 -0.010 0.051* (0.033) (0.037) (0.022) (0.030)
Share Ag. Labourer 0.0003 -0.015 0.033* -0.019 (0.041) (0.038) (0.020) (0.036)
Share Urb. Labourer 0.010 0.037 -0.038 -0.009 (0.048) (0.050) (0.026) (0.034)
Share White Collar -0.023 0.063 0.035 -0.075 (0.066) (0.066) (0.044) (0.068)
Share Skilled -0.029 0.057 0.022 -0.049 (0.097) (0.089) (0.077) (0.099)
Share None/Other 0.039 -0.021 -0.032 0.013 (0.031) (0.045) (0.026) (0.030)
Value per acre (log) 0.045 -0.082 0.045 -0.008 (0.067) (0.062) (0.043) (0.060)
1916 Deportees pc 0.009 0.005 -0.021 0.008 (0.053) (0.052) (0.033) (0.045)
INAA Donations pc 0.014 -0.005 -0.001 -0.008 (0.023) (0.024) (0.014) (0.025)
SF Candidate in prison -0.015 0.027 0.011 -0.023 (0.020) (0.019) (0.011) (0.016)
Military voters -0.031 0.011 0.044 -0.024 (0.053) (0.052) (0.032) (0.051)
Pop change 1841-51 -0.083** 0.091** -0.025 0.017 (0.042) (0.037) (0.032) (0.045)
Gaelic League branches -0.038** 0.020 0.011 0.008 (0.019) (0.018) (0.012) (0.018)
Share Irish speakers -0.021 -0.013 0.017 0.018 (0.046) (0.039) (0.026) (0.037)
Baseline Controls Yes Yes Yes Yes
Observations 75 75 75 75
R2 0.818 0.591 0.960 0.361
Restricted SUR regressions. All explanatory variables are standardised using the Z-score transformation.
Cluster bootstrap standard errors in parentheses. All regressions include a constant. Baseline Controls: Share
Catholic, Turnout, Average Age, mean and standard deviation of Household Size. ***p<0.01, **p<0.05,
*p<0.1
61
Variable Descriptions
Sinn Féin vote – Votes cast for Sinn Féin as a share of total parliamentary electorate (ARK
Northern Ireland Elections database https://www.ark.ac.uk/elections/).
IPP vote – Votes cast for Irish Parliamentary Party (including Independent Nationalists) as a
share of total parliamentary electorate (ARK Northern Ireland Elections database
https://www.ark.ac.uk/elections/).
Unionist vote - Votes cast for Unionist Parties (Ulster Unionists, Independent Unionists and
Labour Unionists) as a share of total parliamentary electorate (ARK Northern Ireland Elections
database https://www.ark.ac.uk/elections/).
Non-vote – Non-voters as a share of total parliamentary electorate (ARK Northern Ireland
Elections database https://www.ark.ac.uk/elections/).
Share female electors - Female parliamentary electors as a share of total parliamentary
electorate (UK Parliament, 1918).
Share new males –Male local electors as a share of total parliamentary electorate (UK
Parliament, 1918).
Occupation Shares –Uses the HISCO codes originally created by Fernihough, Ó Gráda, and
Walsh (2015) which are then categorised as a HISCLASS codes. The HISCLASS coding
scheme is then further matched to the occupational classifications used in Connor (2019).
Share Catholic – Catholics as a share of population over 21 years of age (1911 Census of
Ireland).
Turnout – Total votes cast as a share of total parliamentary electorate (ARK Northern Ireland
Elections database https://www.ark.ac.uk/elections/).

62
SF unopposed – Equals one if Sinn Féin were unopposed in a constituency, zero otherwise
(ARK Northern Ireland Elections database https://www.ark.ac.uk/elections/).
SF no contest - Equals one if Sinn Féin did not contest election in a constituency, zero
otherwise (ARK Northern Ireland Elections database https://www.ark.ac.uk/elections/).
Population density (log) – Natural log of population per square kilometre (1911 Census of
Ireland).
Average age – Average of population (1911 Census of Ireland).
Value per acre – Total valuation of constituency divided by acres (1911 Census of Ireland).
Pop change 1841-51 – Median population change (per cent) for all civil parish data lying
within 1918 constituency boundaries. Civil parish data as in Fernihough and Ó Gráda (2018).
Gaelic League branches – Number of Gaelic League Branches in a constituency (data kindly
provided by Dr. Eoin McLaughlin)
SF Candidate in prison - Equals one if Sinn Féin candidate was imprisoned at time of election,
zero otherwise (Travers, 2017).
Military voters - Military parliamentary electors as a share of total parliamentary electorate
(UK Parliament, 1918).
INAA Donations pc – Total value of donations to the INAAVDF scaled by population (source:
see text)
1916 Deportees pc – Number of prisoners deported in the aftermath of 1916 Rising divided
by population (Murphy, 2017).
Share Irish speakers – Irish language speakers as a share of population (1911 Census of
Ireland).

63
Suffrage societies per km - Number of suffrage society branches in constituency in 1913
scaled by area (Ward, 2017).
Suffrage activity per km –Count of incidents of suffrage activities in constituency in 1913
scaled by area (Ward, 2017).
Female literacy rate – Literate females as share of female population aged over 21 (1911
Census of Ireland).
Female participation rate – Employed females as share of female population aged over 21
(1911 Census of Ireland).
Flu rate – Deaths from influenza and pneumonia in 1918 per 1000 population calculated at the
constituency level from Poor Law Union data in Annual Report of the Registrar-General for
Ireland, 1919.
Ruggedness – Terrain Ruggedness Index created from a raster dataset of altitude which
calculates the mean of the absolute differences between the altitude in each cell and the
surrounding 8 cells. The constituency-level variable was created by taking the median of the
index of all raster cells within the parliamentary constituency boundaries (see Wilson et al.,
2007)
Train stations – Number of stations operating in constituency in 1918. Data digitised from
Johnson (1997).
Rainfall Dec 1918 – Total Rainfall in December 1918 (in mm) calculated at the constituency
level based on UK metrological Office data Mill and Salter (1919).

64
Appendix II: Matching of Electoral Divisions to Parliamentary Constituencies – Ireland,
1918
The objective of this exercise was to link DEDs (District Electoral Divisions) from the 1911
census to parliamentary constituencies of the 1918 election. The exercise used two sources to
identify which DEDs should correspond to which parliamentary constituencies based on
whether the constituency boundaries were altered in 1917 from the previous boundaries set in
1885.
Part I (Counties & Boroughs in 1917 Boundary Commission volume):
Down, Dublin County, Galway, Kilkenny, Tyrone, Waterford, Borough of Belfast, and Borough
of Dublin.
N.B. Carlow, King's County (Offaly), Leitrim, Longford, Louth, Queen's County (Laois) and
Westmeath each constituted their own constituency so these constituencies were unambiguous.
1. Name of DED was found in index of DEDs in "General Topographical Index, Ireland,
1901" and the number(s) in the final column "No. in Table VII of Census County
Book 1901" as well as County District was recorded. Link:
https://archive.org/stream/op1254784-1001#page/n993/mode/2up.
2. Located county entry and list of Districts included in each parliamentary constituency
(and/or map) and recorded which Parliamentary constituency each district was in.
"Representation of the People Bill 1917: redistribution of seats: report" Link:
http://www.dippam.ac.uk/eppi/documents/22430

65
Part II (counties not in 1917 Boundary Commission volume):
1. Name of DED was found in index of DEDs in "General Topographical Index, Ireland,
1901" and the number(s) in the final column "No. in Table VII of Census County
Book 1901" as well as County District was recorded. Link:
https://archive.org/stream/op1254784-1001#page/n993/mode/2up. This was
completed for each county at a time.
2. Once a county is complete, county is located in "Area, Houses and population, Ireland,
1901" (there is a volume for each province) Link:
http://www.histpop.org/ohpr/servlet/Browse?path=Browse/Census%20(by%20geogra
phy)/Ireland/1901&active=yes&titlepos=0
From table VII, each DED is matched to the corresponding Barony (i.e. 73. Carnmoon (DED)
= Dunluce Lower (Barony).
3. Using "Baronies and Electoral Constituencies (1885)" Link:
https://parlipapers.proquest.com/parlipapers/result/pqpdocumentview?accountid=133
74&groupid=98693&pgId=f3e7d86b-ca19-4dca-b840-e5c8d8b655bb, county entry
was located with list of Baronies and/or map. The Parliamentary constituency each
Barony was in was then recorded.
General Notes:
• When a DED was listed as being in more than one Barony, both were recorded (e.g.
Belfast Lower, Belfast Upper) in order or area. DED then assigned to a parliamentary
constituency based on first named Barony (unless it is obvious otherwise from
constituency description).