
Manual Leica Software TCS-SP2
82
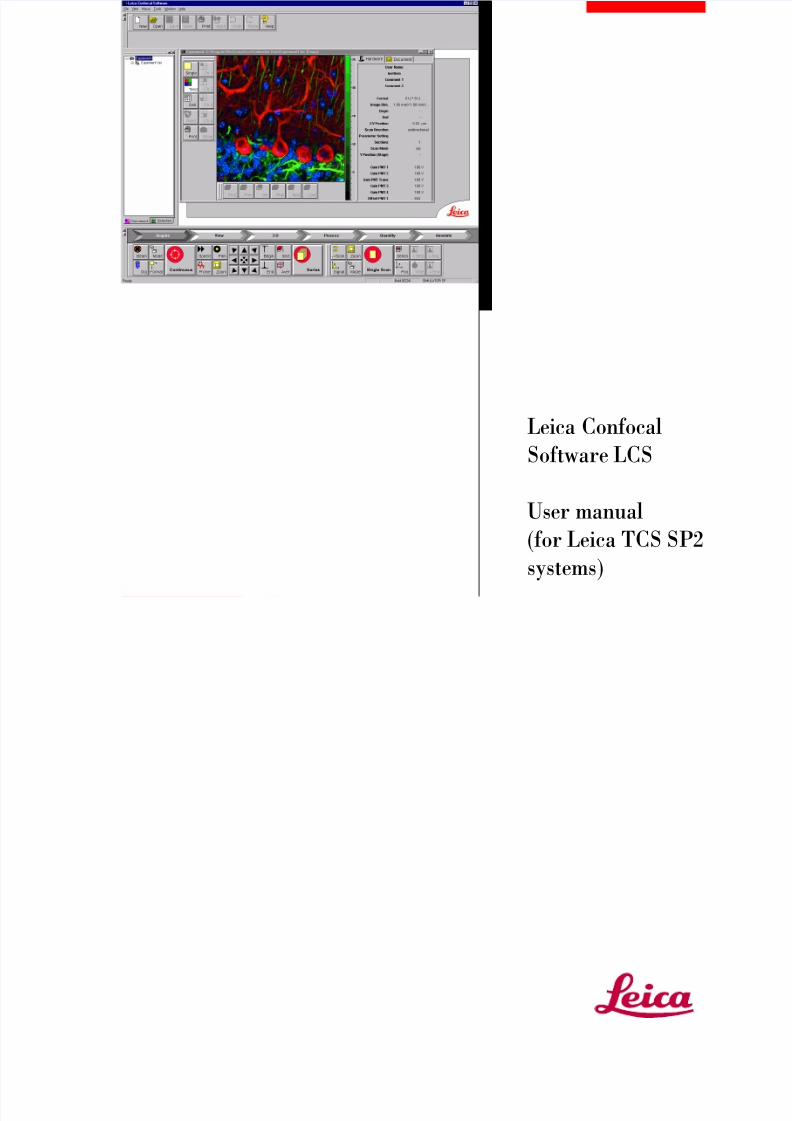
Leica Confocal Software LCS User manual (for Leica TCS SP2 systems)
Transcript of Manual Leica Software TCS-SP2
8/6/2019 Manual Leica Software TCS-SP2
http://slidepdf.com/reader/full/manual-leica-software-tcs-sp2 1/82
Leica Confocal
Software LCS
User manual
(for Leica TCS SP2
systems)

8/6/2019 Manual Leica Software TCS-SP2
http://slidepdf.com/reader/full/manual-leica-software-tcs-sp2 2/82
Version: RK09052000Page 2
1 Table of Contents1 Table of Contents......................................................................................22 The Leica Confocal Software: An overview...............................................7
2.1 Starting the software..........................................................................72.2 The experimental concept of the software .........................................82.3 Basic structure of the user interface...................................................82.4 Opening records ................................................................................9 2.5 Saving images .................................................................................10 2.6 Organizing data by grouping experiments .......................................102.7 Compiling experiments ....................................................................10
3 Starting the Operating System Windows NT™ .......................................113.1 Using a Mouse.................................................................................12
3.2 The Windows NT interface...............................................................123.3 The Start menu................................................................................13 3.4 Starting a Program...........................................................................133.5 The Taskbar.....................................................................................15 3.6 Setting the Time and Date ...............................................................153.7 Getting Help.....................................................................................16 3.8 Shut Down Windows NT ..................................................................16
4 Help from the Internet .............................................................................175 Softwarefunctions....................................................................................17
5.1 Software functions for data acquisition ............................................175.2 Softwarefunctions for data display ...................................................41
5.3 Software functions for measurements and analysis.........................665.4 Softwarefunctions for documentation of data...................................695.5 Softwarefunctions for data handling.................................................735.6 Softwarefunctions for customization ................................................77
6 Glossary..................................................................................................79

8/6/2019 Manual Leica Software TCS-SP2
http://slidepdf.com/reader/full/manual-leica-software-tcs-sp2 3/82
Version: RK09052000Page 3
1.1.1 Introduction to the Leica ConfocalSoftware Help
Welcome to the context-sensitive online guide for Leica ConfocalSoftware LCS.
The contents of this online help are specially customized for theaccompanied product.
You have the following types of help functions at your disposal:
Quick Help
When you let the mouse pointer hover over a button of the LeicaConfocal Software, a brief explanation of the function of this
button is displayed. This so-called help banner automaticallydisappears when the mouse pointer is moved.
Context-sensitive Help
Click the Help button to start the context-sensitive help function:
This temporarily disables the functions of the user interface anda question mark appears next to the mouse pointer. Then,instead of triggering the corresponding function, clicking a buttonopens an explanation of the button's function. If the Help buttonis not present on the user interface:
" Select the Customize option in the Tools menu. A dialogwindow opens where you will find all buttons arranged bycategories.
"
The Help button is found in the File category.
" Click on it using the left mouse button and drag it to thedesired window.
Contents of the Online Help
Select the option Contents in the Help menu to view the onlinehelp directory, which allows you to select any function in order toview information on it.
Keyword Search (Index)

8/6/2019 Manual Leica Software TCS-SP2
http://slidepdf.com/reader/full/manual-leica-software-tcs-sp2 4/82
Version: RK09052000Page 4
Select the option Index in the Help menu to view an index of keywords. Select a key word. View the corresponding content pagesby double-clicking the key word or selecting it and then clickingthe Display button.
Full-text Boolean SearchSelect the option Search in the Help menu to launch the full-textsearch engine. Enter your search word in the input field. Clickthe triangle to the right of the input field to view the availablelogical operators. Select the desired operator. Enter the secondsearch word, which you would like to associate with the firstsearch word, behind the operator.
Example Result
pinhole AND sections
This phrase finds help topics containing both the word «pinhole»
and the word «sections».
pinhole OR sectionsThis phrase finds help topics containing either the word«pinhole» or the word «sections» or both.
pinhole NEAR sections
This phrase finds help topics containing the word «pinhole» andthe word «sections» if they are located within a specific searchradius. This method also looks for words that are similar inspelling to the words specified in the phrase.
pinhole NOT sections This phrase finds help topics containing the word «pinhole» andnot containing the word «sections».
Favorites
Select the Favorites register in the online help dialog window tostore the current help topic in a list, making them easily availablefor future use.
1.1.2 Opening the Context-Sensitive Help
Function
Click Help to open the context-sensitive online help function,which provides you with short explanations for the variousbuttons and functions of the Leica Confocal Software.
" Click the Help button.

8/6/2019 Manual Leica Software TCS-SP2
http://slidepdf.com/reader/full/manual-leica-software-tcs-sp2 5/82
Version: RK09052000Page 5
" A question mark appears next to the mouse pointer. This temporarily disables thefunctions of all buttons.
" Use the mouse pointer to click the button that you want an explanation of.
" Online help opens directly to the description for the corresponding button.
Online help also provides you with an index of key words and asearch function so that you can search for specific topics andbuttons. Furthermore, you can print the individual descriptions.
You can also open the online help by selecting Contents, Searchor Index option under the Help menu.
1.1.3 Documentation Conventions
Button
The buttons provided on the user interface of the Leica ConfocalSoftware. Buttons are marked with icons and/or have an (oftenabbreviated) English label. They either trigger actions directly or open dialog windows.
Menu
The menus are divided into the categories of File, View, Macro,Tools, Window and Help and are displayed in the menu bar located at the upper edge of the user interface.
Option
Options refer to the selectable items that are hierarchically listedbelow the menus. Options either trigger actions directly or opendialog windows.
Dialog Window
Both buttons and options open dialog windows. Dialog windowsare used to set various parameters and select functions.
Register
Registers are found in dialog windows. Registers thematicallycombine the parameters and functions that can be configured indialog windows. Some registers are divided into fields.
Viewer window
The Leica Confocal Software contains two types of viewer window. The Viewer window is called up by pressing the Newbutton and displays the recorded images. The ExperimentOverview viewer window displays the recorded images in adirectory tree. This viewer window is called up from the Viewmenu and appears as a separate window at the left side of theuser interface.

8/6/2019 Manual Leica Software TCS-SP2
http://slidepdf.com/reader/full/manual-leica-software-tcs-sp2 6/82
Version: RK09052000Page 6
Legend
The Leica Confocal Software provides two legends, whichdisplay the parameters and settings of an image recording. The
Experiment legend can be placed at the right edge of the Viewer
window. The Hardware legend is called up from the View menuand appears as a separate window at the left side of the user interface.
Context Menu
Context menus appear when you click the right mouse buttonwhile holding the mouse pointer over certain areas of the user interface. Context menus contain various, context-sensitivecommands.
see ...
This symbol is reference to another topic in the online help.
1.1.4 Acceleration keys
In order to accelerate recurring software functions, special keycombinations have been defined:
Keycombination
Function
F1 Opens online help.
ALT + F8Opens the Macros dialog window for launching, editing, and deleting
macros.
ALT + F11(optional)
Launches the VBA developmental environment (optional).
CTRL + LOpens the Legend Info dialog window where user-specific data can be
entered to store and display them for the documentation of imagerecordings.
CTRL + JOpens the Objective dialog window to define and select the microscopic
objectives.
CTRL + N Opens a new experiment.
CTRL + O Launches the Open dialog window to open an existing file.
CTRL + P Opens the Printer Selection dialog window.
CTRL + S Stores the active experiment.
8/6/2019 Manual Leica Software TCS-SP2
http://slidepdf.com/reader/full/manual-leica-software-tcs-sp2 7/82
Version: RK09052000Page 7
2 The Leica Confocal Software:An overview
2.1 Starting the software
2.1.1 Requirements for starting the software
The LCS software is copy protected to prevent it from being usedon two computers at the same time. This protection systemallows all additional application packages to be used. To enablethe software, the provided dongle must be inserted into theparallel port of your computer. The dongle does not affect thefunctionality of the parallel port (e.g. for printing, etc.). To use thesoftware on a second computer, the dongle must be fitted to itsparallel port.
NoteIf you remove the dongle from the confocal system control
computer, the software cannot be started, preventing operation
of the confocal system.
The LCS software can be started in two operating modes:hardware mode and simulation mode. In hardware mode, allhardware components are accessed and initialized by thesoftware. For this reason, you should switch on the hardwarefirst and then wait about 20 seconds before starting the software.
In simulation mode, the software runs independently of thehardware. This mode is intended for secondary installations onanother computer, for example for training or offline analysis of
existing data.
2.1.2 Starting the software
Select Start|Programs|Leica Confocal Software. The initialscreen of the Leica Confocal Software appears. In this window,one of three profiles can be selected.
Company
With this option, the Leica Confocal Software is started with thedefault settings. In this mode, the configuration and position of toolbars is fixed and cannot be changed.
Personal
In this mode, a user-specific configuration profile can beselected. The user name depends on the account under which aperson logs on to the operating system. If the user does not yethave a personal configuration profile, the default settings areused.
Last Exit
With this option, the last used configuration profile is used.
For advanced users:
If you have several configuration profiles, you can load to theseat startup by clicking the button with the three small black dots atthe lower right edge of the profile options. Here, you can also
reset your current personal configuration profile to the defaultsettings.

8/6/2019 Manual Leica Software TCS-SP2
http://slidepdf.com/reader/full/manual-leica-software-tcs-sp2 8/82
Version: RK09052000Page 8
When you press the Start button, the Leica Confocal Softwarestarts with the selected configuration profile.
NoteIf you do not press the Start button, the software will start by
itself after a specified time with the selected configuration profile.
2.2 The experimental concept of thesoftware
With the Leica Confocal Software, image data or the results of image processing steps can be combined in groups. Thesegroups are referred to as "experiments" and are stored in aspecific file format (*.lei). In these experiments, originalexperimental image data can be stored together with imageviewing data. For further details, see chapter "Organizing data by
grouping experiments".
2.3 Basic structure of the user interface
The visual appearance of the Graphical User Interface (GUI)depends to a large extent on the chosen configuration profile. Itdoes, however, contain a number of standard elements.
The following standard elements are common to all GUIconfigurations:
The menu bar
The menu bar contains the File, View, Macro, Tools, Windowand Help menus. These menus contain commands andinformation for viewing data, making changes to settings andcustomizing the program for specific users. It does not containfunctions for the direct control of scan functions. These are
contained in the TCS menu (View →→→→Menu→→→→TCS Menu). Themenu bar itself cannot be configured.
The Viewer window (TCS_Viewer)
This window displays image data, experimental conditions anduser information. The image window can be configured (seechapter "Modifying the user interface and defining user-specific
settings" on page 16). Beside confocal image records, the imagewindow also shows experimental data such as system settings.An image window for a new experiment can be opened with File
→→→→ New .
TCS menu (TCS_Menu)
The TCS menu contains the buttons for the individual devicefunctions. It is arranged in individual working steps. The number of working steps varies depending on the installed software. Thedefault set of working steps consists of data acquisition(Acquire), image viewing (View), surface reconstruction (3 D),the measuring functions (Quantify), the image processing andanalysis functions (Process) and the documentation functions
(Annotate). If the TCS menu is not available in the current
8/6/2019 Manual Leica Software TCS-SP2
http://slidepdf.com/reader/full/manual-leica-software-tcs-sp2 9/82
Version: RK09052000Page 9
configuration profile, you can activate it with View → →→ → Menu → →→ → TCS Menu.
The toolbars
Individual button arrangements can be set up for each individualuser. A key feature of the toolbars is that they can be toggled on
and off complete with all buttons. This is done with the menuoption View →→→→ Menu →→→→ Container .
Viewer window for documents (Experiment Overview)
In this window, existing experiments and their content are listedin the form of a directory tree. The viewer window can be opened
with View →→→→ Experiment Overview .
Status bar
The status bar appears at the lower edge of the Leica ConfocalSoftware user interface. In it, the following information isdisplayed:
• The progress when loading image data (progress bar)
• The software version number
• The name of the machine configuration (system type)
For details about individual functions, see chapter "Softwarereference".
2.4 Opening records
2.4.1 Readable file formats
The following file formats can be opened and viewed with theLeica Confocal Software
Experiments (*.lei)
This is a Leica-specific binary file format. Files of this formatcontain data for complete experiments.
TIFF files (*.tif)
These are Leica image files in single and multiple tagged imagefile format (TIFF). Both image files in the previously used TCSformats and external files in RGB TIF format can be read.
Annotation files (*.ano)
This is also a Leica-specific binary file format. In these files,annotation sheets are stored. The elements on the annotation
sheets, such as images, text and graphics, are each available asindividual objects.
When a file of this type is opened, both the image data and theexperiment settings are loaded.
2.4.2 Automatic reuse of instrumentparameters
With the Leica Confocal Software, the hardware settings savedwith experiments or single images can be carried over to a newexperiment. This allows subsequent experiments to be carriedout with the same settings. To carry over previous settings, openthe viewer window for the record whose settings you want toreuse. Then click "Apply" (in the default configuration profile onthe toolbar).
8/6/2019 Manual Leica Software TCS-SP2
http://slidepdf.com/reader/full/manual-leica-software-tcs-sp2 10/82
Version: RK09052000Page 10
NoteIf you cannot find the "Apply" button in any of the open windows,
you can assign the button to any window with
Tools→ →→ → Customize. In the dialog that opens, select the "File"
category in the "Commands" tab. Left-click the "Apply" button
and keep the button pressed while pulling it to the window of
your choice. To insert the button in its current position, release
the mouse button.
2.5 Saving images
Individual images and experiments can be saved in the fileformats described in section "Readable file formats" above.
To save images and experiments, select File → →→ → Save. When an
experiment is first saved, the "Save as" dialog opens, where youmust enter a file name. You can also select a file format in thisdialog. Experiments can only be saved in the Leica-specific *.leiformat. When you are saving experiments, you may be able tosave existing individual images in *.tif or *.raw format.
NoteIf the experiment or image has already been saved, the previous
data is overwritten each time the experiment or image is saved.
To prevent this, you must save the data under a new filename
with File → →→ → Save as.
2.6 Organizing data by groupingexperiments
The Leica Confocal Software allows single images, image series,and the results of image processing steps to be combined in agroup (an experiment). The experiment overview windowprovides an overview of all loaded experiments. If the experiment
overview window is not visible, you can open it with View → →→ →
Experiment Overview . With File → →→ → New and File → →→ → New(Template) a new experiment can be created. In the sameway, existing files that are being opened are managed asseparate experiments.
2.7 Compiling experiments
After you have created a new experiment with File→→→→New or
File→→→→New(Template), you can assign data to it.
NoteImages acquired with the continuous scan function are
automatically overwritten the next time a scan is started. If you
want to permanently keep a single image as part of an
experiment, choose the single scan function.

8/6/2019 Manual Leica Software TCS-SP2
http://slidepdf.com/reader/full/manual-leica-software-tcs-sp2 11/82
Version: RK09052000Page 11
An experiment contains data acquired with the single or seriesscan function. If you perform image processing functions on arecord, you can also save the results as part of the experiment.To do this, double-click the desired image or series in theexperiment overview. Now carry out the image processingfunctions (e.g. maximum projection or topology image). Mark the
area within the Viewer window that you want to add to theexperiment. With the right mouse button (context menu), select
Send to→→→→Experiment . The Selection (raw) option creates acopy of the raw data for the selected object as a new, separatecomponent of the experiment. The Selection (snapshot) optioncreates an RGB image (no 3D data, photo only) of the selectedobject as a new component of the experiment.
3 Starting the Operating SystemWindows NT™
You don’t have to start Windows NT ™– it starts automaticallywhen you turn on your PC. You will first see a splash screen.
Next you have to log on to your computer. As you can see fromthe instructions in the box, pressing the Ctrl, Alt and Delete keys
at the same time will log you on.
Once you press the Ctrl, Alt, and Delete keys, the Logon
Information dialog box is displayed.
Typing your password identifies you as a valid user for thiscomputer.
The default User name for the Leica TCS SP II system is " ".
Default password is " ". After being logged in you can changeyour password by pressing Ctrl, Alt and Delete keys at thesame time.
Then click on change password. The Change Password dialogbox displays.
Type your current password in the Old Password field(passwords are case sensitive, so be sure you use the rightcase), then press the Tab key. Pressing the Tab key moves thecursor to the next field.
Type your new password, then press the Tab key again.Retyping the new password confirms that you aren’t making atyping error. This is important since the characters you type
appear as asterisks on the screen.
NoteIf you miss-type the confirmation password, you will see a
warning dialog. Try again!
Then click the OK button. Your new password will be in effect thenext time you log on.
CautionDo not forget your password if you set one! Without the right
password you can’t access your computer anymore.

8/6/2019 Manual Leica Software TCS-SP2
http://slidepdf.com/reader/full/manual-leica-software-tcs-sp2 12/82
Version: RK09052000Page 12
The Welcome dialog box is now displayed. Take a moment toread the „Did you know...“ tip and then click the Close button tobegin using Windows NT.
3.1 Using a Mouse
You need a mouse to work most efficiently in Windows NT. Hereare the mouse actions you need to know:
Point means to move the mouse pointer onto the specified itemby moving the mouse. The tip of the mouse pointer must touchthe item.
Click on an item means to move the pointer onto the specified
item and press and release the mouse button once. Unlessspecified otherwise (i.e. right-click), use the left mouse button.Clicking usually selects an item.
Double-click on an item means to move the pointer to thespecified item and press and release the left mouse button twicequickly. Double-clicking usually activates an item.
Drag means to move the mouse pointer onto the item, hold
down the mouse button, and move the mouse while holdingdown the button. Unless specified (i.e. right-drag), use the leftmouse button.
3.2 The Windows NT interface
The basic interface of Windows NT is called the „Desktop“,which provides a background for the items it contains.
The initial icons on the Desktop allow the user to view andinteract with the system in a logical way.
The Windows NT screen contains many special elements andcontrols. Here’s a brief summary:
The background on which all the pictures and boxes rest is thedesktop.
The Taskbar shows the windows and programs that are open.You can switch between open windows and programs by clickingthe name on the Taskbar.
The Start button opens a menu system from which you can startprograms. Click on the Start button; then, click on your selectionfrom each menu that appears.
Some icons appear on your desktop. You can activate one bydouble clicking on it.
We now take a brief tour of the items you see on the screen.
A standard desktop item is the My Computer icon. Double-clicking this icon opens the My Computer window.
The ‘My Computer’ window gives you easy access to the major components like hard and floppy disk drives of your computer system or workstation. For example, by double-clicking the Harddisk [C:] icon you can see the contents of your PC’s hard drive.This allows the user to view local resources as objects. Accessto the Windows NT Workstation 4 control panel and printsupport/control are also accessible from ‘My Computer’. If atinstallation time you installed one of the additional local
applications such as ‘Dial-Up Networking’ this will also appear within ‘My Computer’.
8/6/2019 Manual Leica Software TCS-SP2
http://slidepdf.com/reader/full/manual-leica-software-tcs-sp2 13/82
Version: RK09052000Page 13
You can use the Control Panel icon in the My Computer window
to view and change any system component. The Control Panelcontains numerous icons that allow you to control your system.The particular icons that you see on your PC may be slightlydifferent from those illustrated, due to that fact that you may havedifferent hardware installed, and may or may not be connected to
a network or modem. You may also have different Windows NTWorkstation 4 options installed.
Double-clicking the Network Neighborhood icon displays theNetwork Neighborhood dialog box which gives you informationabout who and what is connected to your workstation. It providesan easy mechanism for browsing any network systems andresources that you may be able to connect to in a way that isindependent of the actual type of network vendor. Traditionally, if a system needed to be simultaneously connected to differenttypes of network, the way in which each could be connected andviewed would be vendor specific. Windows NT Workstation 4 iscapable of displaying a common view of your entire networkeven though it may actually comprise resources from WindowsNT, Novell NetWare, Banyan Vines, or others!
The Inbox icon is used if Microsoft Exchange is active on your
system. Windows NT Workstation 4 has in-built electronic mailservices based on Microsoft Mail (MS Mail) and MicrosoftExchange. If there is already an MS Mail post office on the samenetwork that the system is connected to, the Windows NTWorkstation 4 mail client can connect directly into it. The Inboxlets you access your messages.
The Recycle Bin icon represents the holding place for deleteditems. As long as files are in the Recycle Bin they can easily berecovered if they have been accidentally deleted. Windows NTWorkstation 4 will preserve files until the system runs out of free
disk space. When this happens Windows NT Workstation 4 willprune the contents of the Recycle Bin on a first-in first-out basis.
CautionFiles that are overwritten due to an application using a duplicate
filename will not be saved to the recycle bin.
Double-clicking the Bin displays its contents. The empty windowconfirms that there are no items in the Recycle Bin.
3.3 The Start menu
A single click of the left-hand mouse button on the Start buttonwill invoke the start menu and present you with the seven major categorized options for starting work on the system.
A single click of the right-hand mouse button will invoke a smallbut powerful control menu containing the options Open, Exploreand Find.
Their functionality is described as follows:
3.4 Starting a Program
The Start menu contains the various categories where your applications and work are stored. You can move further into the
various subcategories by positioning the mouse over thecategory that you are interested in to automatically open the nextsubcategory. You do not have to click the mouse!
8/6/2019 Manual Leica Software TCS-SP2
http://slidepdf.com/reader/full/manual-leica-software-tcs-sp2 14/82
Version: RK09052000Page 14
The Programs command displays the Programs menu. This
menu lists all of the applications installed and available to you.An arrow, meaning that there is a submenu follows some items.Drag the mouse cursor over the Accessories command to see
its submenu. The Accessories submenu lists the set of WindowsNT built-in programs.
TIP: If you drag an object either from the Desktop or from theWindows Explorer and drop it directly onto the Start button a linkto that object will automatically appear in the Start menu.
There are many ways to start a program. The simplest is here:
• Click the Start button.
• Click Programs.
• Click on the group that contains the program you wantto start (for instance, LCS).
• Click on the program you want to start (for instance,Leica LCS).
Another way to start a program is to open a document that you
created in that program. The program automatically opens whenthe document opens. Double-click on a document file in MyComputer or Windows Explorer to open it, or click the Startbutton and select a recently used document from the Documentsmenu.
You can also start a program by double clicking on its shortcuticon on the desktop. Shortcut icons are links to other files. Whenyou use a shortcut, Windows simply follows the link back to theoriginal file.
Whenever you use a document or program frequently, you mightconsider creating a shortcut for it on the desktop. To do so, justuse the right mouse button to drag an object out of Windows
Explorer or My Computer. On the menu that appears, selectCreate Shortcut(s) Here. Some programs automatically create ashortcut during their installation procedure.
CautionWindows NT Workstation 4 does not actively track a link
between an original and a shortcut. For instance, if you create a
shortcut of a program, and subsequently move (rather than copy)
the original to a different folder, then the shortcut may no longer
function.
The Startup folder is special in one respect, any programs heldwithin it will start automatically when you start Windows NTWorkstation 4.
The Documents menu shows the names of the 15 files youcreated most recently. You can open any of these files and itsrelated application at the same time by clicking the file’s name inthis menu.
CautionDocument files that are opened within an application (typically by
selecting the File/Open command within the application) will not
be displayed here. Only documents opened directly from theDesktop will be displayed here.

8/6/2019 Manual Leica Software TCS-SP2
http://slidepdf.com/reader/full/manual-leica-software-tcs-sp2 15/82
Version: RK09052000Page 15
The Settings menu offers three commands for changing your system’s settings. You can directly access the Control Panel andPrinting folders. Also accessible is the Task Properties window.
Being able to access the core system configuration utilities in thisway is particularly useful when an application is already in theforeground and you want to make a quick change.
The Find command features an easy way to locate all systemresources. Within the Find category you can perform searchesfor three distinct types of search which are described as follows:
3.5 The Taskbar
The Taskbar – positioned at the bottom of the screen – providesa constant view of which applications are running on the systemand an easy way to switch between them. As you add to thenumber of concurrently running applications the Taskbar automatically re-sizes its iconized view of the applications toensure that they can always be seen. To switch from one
running program to another, simply click on the second programas displayed in the Taskbar.
The Taskbar also provides constant additional information suchas the system time and volume control if you have a sound cardfitted, all of which can be further tailored by the user.
3.6 Setting the Time and Date
The current Date, Time and Time Zone information can be setfrom the Date/Time icon within the Control Panel. This setting isimportant since Windows NT stamps the date and time on all of your files as you create and modify them. The two options canbe selected by clicking on the appropriate tab.
To change the Date and Time
Click on the appropriate date or use the controls to change themonth or year. The time can also be changed by first selectingthe digital display and then using the up and down arrows.
To change the Time Zone
Select the appropriate Time Zone from the drop down list at thetop of the screen. Notice that the option to automatically adjustthe clock for daylight savings time is selected. On some systemsyou can also drag the highlighted area on the world map anddrop it on the correct location.
Changing the date and time information within Windows NTWorkstation 4 will update the battery backup CMOS clock in your system.
NoteDepending on the shell configuration, systems connected to a
network may get a time and date update from a network server
every time they log on. If the servers time is incorrect your
workstations time will be wrong too. Please inform your network
manager.
8/6/2019 Manual Leica Software TCS-SP2
http://slidepdf.com/reader/full/manual-leica-software-tcs-sp2 16/82
Version: RK09052000Page 16
3.7 Getting Help
Windows NT includes a powerful help system. In addition to Helpmenus in every window, there is a standalone Help featureavailable from the Start menu. To access it, click your mouse onthe Start button, and click on Help.
There are three tabs in this box: Contents, Index, and Find. TheContents tab appears on top first. To move to a tab, click on it.
Contents
The Contents tab displays individual Help topics. The topics areorganized into categories and are represented by small bookicons. Double-click on any book to open it. Sub-books anddocuments appear. Double-click on sub-books and documents toopen them.
Index
The Index tab displays an index of all available topics. Type theword you want to look up. The Index list scrolls to that part of the
alphabetical listing. When you see the topic on the list that youwant to read, double-click on it.
Find
The Find tab provides a text entry box for you to type the specificword(s) or phrase you want to search for under Help, rather thansearching for information by category. The text entry box islinked to a list of words in your Help files and any words or phrases that match will be shown. You can specify more thanone word by separating words with a space. If you wish tochange a search option, select Options. The first time you clickon this tab, Windows tells you it needs to create a list. Click Next,and Finish to allow this. Then you see the main Find tab. Type
the word(s) you want to find in the top text box. Then click a wordin the middle box to narrow the search. Finally, review the list of help topics at the bottom, and double-click the one you want toread.
When you’re done reading about a document, click Help Topicsto return to the main Help screen, or click Back to return to theprevious Help topic. Click the window’s Close button to exit Help.
3.8 Shut Down Windows NT
Always use the Shut Down command before you turn off your PC. The Shut Down option allows the user to close the WindowsNT Workstation operating system and ensure all running
processes can halt cleanly and are given the chance to flush anydata that may be in cache memory out to the disk. Severaloptions are available when shutting the system down.
CautionPowering down your computer without prior shutting it down may
result in severe data loss.

8/6/2019 Manual Leica Software TCS-SP2
http://slidepdf.com/reader/full/manual-leica-software-tcs-sp2 17/82
Version: RK09052000Page 17
4 Help from the InternetFirst contact your local Leica subsidiary or the local dealer.
You can also find information on Leica Microsystems HeidelbergGmbH and confocal microscopy on our web sitehttp://www.llt.de.Send email to [email protected].
5 Softwarefunctions
5.1 Software functions for dataacquisition
5.1.1 Selecting an Objective
Function
Click the Objective button to open a list of objectives and selectan appropriate one for recording your images. This list showsonly the objectives that have been assigned to the up to sevenslots on the revolving nosepiece. You can assign objectives asfollows:
" Select the Objective option from the Tools menu. A dialog window opens containing anextensive list of objectives and the symbolic representation of the slots on the revolving
nosepiece.
" Find in the list the objective that you are using and select it with the mouse. Click and holdthe left mouse button and drag the objective onto the symbol representing the slot in which
the objective is installed.
" The assignment is saved in the software and the objective appears in the selection list,which you can open by pressing the Objective button.
" Repeat this procedure for every objective that you have installed in the revolving
nosepiece.
You can use the Add, Remove and Edit buttons in this dialogwindow to add new objectives, remove objectives or edit existingobjective entries.

8/6/2019 Manual Leica Software TCS-SP2
http://slidepdf.com/reader/full/manual-leica-software-tcs-sp2 18/82
Version: RK09052000Page 18
NoteThe revolving nosepiece of DM RXA, DM RXE and DM IRBE
microscopes is triggered by the software so that the objective is
moved automatically into the beam path when you select an
objective with the Objective button or dialog window. With all
other microscope types the objective has not only to be assigned
in the software but also be moved manually into the beam path.
Additional InformationWhen selecting the correct objective for a specific application,the objective's correction class (achromats, apochromats, fluoriteobjectives and plan-objectives) and especially the magnificationfactor and the numerical aperture are of great significance. The
numerical aperture determines the resolution capacity of anobjective and is deduced from the angle of the light coneaccepted by the objective lens and the refractive index of the
medium between objective lens and specimen: NA = n*sin α
Objectives with greater magnification generally have larger numerical apertures but smaller entrance pupils and thereforecan record light only from a relatively small scan field. Objectiveswith larger apertures permit higher resolutions but allow less freeworking distance. The following table illustrates this relationship:
Objective Resolution(xy) ResolutionAir (z) ResolutionWater (z) ResolutionOil (z) Scan FieldSize (xy)
HC PL FLUOTAR 5x0.15
1301 19410 25879 29559 3000
HC PL FLUOTAR 10x0.30
651 4768 6407 7335 1500
N PLAN 20x 0.40 488 2630 3566 4093 750
N PLAN 50x 0.75 260 649 948 1108 300
PL APO 100x 1.40 139 319 209 236 150
Values in nm at wavelength λ 488 nm Values in µm
Typical ApplicationsDry objectives are typically used in materials science for theexamination of surface structures. When imaging layeredstructures in which the material layers have different refractiveindices, immersion objectives are most suitable. With biologicalspecimens it depends on the specimen and the medium in whichit is embedded whether an oil-immersion objective or a water-immersion objective should be applied. The highest resolution isachieved, when the refractive indices of the immersion mediumor the specimen on the one hand and the objective medium onthe other are as homogeneous as possible.

8/6/2019 Manual Leica Software TCS-SP2
http://slidepdf.com/reader/full/manual-leica-software-tcs-sp2 19/82
Version: RK09052000Page 19
5.1.2 The Electronic Zoom
FunctionIn confocal microscopy, the magnification of an image isdetermined both by the objective and the electronic zoom. Theobjective generates an intermediate image magnified based onthe objective's magnification factor. Additional magnification isprovided by the electronic zoom. At a zoom factor of 1 themaximum scan field size is scanned with a specified number of sampling points. If the zoom factor is set to 2, the same number
of points is used to scan a scan field with only half the length of aside of the maximum scan field (1/4 the original scan field). Thisachieves stronger magnification and thus better imageresolution, because a smaller scan field is scanned with thesame frequency, which results in a higher density of data.
You can select one of the preset zoom factors in the dialogwindow that is opened with the Zoom button. If you click Others,there are two ways of specifying another zoom factor:
" Use the mouse to move the slide on the scale. The corresponding value is shown in themiddle of the dialog window.
" Double-click the boldface numerical value located in the middle of the dialog window. This
opens a second dialog window where you can enter an exact value.
You can also set the zoom factor using the corresponding rotaryknob of the control panel.
see Controlling Functions from the Control Panel
Additional Information
While zoom factors from 1 to 36 can be set, the usefulmagnification of the electronic zoom cannot be increasedinfinitely. The limit is achieved with the smallest opticallyresolvable distance, which is determined by the resolutioncapacity of the objective. According to the Nyquist theorem thesmallest optically resolvable distance can be mapped withoutloss of information if it is scanned with about 2 to 3 raster points.If this scan frequency is exceeded with a relatively high zoomfactor and a selected scan format, further magnification is nolonger useful because no more optical details can be resolved(empty magnification).
see Selecting a Scan Format see Selecting an Objective

8/6/2019 Manual Leica Software TCS-SP2
http://slidepdf.com/reader/full/manual-leica-software-tcs-sp2 20/82
Version: RK09052000Page 20
Note
With bleach-sensitive specimens it is advisable to restrict the use
of the electronic zoom to short time intervals. At high zoom
factors a section of the specimen is recorded with a relatively
higher scan frequency, and thus exposed to a high illumination
intensity. This can destroy the specimen photochemically ( optical
bleaching ), making it unfit.
Optimal Zoom Factors
The following table shows which zoom factors (marked red) - ata given scan format and scan field size defined by the objective -can be used to scan the specimen without loss of data:
Objective Scan Format Zoom Factor Scan Field
Size (µµµµm)
Scan Frequency
(nm)
Resolution/Scan
Frequency
Magnification NumericalAperture
Resolution at
λ λλ λ 488 nm
20 0,6 325 1024 x 1024 1246
750375187125
732366183122
0,40,81,82,7
512 x 512 124810
7503751879475
1465732365183146
0,20,40,91,82,2
200 x 200 12481632
750375187944723
37501875935470235115
0,10,20,30,71,42,8
40 1,25 156 1024 x 1024 1246
3751879462
3661839260
0,40,81,72,6
512 x 512 124810
375187944737
7323651839272
0,20,40,81,72,2
200 x 200 12481632
37518794472312
187593547023511560
0,10,20,30,71,32,6
100 1,4 139 1024 x 1024 123
1507550
1467349
0,91,92,8
512 x 512 1246
150753725
2931467249
0,50,91,92,8
200 x 200 12
48
15075
3718
750375
18590
0,20,4
0,71,5

8/6/2019 Manual Leica Software TCS-SP2
http://slidepdf.com/reader/full/manual-leica-software-tcs-sp2 21/82
Version: RK09052000Page 21
12 12 60 2,3
NoteThe Leica Confocal Software provides three different zoom
features: the electronic zoom, the 3D zoom and the graphical
zoom.
see Zooming the 3D View see The Viewer Options Dialog Window, Display Icon
5.1.3 Setting the Detection Pinhole
Function
Clicking the Pinhole button opens a dialog window that you canuse to set the diameter of the detection pinhole. In the upper right list field in the dialog window, select the units for displaying
the diameter. You can select from µm, Airy units and digitalvalues. There are two ways of specifying a value for thediameter:
" Use the mouse to move the slide on the scale that is displayed on the left in the dialogwindow. The corresponding value is shown in the middle of the dialog window.
" Double-click the boldface numerical value located in the middle of the dialog window. This
opens a second dialog window where you can enter an exact value.
The diameter of the detection pinhole must be set to thecurrently used objective at all times. If you click the Airy 1 button,the detection pinhole is set automatically to the optimal value of 1 Airy unit depending on the objective in use.
In addition to the numerical aperture of the objective and thewavelength of the light, the detection pinhole also determines thethickness of the optical sections.
Additional InformationThe diameter of the pinhole is set optimally if it matches thediameter of the Airy disc. The Airy disc refers to the inner, lightcircle of the diffraction pattern of a point light source. Thediameter of the Airy disc, in turn, is also dependent on severaloptical parameters and can be described for the Leica ConfocalSystem as follows:

8/6/2019 Manual Leica Software TCS-SP2
http://slidepdf.com/reader/full/manual-leica-software-tcs-sp2 22/82
Version: RK09052000Page 22
To calculate the diameter of the Airy disc, you need the
excitation wavelength λ (if working with several wavelengths, amean value should be applied), the numerical aperture (NA) andthe magnifying factor (M) of the objective. The factor of 3.6 refersto the magnification of other optical components belonging to theLeica Confocal microscope.
If the pinhole is set to the Airy disc, light from outside the focalplane is suppressed and the signal-to-noise ratio will be high.These conditions allow the recording of optical sections of minimum thickness. The wider the diameter of the pinhole, themore light reaches the detector. The image becomes brighter butalso increasingly blurred because structures outside the focusalso appear in the image.
Increasing the diameter of the pinhole above 1 Airy unit isrecommended only for detecting very weak signals.
Generally when recording material scientific specimens, enoughlight is reflected into the detectors so that the detection pinholecan be closed completely (i.e. set to the minimum diameter).
5.1.4 Selecting a Scan Format
Function
Clicking the Format button opens a dialog window that containsa selection of various scan formats. Selecting the scan formatselects the image raster that will be used for recording theimages. The image raster refers to the number of points in thethree spatial directions that are to be scanned from thespecimen. Besides the numerical aperture of the objective andthe excitation wavelength, the scan format, together with theelectronic zoom, determines in large part the spatial resolution of the recorded data.
Additional Information
When selecting the scan format, observe the influences betweenthe image raster and the resolution of the generated image.According to the Nyquist theorem (or sampling theorem), astructure can only be scanned without information loss if thesmallest optically resolvable distance is scanned with about 2 to3 raster points. This optically resolvable distance, called lateralresolution, depends on the numerical aperture of the objectiveand the wavelength of the applied excitation light:

8/6/2019 Manual Leica Software TCS-SP2
http://slidepdf.com/reader/full/manual-leica-software-tcs-sp2 23/82
Version: RK09052000Page 23
The following example should illustrate this relationship: Youhave selected, for example, the PL APO 100x objective unit with
a numerical aperture of NA = 1.4 and a wavelength of λ = 488nm. Based on these factors, the smallest optically resolvabledistance is determined as follows:
Based on this rough formula, the distance of the raster pointsrequired to avoid information loss while recording is:
If however you select a scan format of 1024x1024, a PL APO100x objective, which has a maximum
scan field size of 150 µm, would result in the following raster point distance:
To achieve the necessary raster distance of 47 nm, you nowhave the option of increasing the scan format (for example to2048x2048) or decreasing the scan field size using the electroniczoom (zoom=2).
The current raster distance is displayed in the hardware legend.In the legend the value is referred to as Voxel Size and iscalculated as soon as you change the scan format, the electronic
zoom or the objective.
see The Electronic Zoom see Selecting an Objective
NoteWhen the sampling rate of 2 to 3 points is exceeded, it isreferred to as oversampling. In the case of oversampling, thestructure is fully mapped but no additional information is gained.The disadvantage of oversampling is the long scanning time andthe danger of destroying bleach-sensitive specimens. When the
sampling rate is less than 2 to 3 points, it is referred to asundersampling. In this case, there is the danger that not allnecessary information is sampled. The image might illustratestructures that are not actually present in the specimen. Thiseffect is called aliasing.
8/6/2019 Manual Leica Software TCS-SP2
http://slidepdf.com/reader/full/manual-leica-software-tcs-sp2 24/82
Version: RK09052000Page 24
5.1.5 Selecting a Scan Mode
Function
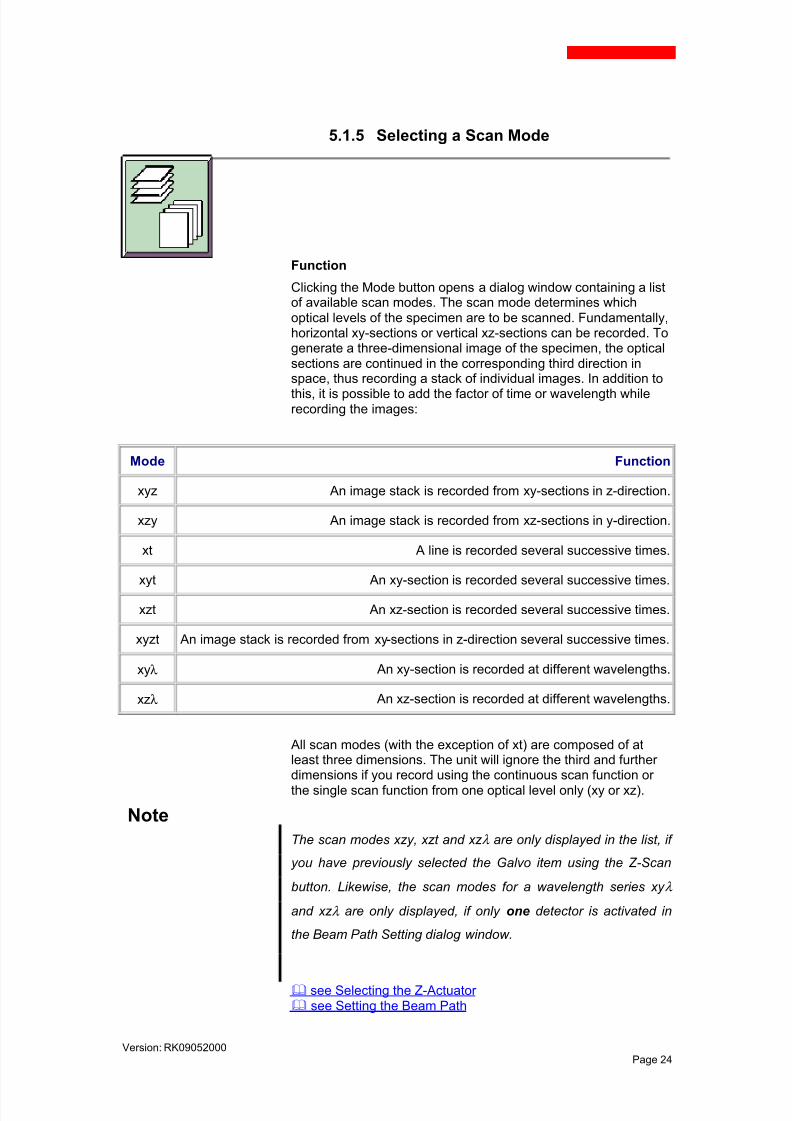
Clicking the Mode button opens a dialog window containing a listof available scan modes. The scan mode determines whichoptical levels of the specimen are to be scanned. Fundamentally,horizontal xy-sections or vertical xz-sections can be recorded. Togenerate a three-dimensional image of the specimen, the opticalsections are continued in the corresponding third direction inspace, thus recording a stack of individual images. In addition to
this, it is possible to add the factor of time or wavelength whilerecording the images:
Mode Function
xyz An image stack is recorded from xy-sections in z-direction.
xzy An image stack is recorded from xz-sections in y-direction.
xt A line is recorded several successive times.
xyt An xy-section is recorded several successive times.
xzt An xz-section is recorded several successive times.
xyzt An image stack is recorded from xy-sections in z-direction several successive times.
xyλ An xy-section is recorded at different wavelengths.
xzλ An xz-section is recorded at different wavelengths.
All scan modes (with the exception of xt) are composed of atleast three dimensions. The unit will ignore the third and further dimensions if you record using the continuous scan function or
the single scan function from one optical level only (xy or xz).
Note
The scan modes xzy, xzt and xz λ are only displayed in the list, if
you have previously selected the Galvo item using the Z-Scan
button. Likewise, the scan modes for a wavelength series xy λ
and xz λ are only displayed, if only one detector is activated in
the Beam Path Setting dialog window.
see Selecting the Z-Actuator
see Setting the Beam Path

8/6/2019 Manual Leica Software TCS-SP2
http://slidepdf.com/reader/full/manual-leica-software-tcs-sp2 25/82
8/6/2019 Manual Leica Software TCS-SP2
http://slidepdf.com/reader/full/manual-leica-software-tcs-sp2 26/82
Version: RK09052000Page 26
5.1.7 Setting the Z/Y-Position
Function
Use the z/y-Position button to define the horizontal level (z-position) or vertical level (y-position) of the specimen in whichthe images are to be recorded. If you want to record an imageseries using the Series Scan function, you use the z/y-Positionbutton and the Begin and End buttons to define the begin andend points of the image series.
see The Series Scan Overview Dialog Window
Clicking the z/y-Position button opens a dialog window thatprovides you with two ways of specifying a position value:
" Use the mouse to move the slide on the scale that is displayed on the left in the dialogwindow. The corresponding position value is shown in the middle of the dialog window.
"
Double-click the boldface position value located in the middle of the dialog window. Thisopens a second dialog window where you can enter an exact value.
You can also set the z/y-position using the corresponding rotaryknob of the control panel.
see Controlling Functions from the Control Panel
5.1.8 Configuring a Time Series
Function
Click the Time button to open the Time Configuration dialogwindow for setting up a time series recording. The parametersyou can set in this dialog window depend on the selected scanmode. You can record a line (xt), a horizontal section (xyt), avertical section (xzt) or a stack of horizontal sections (xyzt) manysuccessive times interrupted by a certain time interval.
Note The Time button is not enabled unless you have selected a scan
8/6/2019 Manual Leica Software TCS-SP2
http://slidepdf.com/reader/full/manual-leica-software-tcs-sp2 27/82
Version: RK09052000Page 27
mode with time dimension using the Mode button.
see Selecting a Scan Mode
With a time series using the xt scan mode the followingparameters are displayed in the dialog window:
∆∆∆∆T Recording time for a line (cannot be adjusted by the user)
Lines Number of recordings of the line
Lines per page
Number of lines per virtual memory page
Pages Number of virtual memory pages (is calculated automatically)
CompleteTime Complete recording time, i.e. product of ∆∆∆∆T and number of recordings
Use the Calculate button to calculate how many virtual memorypages result from a given number of lines per page.
With a time series using the xyt or xzt scan mode the followingparameters are displayed in the dialog window:
∆∆∆∆T Recording time for one xy-section or xz-section plus pause interval
Frames Number of recordings of the xy-section or xz-section
CompleteTime
Complete recording time, i.e. product of ∆∆∆∆T and number of recordings
With a time series using the xyzt scan mode the followingparameters are displayed in the dialog window:
∆∆∆∆T Recording time for one image stack of xy-sections plus pause interval
Stacks Number of recordings of the image stack
CompleteTime
Complete recording time, i.e. product of ∆∆∆∆T and number of recordings
Each parameter can be calculated as a function of the other parameters. When entering the values observe the specialoperating principle of the dialog window. Clicking an entry fielddeactivates it:
" Click the parameter that is to be calculated. Thecorresponding entry field appears grey.

8/6/2019 Manual Leica Software TCS-SP2
http://slidepdf.com/reader/full/manual-leica-software-tcs-sp2 28/82
Version: RK09052000Page 28
" Now enter the values for the other parameters.
"
Click Apply to calculate the parameter. Clicking Resetdisplays the last saved values.
When you have finished configuring these settings, press theSeries Scan button.
5.1.9 Starting a Single Scan
Function
Use the Single Scan button to record a single image from asingle optical level in the specimen.
Before recording an image using the single scan function,configure all required scan parameters using the ContinuousScan function to ensure optimal image quality.
see Starting a Continuous Scan
Typical Applications
The single scan function is designed for recording bleach-sensitive specimens. Use this function in the case of bleach-sensitive specimens not only for image recording, but also as analternative to the continuous scan function for setting the scanparameters. The single scan function can also be used to checkthe image section by zooming in on the scan field.
5.1.10 Starting a Continuous Scan
Function
Use the Continuous Scan button to permanently record imagesfrom a single optical level in the specimen. This does not
generate image series, since the image being generated alwaysreplaces the previously generated image.

8/6/2019 Manual Leica Software TCS-SP2
http://slidepdf.com/reader/full/manual-leica-software-tcs-sp2 29/82
Version: RK09052000Page 29
Press the button a second time to stop the continuous scan.
Additional Information
The unit applies the last used scan parameters automatically.You can modify some of the parameters while the image isbeing recorded. Others have to be configured before you startthe recording:
Before Recording While Recording
Selecting the objectiveSelecting the scan formatSelecting the scan modeSelecting the scan speed
Selecting unidirectional or bidirectional scan
Setting the beam pathSetting the detection pinholeSetting the electronic zoom
Setting the detectorsAdjusting the phase
Setting the z/y-position
The buttons of the functions that cannot be changed duringcontinuous scanning are disabled and appear gray.
Typical Applications
The continuous scan function is best used to optimize the imagequality for the first scan of a specimen. While the specimen isbeing scanned continuously, you can modify the scanparameters listed above and check the results directly in theimage.
NoteWith bleach-sensitive specimens it is advisable to restrict the useof the Continuous Scan function to short time intervals.Subjecting the specimen to the continuous light of the laser candestroy the specimen photochemically (optical bleaching),making it unfit.
5.1.11 The Series Scan Overview DialogWindow
Function
This dialog window lets you define the begin and end points of an image series and trace the recording of the individualsections. The three-dimensional scan area is representedgraphically as a cube. Within this cube, a yellow square
represents the current z-position and y-position, a green onerepresents the begin point and a red one the end point. The
8/6/2019 Manual Leica Software TCS-SP2
http://slidepdf.com/reader/full/manual-leica-software-tcs-sp2 30/82
Version: RK09052000Page 30
corresponding position values are displayed to the right of thecube. Set the begin and end point as follows.
" Use the mouse pointer to drag the yellow square to the level in which the image series isto begin.
Or click the z/y-Position button to open a dialog window where you can enter the values of the z-position and y-position.
" Click in the white box for the begin point. The corresponding position value appears and is
saved.
" Use the mouse pointer to drag the yellow square to the level in which the image series isto end.
Or click the z/y-Position button to open a dialog window where you can enter the values of the z-position and y-position.
" Click in the white box for the end point. The corresponding position value appears and is
saved.
" The entire height of the image stack between the begin and end points is calculated and
displayed (Total).
Now click the Series Scan button. The dialog window stays openand you can follow the process of the image series beingrecorded.
NoteYou can also define the begin and end points using the control
panel and the separate Begin and End buttons.
see Defining the Begin Point for a Spatial Series
see Defining the End Point for a Spatial Series
see Setting the z/y-Position
Additional Information
The following additional parameters, which have to be set beforerecording an image series, are specified in the Series ScanOverview dialog window:
" Scan mode (top line to the right of the graphic image)
" Scan format (red digits at the upper edge of the cube)
" Number of optical sections (division between begin and end points)
The red number on the vertical edge of the cube represents thethe maximum travel of the z-actuator that cannot be changed.
see Selecting a Scan Mode see Selecting a Scan Format
see Defining the Number of Spatial Sections

8/6/2019 Manual Leica Software TCS-SP2
http://slidepdf.com/reader/full/manual-leica-software-tcs-sp2 31/82
Version: RK09052000Page 31
5.1.12 Defining the Begin Point for a SpatialSeries
Function
Use the Begin button to define the begin point of a spatial imageseries. First set the exact z-position or y-position using the z/y-Position button or on the control panel using the correspondingrotary knob. Then click Begin. This saves the position value for
the begin point. The end point is set in the same manner.
see Setting the z/y-Position see Controlling Functions from the Control Panel
NoteYou can also set the begin and end points for a spatial series in
the Series Scan Overview dialog window. Open this dialog
window by pressing the Series button (the small button, not the
button that starts the Series Scan function).
see The Series Scan Overview Dialog Window
5.1.13 Defining the Begin Point for aWavelength Series
Function
For a wavelength series, this function records a stack of individual images, each of which are detected at a specificwavelength, from a single, optical level. Use the Lambda ScanBegin button to define the wavelength at which recording shouldbegin.
Note
The Lambda Scan Begin button is not enabled unless you have
selected a scan mode with wavelength dimension using the

8/6/2019 Manual Leica Software TCS-SP2
http://slidepdf.com/reader/full/manual-leica-software-tcs-sp2 32/82
Version: RK09052000Page 32
Mode button.
see Selecting a Scan Mode
" Press Beam to open the Beam Path Setting dialog window.
" Activate a detector by clicking its corresponding check box. A cast shadow now links theactivated detector to the corresponding slide bar on the scale of the spectrum.
" Double-click this slide bar to open the Range Properties dialog window, where you can
specify the detection bandwidth.
" Drag the slide bar on the scale of the spectrum to the desired begin point. The left edge of the slide bar represents the wavelength at which the recording is to begin.
" Click Lambda Scan Begin to save the value.
The end point of a wavelength series is set in the same manner.In addition, you also have to set the number of wavelength steps.
see Defining the End Point for a Wavelength Series see Setting the Number of Wavelength Steps
Typical ApplicationsA wavelength series can be applied to determine the maximumemission of a fluorochrome. This is useful because the Stokes
shift of the emission curve of a fluorochrome is dependent oneach specimen that is applied. This then allows you to set thedetection range precisely for a specific application.
5.1.14 Defining the End Point for a SpatialSeries
Function
Use the End button to define the end point of a spatial imageseries. First set the exact z-position or y-position using the z/y-Position button or on the control panel using the correspondingrotary knob. Then click End. This saves the position value for theend point. The begin point is set in the same manner.
see Setting the z/y-Position see Controlling Functions from the Control Panel
8/6/2019 Manual Leica Software TCS-SP2
http://slidepdf.com/reader/full/manual-leica-software-tcs-sp2 33/82
Version: RK09052000Page 33
NoteYou can also define the begin and end points for a spatial series
in the Series Scan Overview dialog window. Open this dialog
window by pressing the Series button (the small button, not the
button that starts the Series Scan function).
see The Series Scan Overview Dialog Window
5.1.15 Defining the End Point for aWavelength Series
Function
For a wavelength series, this function records a stack of individual images, each of which are detected at a specificwavelength, from a single, optical level. Use the Lambda ScanEnd button to define the wavelength at which recording shouldend:
NoteThe Lambda Scan End button is not enabled unless you have
selected a scan mode with wavelength dimension using the
Mode button.
see Selecting a Scan Mode
" Press Beam to open the Beam Path Setting dialog window.
" Activate a detector by clicking its corresponding check box. A cast shadow now links the
activated detector to the corresponding slide bar on the scale of the spectrum.
" Double-click this slide bar to open the Range Properties dialog window, where you canspecify the detection bandwidth.
" Drag the slide bar on the scale of the spectrum to the desired end point. The right edge of
the slide bar represents the wavelength at which the recording is to end.
" Click Lambda Scan End to save the value.
8/6/2019 Manual Leica Software TCS-SP2
http://slidepdf.com/reader/full/manual-leica-software-tcs-sp2 34/82
Version: RK09052000Page 34
The begin point of a wavelength series is set in the samemanner. In addition, you also have to set the number of wavelength steps.
see Defining the Begin Point for a Wavelength Series
see Setting the Number of Wavelength Steps
Typical ApplicationsA wavelength series can be applied to determine the maximumemission of a fluorochrome. This is useful because the Stokesshift of the emission curve of a fluorochrome is dependent oneach specimen that is applied. This then allows you to set thedetection range precisely for a specific application.
5.1.16 Defining the Number of SpatialSections
Function
Clicking the Sections button opens a dialog window that you canuse to select the number of horizontal xy-sections and verticalxz-sections for recording a picture series. If you want to specify anumber of sections that is not listed, click the Others option. This
opens the Z/Y Configuration dialog window, which contains thefollowing data:
Parameter Description
Image Dim. z
(µm)
The height of the entire image stack between the begin and end points of the image series
# Sections The number of configured sections
Step Size (µm) The distance between two sections
Enter any desired value for the number of sections and the stepsize in this dialog window. The value for the height of the imagestack cannot be altered, since this parameter is determined bythe begin and end points of the image series. The step size hasalways to be a multiple of the minimum step size of the z-actuator, so that certain combinations of values are only possibleif either the height of the image stack or the number of sectionsis changed. Depending on which of the both Calculate buttonsyou click, one of the two parameters is kept unchanged.
Calculating the number of sections with the priority for keeping
the height of the image stack unchanged:

8/6/2019 Manual Leica Software TCS-SP2
http://slidepdf.com/reader/full/manual-leica-software-tcs-sp2 35/82
Version: RK09052000Page 35
" Enter the desired step size in the Step Size field.
" Then click the Calculate button next to the Step Size field.
Calculating the number of sections with the priority for keeping
the number of sections unchanged:
" Enter the desired step size in the Step Size field.
" Then click the Calculate button next to the # Sections field.
Calculating the step size with the priority for keeping the heightof the image stack unchanged:
" Enter the number of desired sections (whole numbers only) in the # Sections field.
" Then click the Calculate button next to # Sections field.
Calculating the step size with the priority for keeping the number of sections unchanged:
" Enter the number of desired sections (whole numbers only) in the # Sections field.
" Then click the Calculate button next to the Step Size field.
Clicking Reset displays the last saved values.
see Starting a Series Scan see The Series Scan Overview Dialog
see Selecting the Z-Actuator
5.1.17 Setting the Number of WavelengthSteps
Function
For a wavelength series, this function records a stack of individual images, each of which are detected at a specificwavelength, from a single, optical level. The images arerecorded within a wavelength range, which is limited by the beginand end points. Use the Lambda Steps button to define thenumber of recordings that are to take place within this range.
Note
8/6/2019 Manual Leica Software TCS-SP2
http://slidepdf.com/reader/full/manual-leica-software-tcs-sp2 36/82
Version: RK09052000Page 36
The Lambda Steps button is not enabled unless you have
selected a scan mode with wavelength dimension using the
Mode button.
see Selecting a Scan Mode see Defining the Begin Point for a Wavelength Series see Defining the End Point for a Wavelength Series
Typical ApplicationsA wavelength series can be applied to determine the maximumemission of a fluorochrome. This is useful because the Stokesshift of the emission curve of a fluorochrome is dependent oneach specimen that is applied. This then allows you to set thedetection range precisely for a specific application.
5.1.18 Starting a Series Scan
Function
Use the Series Scan button to create an image series. Thiscreates a multidimensional image data block of the specimen.The available dimensions for recording an image series are thethree directions in space (x, y, z) as well as the dimensions of
time (t) and wavelength (λ ). This allows you to record a three-dimensional, spatial image stack consisting of xy-sections or xz-sections with the additional factor of time or wavelength.
NoteBefore recording an image series, configure all required scan
parameters using the Continuous Scan function to ensure
optimal image quality.
see Starting a Continuous Scan
Before recording a spatial image series, configure the followingsettings:
" Select the scan mode using the Mode button. see Selecting a Scan Mode
" Select the scan format using the Format button. see Selecting a Scan Format

8/6/2019 Manual Leica Software TCS-SP2
http://slidepdf.com/reader/full/manual-leica-software-tcs-sp2 37/82
Version: RK09052000Page 37
" Set the desired z-position or y-position using the z/y-Position button or by using thecorresponding rotary knob of the control panel.
see Setting the z/y-Position see Controlling Functions from the Control Panel
" Set and store the begin point for an image series using the Begin button or in the SeriesScan Overview dialog window.
see Defining the Begin Point for a Spatial Series
" Set the desired z-position or y-position using the z/y-Position button or by using thecorresponding rotary knob of the control panel.
see Setting the z/y-Position see Controlling Functions from the Control Panel
" Set and store the end point for an image series using the End button or in the Series ScanOverview dialog window.
see Defining the End Point for a Spatial Series
" Select the number of spatial sections using the Sections button. see Defining the Number of Spatial Sections
When you have finished configuring these settings, press theSeries Scan button.
You can track the recording process of the image stack in theSeries Scan Overview dialog window.
Before recording a time series, configure the following settings:
" Select a scan mode with time dimension using the Mode button.
see Selecting a Scan Mode
" Select the scan format using the Format button.
see Selecting a Scan Format
" Set the desired z-position or y-position using the z/y-Position button or by using thecorresponding rotary knob of the control panel.
see Setting the z/y-Position see Controlling Functions from the Control Panel
" Set the number of recordings, the pause interval between scans and the complete
recording time. see Configuring a Time Series
When you have finished configuring these settings, press theSeries Scan button.
Before recording a wavelength series, configure the followingsettings:
" Select a scan mode with wavelength dimension using the
Mode button. see Selecting a Scan Mode

8/6/2019 Manual Leica Software TCS-SP2
http://slidepdf.com/reader/full/manual-leica-software-tcs-sp2 38/82
Version: RK09052000Page 38
" Select the scan format using the Format button. see Selecting a Scan Format
" Define the wavelength at which you want the wavelengthseries to begin. see Defining the Begin Point for a Wavelength Series
" Define the wavelength at which you want the wavelengthseries to end. see Defining the End Point for a Wavelength Series
" Select the desired number of recordings between the beginand end points of the wavelength series.
see Setting the Number of Wavelength Steps
5.1.19 Selecting Unidirectional or
Bidirectional Scan
Function
If you click the Unidirectional/ Bidirectional Scan button,bidirectional scan mode is enabled. If this button is not clicked,unidirectional scan mode is automatically set.
In unidirectional scan mode, each line is scanned from left toright. No data is recorded while the laser beam is being guided tothe starting point of the next line. In bidirectional scan mode, thefirst line is scanned from left to right and the second from right toleft. In other words, the return run, or flyback, of the laser beamis implemented for recording data too, thus increasing the scanspeed when using bidirectional scan mode.
If bidirectional scan mode is active, you can double the scanspeed selected with the Speed button:
Unidirectional Bidirectional
200Currently
unavailableImage lines per second
400 800 Image lines per second
800 1600 Image lines per second
1000 2000 Image lines per second
see Selecting a Scan Speed

8/6/2019 Manual Leica Software TCS-SP2
http://slidepdf.com/reader/full/manual-leica-software-tcs-sp2 39/82
Version: RK09052000Page 39
In order to accurately align the pixels of the forward sweep andflyback, the phase between the forward sweep and the flybackcan be adjusted. To do so, use the Phase button or thecorresponding rotary knob of the control panel.
see Setting the Phase see Controlling Functions from the Control Panel
NoteIf the speed is set to 800 or 1000, the maximum scan field can
no longer be scanned because of technical, device-related
reasons. The system switches automatically to zoom factor 2
and zoom factor 4 respectively.
5.1.20 Adjusting the phase
Function
Recording images in bidirectional scan mode can result in aphase shift between the forward sweep and flyback of the
scanning beam. Click the Phase button to open a dialog windowwhich you can use to correct the shift:
" Use the mouse to move the slide on the scale until the pixel shift in the image disappears.
You can also adjust the phase using the corresponding rotaryknob of the control panel.
see Controlling Functions from the Control Panel
Additional Information
For each zoom factor, a phase adjustment has already beencarried out by the factory, and the corresponding values havealso been set. Based on the temperature response of mechanical and electronical devices, a slight deviation in theadjusted standard values can result during operation, which canbe readjusted with this function.

8/6/2019 Manual Leica Software TCS-SP2
http://slidepdf.com/reader/full/manual-leica-software-tcs-sp2 40/82
Version: RK09052000Page 40
5.1.21 Applying the Parameter Setting of anExperiment
Function
Use the Apply button to use the hardware settings of a previousexperiment for recording a new experiment. This lets youconfigure the settings for new image recordings with a singleclick with the scan parameters that have been optimallyconfigured for a previous application.
" Activate the image data block that is configured with the settings you want to apply to thenew experiment.
" Click the Apply button.
5.1.22 Recording an Image Using theAveraging Method
Function
The Average button applies an averaging method to the imagerecording. In this case, every individual image, i.e. every xy-section or xz-section, is scanned several times. For everysampling point, the arithmetical average is calculated from therepeatedly measured intensity values and represented in theresult image. The method used here determines a consecutiveaverage. This means every image recorded after the first image
is calculated with the results of the previously displayed imageand is displayed in the result image (dynamic average).
Clicking the Average button opens a dialog window that you canuse to set how often a section is to be scanned. You can selectfrom 1 to 64 scan repeats.
Typical ApplicationsRecording an image using the averaging method is primarilyuseful for suppressing noise. In fluorescence microscopy, weakfluorescent specimens result in little light reaching the detector.
The resulting low photon count leads to noisy images. In such

8/6/2019 Manual Leica Software TCS-SP2
http://slidepdf.com/reader/full/manual-leica-software-tcs-sp2 41/82
Version: RK09052000Page 41
cases, you can improve the signal-to-noise ratio by carrying outmultiple recordings and determining averages of the image.
NoteRecording an image using the averaging method is not
recommended for bleach-sensitive specimens. Repeated
recordings and the resulting length of subjection to light can lead
to the destruction of the specimen.
5.2 Softwarefunctions for data display
5.2.1 The Viewer Window
The default setting of the Viewer window consists of three mainareas. The image window (4), in which the recorded images aredisplayed, is located in the middle. Button pads (1) and (2) canbe arranged to the left and below the image window and theExperiment legend (3) to the right of it. It is possible to selectother default layouts of the Viewer window and save user-defined configurations of it.
see Saving the Viewer Window as a Template
Button Pads (1) and (2)By default, the button pad to the left of the image windowcontains the buttons for image viewing functions and the buttonpad below the image window contains the buttons used for scrolling through the individual images of an image series. Bothbutton pads can be moved within the Viewer window or removedfrom it as separate windows. To do so, click on the double-linededge of the button pad and drag it while keeping the mousebutton depressed to the desired position.
Image Window (4)
If you place the mouse pointer at any position within the imagewindow and then press the right mouse button, a context menucontaining the following commands opens:
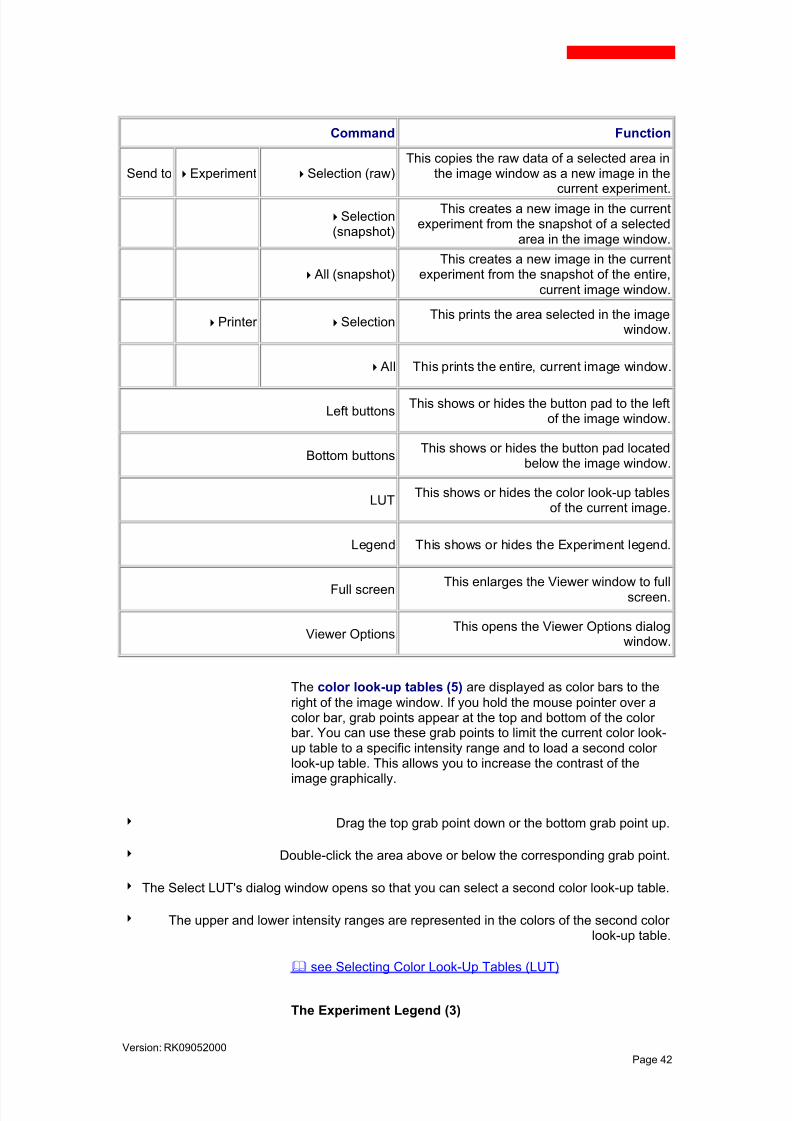
8/6/2019 Manual Leica Software TCS-SP2
http://slidepdf.com/reader/full/manual-leica-software-tcs-sp2 42/82
Version: RK09052000Page 42
Command Function
Send to "Experiment "Selection (raw)This copies the raw data of a selected area in
the image window as a new image in thecurrent experiment.
"Selection(snapshot)
This creates a new image in the currentexperiment from the snapshot of a selected
area in the image window.
"All (snapshot)This creates a new image in the current
experiment from the snapshot of the entire,current image window.
"Printer "SelectionThis prints the area selected in the image
window.
"All This prints the entire, current image window.
Left buttonsThis shows or hides the button pad to the left
of the image window.
Bottom buttonsThis shows or hides the button pad located
below the image window.
LUTThis shows or hides the color look-up tables
of the current image.
Legend This shows or hides the Experiment legend.
Full screenThis enlarges the Viewer window to full
screen.
Viewer OptionsThis opens the Viewer Options dialog
window.
The color look-up tables (5) are displayed as color bars to the
right of the image window. If you hold the mouse pointer over acolor bar, grab points appear at the top and bottom of the color bar. You can use these grab points to limit the current color look-up table to a specific intensity range and to load a second color look-up table. This allows you to increase the contrast of theimage graphically.
" Drag the top grab point down or the bottom grab point up.
" Double-click the area above or below the corresponding grab point.
" The Select LUT's dialog window opens so that you can select a second color look-up table.
" The upper and lower intensity ranges are represented in the colors of the second color look-up table.
see Selecting Color Look-Up Tables (LUT)
The Experiment Legend (3)
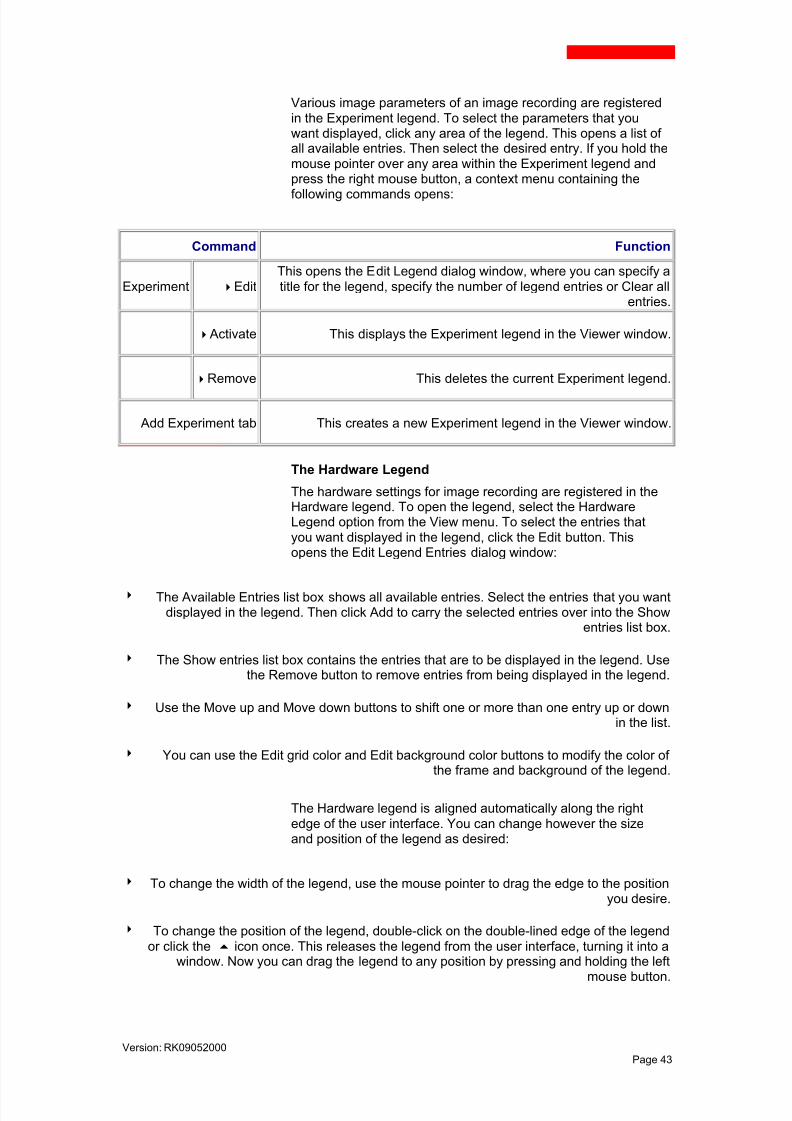
8/6/2019 Manual Leica Software TCS-SP2
http://slidepdf.com/reader/full/manual-leica-software-tcs-sp2 43/82
Version: RK09052000Page 43
Various image parameters of an image recording are registeredin the Experiment legend. To select the parameters that youwant displayed, click any area of the legend. This opens a list of all available entries. Then select the desired entry. If you hold themouse pointer over any area within the Experiment legend andpress the right mouse button, a context menu containing the
following commands opens:
Command Function
Experiment "EditThis opens the Edit Legend dialog window, where you can specify atitle for the legend, specify the number of legend entries or Clear all
entries.
"Activate This displays the Experiment legend in the Viewer window.
"Remove This deletes the current Experiment legend.
Add Experiment tab This creates a new Experiment legend in the Viewer window.
The Hardware Legend
The hardware settings for image recording are registered in theHardware legend. To open the legend, select the HardwareLegend option from the View menu. To select the entries thatyou want displayed in the legend, click the Edit button. Thisopens the Edit Legend Entries dialog window:
" The Available Entries list box shows all available entries. Select the entries that you wantdisplayed in the legend. Then click Add to carry the selected entries over into the Show
entries list box.
" The Show entries list box contains the entries that are to be displayed in the legend. Usethe Remove button to remove entries from being displayed in the legend.
" Use the Move up and Move down buttons to shift one or more than one entry up or down
in the list.
" You can use the Edit grid color and Edit background color buttons to modify the color of the frame and background of the legend.
The Hardware legend is aligned automatically along the rightedge of the user interface. You can change however the sizeand position of the legend as desired:
" To change the width of the legend, use the mouse pointer to drag the edge to the positionyou desire.
" To change the position of the legend, double-click on the double-lined edge of the legend
or click the# icon once. This releases the legend from the user interface, turning it into awindow. Now you can drag the legend to any position by pressing and holding the left
mouse button.
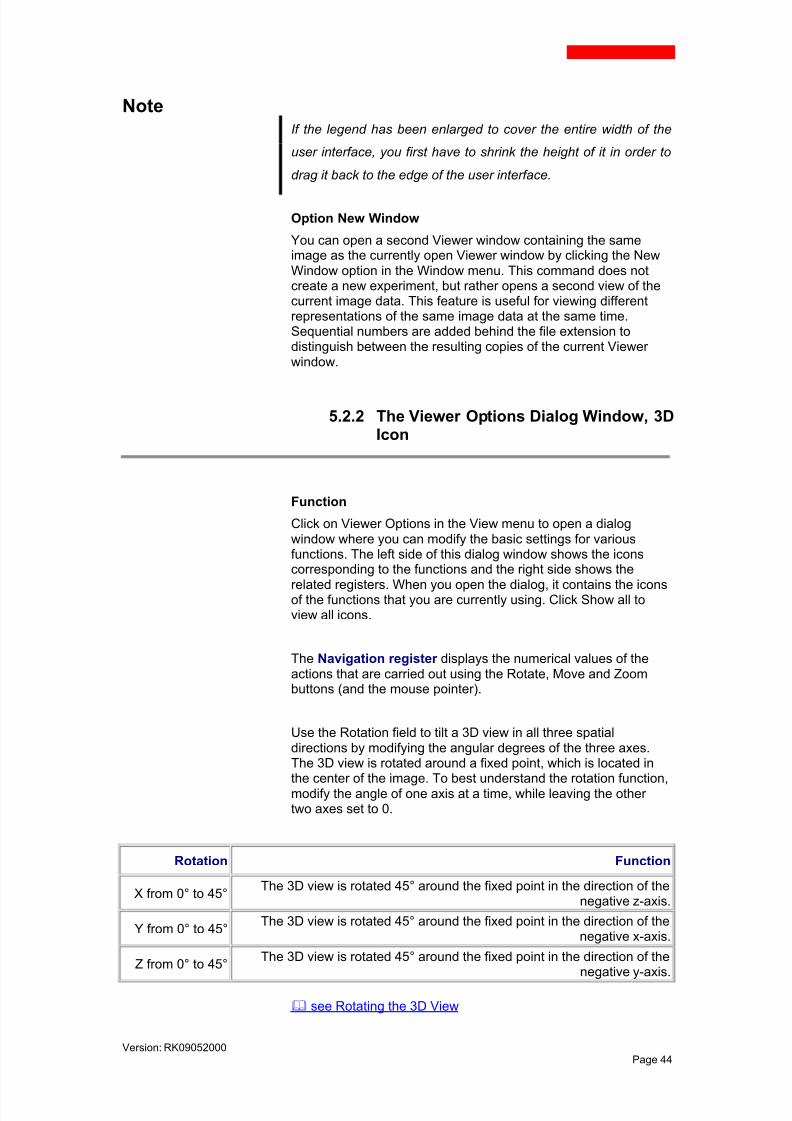
8/6/2019 Manual Leica Software TCS-SP2
http://slidepdf.com/reader/full/manual-leica-software-tcs-sp2 44/82
Version: RK09052000Page 44
NoteIf the legend has been enlarged to cover the entire width of the
user interface, you first have to shrink the height of it in order to
drag it back to the edge of the user interface.
Option New Window
You can open a second Viewer window containing the sameimage as the currently open Viewer window by clicking the NewWindow option in the Window menu. This command does notcreate a new experiment, but rather opens a second view of thecurrent image data. This feature is useful for viewing differentrepresentations of the same image data at the same time.Sequential numbers are added behind the file extension todistinguish between the resulting copies of the current Viewer window.
5.2.2 The Viewer Options Dialog Window, 3DIcon
Function
Click on Viewer Options in the View menu to open a dialogwindow where you can modify the basic settings for variousfunctions. The left side of this dialog window shows the iconscorresponding to the functions and the right side shows the
related registers. When you open the dialog, it contains the iconsof the functions that you are currently using. Click Show all toview all icons.
The Navigation register displays the numerical values of theactions that are carried out using the Rotate, Move and Zoombuttons (and the mouse pointer).
Use the Rotation field to tilt a 3D view in all three spatialdirections by modifying the angular degrees of the three axes.The 3D view is rotated around a fixed point, which is located inthe center of the image. To best understand the rotation function,modify the angle of one axis at a time, while leaving the other two axes set to 0.
Rotation Function
X from 0° to 45°The 3D view is rotated 45° around the fixed point in the direction of the
negative z-axis.
Y from 0° to 45°The 3D view is rotated 45° around the fixed point in the direction of the
negative x-axis.
Z from 0° to 45°The 3D view is rotated 45° around the fixed point in the direction of the
negative y-axis.
see Rotating the 3D View

8/6/2019 Manual Leica Software TCS-SP2
http://slidepdf.com/reader/full/manual-leica-software-tcs-sp2 45/82
Version: RK09052000Page 45
Use the Translation field to shift a 3D view to the right or left, upor down and enlarge or shrink it by modifying the coordinatevalues. Use the dot as the decimal placeholder.
Translation Function
X Positive values shift the 3D view to the right, negative to the left.
Y Positive values enlarge the 3D view, negative shrink it.
Z Positive values shift the 3D view up, negative down.
Use the Predefined field to change the viewing perspective of theimage to Top view or Side view by clicking these buttonsrespectively.
see Moving the 3D View see Zooming the 3D View
In the Display register , click one of the listed commands toshow or hide the corresponding graphic element of the 3D viewin the Viewer window:
GraphicElements
Function
Show LUT Show the selected color look-up table on the z-axis.
Show scale Show the scale.
Show boundingbox
Show the bounding box, which limits the measurement volume.
Show axes Show the coordinate axes.
Show data during3D motion
Show the image data while the 3D view is being rotated, shifted, enlargedor shrunken.
5.2.3 The Viewer Options Dialog Window,Display Icon
Function
Click on Viewer Options in the View menu to open a dialogwindow where you can modify the basic settings for variousfunctions. The left side of this dialog window shows the iconscorresponding to the functions and the right side shows therelated registers. When you open the dialog, it contains the icons
of the functions that you are currently using. Click Show all toview all icons.

8/6/2019 Manual Leica Software TCS-SP2
http://slidepdf.com/reader/full/manual-leica-software-tcs-sp2 46/82
Version: RK09052000Page 46
In the Settings register select the Display field to zoom in onand zoom out of the image displayed in the Viewer window usingthe graphical zoom function.
n-1 Zooms in on the image by displaying n pixel as 1 pixel in the result image.
Automatic The image is displayed in the original size.
1-n Zooms out of the image by displaying 1 pixel as n pixel in the result image.
NoteThe Leica Confocal Software provides three different zoom
features: the graphical zoom, the 3D zoom and the electronic
zoom.
see Zooming the 3D View see The Electronic Zoom
In the same register click one of the boxes to show or hide thecorresponding graphic element in the Viewer window:
Scale Displays a scale bar with unit of length in the Viewer window.
Grid Applies a grid to the image displayed in the Viewer window.
The length of the scale bar is calculated depending on the selected objective, electroniczoom and beam expander.
You can use the Movie register to set the speed for running thefilm sequence of an image series. You can choose speeds from6 images per minute to 25 images per second.
"
Use the mouse to drag the slide on the scale to the desiredvalue.
see Starting and Ending a Film
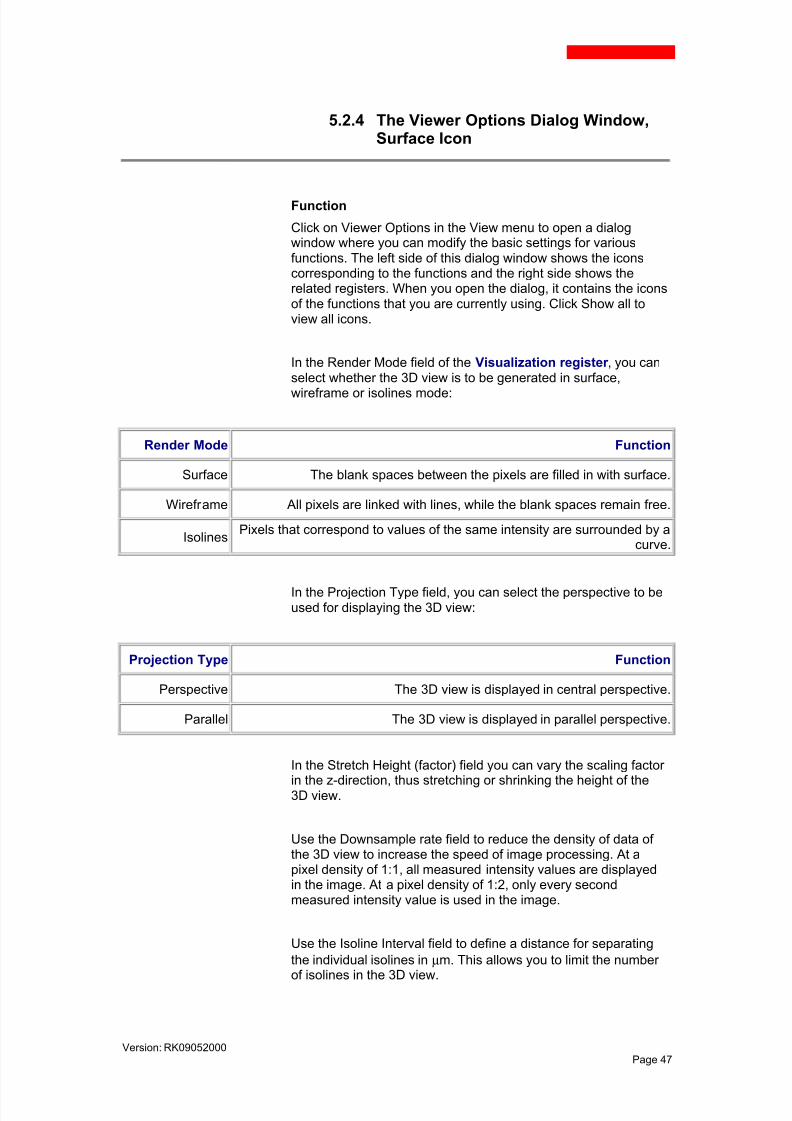
8/6/2019 Manual Leica Software TCS-SP2
http://slidepdf.com/reader/full/manual-leica-software-tcs-sp2 47/82
Version: RK09052000Page 47
5.2.4 The Viewer Options Dialog Window,Surface Icon
Function
Click on Viewer Options in the View menu to open a dialogwindow where you can modify the basic settings for variousfunctions. The left side of this dialog window shows the iconscorresponding to the functions and the right side shows therelated registers. When you open the dialog, it contains the iconsof the functions that you are currently using. Click Show all toview all icons.
In the Render Mode field of the Visualization register , you canselect whether the 3D view is to be generated in surface,
wireframe or isolines mode:
Render Mode Function
Surface The blank spaces between the pixels are filled in with surface.
Wireframe All pixels are linked with lines, while the blank spaces remain free.
IsolinesPixels that correspond to values of the same intensity are surrounded by a
curve.
In the Projection Type field, you can select the perspective to beused for displaying the 3D view:
Projection Type Function
Perspective The 3D view is displayed in central perspective.
Parallel The 3D view is displayed in parallel perspective.
In the Stretch Height (factor) field you can vary the scaling factor
in the z-direction, thus stretching or shrinking the height of the3D view.
Use the Downsample rate field to reduce the density of data of the 3D view to increase the speed of image processing. At apixel density of 1:1, all measured intensity values are displayedin the image. At a pixel density of 1:2, only every secondmeasured intensity value is used in the image.
Use the Isoline Interval field to define a distance for separating
the individual isolines in µm. This allows you to limit the number of isolines in the 3D view.
8/6/2019 Manual Leica Software TCS-SP2
http://slidepdf.com/reader/full/manual-leica-software-tcs-sp2 48/82
Version: RK09052000Page 48
Use the Isoline Detail Level field to enter a limiting value,specifying that only isolines of a particular length are to bedisplayed in the 3D view. This limits the displayed isolines tothose which correspond to an intensity value that has a specificfrequency of occurrence.
see Creating the 3D View
5.2.5 Viewing Detection Channel 1
Function
Clicking the Channel 1 button displays the image data that havebeen recorded in detection channel 1 in the Viewer window. Youcan assign any of several color look-up tables to the detectionchannel. This setting can be changed both in the result imageand while the image is being recorded. To do so, open the SelectLook-up Tables dialog window. There are two ways of openingthe dialog window:
" Click the Select Look-up Tables button.
" Hold the mouse pointer over any position in the Viewer window.
Click the right mouse button. Click on the LUT item in the context menu that appears.The color bars for the active detection channels appear in the Viewer window.
Double-click the corresponding color bar.
see Selecting Color Look-Up Tables (LUT)
NoteThis method of assigning color look-up tables only influences the
currently displayed image. As soon as you start a new scan, the
color look-up tables configured in the Beam Path Setting dialog
window are applied again.
see Setting the Beam Path
8/6/2019 Manual Leica Software TCS-SP2
http://slidepdf.com/reader/full/manual-leica-software-tcs-sp2 49/82
Version: RK09052000Page 49
5.2.6 Viewing Detection Channel 2
Function
Clicking the Channel 2 button displays the image data that havebeen recorded in detection channel 2 in the Viewer window. Youcan assign any of several color look-up tables to the detectionchannel. This setting can be changed both in the result imageand while the image is being recorded. To do so, open the SelectLook-up Tables dialog window. There are two ways of openingthe dialog window:
" Click the Select Look-up Tables button.
" Hold the mouse pointer over any position in the Viewer window.Click the right mouse button. Click on the LUT item in the context menu that appears.
The color bars for the active detection channels appear in the Viewer window.Double-click the corresponding color bar.
see Selecting Color Look-Up Tables (LUT)
Note This method of assigning color look-up tables only influences the
currently displayed image. As soon as you start a new scan, the
color look-up tables configured in the Beam Path Setting dialog
window are applied again.
see Setting the Beam Path
5.2.7 Viewing Detection Channel 3
Function
Clicking the Channel 3 button displays the image data that havebeen recorded in detection channel 3 in the Viewer window. Youcan assign any of several color look-up tables to the detectionchannel. This setting can be changed both in the result image
and while the image is being recorded. To do so, open the Select

8/6/2019 Manual Leica Software TCS-SP2
http://slidepdf.com/reader/full/manual-leica-software-tcs-sp2 50/82
Version: RK09052000Page 50
Look-up Tables dialog window. There are two ways of openingthe dialog window:
" Click the Select Look-up Tables button.
" Hold the mouse pointer over any position in the Viewer window.Click the right mouse button. Click on the LUT item in the context menu that appears.
The color bars for the active detection channels appear in the Viewer window.Double-click the corresponding color bar.
see Selecting Color Look-Up Tables (LUT)
NoteThis method of assigning color look-up tables only influences the
currently displayed image. As soon as you start a new scan, the
color look-up tables configured in the Beam Path Setting dialog window are applied again.
see Setting the Beam Path
5.2.8 Viewing Detection Channel 4
Function
Clicking the Channel 4 button displays the image data that havebeen recorded in detection channel 4 in the Viewer window. Youcan assign any of several color look-up tables to the detectionchannel. This setting can be changed both in the result imageand while the image is being recorded. To do so, open the SelectLook-up Tables dialog window. There are two ways of openingthe dialog window:
" Click the Select Look-up Tables button.
" Hold the mouse pointer over any position in the Viewer window.Click the right mouse button. Click on the LUT item in the context menu that appears.
The color bars for the active detection channels appear in the Viewer window.Double-click the corresponding color bar.
see Selecting Color Look-Up Tables (LUT)
Note
This method of assigning color look-up tables only influences thecurrently displayed image. As soon as you start a new scan, the

8/6/2019 Manual Leica Software TCS-SP2
http://slidepdf.com/reader/full/manual-leica-software-tcs-sp2 51/82
Version: RK09052000Page 51
color look-up tables configured in the Beam Path Setting dialog
window are applied again.
see Setting the Beam Path
5.2.9 Viewing Detection Channel 5
Function
Clicking the Channel 5 button displays the image data that havebeen recorded in detection channel 5 in the Viewer window. Youcan assign any of several color look-up tables to the detectionchannel. This setting can be changed both in the result imageand while the image is being recorded. To do so, open the SelectLook-up Tables dialog window. There are two ways of openingthe dialog window:
" Click the Select Look-up Tables button.
" Hold the mouse pointer over any position in the Viewer window.
Click the right mouse button. Click on the LUT item in the context menu that appears.The color bars for the active detection channels appear in the Viewer window.
Double-click the corresponding color bar.
see Selecting Color Look-Up Tables (LUT)
NoteThis method of assigning color look-up tables only influences the
currently displayed image. As soon as you start a new scan, the
color look-up tables configured in the Beam Path Setting dialog
window are applied again.
see Setting the Beam Path

8/6/2019 Manual Leica Software TCS-SP2
http://slidepdf.com/reader/full/manual-leica-software-tcs-sp2 52/82
Version: RK09052000Page 52
5.2.10 Selecting Color Look-Up Tables (LUT)
Function
Use the Look-up Tables button to open a dialog window, whichyou can use to assign color look-up tables to the five detectionchannels. The color look-up tables can be configured both in theresult image and while the image is being recorded:
" Click the detection channel to which you want to assign a new color look-up table in the
Select Channel field.
" Select the desired color look-up table in the Select LUT field.
" Click Apply to check the results in the Viewer window.
It is also possible to open the Select LUT's dialog window fromthe Viewer window.
" Hold the mouse pointer over any position in the Viewer window. Then push the rightmouse button. Click on the LUT item in the context menu that appears.
" The color bars for the active detection channels appear in the Viewer window to the right of
the image window. Double-click one of the color bars.
Loading a second color look-up table
If you hold the mouse pointer over a color bar, grab pointsappear at the top and bottom of the color bar. You can use thesegrab points to limit the current color look-up table to a specificintensity range and to load a second color look-up table:
" Drag the top grab point down or the bottom grab point up.
" Double-click the area above or below the corresponding grab point.
" The Select LUT's dialog window opens so that you can select a second color look-up table.
" The upper and lower intensity ranges are represented in the colors of the second color look-up table.
NoteThis method of assigning color look-up tables only influences the
currently displayed image. As soon as you start a new scan, the
color look-up tables configured in the Beam Path Setting dialog window are applied again.

8/6/2019 Manual Leica Software TCS-SP2
http://slidepdf.com/reader/full/manual-leica-software-tcs-sp2 53/82
Version: RK09052000Page 53
see Setting the Beam Path
Typical Applications
Generally the selection of a suitable color look-up table for aspecific use depends on the user's own judgment and needs.
Experience shows however that certain color look-up tables areparticularly useful for specific uses.
Color Look-Up Table Application
Green This is commonly used for recordingspecimens that have been markedwith FITC, Cy2, DTAF or other similar fluorochromes, which emitwithin the green spectral range.
Red This is commonly used for recording specimens that have been
marked with TRITC, Texas Red, Cy3, Rodamin or other similar fluorochromes, which emit within the red spectral range.
Blue This is commonly used for recording specimens that have beenmarked with UV fluorochromes such as DAPI or Hoechst or other similar fluorochromes, which emit within the blue spectral range.
Gray This is commonly used for displaying transmission recordings.
P. Color 1, 2, 3, 4, 5, 6 This is commonly used for recording specimens that have beenmarked with pH-sensitive or ion-sensitive fluorochromes and for
displaying time series.
Geo (Land), Geo (Sea)Geo (Land & Sea)
R & B
These are recommended for generating topographical images,i.e. for mapping surface structures. Geo Land & Sea is especially
useful for visualizing depths and graduations.Glow,
Glow (Over),Glow (Under),
Glow (Over & Under)
These are recommended for optimizing image contrast (theoffset and gain of the detectors). Glow Over highlights in blue
intensities at the upper end of the table while Glow Under represents in green intensities at the lower end of the table. Glow
Over and Under is a combination of these two color tables.
Cyan, Magenta, Yellow These are recommended for printing images. The CMY(K) colorsare generally used for the printer system color output. RGBcolors such as the other color look-up table used here are
applied generally for color representation on monitors. Becausethese two color systems vary greatly, the colors in the CMY(K)
representation can differ strongly from those used in the monitor representation.
All color look-up tables are also available with inverse color flow,meaning high intensities are represented as dark and lowintensities light.

8/6/2019 Manual Leica Software TCS-SP2
http://slidepdf.com/reader/full/manual-leica-software-tcs-sp2 54/82
Version: RK09052000Page 54
5.2.11 Viewing a Single Image
Function
Click the Single button to view only one detection channel or several detection channels in only one image in the Viewer window. The following display modes are available depending onthe other options you enable simultaneously.
Button Combination Display
Single + Channel 1 / 2 / 3 / 4 / 5Only the selected detection channel is displayed;
for an image series, the first image of the selecteddetection channel is displayed.
Single + Gallery + Channel 1 / 2 / 3 / 4 / 5All individual images in an image series are
displayed for the selected detection channel only.
Single + Overlay + Channel 1 / 2 / 3 / 4 /5
A single overlay image is generated from allselected detection channels; for an image series,the first image of each selected detection channel
is used.
Single + Gallery + Overlay + Channel 1 /2 / 3 / 4 / 5
Based on the number of individual images in animage series, overlay images are generated from
all selected detection channels.
NoteThe Single and Tiled buttons cannot be enabled simultaneously
because they carry out opposing functions.
5.2.12 Viewing a Multiple Image
Function
If you click the Tiled button, the detection channels are displayedseparately in the Viewer window. The following display modes
are available depending on the other options you enablesimultaneously.
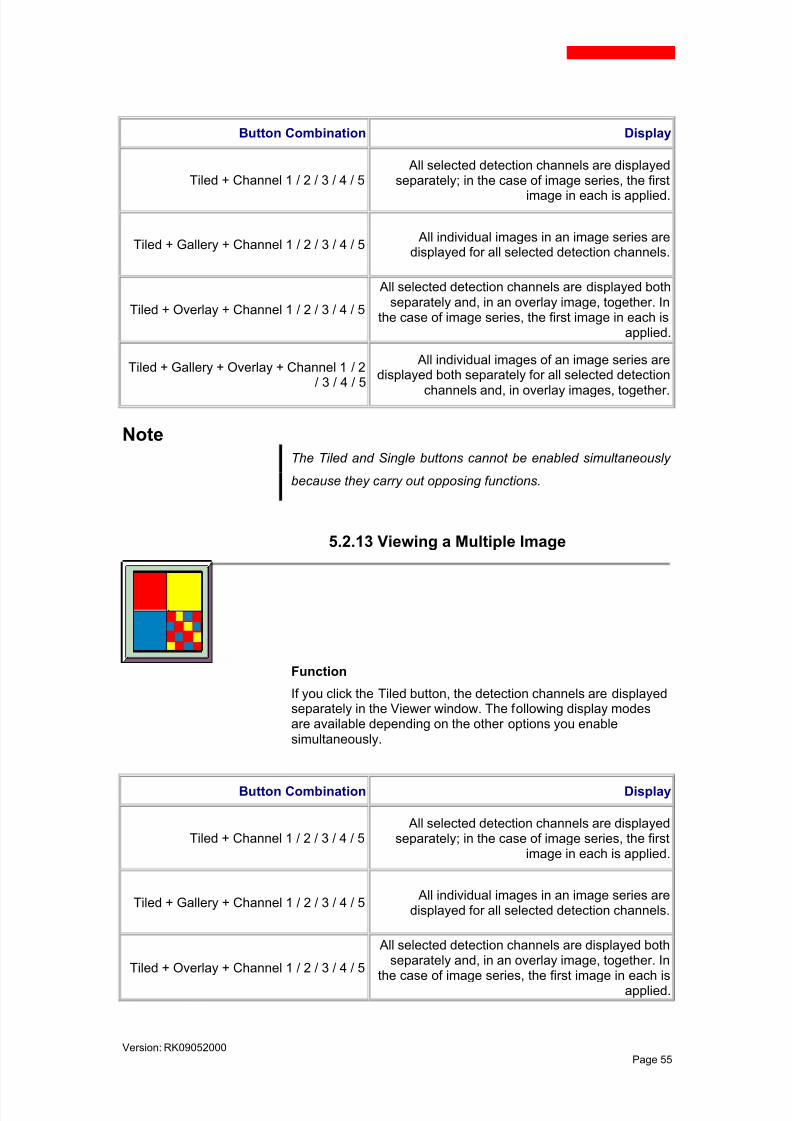
8/6/2019 Manual Leica Software TCS-SP2
http://slidepdf.com/reader/full/manual-leica-software-tcs-sp2 55/82
Version: RK09052000Page 55
Button Combination Display
Tiled + Channel 1 / 2 / 3 / 4 / 5All selected detection channels are displayed
separately; in the case of image series, the first
image in each is applied.
Tiled + Gallery + Channel 1 / 2 / 3 / 4 / 5All individual images in an image series are
displayed for all selected detection channels.
Tiled + Overlay + Channel 1 / 2 / 3 / 4 / 5
All selected detection channels are displayed bothseparately and, in an overlay image, together. In
the case of image series, the first image in each isapplied.
Tiled + Gallery + Overlay + Channel 1 / 2/ 3 / 4 / 5
All individual images of an image series aredisplayed both separately for all selected detection
channels and, in overlay images, together.
NoteThe Tiled and Single buttons cannot be enabled simultaneously
because they carry out opposing functions.
5.2.13 Viewing a Multiple Image
Function
If you click the Tiled button, the detection channels are displayedseparately in the Viewer window. The following display modesare available depending on the other options you enablesimultaneously.
Button Combination Display
Tiled + Channel 1 / 2 / 3 / 4 / 5All selected detection channels are displayed
separately; in the case of image series, the firstimage in each is applied.
Tiled + Gallery + Channel 1 / 2 / 3 / 4 / 5All individual images in an image series are
displayed for all selected detection channels.
Tiled + Overlay + Channel 1 / 2 / 3 / 4 / 5
All selected detection channels are displayed bothseparately and, in an overlay image, together. In
the case of image series, the first image in each isapplied.

8/6/2019 Manual Leica Software TCS-SP2
http://slidepdf.com/reader/full/manual-leica-software-tcs-sp2 56/82
Version: RK09052000Page 56
Tiled + Gallery + Overlay + Channel 1 / 2/ 3 / 4 / 5
All individual images of an image series aredisplayed both separately for all selected detection
channels and, in overlay images, together.
Note The Tiled and Single buttons cannot be enabled simultaneously
because they carry out opposing functions.
5.2.14 Viewing an Overlay Image
Function
Click the Overlay button to display all selected detectionchannels together in an overlay image in the Viewer window.The following display modes are available depending on theother options you enable simultaneously.
Button Combination Display
Single + Overlay + Channel 1 / 2 / 3 / 4 /5
A single overlay image is generated from all
selected detection channels; for an image series,the first image of each selected detection channelis used.
Gallery + Single + Overlay + Channel 1 /2 / 3 / 4 / 5
Based on the number of individual images in animage series, overlay images are generated from
all selected detection channels.
Tiled + Overlay + Channel 1 / 2 / 3 / 4 / 5All selected detection channels are shown
separately as well as together in an overlay image.In an image series, the first image is used.
Tiled + Gallery + Overlay + Channel 1 / 2/ 3 / 4 / 5
All individual images of an image series are
displayed both separately for all selected detectionchannels and, in overlay images, together.
Use the Viewer Options dialog window to select from threemethods of color mixing for generating an overlay image:
" From the View menu, select Viewer Options.
" Click the Images icon and then click the Overlay register.
see The Viewer Options dialog window, Images Icon

8/6/2019 Manual Leica Software TCS-SP2
http://slidepdf.com/reader/full/manual-leica-software-tcs-sp2 57/82
Version: RK09052000Page 57
5.2.15 Viewing the First Image of a Series
Function
You can view the individual images of an image series as a filmsequence. Click First to jump to the first image in the series.
NoteIf the Gallery button is enabled, the First and Last, Next and
Previous and Play/Stop buttons are disabled and displayed in
gray. The Gallery button is used to show all of the individual
images of an image series and does not allow film sequence
mode.
5.2.16 Viewing the Next Image in a Series
Function
You can view the individual images of an image series as a filmsequence. Click Next to jump to the next image in the series.
NoteIf the Gallery button is enabled, the Next and Previous, First and
Last and Play/Stop buttons are disabled and displayed in gray.
The Gallery button is used to show all of the individual images of
an image series and does not allow film sequence mode.

8/6/2019 Manual Leica Software TCS-SP2
http://slidepdf.com/reader/full/manual-leica-software-tcs-sp2 58/82
Version: RK09052000Page 58
5.2.17 Viewing the Previous Image in a Series
Function
You can view the individual images of an image series as a filmsequence. Click Previous to jump to the previous image in theseries.
Note
If the Gallery button is enabled, the Next and Previous, First and Last and Play/Stop buttons are disabled and displayed in gray.
The Gallery button is used to show all of the individual images of
an image series and does not allow film sequence mode.
5.2.18 Viewing the Last Image of a Series
Function
You can view the individual images of an image series as a filmsequence. Click Last to jump to the last image in the series.
NoteIf the Gallery button is enabled, the First and Last, Next and
Previous and Play/Stop buttons are disabled and displayed in
gray. The Gallery button is used to show all of the individual
images of an image series and does not allow film sequence
mode.

8/6/2019 Manual Leica Software TCS-SP2
http://slidepdf.com/reader/full/manual-leica-software-tcs-sp2 59/82
Version: RK09052000Page 59
5.2.19 Starting and Ending a Film
Function
You can view the individual, recorded images of an image seriesas a film sequence. Use the Play/Stop button to start and stopthe film. The speed of the film, i.e. the number of individualimages per unit of time, is variable and can be set in the Viewer Options dialog window:
" From the View menu, select Viewer Options.
" Click the Display icon and then on the Movie register.
see The Viewer Options Dialog Window, Display Icon
NoteIf the Gallery button is enabled, the Play/Stop, First and Last,
Next and Previous buttons are disabled and displayed in gray.
The Gallery button is used to show all of the individual images of
an image series and does not allow film sequence mode.
5.2.20 Viewing a Series Image
Function
If you click the Gallery button, all of the individual images in animage series are displayed in the Viewer window. The followingdisplay modes are available depending on the other options youenable simultaneously.
Button Combination Display
Gallery + Single + Channel 1 / 2 / 3 / 4 / 5All individual images in an image series are
displayed for the selected detection channel only.

8/6/2019 Manual Leica Software TCS-SP2
http://slidepdf.com/reader/full/manual-leica-software-tcs-sp2 60/82
Version: RK09052000Page 60
Gallery + Single + Overlay + Channel 1 /2 / 3 / 4 / 5
Based on the number of individual images in animage series, overlay images are generated from
all selected detection channels.
Gallery + Tiled + Channel 1 / 2 / 3 / 4 / 5
All individual images in an image series are
displayed for all selected detection channels.
Gallery + Tiled + Overlay + Channel 1 / 2/ 3 / 4 /
All individual images of an image series aredisplayed both separately for all selected detection
channels and, in overlay images, together.
5.2.21 Projecting an Image Stack
FunctionUse the Projection function to select or calculate specificintensity data from an image stack, i.e. a series of xy or xz-sections, and display them in a two-dimensional image. Thisfunction examines the sampling points (voxels) that aresuperimposed along the z-axis throughout all optical sections.From each of these columns of sampling points, the intensity
value that is met by the selection criterion or the calculatedintensity value is displayed in the two-dimensional projectionimage as the representative of all values within the column.
Three different projection types are available: the maximumprojection, the mean projection and the transparent projection.
" The maximum projection uses the maximum intensity value as the representative.
" The average projection uses the arithmetical mean of the intensity values as therepresentative.
" The transparent projection uses a weighted mean of the intensity values as therepresentative. The weighting is composed of two factors. The first factor is the result of
the ratio of each measured intensity value to the maximum possible intensity (scalingfactor). The second factor takes into account the weight of the previously measured
intensity value. The higher the intensity of the previously measured sampling point, thegreater the weight is and the less the subsequently measured sampling points will
influence the calculation.
Use the Viewer Options dialog window to select one of theprojection types and configure any necessary options:
" From the View menu, select Viewer Options.

8/6/2019 Manual Leica Software TCS-SP2
http://slidepdf.com/reader/full/manual-leica-software-tcs-sp2 61/82
Version: RK09052000Page 61
" Click the Images icon and then click the Projections register.
see The Viewer Options Dialog Window, Images Icon
NoteNote the difference between a maximum projection and a
topographical image, which is generated from intensity
maximums. In a maximum projection, the intensity maximums
are assigned color values directly. In a topographical image
based on intensity maximums, the intensity maximums are
assigned real z-positions of the individual sampling points first
and then are color-coded.
5.2.22 Creating a Topographical Image
FunctionUse the Topography function to select specific intensity datafrom an image stack, i.e. a series of xy or xz-sections, andtransfer them into a two-dimensional topographical image. This
function examines the sampling points (voxels) that aresuperimposed along the z-axis throughout all optical sections.From each of these columns of sampling points, only theintensity value that is met by the selection criterion is displayedin the two-dimensional topographical image as therepresentative of all values within the column.
You can make your selection based on either the maximumintensity or the center of mass of the measured intensities. If youwant to represent the intensity maximums in the topographicalimage, only the sampling point at which the maximum intensitywas measured is selected. When determining the center of
mass, a mean value is calculated from all superimposedsampling points (the center of mass of the area that is limited bythe curve of the measured intensity values).
The intensity maximum or center of mass is then assigned thereal z-position of the corresponding sampling point and thencolor-coded. Based on this assignment, a topographical imagemaps the real surface structure of the specimen. Using thedefault settings, higher structures appear light and deeper structures dark.
Use the Viewer Options dialog window to set the selectioncriterion for the topographical image:
8/6/2019 Manual Leica Software TCS-SP2
http://slidepdf.com/reader/full/manual-leica-software-tcs-sp2 62/82
Version: RK09052000Page 62
" From the View menu, select Viewer Options.
" Click the Images icon and then click the Topography register.
see The Viewer Options Dialog Window, Images Icon
By applying a second step, you can display the topographicalimage as a three-dimensional graphical image using the 3DView function.
see Creating the 3D View
Typical Applications
Displaying the image data in a topographical image is especially
informative in material scientific research. For the application of quantification functions, the topography function isindispensable.
5.2.23 Viewing the Original Image
Function
Click the Original button to reset a projection image or topographical image. The Viewer window then displays therecorded raw data of the image again.
5.2.24 Creating the 3D View
Function
Use the 3D View button to display a two-dimensional data recordthree-dimensionally. When viewing an image series, the datarecord of the series that is currently being viewed in the Viewer window is always the one applied. You can display a single xy-section or xz-section from the raw data or a result image, suchas a topographical image or projection image, in the 3D view.Depending on the dimension represented or calculated in thesource image, either intensity values or height values are
mapped to the z-axis of the 3D view when the 3D view isgenerated.
8/6/2019 Manual Leica Software TCS-SP2
http://slidepdf.com/reader/full/manual-leica-software-tcs-sp2 63/82
Version: RK09052000Page 63
NoteThe spatial representation of intensity in a 3D view leads easily
to the assumption that the topography of the specimen is being
represented. Note however that you can only display the real
surface structure of a specimen if you have generated a
topographical image first.
see Creating a Topographical Image
The 3D view can be generated in three different modes: surface,wireframe or isolines. Set the display mode in the Viewer Options dialog window:
" From the View menu, select Viewer Options.
" Click the Surface icon and then the Visualization register.
see The Viewer Options Dialog Window, Surface Icon
Note A separate 3D view is created for each detection channel.
Therefore it is not possible to generate a single 3D view from
one overlay image (Overlay button).
5.2.25 Rotating the 3D View
FunctionUse the Rotate button to rotate a 3D view in all three spatialdirections. Note that the 3D view is rotated around a fixed point,which is located in the center of the image.
" Hold the mouse pointer over any position in the 3D view.
" Press and hold the left mouse button.
" Move the mouse pointer in the direction in which you want to rotate the 3D view.
NoteWhile the 3D view is being turned, the resolution of the image is

8/6/2019 Manual Leica Software TCS-SP2
http://slidepdf.com/reader/full/manual-leica-software-tcs-sp2 64/82
Version: RK09052000Page 64
decreased in order to speed up processing. When the left mouse
button is released, the image is displayed with its original
resolution.
As an alternative to rotating a 3D view manually, the Viewer Options dialog window also provides the option of specifying theangles of rotation for the three spatial axes:
" From the View menu, select Viewer Options.
" Click the 3D icon and then click the Navigation register.
" You can then specify the angles of rotation for all three axes in the Rotation field.
see The Viewer Options Dialog Window, 3D Icon
5.2.26 Moving the 3D View
Function
Use the Move button to shift a 3D view
" Hold the mouse pointer over any position in the 3D view.
" Press and hold the left mouse button.
" Move the mouse pointer in the direction in which you want to move the 3D view.
NoteWhile the 3D view is being moved, the resolution of the image is
decreased in order to speed up processing. When the left mouse
button is released, the image is displayed with its original
resolution.
As an alternative to moving a 3D view manually, the Viewer Options dialog window also provides the option of specifying thecoordinate values for the position of the image:
" From the View menu, select Viewer Options.
" Click the 3D icon and then click the Navigation register.
" Modify the coordinate values for the x-axis and z-axis in the Translation field.
8/6/2019 Manual Leica Software TCS-SP2
http://slidepdf.com/reader/full/manual-leica-software-tcs-sp2 65/82
Version: RK09052000Page 65
see The Viewer Options Dialog Window, 3D Icon
5.2.27 Zooming the 3D View
Function
Use the Zoom button to magnify and shrink continuously a 3Dview while maintaining the aspect ratio. This function onlyadjusts the scale of, i.e. zooms, the generated image. It cannot
be used to improve its resolution.
To zoom in on the 3Dview
Click anywhere inside the image window of the Viewer window and,while pressing the left mouse button, drag the mouse pointer toward
the lower edge.
To zoom out of the 3Dview
Click anywhere inside the image window of the Viewer window and,while pressing the left mouse button, drag the mouse pointer toward
the upper edge.
NoteWhile the 3D view is being zoomed, the resolution of the image
is decreased in order to speed up processing. When the left
mouse button is released, the image is displayed with its original
resolution.
As an alternative to zooming a 3D view manually, the Viewer Options dialog window also allows you to change the zoom scaleby specifying numerical values:
" From the View menu, select Viewer Options.
" Click the 3D icon.
" You can then vary the zoom factor in the Navigation register by changing the y value in theTranslation field.
see The Viewer Options Dialog Window, 3D Icon
NoteThe Leica Confocal Software provides three different zoom
features: the 3D zoom, the electronic zoom and the graphical
zoom.
8/6/2019 Manual Leica Software TCS-SP2
http://slidepdf.com/reader/full/manual-leica-software-tcs-sp2 66/82
Version: RK09052000Page 66
see The Electronic Zoom
see The Viewer Options Dialog Window, Display Icon
5.3 Software functions for
measurements and analysis
5.3.1 Calculating a Histogram
Function
Use the Histogram function to graphically display the frequencyat which a specific dimension occurs. The histogram iscalculated from the data record selected in the Viewer window.The data record can be a single image or an image series fromraw data or a processed image. Depending on the dimensionrepresented in the image, either the distribution of intensity
values (I) or height values (µm) is calculated in the histogram.
Clicking the Histogram button opens the Histogram viewer window, which displays a histogram curve for each detectionchannel and subsequent statistical calculations:
Parameter Meaning Formula
# PixelThe total number of pixels that are included in the calculation of the
histogram. This corresponds to the configured scan format.
Mean The arithmetical mean value
Maximum Maximum value Max (I)
Minimum Minimum value Min (I)
Variance Variance
AverageDeviation Average deviation

8/6/2019 Manual Leica Software TCS-SP2
http://slidepdf.com/reader/full/manual-leica-software-tcs-sp2 67/82
Version: RK09052000Page 67
StandardDeviation
Standard deviation
Mean Energy Average image energy
Root MeanSquare (RMS)
Root mean square value
Skewness Skewness of the distribution
Some of the parameters are specified in scientific exponentialnotation, e.g. Pixel = 3.28e+005 = 327680 (corresponds to ascan format of 640 x 512).
NoteUsing the maximum and minimum values of intensity, the gain
values and offset values can be optimally configured for the
detectors.
5.3.2 Measuring a Profile in a Single Image
Function
Use the Profile function to measure a specific dimension over aline segment and display it graphically. The profile is measuredfrom the data record selected in the Viewer window. The datarecord can be a single image or an image series from raw data
or a processed image. Depending on the dimension representedin the image, either a measured curve of intensity values (I) or
height values (µm) is calculated.
When you click the Profile button, the line segment to bemeasured appears in the Viewer window as a white line in theimage. You can change the length and position of the linesegment by clicking the line and, while clicking and holding thegrab point with the left mouse button, dragging it to the desiredposition. The Profile viewer window opens, too, which displays aprofile curve for each detection channel and subsequentstatistical calculations:

8/6/2019 Manual Leica Software TCS-SP2
http://slidepdf.com/reader/full/manual-leica-software-tcs-sp2 68/82
Version: RK09052000Page 68
Parameter Meaning Formula
LengthThe length of the measured
section
Mean Amplitude The arithmetical mean
MaximumAmplitude
Maximum value Max (I)
MinimumAmplitude
Minimum value Min (I)
Average Deviation Average deviation
StandardDeviation
Standard deviation
Variance Variance
Some of the parameters are specified in scientific exponentialnotation, e.g. Variance = 1.88e+004 = 18800.
8/6/2019 Manual Leica Software TCS-SP2
http://slidepdf.com/reader/full/manual-leica-software-tcs-sp2 69/82
8/6/2019 Manual Leica Software TCS-SP2
http://slidepdf.com/reader/full/manual-leica-software-tcs-sp2 70/82
Version: RK09052000Page 70
5.4.2 Copying an Image onto the AnnotationSheet
Function
If you click the Snap button, the image loaded in the Viewer window is copied onto the annotation sheet. If you mark thecopied image and then press the right mouse button, a contextmenu containing the following commands appears:
Command Function
Original size This displays the image in its original size.
Fit to page This enlarges the image to the size of the annotation sheet.
Bring to front This brings the image to the foreground.
Send to back This sends the image to the background.
Delete This deletes the image.
You can change the size of the image by dragging one of theimage grab points. To move the image without changing its size,mark the image and move it while pressing the left mousebutton.
NoteThe Snap button can be applied only if a annotation sheet has
been opened using the Annotation button first and the Viewer
window has then been clicked.
5.4.3 Drawing a Line on the AnnotationSheet
Function
Use the Line button to draw a line on the annotation sheet. Onthe annotation sheet, click the position where you want the lineto begin. Keeping the left mouse button depressed, drag themouse pointer across the page to the position where you want
8/6/2019 Manual Leica Software TCS-SP2
http://slidepdf.com/reader/full/manual-leica-software-tcs-sp2 71/82
Version: RK09052000Page 71
the line to end. If you mark the line and then press the rightmouse button, a context menu containing the followingcommands appears:
Command Function
StyleThis opens a dialog window where you can configure the style, thickness and
length of the line.
Color This opens a dialog window for selecting a color for the line.
Bring to front This brings the line to the foreground.
Send to back This sends the line to the background.
Delete This deletes the line.
You can change the length of the line by dragging one of its grabpoints. To move the line without changing its size, click thecenter grab point and move the line while pressing and holdingthe left mouse button.
NoteThe Line button can be applied only if the annotation sheet has
been opened using the Annotation button first.
5.4.4 Drawing a Rectangle on theAnnotation Sheet
Function
Use the Rectangle button to draw a rectangle on the annotationsheet. On the annotation sheet, click the position where you
want the corner of the rectangle to be. Keeping the left mousebutton depressed, drag the mouse pointer across the page todefine the size of the rectangle. If you mark the rectangle andthen press the right mouse button, a context menu containingthe following commands appears:
Command Function
StyleThis opens a dialog window where you can configure, among other options, the
style and thickness of the line.
Color This opens a dialog window for selecting a color for the rectangle.
Bring to front This brings the rectangle to the foreground.

8/6/2019 Manual Leica Software TCS-SP2
http://slidepdf.com/reader/full/manual-leica-software-tcs-sp2 72/82
Version: RK09052000Page 72
Sent to back This sends the rectangle to the background.
Delete This deletes the rectangle.
You can change the size of the rectangle by dragging one of theimage grab points of the rectangle. To move the rectanglewithout changing its size, click in the middle of the rectangle andmove it while pressing and holding the left mouse button.
NoteThe Rectangle button can be applied only if the annotation sheet
has been opened using the Annotation button first.
5.4.5 Printing
Function
You can trigger the print command either by clicking the Printbutton or from the Printer Selection dialog window. To open thisdialog window, select the Print option in the File menu. Theimage loaded in the Viewer window or an annotation sheet canbe printed.
When you initiate the Print command, the image currently loadedin the Viewer window or the currently open annotation sheet isprinted using the default printer and default page layout. You canchange these default settings in the Printer Selection dialogwindow to suit your needs. Use the following buttons provided inthe dialog window to do so:
Button Function
Printer setup
This opens the dialog window for selecting a printer and changing the
printer settings.
Print This prints the image or the annotation sheet.
Background color Use this to open a dialog window for selecting a background color for the
page.
Center on page This centers the image on the page.
Fit to pageThis option changes the size of the image to fit the size of the printable
area.
Aspect ratioThe height-to-width ratio remains the same when the size of the image
changes.

8/6/2019 Manual Leica Software TCS-SP2
http://slidepdf.com/reader/full/manual-leica-software-tcs-sp2 73/82
Version: RK09052000Page 73
Use the Image field to change the height (Size Y) and width(Size X) of the image and to define a top margin (Offset Y) and aleft margin (Offset X). The image size and margins cannot bemodified if the Fit to page option is enabled. If you have enabledCenter on Page, you can change the size but not the margins.
Check the results of your settings in the Print Preview field. Usethe Page field to specify the height and width of the printablearea (which is not identical to the paper size). The two bottomlines of the dialog window display the currently installed printer and configured paper size.
NoteClose the Printer Selection dialog window by clicking OK to save
the new settings for the active Viewer window. This allows you to
store different printer settings and page layouts for different
images. However, these settings are not permanent and are lost
when you exit the Leica Confocal Software.
5.5 Softwarefunctions for datahandling
5.5.1 Opening a File
Function
With the Leica Confocal Software, you can open the following filetypes using the Open button:
File Type Description
Experiment (*.lei)A Leica-specific, binary data format. When the experiment is loaded,
both the image data and the experiment settings are loaded.
Annotation sheet(*.ano)
A Leica-specific, binary data format. The elements on the annotationsheet, such as images, texts and graphic images, are each available
as individual objects.
Tiff files (*.tif)
These are Leica image files in single and multi Tiff format. External
files in RGB-Tiff format can be loaded as well.
8/6/2019 Manual Leica Software TCS-SP2
http://slidepdf.com/reader/full/manual-leica-software-tcs-sp2 74/82
Version: RK09052000Page 74
see Creating an Experiment see Creating an Annotation Sheet
5.5.2 Saving a File
Function
Click the Save button to save the data of the current experiment(*.lei) or the current annotation sheet (*.ano).
If you use the Save button to save an experiment or annotationsheet for the first time, the Save As dialog window opens.
NoteIt is easy to mistakenly overwrite your original data using the
Save function. To avoid doing so, use the Save As function to
save an experiment, which has already been saved once or
more, under a new name.
see Saving a File As...
5.5.3 Saving a File As
Function
Use the Save As button to save an experiment (*.lei) or annotation sheet (*.ano) while giving it a specific name and filetype.
When saving an experiment, a folder is created at the file levelwith the name of the experiment. This folder then contains thedescription file (*.lei) for the experiment as well as the individualimage files. The format of the description file is Leica-specificand binary. This file contains the parameter settings and thecolor information (in the form of color look-up tables) for eachimage belonging to the experiment.
8/6/2019 Manual Leica Software TCS-SP2
http://slidepdf.com/reader/full/manual-leica-software-tcs-sp2 75/82

8/6/2019 Manual Leica Software TCS-SP2
http://slidepdf.com/reader/full/manual-leica-software-tcs-sp2 76/82
Version: RK09052000Page 76
5.5.5 Creating an Experiment
Function
Click the New Experiment button to open a new Viewer window,which creates a new experiment. An experiment is a file thatconsists of one ore more individual images or image series. Thisallows you to keep several images, each recorded using differentscan parameters, or edited versions of images in oneexperiment. The format of the experiment file (*.lei) is Leica-specific.
The Experiment Overview Viewer Window
To open the Experiment Overview viewer window, select theExperiment Overview option from the View menu. This viewer window displays the recorded images in a directory tree. Everynewly created experiment appears in this viewer window with afile name consisting of Experiment followed by a sequentialnumber and the *.lei extension. You can change file names andfile extensions using the Save and Save as buttons.
see Saving a File
see Saving a File as...
Individual images that you have recorded using the Single Scanfunction are entered into the directory tree with the name Image followed by a sequential number. Image series that you haverecorded using the Series Scan function are given namesconsisting of Series and a sequential number.
If you mark the name of an individual image or an image seriesand then press the right mouse button, a context menucontaining the following commands appears:
Command Function
Activate This displays the selected file in the Viewer window.
New Window This opens a second viewer window for the currently loaded image.
Delete This deletes the individual image or image series.
Properties This displays file properties and certain scan parameters in a dialog window.

8/6/2019 Manual Leica Software TCS-SP2
http://slidepdf.com/reader/full/manual-leica-software-tcs-sp2 77/82
Version: RK09052000Page 77
The Experiment Overview viewer window automatically appearsat the left edge of the user interface. You can change however the size and position of the viewer window as desired:
" To change the width of the viewer window, use the mouse pointer to drag the edge to the
position you desire.
" To change the position of the viewer window, double-click on the double-lined edge of thewindow or click the# icon once. This releases the viewer window from the user interface.
Now you can drag the viewer window to any position by pressing and holding the leftmouse button.
NoteIf the viewer window has been enlarged to cover the entire width
of the user interface, you first have to shrink the height of it in
order to drag it back to the edge of the user interface.
5.6 Softwarefunctions for customization
5.6.1 Saving the Viewer Window as aTemplate
Function
Use the Template button to save a user-defined layout of theViewer window as a template. The elements of the Viewer window which can be displayed or hidden, are the button pads,the color bars of the color look-up tables and the Experimentlegend.
see The Viewer Window
Clicking the Template button opens a dialog window where youenter a name for the template. The configuration of the Viewer window is saved and always loaded if you open a file or create anew experiment.
Additional Information
Click Options in the Tools menu and then select the Viewer Template register to get access to default and user-definedtemplates. You can select one of the following default templatesin the Leica Templates list field:

8/6/2019 Manual Leica Software TCS-SP2
http://slidepdf.com/reader/full/manual-leica-software-tcs-sp2 78/82
Version: RK09052000Page 78
Viewer Template Layout
Viewer (Pure) The viewer window consists of the image window, only.
Viewer (LUT)The viewer window consists of the image window and the color bars of the
color look-up tables.
Viewer (Standard)
The viewer window consists of the button pads, the image window, thecolor bars of the color look-up tables and the Experiment legend.
In the Personal Templates list field, user-defined templates areregistered. Use the buttons Add Active Viewer and RemoveTemplate to save a new template or to delete an existing one.
Click Options in the Tools menu and then select the Workspaceregister to define whether, and if, how many Viewer windows areto be opened at start-up of the Leica Confocal Software.
8/6/2019 Manual Leica Software TCS-SP2
http://slidepdf.com/reader/full/manual-leica-software-tcs-sp2 79/82
Version: RK09052000Page 79
6 Glossary
Aberration, chromatic An optical image distortion conditional on the varying refractionof light rays of different wavelengths on a lens. Thus light raysof shorter wavelengths have longer focal distances than light
rays of longer wavelengths.
Aberration, spherical An optical image distortion conditional on the varying distanceof paraxial light rays of the same wavelength from the optic axis.
Light rays that travel through outer lens zones have shorter focal distances than rays that travel through the lens center
(optic axis).
Achromat (achromaticobjective)
Describes a correction class for objectives. The chromatic aberration for two wavelengths is corrected for objectives of this
type. Usually an objective of this type is corrected to awavelength below 500nm and above 600nm. Furthermore, thesine condition for one wavelength is met. The image curvature
aberration is not corrected.
Airy disc The Airy disc refers to the inner, light circle (surrounded by alternating dark and light diffraction rings) of the diffraction pattern of a point light source. The diffraction discs of two
adjacent object points overlap some or completely, thus limiting the spatial resolution capacity.
Aliasing An image distortion caused by a sampling frequency that is toolow in relation to the signal frequency.
AOTFAcousto-Optical
Tunable Filter
The acousto-optical tunable filter is an optic transparent crystal that can be used to infinitely vary the intensity and wavelength
of radiated light. The crystal generates an internal ultrasonic wave field, the wavelength of which can be configured to any
value. Radiated light is diffracted vertically to the ultrasonic wave field like through a grid.
Aperture, numerical The aperture is the sine of the angle under which light entersinto the front lens of a microscope objective; its symbol is NA.The aperture influences both the light gathering capacity and
the resolution capacity of an objective. Since various media canbe present between specimen and objective lens (such as theembedding medium for the specimen), the numerical aperture
(NA = n * sin α ) is usually applied as the unit of measurement for the light gathering capacity and the resolution capacity.
Apochromat(apochromatic
objective)
Describes a correction class for objectives. The chromatic aberration for three wavelengths is corrected for objectives of
this type (usually 450nm, 550nm and 650nm) and the sinecondition for at least two colors is met. The image curvature
aberration is not corrected.
Bleaching, optical The destruction of fluorochromes by intense lighting. In
8/6/2019 Manual Leica Software TCS-SP2
http://slidepdf.com/reader/full/manual-leica-software-tcs-sp2 80/82
Version: RK09052000Page 80
light to a high state of energy, the singlet state. When theexcited molecules return to their normal energy state, a
fluorescent signal is emitted. If the intensity of the excitation istoo high however, the color molecules can change via
intercrossing from a singlet state to a triplet state. Due to thesignificantly longer life of triplet states (phosphorescence), these
excited molecules can react with triplet-oxide and be lost for further fluorescence excitation.
Confocality While the optical design of conventional microscopes results inthe detection of both focussed and unfocussed image
components, the confocal principle suppresses the structuresoutside of the focal plane of the microscope objective. To
achieve this pinholes are implemented in optically conjugated locations in the optical path. They function as point light source(excitation pinhole) and point detector (detection pinhole). The
diameter of the detection pinhole, along with the wavelengthand numerical aperture of the objective being used, determines
the axial extension of an optical section.
Curvature of image field The curved surface to which a microscopic image is to beclearly and distinctly mapped is described as image curvature
aberration. It is conditional on the convex shape of the lens and makes itself apparent as an error due to the short focal
distances of microscope objectives. Here the object image isnot in focus both in the center and at the periphery at the same
time. Objectives that are corrected for image curvatureaberration are called plane objectives (plane = flat image field).
Dichroic Dichroic filters are interference filters at an angle of incidence of light of 45°. The transmissivity and reflectivity of dichroites
depend on a specific wavelength of light. For an RSP 510 filter ( r eflection short pass), for example, the excitation light below 510 nm is reflected and the excitation light above this value is
transmitted. The transmission values are generally between80% and 90% and the reflection values between 90% and 95%.
Double dichroic Double dichroic filters are interference filters at an angle of incidence of light of 45°. The transmissivity and reflectivity of
double dichroites depend on two specific wavelengths of light.For a d ouble d ichroite DD 488/568, for example, the excitationlight at 488 nm and 568 nm is reflected and the excitation light
above these values is transmitted. The transmission values aregenerally at 80% and the reflection values are between 90%
and 95%.
Dry objective A microscopic objective used without immersion media.Between the objective lens and the specimen is air.
Fluorescencemicroscopy
A light-optical contrast process for displaying fluorescent structures. Auto-fluorescent samples have a so-called primary fluorescence. They do not need to be enriched with additional,
fluorescent substances. Secondary fluorescent substances, onthe other hand, have to be treated with appropriate dyes or
stains called fluorochromes. Specific dyeing methodsadditionally allow the precise localization of the stained structure
elements of an object. Fluorescence microscopy allows both

8/6/2019 Manual Leica Software TCS-SP2
http://slidepdf.com/reader/full/manual-leica-software-tcs-sp2 81/82
Version: RK09052000Page 81
dynamic examinations on a molecular level.
Fluorite objectives Describes a correction class for objectives. Fluorite lenses aresemi-apochromatic, meaning their degree of correction lies
between the achromatic and apochromatic.
Immersion objective A microscopic objective, developed with the requirements for applying immersion media. The use of incorrect or no
immersion medium with an immersion objective can lead toresolution loss and impairment of the correction.
Neutral filter Neutral filters are semi-reflective glass plates. They are used todistribute the light path independent of wavelength. The incident light is partially reflected and partially transmitted. Neutral filters
are usually placed at a 45° angle in the path of the beam. Theratings of a neutral filter are based on its reflectivity-to-
transmissivity ratio. A neutral filter RT 30/70, for example,r eflects 30% of the excitation light and t ransmits 70%.
Pixel An acronym based on the words, picture and element. A pixel represents the smallest, indivisible picture element in a two-
dimensional system. In this documentation, both the sampling points of the specimen as well as the picture points are referred
to as pixels.
Plan objectives, flatfieldobjectives
Describes a correction class for objectives. The image curvatureaberration is corrected for objectives of this type. Correcting thiserror requires lenses with stronger concave surfaces and thicker
middles. Three types of plan objectives, planachromate, planapochromate and plan- fluorite, are based on the type of
additional correction for chromatic aberration.
Reflection short passfilter
Reflection short pass filters are interference filters that transmit short-wave light while reflecting long-wave light. An optical
reflection short pass filter is characterized by the reading of thewavelength edge at which the filter changes from transmission
to reflection (50% threshold).
Reflection long passfilter
Reflection long pass filters are interference filters that reflect short-wave light but are transparent for long-wave light. An
optical reflection long pass filter is characterized by the reading of the wavelength edge at which the filter changes from
reflection to transmission (50% threshold).
Refractive index The factor by which the light velocity in an optical medium isless than in a vacuum.
Signal-to-noise ratio The ratio of signals detected in the specimen and the unwanted signals that are caused randomly by various optic and electronic
components, which are also recorded by the detector.
Stokes shift The Stokes shift is a central term in fluorescence microscopy.When fluorescent molecules are excited with light of a specific
wavelength, they radiate light of another, longer wavelength.This difference between excitation light and fluorescent light isreferred to as Stokes shift. Without Stokes shift, separating the
high-intensity excitation light from the low-intensity fluorescencesignals in a fluorescence microscope would not be possible.

8/6/2019 Manual Leica Software TCS-SP2
http://slidepdf.com/reader/full/manual-leica-software-tcs-sp2 82/82
Triple dichroic Triple dichroic filters are interference filters at an angle of incidence of light of 45°. The transmissivity and reflectivity of
triple dichroites depend on three specific wavelengths of light.For a t riple d ichroite TD 488/568/647, for example, the
excitation light at 488 nm, 568 nm and 633 nm is reflected and the excitation light above these values is transmitted. The
transmission values are generally at 80% and the reflectionvalues are between 90% and 95%.
Voxel An acronym based on the words, volume and pixel. A voxel represents the smallest, indivisible volume element in a three-
dimensional system. In this documentation, both the volumeelements of the specimen as well as the 3D picture points are
referred to as voxels.
Working distance The distance from the front lens of an objective to the focal point. The free working distance is defined as the distancebetween the front lens of the objective and the cover slip or
uncovered sample. Usually objectives with large working distances have low numerical apertures, while high-apertureobjectives have small working distances. If a high-aperture
objective with a large working distance is desired, the diameter of the objective lens has to be made correspondingly large.These, however, are usually low-correction optic systems,
because maintaining extreme process accuracy through a largelens diameter can only be achieved with great effort.


![MicroscopicAnalysisofSevereStructuralRearrangements ...downloads.hindawi.com/journals/tswj/2012/416076.pdf · out with a Leica TCS SP2 system as described in [18]. GFP ... 3.1. Reorganization](https://static.fdocuments.in/doc/165x107/5e7e92a5dcdc0d1f1f678e54/microscopicanalysisofseverestructuralrearrangements-out-with-a-leica-tcs-sp2.jpg)

