
Manpreet Kaur Juneja, M.Des in Strategic Foresight and...
16
Manpreet Kaur Juneja, M.Des in Strategic Foresight and Innovation, OCAD University, Toronto
Transcript of Manpreet Kaur Juneja, M.Des in Strategic Foresight and...

Manpreet Kaur Juneja, M.Des in Strategic Foresight and Innovation, OCAD University, Toronto

Design Research:
A systematic but flexible methodology practised through iterative analysis, design, development, and
implementation, based on collaboration among researchers and practitioners in real-world settings, leading to
contextually-sensitive designs.
Wang and Hannafin (2005)
Use Cases:
A use case is a series of related interactions between a user (or more generally, an “actor”) and a system that
enables the user to achieve a goal.
Use cases are perhaps the best way to capture functional requirements of a system.


•
•
•

DataTask
FunctionalitiesUsers
(Data mapping structure derived from Literature Review)


Traffic Management:1. Circulation pattern of traffic (Designed, Predicted, Deviation)2. Distinguish between obstructions (Recurrent expected (rush hour), recurrent unexpected (construction), non-recurrent unexpected (accident/weather))3. 3d bars with additional info (like StudentMoveTo)4. Animation/Playbacks5. Block-level data, and at Intersections lane-data6. Accidents (Degree and duration of blockage)7. Time-slider8. Weather conditions9. Memory of bottleneck (history)10. Congestion analysis11. Spatio-temporal viz (weather, road condition)12. Color codded visualization (speed limit)13. Origin Distance Analysis14. Traveler: ATIS (Real time Congestion, Cost analysis, Navigation, Multi-modal transportation, Trip planning)15. Operators: ATMS (Advanced transport management system: Real time congestion, cost)16. Providers: (Real time Cost analysis, congestion, user fed data, ability to share service on the common platform)
Transit Management:1. Visualization of AVL (GPS vehicle tracking, every 20 seconds)2. Realtime and Historical3. Vehicle bunching patterns, other disruptions- streetcars and buses.4. Time series animation or GeoEvent-based heat maps5. Layers (Weather, Bike share, Obstruction, Pedestrian Volumes)6. Twitter Data (tweet volumes reporting Delays/complaints)7. Visualization of transit performance (Realtime Designed/actual/deviations)8. Shuttle service (historial data, re-routing, regular routes, delays)9. New shuttle options (historical data, hypothetical, best routes)10. Various Transit performance (wait times)
•
•
•
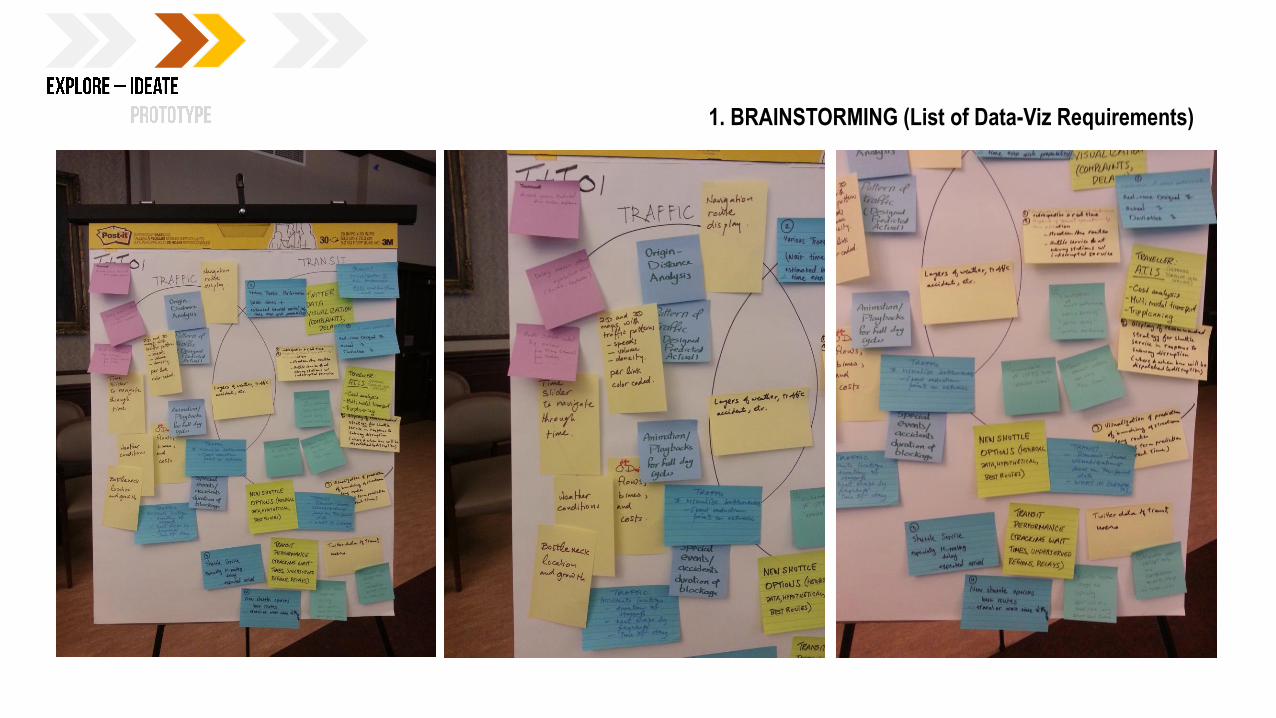
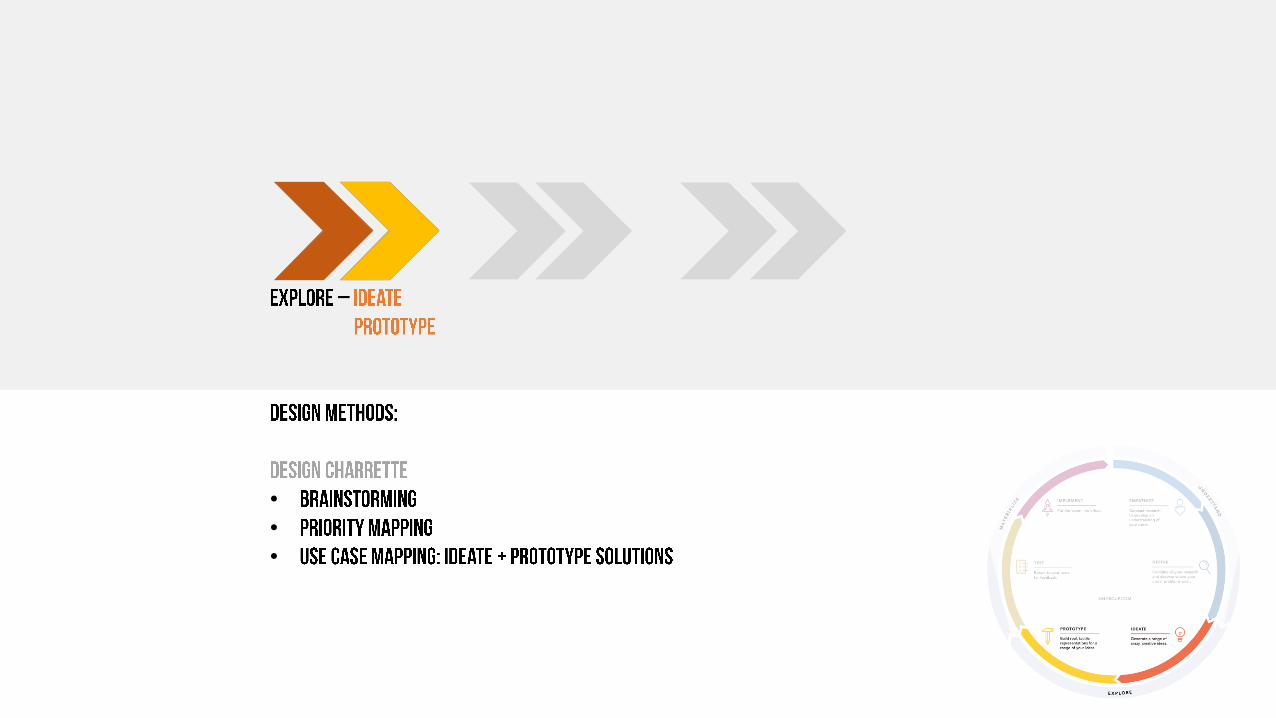
1. BRAINSTORMING (List of Data-Viz Requirements)

2. PRIORITY MAPPING

Users + TaskData SourceData
Representation
DataTask
FunctionalitiesUsers
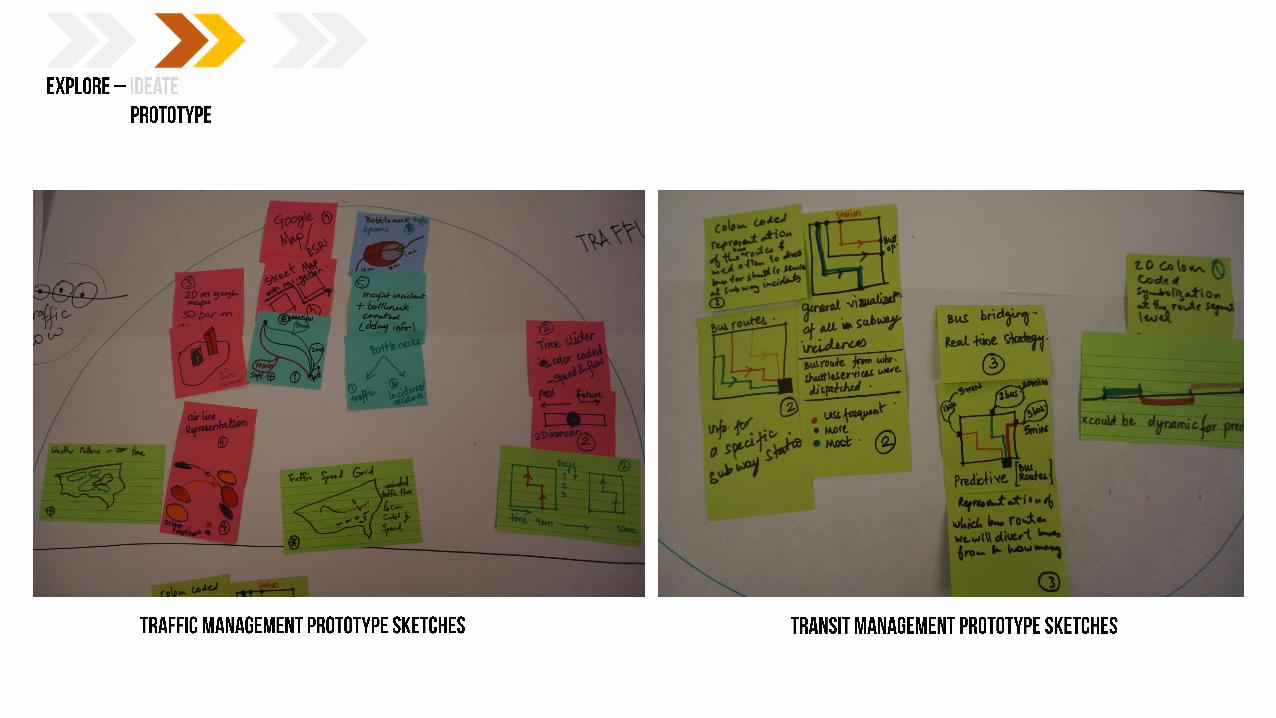
3. IDEATE + PROTOTYPE
(From Literature Review)
(Data management format modified at the Charrette)

Data
RepresentationUsers + Task
Data Source
Example:
(Data management format modified at the Charrette)
ANALYST
(Recurrent
Bottlenecks)
Traffic Management Priority 1. : Data Viz for Recurrent Bottle Necks
ITSoS
Platform
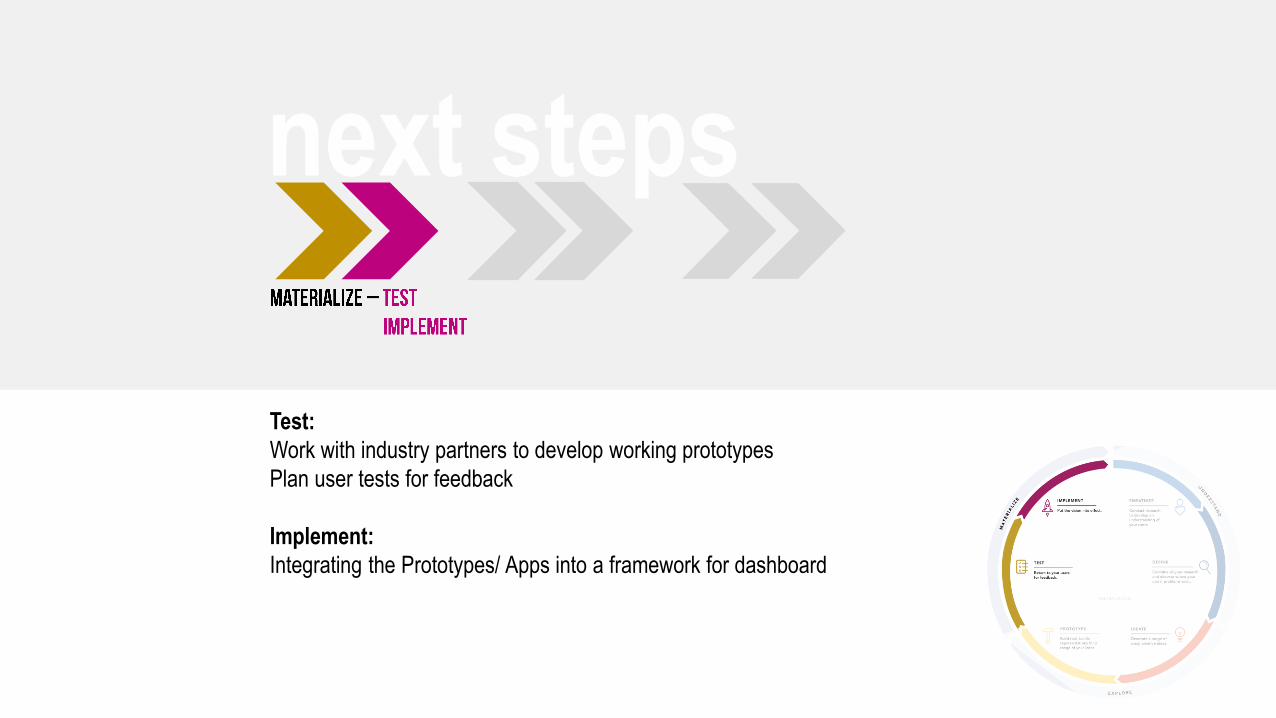
Test:
Work with industry partners to develop working prototypes
Plan user tests for feedback
Implement:
Integrating the Prototypes/ Apps into a framework for dashboard
next steps


![Evaluation Scheme for Master of Design[M.Des ] Semester I](https://static.fdocuments.in/doc/165x107/61aefd0e927ce5160733b330/evaluation-scheme-for-master-of-designmdes-semester-i.jpg)