Dr Bex Lewis, Senior Lecturer in Digital Marketing, Manchester Metropolitan University
Tony Berry, Bob Sweeting Manchester Metropolitan University
Jitsuo Goto, Shiga University
Mary Taylor University of Hertfordshire
Financial Management Practice Amongst SMEs
WP02/16
2002 Dec / Jan
The Business school of the Manchester Metropolitan University is one of the largest business schools in the UK comprising more than 150 academic staff organised into eleven thematic research groups. The Working paper series brings together research in progress from across the Business School for publication to a wider audience and to facilitate discussion. Working Papers are subject to peer review process. The Graduate Business school of the Manchester Metropolitan University publishes management and business working papers. The graduate school is the centre for post-graduate research in all of the major areas of management and business. For further information contact: The Director, Graduate Business School, Manchester Metropolitan University, Aytoun Building, Aytoun Street, Manchester M1 3GH
Telephone No: 0161 247-6798. Fax No 0161 247 6854
Manchester Metropolitan University Business School Working Paper Series

2
Acknowledgements
The authors would like to thank the managers of the SMEs who took part in the research
upon which this paper is based and the support of the staff at the Trafford Park Business
Forum, Manchester, UK, who helped to co-ordinate the research. The usual caveats
apply. The authors are also grateful to the European Social Fund (ESF) for the provision of
financial support to undertake the research.
E-mail:[email protected]
3
Abstract
While deficiencies in financial management have been repeatedly cited as a root cause of
business failure (Najak and Greenfield 1994) two arguments are advanced for such
deficiencies in SMEs; that new accounting is not relevant and that SME managers are
unable to make use of accounting. Here it is argued that accounting ideas are relevant to
SMEs but that a process of innovation combining both knowledge to overcome a barrier of
belief and an external shock are necessary in order for innovation to take place.
These ideas were explored through a survey of SMEs from both service and manufacturing
business in the Greater Manchester region. It was observed that the use of accounting
techniques is negatively related to growth in turnover. However the use of accounting
techniques that were related to product market was found to be positively related to growth
in turnover and that owner/managers belief in the importance of accounting in business
decisions was strongly related to growth in turnover. These results were the more
interesting when it was observed that growth was negatively related to size.
A second theme of the research was the significance of the role of external advisors. Prima
facie it was suggested that external advisors may be key agents of change, but the study
found that their (accountants, academics and consultants) perceived value was relatively
low.
The findings of this survey suggest that when accounting is perceived to be relevant then
its use does support business growth but innovation in accounting in SME requires further
research.
4
I Introduction
Understanding factors that affect the growth and survivability of Small and Medium Sized
Enterprises (SMEs) has been the core of an extensive literature for many years (e.g.
Keasey and Watson, 1993; Hall, 1995). From a review of the literature, Hall deduced that:
“ The probability of a firm failing falls as it increases in size and as it increases in age. This is one of the most striking features of the statistics of corporate death. There is unlikely to be a single overriding explanation for such a strong relationship.” (Hall p.17)
Central to the needs of the owner manager in the Jovanovic (1982) model used by Hall in
his analysis, is learning about organisational efficiency, and, in particular, the nature and
behaviour of organisational costs. Commenting from the work of Jovanovic, Hall points
out:
“Older firms would have more time to learn about their costs, and so will have more accurate estimates of their costs. Again, unpleasant surprises in their costs, and concomitant future output levels, will prove less likely as the firm gains in age.” (Hall p.10)
The influences on the development and use by their owner- managers of financial
management practices and techniques in SMEs is the central theme of this paper. In
particular, we examine the relationship of these practices to the growth of these firms.
There are many reasons why businesses may not be growing, including conscious
decisions by owner- managers to stabilise in size and become so-called “lifestyle
businesses” that can deliver reasonable returns to the owners for minimal management
input; while other businesses may be receiving considerable inputs from the owner-
managers with little growth occurring due to constraints of market conditions.
II Frameworks for analysis
There are two main explanations of accounting use in SMEs.
1. The relevance arguments; that much accounting practice is based upon the needs
of larger businesses and that SMEs can get along with or need simpler practices.
2.The owner/manager capability arguments;
that the nature of the SME owner/ manager may be characterised by
5
(a) the lack of any understanding that could make use of accounting
(b) the competent owner/manager who does make some use of accounting
(c) the sophisticated use of ideas in decision and action by owner managers.
These two arguments are complemented by a third, which is that the adoption of any
accounting practices may be viewed as an innovation in an organisation and that where the
accounting is relevant and where managers are open to change the process of innovation
may be accomplished.
2.1 Relevance.
Anthony (1965), worked from ideas of relevance more closely suited for larger businesses
with well- defined “top management” and “middle management” cohorts. Empirical work
by Goold and Quinn (1990) has demonstrated that there was little emphasis by top
managers on strategic control, that is, progressing achievement of strategic goals against
plans, as compared with monitoring short-term targets by middle managers through
budgetary planning and control systems. From a normative standpoint it is asserted that
Cost information, prima facie, plays an important role together with non-financial
information in a wide range of business issues (Otley,1999) and related business processes.
These processes include determining long term plans, short term plans, monitoring and
assessing performance of both business units and managers. In recent years, processes
aimed at cost reduction in order to increase competitiveness have gained in importance and
visibility (Bright et al, 1992).
While much of the research on accounting practice has largely been set in the context of
larger businesses, SMEs have been the subject of increasing interest to researchers. It may
be expected that a certain amount of modification to ideas transferred from larger
businesses occur, before they become relevant, workable and useful in SMEs. In other
words they have to “fit”. These ideas are similar to the familiar arguments spawned by
Kaplan that much “traditional or inward oriented” accounting may not be helpful to
business decisions.
2. The Nature of The SME Owner/Manager

6
(a) The lack of understanding of the owner/managers.
The gap, reported to exist, between accounting theory and practice Scapens (1985) is based
upon evidence that managers spurn sophisticated accounting techniques and practices,
despite their theoretical advantages over more mundane approaches. On a broader basis,
Littler and Sweeting (1983) have identified managerial lapses in significant areas of the
new business development process, including the stages when financial analysis would be
logical and appropriate. Again there is evidence to show managers can be influenced by
fashion into toying with rather than usefully using new accounting techniques and
practices, for example Activity Based Costing (Bright et al, 1992).
One of the key contingent factors in an SME adopting new accounting procedures may be
expected to be the background and attitude of the owner manager(s). Owner-managers may
be expected to be fully aware about the product/service markets that their businesses may
be based. They may not, however, be trained or proficient in business management skills,
especially when starting up the business. . Unsurprisingly, the financial management in use
may be expected to be simple and largely cash flow based. The preoccupation with
running the business may leave little time for the owner-manager to hear, learn about and
be convinced on the worth-whileness of using any more than the most rudimentary
business management tools.
The funding for start -up businesses typically comes from the entrepreneurs themselves,
with any bank finance being secured on personal assets, with few other sources of funding
at the early stages of business growth (Keasey and Watson, 1993). Hence there is no
external pressure to explicate the rationale for their businesses in a business plan that
would link both strategic and operational issues.
It is likely that at the early stage in starting a new business, with probably the first
product/service, that owner-managers are least aware of the importance of careful cost
management assessments. As they become aware over time, it is probably too late to
rectify matters. The business is probably very vulnerable to total failure at this stage
because it has not had time to diversify through developing a portfolio of products
(b) The competent manager
7
As businesses survive and develop, the range and sophistication of different managerial
techniques and practices that they deploy tends to increase (Miller and Friesen, 1984). The
points in time at which different types of practices are deployed tends to be mapped against
the business life cycle: growth, maturity and decline
The transition from unaware to competent may be quite problematic.
What needs to be explored and better understood is the way owner/managers take hold of new ideas, understand them and apply and use them in the way they were designed, rather than taking only elements of them in eclectic and isolated ways.
(c) The sophisticated owner/manager
In this view the owner/manger is perceptive about business and how accounting ideas can
assist in the processes of decision and action. Such a manager gives little credence to the
actual flow of historical accounting data, but will be influenced in thinking by it.
What needs to be examined is how and what influences the changes in sophistication of managers beyond awareness and understanding and competence.
3 Change and Innovation.
Change and innovation may be the outcome of reasoned discourse or cognitive processes
by owner-managers who hear about new ideas and want to attempt to adopt these in their
own businesses, having to rely on their own narrower managerial and financial base or turn
to outside assistance. While lack of change may be the product of a managerial “barrier of
belief” as to the relevance of new accounting practices change may also be the outcome of
a newly perceived need, with perceptions sharpened by the stimulus of a “shock” to the
business or to the understanding of the owner manager.
Change may be pressed upon SMEs;
(a) by the perception of need arising from problems or external “news” or “shocks”.
(b) by supply chain partners ( larger businesses) in order to adopt and interface with the
systems, techniques and practices used by the larger, more dominant businesses. If owner-
managers do not agree to conform and integrate, they may be excluded from doing
business. Such SMEs may benefit from managerial and financial assistance provided by
the larger businesses to successfully implement the new ideas.
(c) by Business advisers who now abound, and often have vested interests, either for
commercial or government initiative reasons, to “sell” new ideas to owner-managers to use
8
in their businesses. External advisers, especially its bankers and external accountants, who
have a relationship with the business, may have a key role to play in mentoring the owner-
managers in general management, planning and control issues, including cost management.
It would be helpful to know whether owner/managers make use of value and value external
advisors.
However, owner-managers and businesses need to be able to champion and sustain the new
ideas for themselves if the changes are to be durable and worthwhile – this is consistent
with general innovation theory (see, for example, Rothwell, 1992). The key must be with
the owner-managers themselves being prepared to understand the different techniques and
then using them to help to guide their decision making. Merely having knowledge or a
‘passing acquaintance’ with new accounting ideas and procedures may not be enough to
engender change. Some external stimulus or shock may also be necessary.
Accounting ‘shock’ and durable change
That concept of “shock” arose in work on innovation by Schroeder et al (1986) who
observed: “. Innovation was more prevalent when some major change occurred in the organisation or its environment. Ideas were often generated but not acted upon in an organisation until some form of shock occurred. Shocks included such things as new leadership, product failure, and a budget crisis… “
The concept also embraces the notion that once introduced the ‘new idea’ may only be
transitory unless positive action is taken to sustain and grow the change(s). Van de Ven
(1986) noted that ‘managing good ideas into good currency’ was the key to successful
durability of a new idea. To make the idea ‘well-embedded in organisations’, i.e. durable,
relevant and worthwhile, required accounting staff from an established finance function to
go out of the function and work closely with non-accountants, Sweeting and Davies
(1995). Additionally, these authors observed that re-orientation and adaptation of
accounting techniques (that were ’new’ to a particular organisation) would probably need
to take place in order to make the ‘fit’, and therefore be useful and worthy of widespread
adoption within the particular entity. Such user involvement enabled the “barrier of belief”
or to be managed to enable accounting changes to be credible with managers. In this model
of change the role of outside advisers, for example external accountants, can be crucial for
they, with more broadly - based experience of different kinds of SMEs and owner- manager
managerial styles, are well- placed to design, introduce and organise training for the new
9
financial management systems. It is therefore intended to study the extent to which
owner/managers use external advisors of various kinds and how useful owner/managers
find the contribution of their external advisors.
This process of user-development was observed by Bright et al (1992) in the case of
accounting innovation where users initially adopting basic Activity Based Costing (ABC)
and translated and developed the idea into Business Process Redesign (BPR)
methodologies. In some senses, this development was a response to the competitive shock
felt by businesses and the urgent need many had to significantly change their modus
operandi and ‘redesign’ their businesses and the need for relevant and workable tools.
This phenomenon of adaptive innovation is also held true in wider observation of the
innovation process. Indeed, some organisations have made a conscious practice of
observing customer practices with given technologies with a specific aim of understanding
how customers have taken those innovations and further moulded and modified them in
practice (Von Hippel, 1977).
10
Observations of Behaviour Observations of Behaviour Growth strategies
4 items
Use of Financial Measures
3 groups Manager’s perceptions of the importance of cost information
4 items Outputs Growth Rates
Use of cost Management 3 groups
Relationship
Age Quality Locus of advisor Added value Benefits Drawbacks
Use of Wider Outputs Growth Rates
measures
4 items
External Advisors
Accountants Academics Consultants
Relationship
Age Quality Locus of advisor Added value Benefits Drawbacks
Accounting Services purchased/ provided
Comment: Not sure where this should go?/
11
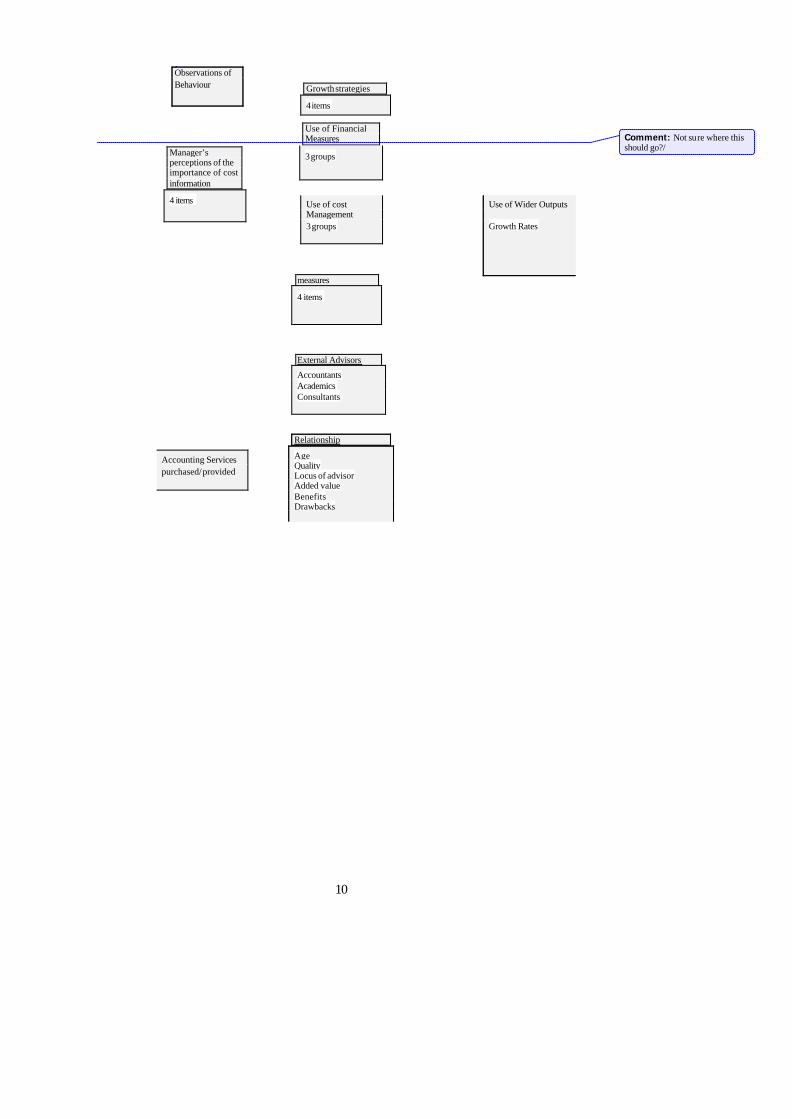
III The research project.
The study reported on in this paper, was designed to examine the way that financial
management techniques and practices have been deployed and were used SMEs and how
the owner-managers view the role of external advisers in this process.
Sample
The data collected was related to a larger study of businesses of all sizes and kinds carried
out in the Trafford Park industrial area, Manchester, UK. The larger study was designed as
a company census which, inter- alia, sought to find out what skills and competencies were
needed by these businesses to help them to grow and develop. Profiles of these businesses
were obtained through completion of face-to-face questionnaires and 1011 businesses were
included in this study. Data collected included: products and services, employment
characteristics, business development
Approaches and people development. In turn we selected a representative sample (2000) of
all the businesses meeting the European Union (EU) definition of being SME and
approached these with a request to be included in our financial management study. A
confidentiality undertaking was given to participants not to identify individual people or
businesses. Of these, 140 businesses agreed to face-to-face interviews being carried out to
obtain data on their financial management techniques and practices.
Questionnaire
A questionnaire was designed to collect data relating to a number of facets;
(a) Demographic data including recent major management changes already experienced
and expected,
(b) Growth strategies employed (4 Items)
(c) Perceptions of managers of the importance of cost information (4 items)
(d) Use of Cost Management practices (3 Groups)
(e) Use of Financial measures (3 Groups)
12
(f) Use of Wider, Non financial measures (4 items)
(g) Relationships with external accountants and advisors
(h) Growth rates of turnover
The draft of the questionnaire was pilot tested with two owner-managers and its structure
and content was refined. The refined questionnaire was then used for data collection in the
remaining 138 SMEs in Spring 2000. Preliminary analysis was fed back to two participant
workshops in Autumn 2000 for their observations and comments.
SPSS computer software was used and coded both the original Trafford Park survey data
and the data from our financial management survey was coded in a mutually consistent
way. Thus we were able to analyse an extended range of parameters and leverage the value
of the first study.
In general, questionnaire studies suffer from a number of limitations, not least of which is
that they are self selective and therefore exclude other, prima facie, similar businesses
which introduces some bias. However the number of businesses that did not participate in
our study from the population selected was very small. In our case, the decision to
participate or not was taken by the key player, the owner manager, the person who in many
SMEs encapsulates the “top” and “middle” management of the larger businesses. In some
cases participation may reflect an owner manager believing significant developments have
been made and wanting to talk about them, in others not really knowing very much and
interested in feedback to find out more and so on. The participation of the owner-manager
allowed an important dimension to be explored: the dynamics of networking as a learning
and understanding exchange mechanism through the use of feedback workshops based on
our preliminary findings.
IV Findings
Features of the sample in general (N=140)
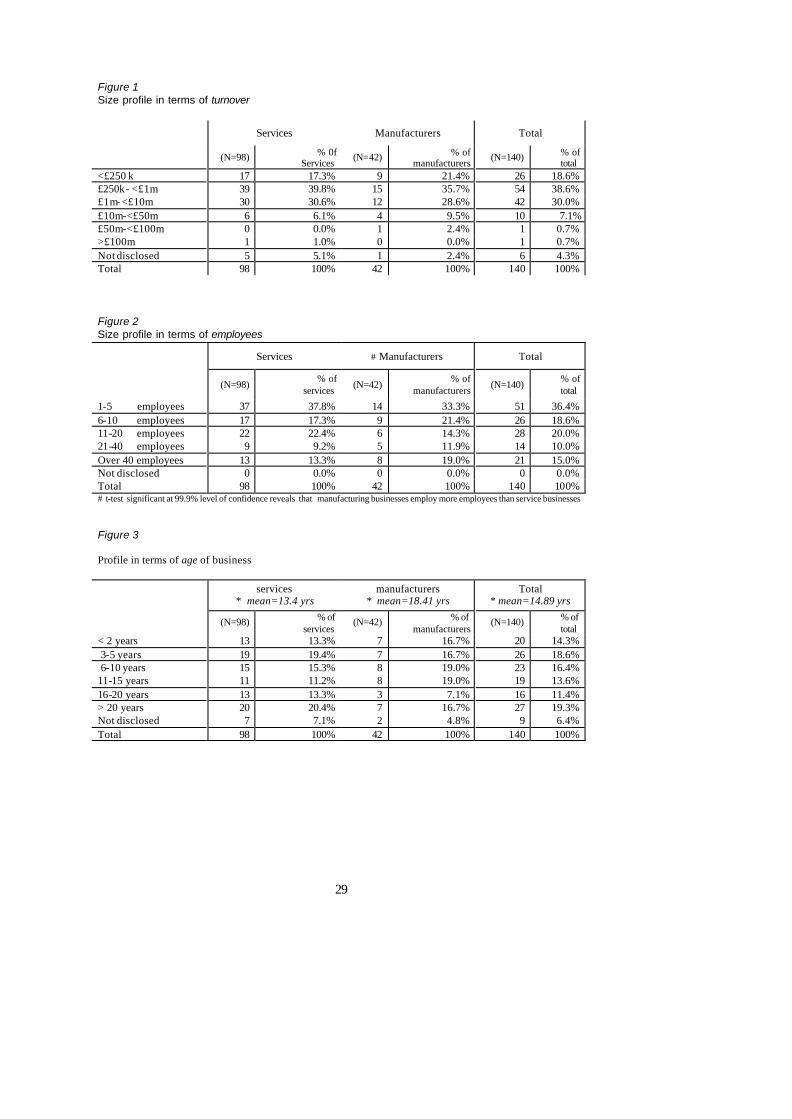
The sample consisted of 42 manufacturing and 98 service businesses. The size profile in
terms of Turnover is in Figure 1, Employees in Figure 2 and Age in Figure 3. From this
data it can be seen that the sample of manufacturing businesses tend to be older, more
established businesses whereas newer, start-up businesses tend to be service based. In the
13
sample, there are more service-based businesses clustered in the smaller (by number of
employees) businesses, compared with the manufacturers, who have a more even size
distribution.
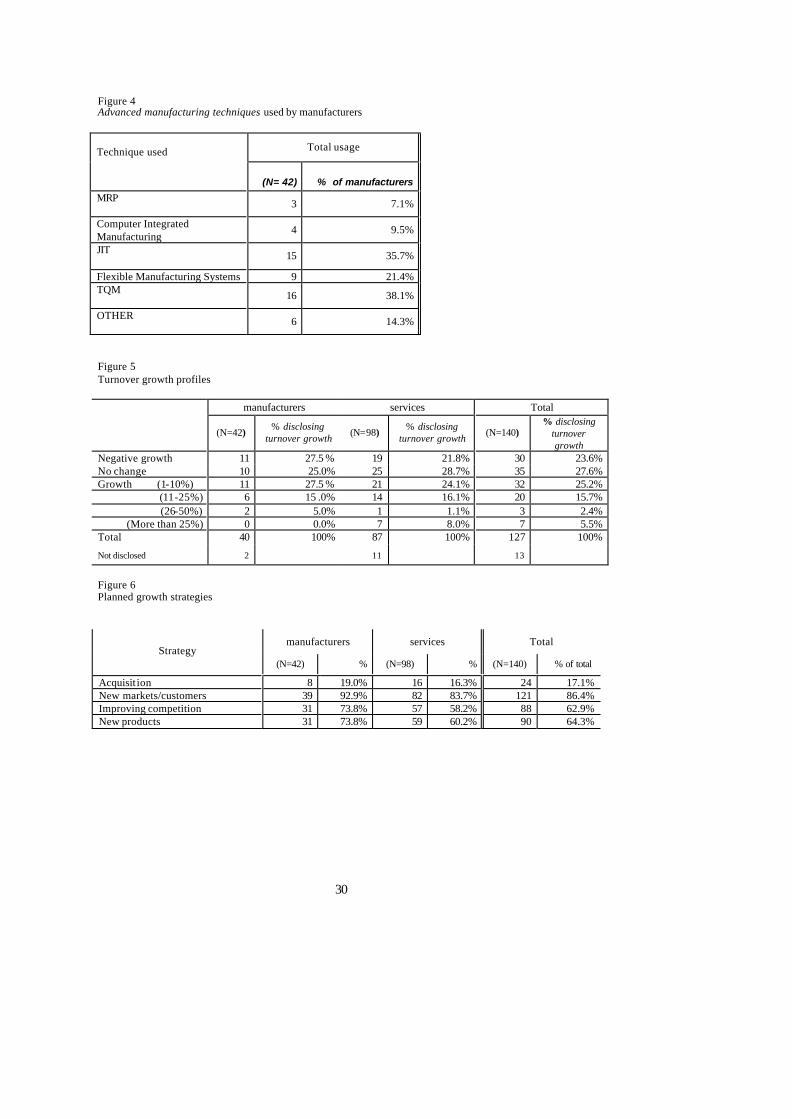
Use of advanced manufacturing Techniques
Typically fewer than 20% of manufacturers in the sample used so-called Advanced
Manufacturing Techniques (AMT – Howell et al, 1987) as shown in Figure 4. In terms of
turnover growth profiles, from Figure 5 it can be seen that, over the last three years, there
is reasonable consistency between the profiles of both manufacturing and service- based
businesses in the sample.
Growth Strategies
The sample businesses planned to grow in the future using a range of strategies that
included: acquisition, developing new markets and customers, improving their
competitiveness and developing new products (see Figure 6). In general the most popular
approach planned is through developing new markets and customers with relatively few
planning acquisitions, presumably because of the difficulties with this approach not only in
execution but post-integration.
On the assumption that all businesses should use all four of these approaches a growth
strategy complexity index was calculated; the number of growth approaches reported by
the companies divided by the theoretical number possible; this had a value of 0.577, which
indicated a considerable penetration of these techniques in the sample companies.
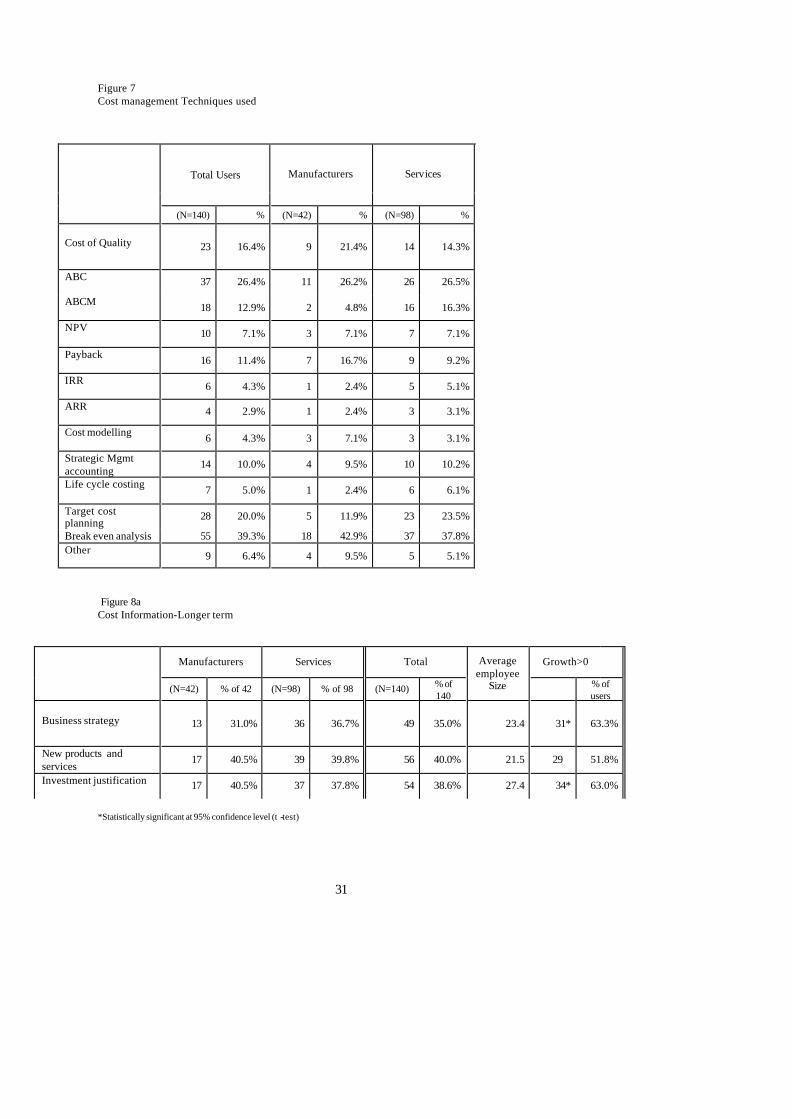
Cost management techniques.
Figure 7 presents the findings of the use of cost management techniques. Again from the
assumption that all firms should or could use all of the techniques a penetration of Cost
Management techniques indicator was calculated; it had a value of 0.13, which indicated a
very low penetration of cost management techniques in the sample firms.
“New” cost management techniques employed
Figure 7 presents different cost management techniques that can facilitate long and
medium term planning in businesses against the total number of users in our sample. It also
includes the number of these businesses that have grown turnover in the last three years.
14
There was variable use penetration of the so-called “new” techniques: Cost of Quality,
(0.16) Activity Based Costing (0.26); Management (ABC/M)(0.13), Cost Modelling,(0.04)
Strategic Management Accounting(0.10), Life Cycle Costing(0.05) and Target Cost
Planning,(0.20). The usage of these techniques was very limited. However the use of
Strategic Management Accounting at 10% and Life Cycle Costing at 5% were surprising,
given the relatively slow diffusion rates in larger businesses with these different techniques
(see, for example, Ask and Ax, 1992, Drury and Taylor, 1995).
There were also apparent inconsistencies amongst our data. It was noted, for example, that
5 manufacturers stated they were using Total Quality Management, but nearly twice as
many (9) stated that they were using Cost of Quality-these two techniques being,
conceptually, mutually supportive. It may be that owner-managers are unaware of this or
positively choose to be eclectic in their adoption of new ideas or in their use of descriptors.
This finding is consistent with similar studies (Bright et at, 1992).
It was interesting to note that 20% of businesses were moving to check their position with
existing externalities by using Target Costing, or an approach to understanding cost in
relation to market prices that they identified as target costing.
“Old” cost management techniques employed
A large proportion the sample (39%) used Break Even Analysis.
In the capital investment process, Payback Period at a usage rate of 11% was the most
popular method, if such a small percentage could be described as popular. Those methods
involving using the time value of money, Net Present Value (NPV) and Internal Rate of
Return (IRR) were lower at 7% and 4% respectively. This finding reflects other research
findings where it was found that managers reject sophisticated and more theoretically
correct solutions in favour of more basic methods (for example, Pike 1983)
It was surprising that so few managers in the SMEs in our sample use investment appraisal
methods in any way in their investment decision processes. Further observation of
investment justification techniques using cost information is shown in Figure 8 where 0.39
of sample firms reported that investment justification was important to them. This
compares to a total of at most 0.25 of the sample using any of the four techniques.
15
Of the 64% of businesses (N= 90) that planned to grow by introducing new
products/services, only 16% (N=14) used the most popular technique, Payback Period.
However, these 14 businesses were amongst those who believed that cost information was
important in the investment justification process.
The importance of Cost information and key business processes
The reported importance of a range of types of cost information is presented in figure 8.
Again calculating a complexity of perceived importance index produces a value of 0.455
which suggests that these managers give a high importance to cost information, and this
contrasts with the low penetration of usage index (0.13) of a range of cost management
techniques. (See above)
In Figure 8, collected around generic headings are the data from our SME sample: Longer
term (Figure 8a): Business strategy, New products and services, Investment justification:
with a penetration index of 0.37 suggesting a focus upon future outcomes.
Short term (Figure 8b): Budgetary planning and control, Pricing, Procurement: with a
penetration index of 0.65 suggesting that short term data is substantially important and
much more important that the actual reported use.
Performance measurement (Figure 8c): Management performance, penetration index of
0.30; Business performance, with a penetration index of 0.57: which reflects the
importance given to business rather than management.
Cost reduction(Figure 8d). A penetration index of 0.57, which again is higher than the
reported use of cost management techniques.
Whatever the background of owner-managers may be, the average number of employees
was in excess of 20 in SMEs where a range of different, “old” and “new” cost
management techniques and practices were used. The average number of employees was
also 20 in SMEs where owner-managers indicated that cost information played an
important part in a range of key business processes ranging through: business strategy, new
products and services development, budgetary planning and control and managerial –
business performance.
16
It may be inferred that these managers work with accounting ideas in the mind rather than
accounting data in the books; as though the records are of limited interest but that the ideas
are used in the processes of business understanding and decision making.
One of the more sobering observations from the data in Figure 8 is the large number of
owner-managers in SMEs who do not regard cost information as important in key business
processes. This holds across the whole range of processes we have categorised above
ranging from long term to cost reduction processes, with this observation holding true
amongst both manufacturing and service businesses. Cost information may be difficult for
the owner-managers to obtain. This may be particularly the case with that related to longer-
term investment and business strategy. However, it should not be the case, in principle,
with that needed in the budgetary planning and control process, managerial and business
performance and cost reduction. It may be the case that, in practice, the information cannot
easily and cheaply be obtained and this may be because the systems to collect, let alone
analyse the cost information, is not in place. If reliance for expertise is placed on outside
accountants, the focus may only be on preparing cash flows, preparing external financial
reporting statements and tax computations. (See, for example, Kirby and King, 1997).
The justification, in part for SMEs to make the effort in breaking through the “barrier of
belief” in introducing and using relevant financial management techniques and practices
begins to emerge from statistical analysis of the data. We carried out inferential statistical
analysis on the data to investigate the relationship between those businesses that regarded
cost information as important in different business processes and had grown in the three
past years at more than 10% in turnover terms. At the 99% significance level we found
that regarding cost information as important can be associated with growth when, in
particular, it is associated with business strategy, investment justification, budgetary
planning and control, business and management performance and cost reduction.
Agents of change
The penetration of the use of external agents was indicated by index; they were
0.07(includes always and usually) for Academic advice and support agency
0.56(includes always and usually) for external Accountants and network contacts
0.10(includes always and usually) for Consultant
17
Which suggests that these SME managers are a rather independent bunch of business
people, but have their primary external advice from accountants and network contacts.
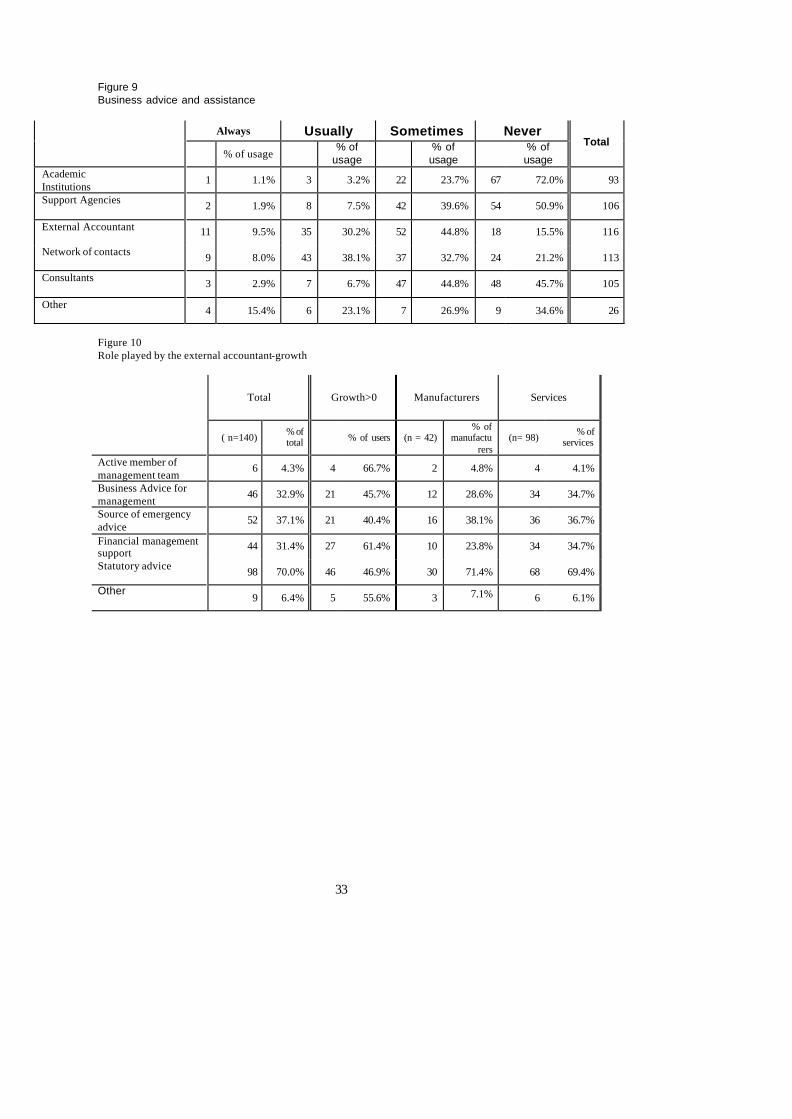
Figure 9 presents data for a range of sources of business support. External network
contacts and external accountants are the most usual sources with academic institutions
trailing in bottom place, with only 4% of 93 respondents seeking business support from
that source.
External accountants, particularly the Institute of Chartered Accountants in England and
Wales (ICAEW), has in recent years been heavily promoting their members services for
business support, rather than the traditional conformance, financial reporting and taxation
services. At the same time, it has been exhorting its members to promote these services
amongst their clients. Other research has appeared to demonstrate that ICAEW accountants
have not been especially successful in this endeavour (Kirby, Najak and Greene, 1998).
With 84% of the 116 SMEs in this study responding to this question being either always,
usually or sometimes prepared to turn to external accountants, this represents a major
opportunity for accountants to develop their work portfolio in this client sector.
Nonetheless, Figure 10 suggests the role of the external accountant is still narrowly defined
for many SME owner-managers, with 70% of respondents using their external accountants
for statutory advice and less than half this percentage, 33%, seeing the role as one of
business management advice. A similar percentage, 31%, engages their external
accountant in financial management support work. A much smaller percentage, 4%,
actually regards their external accountant as an active management team player.
The growth of network opportunities for owner-managers promoted by government
support agencies, employer organisations and so on seem to be well received by our
sample owner-managers as a source of business advice and assistance with 79% of 113
respondents always or usually or sometimes using this source. This source far exceeded
the use of more targeted and specific help from support agencies. Given that these support
agencies include the government funded Business Link (soon to be subsumed into the
Small Business Service), then this is a point for concern. Significant resources are
consumed by these agencies and this may reflect a “technology push” of ideas rather than
“market pull”. As with other idea innovations, it may be that increased efforts are required
to increase user (that is, owner- manager) awareness and education of the benefits and
value to be achieved from improved financial management.
18
With considerable efforts being put into promoting Higher Education Institutions (HEIs) in
the UK as sources of business support and assistance, especially for SMEs (for example,
Science Challenge initiatives), then our findings are sobering. There is a considerable
barrier that needs to be overcome for HEIs to ‘make ground’ on the low showing (72%
respondents never use academics) in our survey. With the rise in the numbers of Business
Schools in HEIs and the growth of relevant studies amongst SMEs, then the problem is
probably focused on technology and knowledge transfer than the development of relevant
materials and delivery mechanisms for SMEs.
V Observations about the relationship of financial management and business growth.
We were concerned to examine the proposition that accounting and financial management
was not relevant to SMEs via the idea that Accounting and financial Management was
unrelated to growth.
We make the following observations;
Growth and Business type, size and age(See figure 11)
i. Private limited companies grow faster than other types.
ii. Companies younger than 5 years grow faster than older companies
iii. Companies with 5-10 employees grow faster than smaller or larger companies.
iv. Companies with turnover between 250k-1m grow faster than smaller or larger
companies
Growth and the use of accounting techniques(See figure 12)
i. The use of cost management techniques are negatively related to growth
ii. The use of financial measures are negatively related to growth
iii. The use of cost information is positively related to growth
iv. The use of growth strategies are positively related to growth.
Use of techniques and business type, sizes and age(See figure 13)
19
i. Cost management users are older and/or have more employees
ii. Financial measure users are older/or have more employees
iii. Cost information users are older/or having more employees
iv. External accountant users are younger/or have less employees
NB. Younger and smaller firms need accountant help
v. Growth strategy users are older and/or have more employees.
The characteristics of growing firms.
I. Users of cost information and strategy
Ii. Do not use cost management and financial measures
Ii. Smaller firms in both growing and less growing groups need more help form external
accountant
Iii. Change their accountants often and understand the benefit of external view and the
drawbacks from using external accountant
V. Overall growing firms consistently have an “outside” orientation and the less growing
and declining firms have an “inside” orientation.
VI Issues and implications
We were interested in three themes;
? Relevance
? Owner /manager competence
? Accounting Change and innovation
6.1 Relevance
The relevance of New Accounting was not perceived by the respondents, the
owner/managers of the SMEs.
20
Owner-managers of the SMEs in our sample typically avoided newer and more
sophisticated management techniques and practices related to financial management, for
example, Activity Based Costing, Strategic Management Accounting, Target Costing and
Cost of Quality. At the same time, they avoided more longer- standing and more
theoretically correct approaches to investment justification. In all this, they were not
substantially different from managers observed in businesses over many years (see, for
example, Pike 1983;Kennedy and Sugden, 1986;Bright et al 1992).
6.2 Owner manager competence
Owner managers did not report much competence in accounting but, where SME owner-
managers did employ a wider set of more sophisticated cost management techniques and
practices, then we found a statistically significant correlation that they were in growth
businesses.
6.3 Accounting Change and Innovation
It could be argued that deployment and use of wider sets of financial techniques and
practices is indicative of a management style that is more analytical and broadly- based.
This itself may be an outcome of growth rather than a precondition of it. As companies
become larger and more complex their needs for information become greater and the
processes of formalisation become necessary in order to manage.
This suggestion is grounded on the fact that in many owner- managed businesses, the
original expertise of the managers is based on close knowledge about their product/service
markets and product/service technologies rather than financial management. Growth
requires a widening of managerial and organisational capabilities.
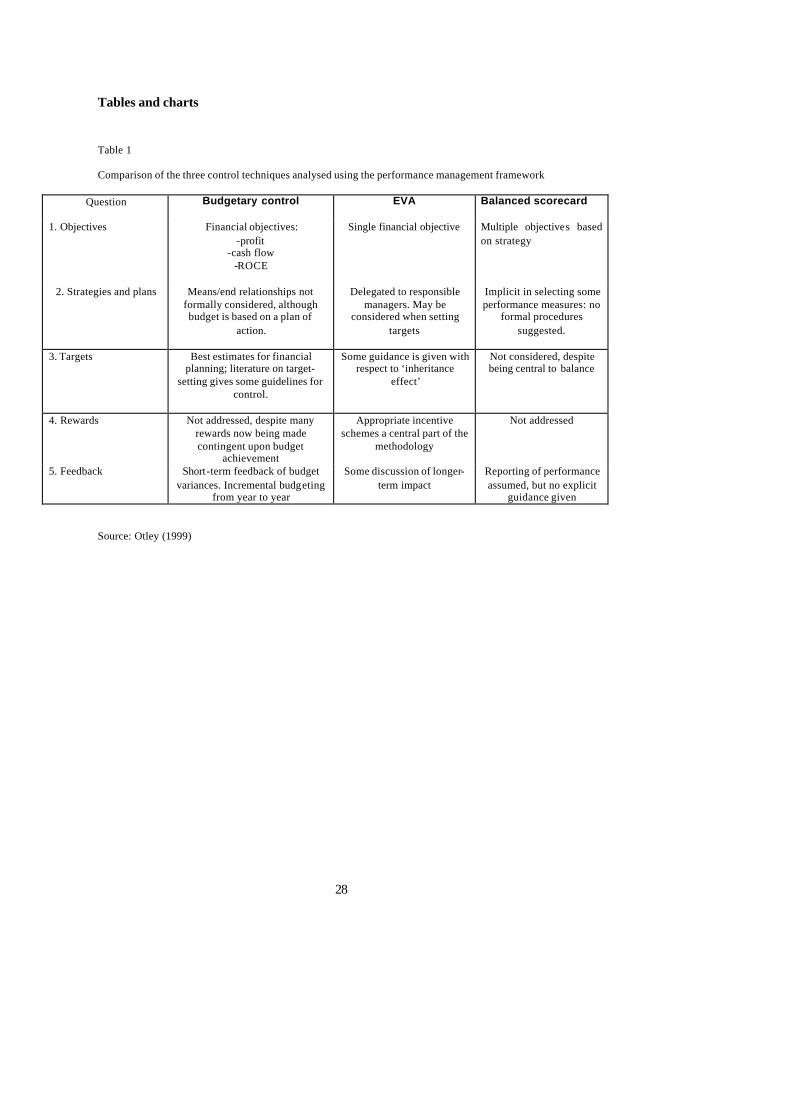
In the Otley (1999) framework for performance management, there is, presumably largely
grounded in the context of larger businesses, a set of discrete issues: many separate sets of
processes with probably large numbers of people with varied skills and competencies
involved and different responsibility centre managers. In the context of SMEs , many of the
process areas probably merge, and the owner- manager is then the chief actor. Thus
objectives, strategies and plans, targets and feedback may all fall within the close long-
term, day-to-day work and the personal interest of the owner manager. This modus
operandi is probably manageable for business averaging 20 employees.
21
Thus, we see a picture emerging of owner-managers growing with their businesses,
becoming more aware and knowledgeable about the potential benefits that more detailed
and sophisticated (yet not over- complicated) financial management techniques and
practices can offer. As the business grows, then the separation of the key issues and areas
occurs in reality as well as in principle. They move from being internalised, understood
and handled by the owner- manager alone, to being shared and understood amongst the
employees, more as a whole, which adopt accountable and responsible attitudes towards
them.
This profile of development has been observed more generally in the work of Miller and
Friesen, 1984. What we have observed in this study is the genesis of the process: the
development that takes place once the “barrier of belief” has been passed through by the
owner manager. Without this transition process, then the development of relevant financial
management – and probably other – techniques and processes will be delayed and may not
take place. This development model echoes other innovation and change models where
progress is predicated on the active championing and involvement of the owner manager
(Rothwell, 1992).
Barriers to adoption of more developed financial management techniques, practices and
systems have been examined in a broad sense by McChlery and Meechan (2000) who
noted from the literature that ‘ quality of management accounting information utilised
within the SME sector has a positive correlation with an entity’s performance’. This
statement begs the question about what ‘quality’ means in this context and how
‘performance’ is defined and the direction of any causal process.
Indeed, it could be argued that performance creates the very shocks we have referred to in
our conceptualisation of accounting innovation and change. For example, growth in sales,
which we have used as one dimension of performance, could induce major over-trading
shocks that could have very serious implications for the viability of the business through
insolvency, induced by lack of working capital – cash in particular – to pay the bills. This
shock could induce the owner-manager to get to grips with the key issues driving the
financial system dynamics, including deal making and investment in new facilities,
products and services. This analysis points to the need to carefully examine the key
business processes and empower these with the relevant financial management accessories
22
that are understood, and are likely to be used on a regular basis in decision making by the
owner/manager.
Again, the external accountant will probably have a key role in this process. In McChlery
and Meechan’s (2000) study, it was observed, in the conclusions, that there were concerns
about the low added value of (external) accountants, who were principally focused on basic
attestation and reporting work for their SME clients. Our findings were not so depressing,
and indicated a significant effort by many of the external accountants, as perceived by
owner-managers in our sample, to shift into the value-adding areas we have outlined. What
is more likely to generate real and sustainable advances are the “shocks” identified by Van
de Ven (1986) as key triggers to innovative ideas that produce durable and worthwhile
changes. It remains to be seen how effective these shock points are as compared with
representations about “better practice” as recommended by outside agents of change, be
they external accountants or whoever. The strongest combination to result in successful
adoption may be a “shock”, with the subsequent advice from an external agent on the most
relevant and appropriate financial management solution that “fits” particular business and
owner manager needs. It is possible that other owner managers are a more likely source of
external advice (Tell 2000).
VII Conclusions
1. This cross sectional study of financial management in a sample of SMEs in the UK, part
of a wider study including other UK and Japanese companies, has provided some evidence
to suggest that SMEs have not developed their financial management to any great extent.
2. The practices of accounting had a very limited penetration, supporting either the
irrelevance hypothesis or the owner/manager limitation hypothesis.
For the overall sample the more accounting practices were used then the lower the growth
rates; this apparent result was modified by the fact that the rate of growth of the sample
firms declines with age, while the use of accounting practices increases with age and size.
It may be suggested that accounting practices become necessary (but not very) as age and
size increase but have no overall relation to growth rate. It is as though there was a
threshold competence to be gained or barriers to belief to be overcome.. However the use
of market related accounting practices was strongly related to company turnover growth,
23
suggesting that some owner/managers were able to use and see the relevance of newer
accounting financial management.
3. Further the owner/managers were more likely to regard accounting ideas as having
importance to business decisions even if they reported a very low usage of accounting
practices. Hence the idea of the unaware owner manager was not sustained in this sample,
nor overall could the competent manager idea be sustained. But there was evidence of
decision sophistication among some of the sample and this group were growing faster than
the overall sample
However it would be naive to argue that the sample were sophisticated in their
understanding or use of accounting.
4. The evidence of innovation and change , that the larger and older firms have innovated
in financial management, suggests that necessity or "shock" may be a more likely
explanation than conviction by reason. This was supported by the evidence of low usage of
external advice and it may be likely that external advice is sought in response to problems
rather than as a balanced development of financial management capability. It may be the
case that the only advice that owner/managers appreciate is that of other owner/managers
in what have been termed action learning sets or learning networks,(Tell 2000).
5. This study may be influenced by a domain effect, because the location has been "worked
over" by small business advice centres, professional advice, government and other
initiatives, but it is debateable how effective these advisors have been.
6. Apart from the intended intra UK region comparisons and the UK to Japan comparisons
two areas for research are suggested;

24
References
Anthony, R.N., (1965), Management Planning and Control Systems: A framework for
Analysis, Harvard Business School Press.
Ask, U and. Ax, C. (1992) “Trends in the development of product costing practices and
techniques – a survey of Swedish manufacturing industry” EAA Conference, Madrid.
Bright, J., Davies, R., Downes, Sweeting, R. (1992) “The deployment of costing
techniques and practices: a UK study”: Management Accounting Research(3) pp201-211
Drury, C. and Taylor, M (1995) “Issues arising from surveys of management accounting
practice” Management Accounting Research 6 pp 267-280.
Goold, M. and Quinn J.J (1990) “The paradox of strategic controls” Strategic
Management Journal. II pp 43-57.
Hall, G. (1995) “Surviving and prospering in the small firm sector” Routledge. London
Howell, R, Brown, J, Soney, Seed, A(1987) “Management accounting in the new
manufacturing environment”, National Association of Accountants, Montrale, New Jersey
Johnson,T and Kaplan, R.S. (1987) Relevance Lost: The Rise and Fall of Management
Accounting, Harvard University Press.
Keasey, K. and.Watson, R(1993) “Small firm management” Blackwell. Oxford.
Kennedy, J.A and Sugden K.F (1986) Ritual and reality in capital budgeting; Management
Accounting (February) pp34-37
Kirby, D.A and King, S.H. (1997) Accountants and small firm development: filling the
expectation gap. Service Industries Journal, 17.2, pp 294-304
Kirby,D.,Najak,B.,Greene,F (1998)” Accounting for growth: Ways accountants can add
value to Small businesses”. Institute of Chartered Accountants in England and Wales,
London
Jovanovic,B.(1982)” Selection and the evaluation of industry”. Econometrica 50.3 pp649-
670
25
Littler D.A and.Sweeting R.C(.1983) “New business development in mature firms.”
Omega 11.6 pp 537-545
Littler D.A and.Sweeting R.C (1990)“The Management of new technology based business:
The Existentialist Firm” Omega 18.3 pp 231-240).
McChlery, S. and Meechan, L. (2000). Barriers and catalysts to financial management
systems in small sized enterprises. Conference proceedings from 23rd ISBA National Small
Firms Policy and research Conference, Aberdeen.
Miller,D and Friesen P.H. (1984) “ A lower individual study of the corporate life cycle”
Management Science 30.10 pp1161-1183
Najak,A. and Greenfield, S (1994).The use of management accounting information for
managing micro businesses. In Hughes,A.and Storey,D (eds), Finance and the Small Firm.
Routlegde, London
Otley,D. (1999). Performance management: a framework for management control systems
research. Management Accounting Research.10, pp363-382
Pike, R.H. (1983)”A review of recent trends in formal capital budgeting processes”.
Accounting and Business Research. Summer.pp201-208
Rothwell, R (1992). Successful industrial innovation: critical factors for the 1990s.R&D
Management 22(3) pp221-239
Scapens R.W (1985)“Management accounting: a review of contemporary developments.”
Macmillan. London.
Schroeder, R, Van de Van, A, Scudder, G and Polley, D (1986) “Managing innovation and
change processes” Findings from the Minnesota Innovation Research Programme.
Agribusiness 2.4 pp 501.523
Sweeting R.C. (1991) “Early-Stage new technology-based business: Interaction with
venture capitalists and the development of accounting techniques and procedure” British
Accounting Review 23 pp 3-21

26
Sweeting R.C and Davies R.E (1995) ”Industrial innovation and parallel accounting
developments” Technovation 15.5 pp289-302
Van de Ven, A.H. (1986) Central problems in the management of innovation. Management
Science.32 (5) pp 590-607
Von Hippel, E. (1977) transferring process equipment innovations from user-innovators to
equipment manufacturing firms. R&D Management,8(1) pp13-22
27
Appendix I
We can also, at this stage, speculate about the characteristics of the “barrier of belief”:
Before the barrier:
? There is a focus on cash by the owner manager.
? Concerns exist about new sources of funds but managers are unable to adequately estimate amounts needed and make suitable business cases.
? Managers are not sufficiently conversant about the interacting mechanics of internal costs and revenues. They are unable to financially articulate strategy or make operational decisions, for example pricing, based on sound finance data and relevant applied techniques.
? Managers may be uncomfortable about approaching/using/hiring external professionals, for example accountants. They may have little experience and knowledge about how to choose between professionals. They may feel challenged (if not threatened) as they cannot discuss and argue in the specialist areas of which they have little knowledge.
? As the SME business grows and develops, the owner- manager learns, and if from a larger business, adapts, through an existentialist experience (Littler and Sweeting, 1990). It interacts with other owner-managers in networks of different kinds and so heads to breaking through the “barrier of belief” both in terms of themselves and development of management techniques and practices.
Through the barrier:
? The owner manager has more “openness to not knowing” (Littler and Sweeting, 1983), which comes from more business confidence and willingness to interact with new management ideas.
? Increased willingness to bring in people from outside to fill knowledge and competency “gaps” and to recognise the value of this and the price to be paid.
? Interaction with influential outsiders, for example venture capitalists, who may demand the engagement of professionals in the SME (Sweeting, 1991).
28
Tables and charts
Table 1 Comparison of the three control techniques analysed using the performance management framework
Question
Budgetary control EVA Balanced scorecard
1. Objectives Financial objectives: -profit
-cash flow -ROCE
Single financial objective Multiple objectives based on strategy
2. Strategies and plans Means/end relationships not formally considered, although budget is based on a plan of
action.
Delegated to responsible managers. May be
considered when setting targets
Implicit in selecting some performance measures: no
formal procedures suggested.
3. Targets Best estimates for financial
planning; literature on target-setting gives some guidelines for
control.
Some guidance is given with respect to ‘inheritance
effect’
Not considered, despite being central to balance
4. Rewards Not addressed, despite many rewards now being made contingent upon budget
achievement
Appropriate incentive schemes a central part of the
methodology
Not addressed
5. Feedback Short-term feedback of budget variances. Incremental budgeting
from year to year
Some discussion of longer-term impact
Reporting of performance assumed, but no explicit
guidance given Source: Otley (1999)
29
Figure 1 Size profile in terms of turnover
Services Manufacturers Total (N=98) % 0f
Services (N=42) % of manufacturers (N=140) % of
total <£250 k 17 17.3% 9 21.4% 26 18.6% £250k- <£1m 39 39.8% 15 35.7% 54 38.6% £1m- <£10m 30 30.6% 12 28.6% 42 30.0% £10m-<£50m 6 6.1% 4 9.5% 10 7.1% £50m-<£100m 0 0.0% 1 2.4% 1 0.7% >£100m 1 1.0% 0 0.0% 1 0.7% Not disclosed 5 5.1% 1 2.4% 6 4.3% Total 98 100% 42 100% 140 100% Figure 2 Size profile in terms of employees
Services # Manufacturers Total
(N=98) % of services (N=42) % of
manufacturers (N=140) % of total
1-5 employees 37 37.8% 14 33.3% 51 36.4% 6-10 employees 17 17.3% 9 21.4% 26 18.6% 11-20 employees 22 22.4% 6 14.3% 28 20.0% 21-40 employees 9 9.2% 5 11.9% 14 10.0% Over 40 employees 13 13.3% 8 19.0% 21 15.0% Not disclosed 0 0.0% 0 0.0% 0 0.0% Total 98 100% 42 100% 140 100% # t-test significant at 99.9% level of confidence reveals that manufacturing businesses employ more employees than service businesses Figure 3 Profile in terms of age of business
services * mean=13.4 yrs
manufacturers * mean=18.41 yrs
Total * mean=14.89 yrs
(N=98) % of services
(N=42) % of manufacturers
(N=140) % of total
< 2 years 13 13.3% 7 16.7% 20 14.3% 3-5 years 19 19.4% 7 16.7% 26 18.6% 6-10 years 15 15.3% 8 19.0% 23 16.4% 11-15 years 11 11.2% 8 19.0% 19 13.6% 16-20 years 13 13.3% 3 7.1% 16 11.4% > 20 years 20 20.4% 7 16.7% 27 19.3% Not disclosed 7 7.1% 2 4.8% 9 6.4% Total 98 100% 42 100% 140 100%
30
Figure 4 Advanced manufacturing techniques used by manufacturers
Total usage Technique used
(N= 42) % of manufacturers
MRP
3 7.1%
Computer Integrated Manufacturing
4 9.5%
JIT
15 35.7%
Flexible Manufacturing Systems 9 21.4% TQM 16 38.1%
OTHER 6 14.3%
Figure 5 Turnover growth profiles
manufacturers services Total (N=42) % disclosing
turnover growth (N=98) % disclosing turnover growth (N=140)
% disclosing turnover growth
Negative growth 11 27.5 % 19 21.8% 30 23.6% No change 10 25.0% 25 28.7% 35 27.6% Growth (1-10%) 11 27.5 % 21 24.1% 32 25.2%
(11-25%) 6 15 .0% 14 16.1% 20 15.7% (26-50%) 2 5.0% 1 1.1% 3 2.4%
(More than 25%) 0 0.0% 7 8.0% 7 5.5% Total 40 100% 87 100% 127 100%
Not disclosed 2 11 13
Figure 6 Planned growth strategies
manufacturers services Total Strategy
(N=42) % (N=98) % (N=140) % of total
Acquisit ion 8 19.0% 16 16.3% 24 17.1% New markets/customers 39 92.9% 82 83.7% 121 86.4% Improving competition 31 73.8% 57 58.2% 88 62.9% New products 31 73.8% 59 60.2% 90 64.3%
31
Figure 7 Cost management Techniques used
Total Users
Manufacturers
Services
(N=140) % (N=42) % (N=98) %
Cost of Quality
23 16.4% 9 21.4% 14 14.3%
ABC
37 26.4% 11 26.2% 26 26.5%
ABCM
18 12.9% 2 4.8% 16 16.3%
NPV
10 7.1% 3 7.1% 7 7.1%
Payback 16 11.4% 7 16.7% 9 9.2%
IRR 6 4.3% 1 2.4% 5 5.1%
ARR
4 2.9% 1 2.4% 3 3.1%
Cost modelling
6 4.3% 3 7.1% 3 3.1%
Strategic Mgmt accounting
14 10.0% 4 9.5% 10 10.2%
Life cycle costing
7 5.0% 1 2.4% 6 6.1%
Target cost planning
28 20.0% 5 11.9% 23 23.5%
Break even analysis 55 39.3% 18 42.9% 37 37.8% Other 9 6.4% 4 9.5% 5 5.1%
Figure 8a Cost Information-Longer term
Manufacturers Services Total Growth>0
(N=42) % of 42 (N=98) % of 98 (N=140) % of 140
Average employee
Size % of users
Business strategy
13 31.0% 36 36.7% 49 35.0% 23.4 31* 63.3%
New products and services
17 40.5% 39 39.8% 56 40.0% 21.5 29 51.8%
Investment justification
17 40.5% 37 37.8% 54 38.6% 27.4 34* 63.0%
*Statistically significant at 95% confidence level (t -test)

32
Figure 8b Cost Information-Short term
Manufacturers Services Total Growth>0
(N=42) % of 42 (N=98) % of 98 (N=140) % of 40
Average employee
Size % of users
Budgetary planning
And control
17 40.5% 53 54.1% 70 50.0% 24.3 41* 58.6%
Pricing 36 85.7% 80 81.6% 116 82.9% 19.2 56* 48.3%
Procurement
25 59.5% 65 66.3% 90 64.3% 19.2 43 47.8%
*Statistically significant at 95% confidence level (t -test) Figure 8c Performance measurement
Manufacturers Services Total Growth>0
(N=42) % of 42 (N=98) % of 98 (N=140) % of 40
Average employee
Size % of users
Management performance
11 26.2% 31 31.6% 42 30.0% 26.9 24* 57.1%
Business performance
25 59.5% 55 56.1% 80 57.1% 23.5 42* 52.5%
*Statistically significant at 95% confidence level (t -test) Figure 8d Cost reduction
Manufacturers Services Total Growth>0
(N=42) % of 42 (N=98) % of 98 (N=140) % of 40
Average employee
Size % of users
Cost reduction
28 66.7% 52 53.1% 80 57.1% 22.2 41* 51.3%
*Statistically significant at 95% confidence level (t -test)
33
Figure 9 Business advice and assistance
Always Usually Sometimes Never
% of usage % of usage
% of usage
% of usage
Total
Academic Institutions
1 1.1% 3 3.2% 22 23.7% 67 72.0% 93
Support Agencies
2 1.9% 8 7.5% 42 39.6% 54 50.9% 106
External Accountant
11 9.5% 35 30.2% 52 44.8% 18 15.5% 116
Network of contacts
9 8.0% 43 38.1% 37 32.7% 24 21.2% 113
Consultants
3 2.9% 7 6.7% 47 44.8% 48 45.7% 105
Other 4 15.4% 6 23.1% 7 26.9% 9 34.6% 26
Figure 10 Role played by the external accountant-growth
Total Growth>0
Manufacturers
Services
( n=140) % of total % of users (n = 42)
% of manufactu
rers (n= 98) % of
services
Active member of management team
6 4.3% 4 66.7% 2 4.8% 4 4.1%
Business Advice for management
46 32.9% 21 45.7% 12 28.6% 34 34.7%
Source of emergency advice
52 37.1% 21 40.4% 16 38.1% 36 36.7%
Financial management support
44 31.4% 27 61.4% 10 23.8% 34 34.7%
Statutory advice
98 70.0% 46 46.9% 30 71.4% 68 69.4%
Other
9 6.4% 5 55.6% 3 7.1% 6 6.1%


![arXiv:2008.04621v1 [cs.CV] 11 Aug 2020Moi Hoon Yap1 1 Manchester Metropolitan University, Manchester, UK 2 Image Metrics Ltd, Manchester, UK 3 National Taiwan University of Science](https://static.fdocuments.in/doc/165x107/602b82221c0c2d50b650e4eb/arxiv200804621v1-cscv-11-aug-2020-moi-hoon-yap1-1-manchester-metropolitan-university.jpg)