Managing the Analytics Life Cycle for Decisions at Scale … The SAS ® Analytics Life Cycle: Best...
17
WHITE PAPER Managing the Analytics Life Cycle for Decisions at Scale How to Go From Data to Decisions as Quickly as Possible
Transcript of Managing the Analytics Life Cycle for Decisions at Scale … The SAS ® Analytics Life Cycle: Best...

Title
WHITE PAPER
Managing the Analytics Life Cycle for Decisions at Scale How to Go From Data to Decisions as Quickly as Possible
ii
ContentsIntroduction ........................................................................................................... 1
Decisions at Scale ................................................................................................ 2
What Are the Challenges? ..........................................................................................3
The SAS® Analytics Life Cycle: Best Practices for Improving Your Predictive Modeling Results ................. 4
The Discovery Phase of the Analytics Life Cycle ....................................................4
The Deployment Phase of the Analytics Life Cycle ...............................................6
From Concept to Action: How to Create an Efficient Analytical Environment ..................................... 7
How SAS® Can Help Across the Analytics Life Cycle .................................... 8
Data Preparation and Exploration: A Systematic Approach ................................9
Model Development With an Innovative Analytics Workbench ......................10
Model Implementation All From One Easy-to-Use Environment ...................11
Action! Putting Your Modeling Results to Use as Quickly as Possible ...................................................................................................................12
Model Management and Evaluation: An Ongoing Process ............................12
Case Studies ........................................................................................................13
UK Financial Institution: Modernizing Its Analytics Life Cycle ..........................13
Orlando Magic: The Magic Behind the Magic ....................................................13
For More Information ........................................................................................14

Introduction
Consider this scenario:
An organization has hundreds of analytical models embedded in production systems to support decision making in marketing, pricing, credit risk, operational risk, fraud and finance functions.
Analysts across different business units develop their models without any formal-ized or standardized processes for storing, deploying and managing them. Some models don’t have documentation describing the model’s owner, business purpose, usage guidelines or other information necessary for managing the model or explaining it to regulators.
Model results are provided to decision makers with limiTed controls and require-ments. Because different data sets and variables are used to create the models, results are inconsistent. There is little validation or back-testing for accuracy.
Decisions are made on the model results received – and everyone hopes for the best.
Such modeling confusion may look all too familiar to many organizations. In a diverse and loosely managed modeling environment, it can be difficult to answer critical questions about the predictive analytical models that your organization relies on. Questions like:
• Who created the models and why?
• What input variables are used to make predictions and, ultimately, to make decisions?
• How are the models used?
• How are models performing, and when were they last updated?
• Where is the supporting documentation?
• Why is it taking so long to put new or updated models into production?
The organization that can’t answer those questions with confidence cannot be sure its analytical models are delivering real value.
Analytical models are at the heart of critical business decisions. They can identify new opportunities, help you forge new or better relationships with customers, and enable you to manage uncertainty and risks. For these reasons and many more, they should be created and treated as high-value organizational assets. But how do you do that?
For starters, you need powerful, easy-to-use software that can help you wrangle your data into shape and quickly create many accurate predictive models. Then it takes powerful, integrated processes to manage your analytical models for optimal perfor-mance throughout their entire life cycle. Both IT and analytics teams need efficient, repeatable processes and a reliable architecture for managing data, communicating the rationale, and tracing the predictive analytics models through the deployment cycle.
1

2
And most importantly, the key to analytical success is quickly turning data into insights into actions, which means you must efficiently integrate accurate predictive models into the production systems that drive your automated decisions.
The growing complexity and magnitude of managing potentially hundreds or thousands of models in flux puts organizations at the cusp of an information revolution. The old and inefficient handcrafted approach must evolve to a more effective automated process.
Decisions at ScaleHow many operational decisions are made in your organization each day? Probably more than you can even imagine. For example, take a financial institution. How many credit card transactions are processed each hour? (At one major processor, the transac-tion rate can reach 14,000 per second.) Each one represents an operational decision – to allow or disallow the transaction to go through based on a calculated fraud risk score. And while each operational decision or transaction may have a low individual risk, the large number of these decisions that are made hourly or daily greatly compounds the associated risk.
That’s why the ability to produce good operational decisions very quickly, while incor-porating ever-increasing volumes of data, can mean the difference between fraud and no fraud – in business success or failure.
So what does it take to make a lot of good, fast operational decisions that consistently reflect overall organizational strategy and at the same time keep your organization humming happily along, faster and better than anyone else?
1. Operational applications that use data to produce answers for people (or systems) so that the right actions are taken.
2. Insightful and up-to-date analytical models that the business can rely on for optimal decisions at the right time.
“ Operational decisions are what make your business strategy real and ensure that your organization runs effectively.”
James Taylor and Neil Raden, Smart (Enough) Systems
Using Your Models for Automated Decision Making
Operational decisions are highly repeatable decisions, often made many times a day. These decisions can be made by people (e.g., call center employees cross-sell or up-sell to customers on the phone), or they may be completely automated, mimicking human decision logic (e.g., a credit card purchase is declined). However, an operational decision doesn’t have to be about a single customer – it can be about which group of customers gets a specific offer. These types of decisions are pushed into campaign management systems each week or month. When predictive analytical models are embedded into production systems, and a business process uses the results to produce instantaneous answers, you have effectively deployed analytical models.
3
3. The integration of business rules and predictive analytics into operational decision flows that provide the instructional insight needed for vetted, trusted decisions.
4. A way to manage and monitor the analytical models to ensure they are performing well and continue to deliver the right answers.
5. An architecture and processes that can grow to address new needs, like streaming data and building more detailed predictive models faster than ever.
What Are the Challenges?Unfortunately, though data abounds and everyone acknowledges what is needed, the ability to turn voluminous, disjointed data into useful insights that drive better auto-mated decisions isn’t easy. There are numerous challenges:
• Delays. Due to processes that are often manual and ad hoc, it can take months to get a model implemented into production systems. Because it takes so long to move models through development and testing phases, they can be stale by the time they reach production. Or they never get deployed at all. Internal and external compliance issues can make the process even more challenging.
• Difficulty defining triggers. The step of translating answers from analytical models into business actions for operational decisions requires clear, agreed-upon business rules. These business rules need to become part of the governed environment because they define how the results of the models are used. For example, a fraud detection model might return a fraud risk score as a number between 100 and 1,000 (similar to a FICO credit score). It is up to the business to decide what level of risk requires action. If the trigger for a fraud alert is set too high, fraud might go unnoticed. If the trigger for fraud is set too low, the alerts create too many false posi-tives. Both outcomes will decrease the value these models create and also reduce trust in the results.
• Poor results. Too often poorly performing models remain in production even though they are producing inaccurate results that lead to bad business decisions. Model results will change as the data changes to new conditions and behaviors. The main reasons for this situation are a lack of a central repository for models and no consis-tent metrics to determine when a model needs to be refreshed or replaced.
• Confusion. Organizations find themselves in reactive mode – responding in a rush to deadlines from external agencies. Each group has a different approach for handling and validating a model. This results in unique reports with different levels of detail for review or models that are inconsistently described, making IT translation difficult. No one is sure why the champion model was selected, how a particular score was calculated or what governs the business rules that trigger the model.
• Lack of transparency. There is little visibility into the stages of model development or knowledge of who touches the model as it goes through its life cycle. Conflicting assumptions arise. Unbiased reviewers must be called in to validate models as they pass through each group – a big resource drain.
• Loss of important model knowledge. With inadequate documentation for models, important intellectual property is in the mind of the model owner. When that person leaves, the knowledge is gone.
• Shortage of analytical skills. Even with increasing numbers of data scientists entering the marketplace, the shortage of analytical skills needed for model creation and deployment is still a big challenge for many organizations.

4
The SAS® Analytics Life Cycle: Best Practices for Improving Your Predictive Modeling ResultsSuccessful organizations recognize that analytic models are essential corporate assets that produce and deliver answers to production systems for improved customer rela-tionships, improved operations, increased revenues and reduced risks. So of course they seek to create the best models possible.
However, few fully manage all the complexities of the complete analytical model life cycle. It’s such a multifaceted task.
At SAS, we’ve developed an iterative analytics life cycle to guide you step-by-step through the process of going from data to decision. We begin by realizing that there are two sides to the analytics life cycle – discovery and deployment. Let’s take a look at the tasks for both sides and see how they interact to create an iterative process that you can use to produce repeatable, reliable predictive results.
Figure 1: The analytics life cycle from SAS.
The Discovery Phase of the Analytics Life Cycle
• Ask a question. The discovery process is driven by asking business questions that produce innovations. So the first step is defining what the business needs to know. And then translating the business question into a mathematical representation of the problem, which can be solved with predictive analytics. Businesspeople also need to specify the need, scope, market conditions and goals related to a business question they are trying to answer – which helps in the selection of the most appropriate modeling techniques.

5
• Prepare the data. Technologies like Hadoop and faster, cheaper computers have made it possible to store and use more data, and more types of data, than ever before. But this has only amplified the need to join data in different formats from different sources and transform raw data so that it can be used as input for predictive modeling. With new data types from connected devices, such as machine sensor data or web logs from online interactions, the data preparation stage has become even more challenging. Many organizations still report that they spend an inordinate amount of time, sometimes up to 80 percent, dealing with data preparation tasks. The majority of time in the discovery phase should be spent on exploring data and creating good models instead of preparing data.
• Explore the data. Interactive, self-service visualization tools need to serve a wide range of users (from the business analyst with no statistical knowledge to the analyti-cally savvy data scientist) so they can easily search for relationships, trends and patterns to gain deeper understanding of the data. In this step, the question and the approach formed in the initial “ask” phase of the project will be refined. Ideas on how to address the business problem from an analytical perspective are developed and tested. While examining the data, you may find the need to add, delete or combine variables to create more precisely focused models. Fast, interactive tools help make this an iterative process, which is crucial for identifying the best questions and answers.
• Model the data. In this stage, numerous analytical and machine-learning modeling algorithms are applied to the data to find the best representation of the relation-ships in the data that will help answer the business question. Analytical tools search for a combination of data and modeling techniques that reliably predict a desired outcome. There is no single algorithm that always performs best. The “best” algo-rithm for solving the business problem depends on the data. Experimentation is key to finding the most reliable answer, and automated model building can help minimize the time to results and boost the productivity of analytical teams.
In the past, data miners and data scientists were only able to create several models in a week or month using manual model-building tools. Improved software and faster computers have sped up the model-building process so hundreds or even thousands of models can be created today in the same time frame. But that brings to the surface another issue – how to quickly and reliably identify the one model (out of many) that performs best? Model “tournaments” provide a way to compare many different competing algorithms with the opportunity to choose the one that provides the best results for a specific set of data. With automated tourna-ments of machine-learning algorithms and clearly defined metrics to identify the champion model, this has become an easier process. Analysts and data scientists can spend their time focusing on more strategic questions and investigations.

6
The Deployment Phase of the Analytics Life Cycle
• Implement your models. This is where you take the insights learned from the discovery phase and put them into action using repeatable, automated processes. In many organizations this is the point where the analytical modeling process slows dramatically because there is no defined transition between discovery and deploy-ment, or collaboration between the model developers and IT deployment architects, much less optimized automation. In most organizations the deployment environ-ment is very different from the discovery environment, especially when the predic-tive models are supporting operational decision making. Often, IT has to apply rigorous governance policies to this environment to ensure service-level agree-ments with the business. By integrating the discovery and deployment phases, you can create an automated, flexible and repeatable transition that improves opera-tional decisions. Additionally, a transparent, governed process is important for everyone – especially auditors. Once built, the model is registered, tested or vali-dated, approved and declared ready to be used with production data (embedded into operational systems).
• Act on new information. There are two types of decisions that can be made based on analytical results. Strategic decisions are made by humans who examine results and take action, usually looking to the future. Operational decisions are automated – like credit scores or recommended best offers. They don’t require human interven-tion because the rules that humans would apply can be coded into the production systems. More and more organizations are looking to automate operational deci-sions and provide real-time results to reduce decision latencies. Basing operational decisions on answers from analytical models also makes these decisions objective, consistent, repeatable and measurable. Integration of models with enterprise decision management tools enables organizations to build comprehensive and complete operational decision flows. These combine analytical models with busi-ness-rule-based triggers to produce the best automated decisions. And because this is formally defined within the decision management tool, updates and refine-ments to changing conditions are easy – improving business agility and governance. Once approved for production, the decision management tool applies the model to new operational data, generating the predictive insights necessary for better actions.
• Evaluate your results. The next and perhaps most important step is to evaluate the outcome of the actions produced by the analytical model. Did your models produce the correct predictions? Were tangible results realized, such as increased revenue or decreased costs? With continuous monitoring and measurement of the models’ performance based on standardized metrics, you can evaluate the success of these assets for your business. That evaluation can then feed the next iteration of the model, creating a continuous machine-learning loop. If you identify degradation of analytical models, you can define the optimal strategy to refresh them so they continue to produce the desired results. With increasing numbers of analytical models, automation is necessary to quickly identify models that need the most atten-tion, and even deliver automated retraining.
• Ask again. Predictive models are not forever. The factors that drive the predictions in a model change over time, your customers change over time, competitors enter or leave the market, and new data becomes available. You have to refresh even the most accurate models, and organizations will need to go through the discovery and deployment steps again. It’s a constant and evolving process. If a model degrades, it is recalibrated by changing the model coefficients or rebuilt with existing and new characteristics. When the model no longer serves a business need, it is retired.

7
It is easy to imagine the many ways this process can go wrong. Organizations often take months, sometimes years, to move through this end-to-end process. There are many common complicating factors:
• The needed data sources might be scattered across your organization.
• Data may need to be integrated and cleansed multiple times to support a variety of analytical requirements.
• It can take a long time for models to be manually translated to different program-ming languages for integration with critical operational systems, which can include both batch and real-time systems.
• Organizations might be slow to recognize when a model needs to be changed, so they forge ahead with bad decisions based on outdated model results.
• Many of the steps in the analytics life cycle are iterative in nature and might require going back to a previous step in the cycle to add and/or refresh data.
• Different personas add complexity to the process, which makes collaboration and documentation very important. In many organizations, data preparation in the discovery phase is handled by the IT unit, while data exploration and model devel-opment are usually the responsibility of business analysts and data scientists. Deployment, especially when it includes integration into operational business processes, is managed by IT again (though this could be a different IT group than the data management group providing data).
The net effect is that the models, which are supposed to yield solid business insights, lead instead to suboptimal decisions, missed opportunities and misguided actions. But it doesn’t have to be that way!
From Concept to Action: How to Create an Efficient Analytical Environment In an effective analytical environment, data is rapidly created and accessed in the correct structure for exploration and model development. Models are rapidly built and tested, and deployed into a production environment with minimal delay. Production models quickly generate trusted output. Model performance is constantly monitored, and underperforming models are quickly replaced by more up-to-date models.
In short, a successful analytics strategy means more than creating a powerfully predic-tive model; it is about managing each of these lifecycle stages holistically for a partic-ular model and across the entire portfolio of models. This is no easy feat.
Consider that analysts and data scientists don’t just develop one model to solve a business problem. They develop a set of competing models and use different tech-niques to address complex problems. They will have models at various stages of devel-opment and models tailored for different product lines and business problems. An organization can quickly find itself managing thousands of models.
Furthermore, the model environment is anything but static. Models will be continually updated as they are tested and as new results and data become available. The goal is to build the best predictive models possible, using the best data available.
8
Predictive models are high-value organizational assets, and success requires more than relying solely on the technology element. Organizations must also closely look at people and processes. For example, it’s important to constantly upgrade business and technical analytical skills so that the most important business issues are identified and analytical insights can be applied to operational processes.
The analytics life cycle is iterative and collaborative in nature. Staff members with different backgrounds and skills are involved at various stages of the process. A business manager has to clearly identify an issue or problem that requires analytics-driven insights, then make the appropriate business decision and monitor the returns from the decision. A business analyst conducts data exploration and visualization and works to identify key variables influencing outcomes. The IT and data management teams help facilitate data preparation and model deployment and monitoring. A data scientist or data miner performs more complex exploratory analysis, descriptive segmentation and predictive modeling.
To get the best analytics results, organizations need to put people with the right skills in place, and enable them to work collaboratively to perform their roles.
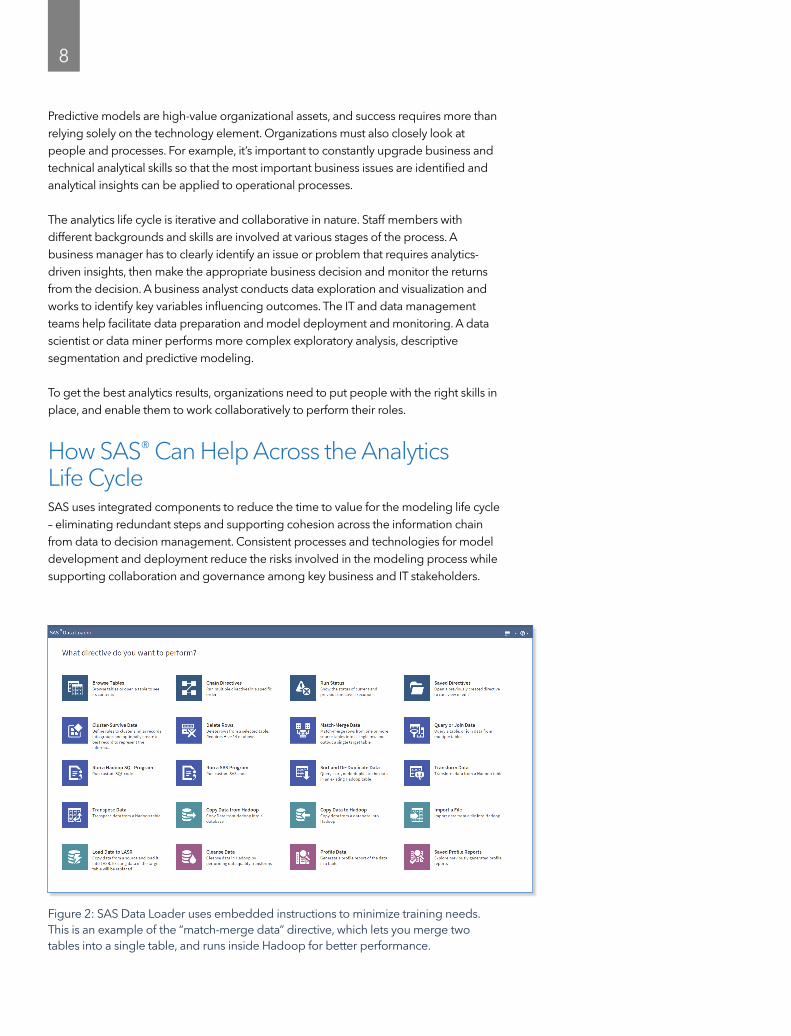
How SAS® Can Help Across the Analytics Life CycleSAS uses integrated components to reduce the time to value for the modeling life cycle – eliminating redundant steps and supporting cohesion across the information chain from data to decision management. Consistent processes and technologies for model development and deployment reduce the risks involved in the modeling process while supporting collaboration and governance among key business and IT stakeholders.
Figure 2: SAS Data Loader uses embedded instructions to minimize training needs. This is an example of the “match-merge data” directive, which lets you merge two tables into a single table, and runs inside Hadoop for better performance.

9
Data Preparation and Exploration: A Systematic Approach
• Data preparation. SAS® Data Management enables you to profile and cleanse data and create extract, load and transform (ELT) routines that produce analytical data marts, using only the data that is required from the database. The data is staged in the database for fast loading, transformed into a structure fit for model building and summarized to create derived fields. These processes can be automated and sched-uled in batch or run ad hoc and in real time, depending on the stage of the analytics life cycle. Self-service data preparation and data wrangling tools like SAS Data Loader for Hadoop help business analysts and data scientists streamline access, blending and cleansing of data without burdening IT. Event stream processing from SAS leads to high-volume throughput of hundreds of millions of events per second – with low-latency response times. It helps you know what needs immediate atten-tion, what can be ignored and what should be stored. Finally, in-database processing is used to reduce data movement and improve performance.
• Data exploration. SAS Visual Analytics lets business analysts easily discover impor-tant relationships in data and quickly zero in on areas of opportunity or concern, uncover unexpected patterns, examine data distributions, find the prevalence of extreme values, and identify important variables to incorporate in the model devel-opment process.
Figure 3: Explore data from an interactive data visualization environment.

10
Model Development With an Innovative Analytics Workbench
Analysts can build predictive models using a variety of SAS tools that include a rich set of algorithms to analyze structured and unstructured data.
• Automated machine-learning tournaments. With SAS Factory Miner, you get an interactive predictive modeling environment that makes it extremely easy to create, modify and assess hundreds – or even thousands – of models very quickly. With just a few clicks, you can access, modify and transform your data, choose which machine-learning techniques you want to apply, and run the models in an automated model tournament environment to quickly identify the best performer. Templates using best-practice modeling pipelines can be created and shared with other users of the system without writing a single line of code.
• Predictive modeling and data mining. SAS® Enterprise MinerTM streamlines the data mining process so you can quickly create fine-tuned predictive and descriptive models based on large volumes of data. An interactive, self-documenting process flow environment shortens the model development time for your data miners and statisticians. They can use visual assessment and validation metrics and compare multiple models.
• Text mining. SAS Text Analytics provides a rich suite of tools for discovering and extracting concepts and knowledge from text sources, including the web, call center notes, books, etc. You can add insights from text-based sources to your analytical models for more predictive power.
• In-memory analytics. SAS distributed, in-memory analytics processing takes advantage of a highly scalable and reliable analytics infrastructure, including database appli-ances – like Pivotal Greenplum, Teradata, Oracle and SAP HANA – and commodity hardware using Hadoop. Such fast processing enables iterative machine-learning and statistical models to learn very quickly from extremely large data sources.
Figure 4: Customizable assessment techniques in SAS Factory Miner enable you to generate champion models for every segment in your data.
11
Model Implementation All From One Easy-to-Use EnvironmentSAS Enterprise Decision Manager is key to improving the deployment side of the analytics life cycle. It provides a shared, web-based environment for managing the life cycle and governance of your modeling assets, and is suitable for both business users and IT. Analysts select data and models from a centralized repository, while being able to define business rules within context of their models. This framework makes it easy to trace modeling activities, make modifications and test continually in a single environment.
• Model registration. When model development is complete, analysts register a model package that contains the model, including all of the data transformations, imputations, etc., and all of its associated output and documentation. This package ensures that the right steps have been taken, and that a suitable, powerful model is released into the production environment. It also helps organizations standardize the process of creating, managing, deploying and monitoring analytical models.
• Governance. Managing model risk includes accountability metrics and version control status reports that track who changes what, when control is passed from one area to another, and more. A centralized model repository, lifecycle templates and version control provide visibility into analytical processes and ensure that they can be audited to comply with internal governance and external regulations.
• Model repository. A central, secure repository stores extensive documentation about the model, its scoring code and associated metadata. Modelers can easily collaborate and reuse model code, with their activities tracked via user/group authentication, version control and audit controls.
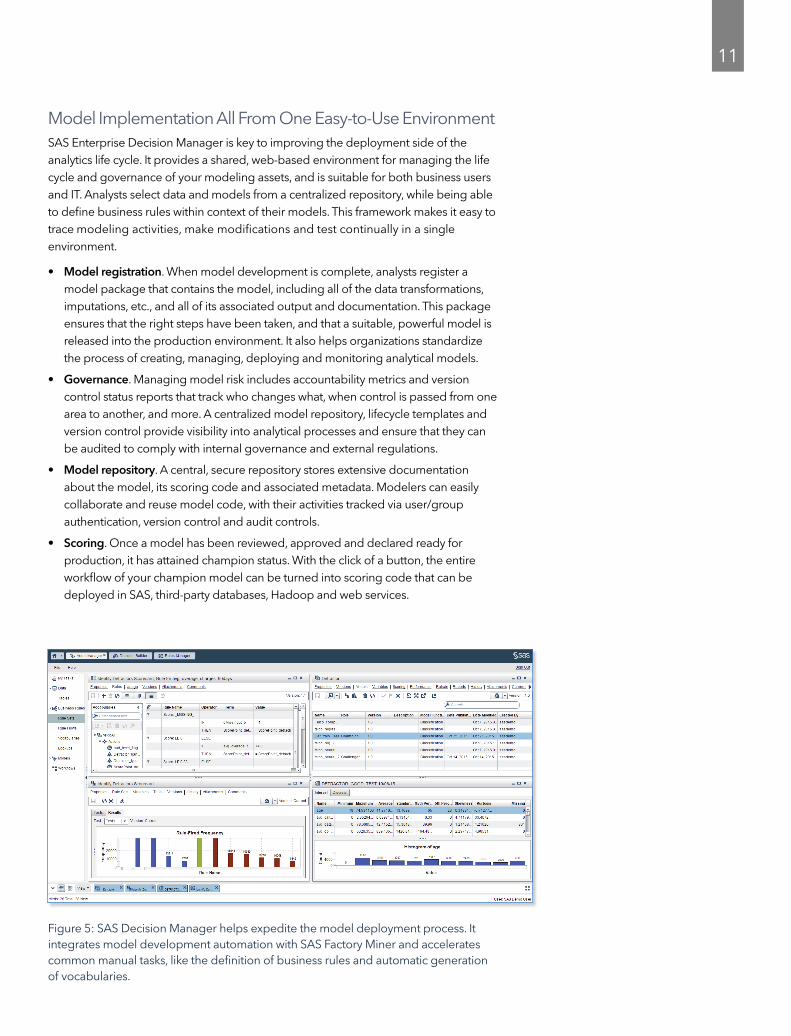
• Scoring. Once a model has been reviewed, approved and declared ready for production, it has attained champion status. With the click of a button, the entire workflow of your champion model can be turned into scoring code that can be deployed in SAS, third-party databases, Hadoop and web services.
Figure 5: SAS Decision Manager helps expedite the model deployment process. It integrates model development automation with SAS Factory Miner and accelerates common manual tasks, like the definition of business rules and automatic generation of vocabularies.

12
• Validation. Scoring logic is validated before models are put into production, using a systematic template and process to record each test the scoring engine goes through, to ensure the logic embedded in the champion model is sound.
Action! Putting Your Modeling Results to Use as Quickly as PossibleWith SAS, you can choose from multiple deployment options to get your champion models embedded into your production systems, where they can produce analytic insights as quickly as possible. The integrated and automated deployment provided by SAS Scoring Accelerators can boost your model deployment performance in several ways.
• Faster deployment. Deploy information and analytical processes with minimum infrastructure and cost. The conversion of complete analytical scoring code into lightweight web services or native languages for processing in databases happens automatically. This eliminates the time-consuming and error-prone manual process of translating and validating the model score code for different environments.
• Flexible deployment: One size does not fit all when referring to the various opera-tional systems. Without requiring change, the same models can be deployed to both batch and real-time systems. This frees up analysts from the drudgery of having to accommodate each environment with different parameters, score code, and custom wrapper code.
• Faster and better governed scoring processes. Because the model is scored directly in the database, the model execution job takes advantage of the scalability and processing speed offered by the database. Jobs that used to take hours and days can now be completed in minutes and seconds. Data movement is minimized because the analytical scoring can take place where the data resides. And since the data does not have to leave the highly governed organizational data environment, data governance is secured. Even in more loosely managed environments like Hadoop, performance benefits from eliminating data movement and duplication can be significant.
Model Management and Evaluation: An Ongoing ProcessOnce a model is in a production environment and is being executed to provide answers, the champion model is centrally monitored through a variety of reports based on standardized key performance indicators. When the model performance starts to degrade below the acceptance level – based on the centrally managed model training assets – the model can be quickly recalibrated or replaced with a new model.
• Automated workflow. A web-based workflow console enables the model manage-ment process to become more automated, repeatable, collaborative and governed. The organization (and auditors) can track each step of a modeling project, from problem statement through development, deployment and retirement.
• Overall lifecycle management. All stages of a model’s life cycle are coordinated holistically, using prebuilt and customer-defined templates aligned with the organi-zation’s business processes.

13
• Automated model monitoring. Model performance jobs can be scheduled on a recurring basis – and the results monitored on an ongoing basis – for one model or the entire model inventory. These results can be posted on dashboards and thresh-olds defined for performance. And if these thresholds are violated, analysts receive alerts about the models that need attention, saving time and money.
With a formal model management framework, the best models get into production faster to start serving the business sooner. The organization can generate more and better models, with a large variety of analytics methods – with fewer resources. Analytical models are continually monitored and refined, so they are up-to-date and accurate. The entire process of discovery and deployment becomes more transparent and better governed, so it is easy to explain analytics-based decisions to regulators and business leaders.
Case StudiesWith a predictive analytics lifecycle approach, the “after” scenario looks quite different from the usual modus operandi – and creates a serious competitive advantage.
UK Financial Institution: Modernizing Its Analytics Life CycleA major financial institution in the UK determined that its cycle time from model initia-tion to model deployment wouldn’t meet 21st-century expectations. The process was manual, error-prone and resource-intensive – and had little or no monitoring to identify model degradation.
Working with SAS and data warehousing vendor Teradata, the organization built a flexible predictive analytics platform by integrating data management, model develop-ment and model deployment using in-database technology. The platform harnesses the scalability of the Teradata environment for model scoring and uses the power of SAS Analytics to build models.
With the new platform, more than 55 million records can be scored within Teradata many times during the day – something that could never have been achieved with the former process. The time required to promote a model to a production environment dropped from three months to days. Data preparation time was trimmed by 40 percent. Analyst productivity jumped 50 percent.
Orlando Magic: The Magic Behind the MagicProfessional sports teams in smaller markets often struggle to build a big enough revenue base to compete against their larger market rivals. By using SAS Analytics and SAS Data Management, the Orlando Magic are among the top revenue earners in the NBA, despite being in the 20th-largest market.
The Magic accomplish this feat by studying the resale ticket market to price tickets better, to predict season ticket holders at risk of defection (and lure them back), and to analyze concession and product merchandise sales to make sure the organization has what the fans want every time they enter the stadium. The club has even used SAS to help coaches put together the best lineup.

14
The Magic don’t have a crystal ball, but they do have SAS Enterprise Miner, which allowed them to better understand their data and develop analytic models that predict season ticket holder renewals. The data mining tools allowed the team to accomplish more accurate scoring that led to a difference – and market improvement – in the way it approached customer retention and marketing.
Read More
For More InformationTo learn more about the discovery phase of the analytics life cycle, read Data Mining From A to Z: How to Discover Insights and Drive Better Opportunities.
To learn more about the deployment phase, read From Data to Decision: How SAS Decision Manager Automates Operational Decisions.
How SAS® Is Different • Data preparation for analytics, interactive data explora-
tion and discovery, modern model development, model deployment, monitoring and management – all in one integrated platform.
• Integration of multiple analytical disciplines (such as data mining, machine learning, forecasting, text analytics and optimization) for greater model development agility and solving more complex business problems.
• Smart automation and customizable predictive modeling and machine-learning templates with embedded best practices provide highly productive and collaborative machine-learning tools to a diverse set of users.
• SAS can manage large numbers of complex models with virtually unlimited variables and extremely large data volumes.
• A web-based, automated model-tournament environ-ment boosts productivity by enabling modelers to quickly and easily test many approaches simultaneously using machine learning and statistical algorithms.
• With web-based workflow capabilities, users can easily define custom processes, manage them through to completion, foster collaboration with notifications and establish enterprise standards.
• A modeling lineage from data source to analytic result provides essential governance, critical for meeting regu-lations or strict reporting requirements.
• Intuitive, graphical performance monitoring dashboards help track model performance across multiple projects so teams can focus on projects that need the most immediate attention and avoid model decay.
• Interoperability with third-party modeling tools enables organizations to import, manage and monitor modeling assets created by SAS and other tools (e.g., PMML models, R) all together in a central repository.
• In-database scoring functions can be achieved with widely used databases such as Teradata, Aster Data, EMC Greenplum, IBM Netezza, IBM DB2, Oracle and Teradata.
• SAS metadata spans data management and analytics so that the data transformations used in the discovery phase can be reused during deployment.
• SAS provides extensive technical and business expertise for pre- and post-sales support, helping you expedite time to value and improve return on investment.

SAS and all other SAS Institute Inc. product or service names are registered trademarks or trademarks of SAS Institute Inc. in the USA and other countries. ® indicates USA registration. Other brand and product names are trademarks of their respective companies. Copyright © 2018, SAS Institute Inc. All rights reserved. 106179_G77421.0418
To contact your local SAS office, please visit: sas.com/offices