Mammogram Diagnostics via 2-D Complex Wavelet-based …spjm/articlepdf/506.pdf · Wavelet-based...
20
S˜ao Paulo Journal of Mathematical Sciences 8, 2 (2014), 265–284 Mammogram Diagnostics via 2-D Complex Wavelet-based Self-similarity Measures Seonghye Jeon Department of Industrial and Systems Engineering, Georgia Institute of Technology, US E-mail address : [email protected] Orietta Nicolis Instituto de Estadistica, Universidad de Valparaiso, Chile E-mail address : [email protected] Brani Vidakovic Department of Industrial and Systems Engineering, Georgia Institute of Technology, US E-mail address : [email protected] Abstract. Breast cancer is the second leading cause of death in women in the United States. Mammography is currently the most effective method for detecting breast cancer early; however, radiological inter- pretation of mammogram images is a challenging task. Many medical images demonstrate a certain degree of self-similarity over a range of scales. This scaling can help us to describe and classify mammograms. In this work, we generalize the scale-mixing wavelet spectra to the complex wavelet domain. In this domain, we estimate Hurst parameter and image phase and use them as discriminatory descriptors to clas- sify mammographic images to benign and malignant. The proposed methodology is tested on a set of images from the University of South Florida Digital Database for Screening Mammography (DDSM). Keywords: Scaling; Complex Wavelets; Self-similarity; 2-D Wavelet Scale-Mixing Spectra 1. Introduction The National Cancer Institute estimates that 1 in 8 women born today will be diagnosed with breast cancer during her lifetime (Altekruse et al., 2010). Breast cancer is one of the most common forms of cancer among women in the United States, second only to non-melanoma skin cancer. 265
-
Upload
truongdung -
Category
Documents
-
view
213 -
download
0
Transcript of Mammogram Diagnostics via 2-D Complex Wavelet-based …spjm/articlepdf/506.pdf · Wavelet-based...
Sao Paulo Journal of Mathematical Sciences 8, 2 (2014), 265–284
Mammogram Diagnostics via 2-D ComplexWavelet-based Self-similarity Measures
Seonghye Jeon
Department of Industrial and Systems Engineering, Georgia Institute of Technology, US
E-mail address: [email protected]
Orietta Nicolis
Instituto de Estadistica, Universidad de Valparaiso, Chile
E-mail address: [email protected]
Brani Vidakovic
Department of Industrial and Systems Engineering, Georgia Institute of Technology, US
E-mail address: [email protected]
Abstract. Breast cancer is the second leading cause of death in womenin the United States. Mammography is currently the most effectivemethod for detecting breast cancer early; however, radiological inter-pretation of mammogram images is a challenging task. Many medicalimages demonstrate a certain degree of self-similarity over a range ofscales. This scaling can help us to describe and classify mammograms.
In this work, we generalize the scale-mixing wavelet spectra to thecomplex wavelet domain. In this domain, we estimate Hurst parameterand image phase and use them as discriminatory descriptors to clas-sify mammographic images to benign and malignant. The proposedmethodology is tested on a set of images from the University of SouthFlorida Digital Database for Screening Mammography (DDSM).Keywords: Scaling; Complex Wavelets; Self-similarity; 2-D WaveletScale-Mixing Spectra
1. Introduction
The National Cancer Institute estimates that 1 in 8 women born todaywill be diagnosed with breast cancer during her lifetime (Altekruse et al.,2010). Breast cancer is one of the most common forms of cancer amongwomen in the United States, second only to non-melanoma skin cancer.
265
266 S. Jeon, O. Nicolis and B. Vidakovic
A national objective has been set by the U.S Department of Health andHuman Services to reduce the female breast cancer death rate from 22.9per 100,000 females in 2007 down to 20.6 by the year 2020 – a 10% im-provement (Healthy People 2020, U.S. Department of Health and HumanServices). One of the most important efforts toward that goal is advancingthe precision of screening technologies. Early detection is the best methodfor improving prognosis and also leads to less invasive options for bothspecific diagnosis and treatment.
Mammography is currently the most efficient and prevalent method fordetecting a breast cancer early, before the disease becomes symptomatic.However, the radiological interpretation of mammogram images is a diffi-cult task since the appearance of even normal tissue is highly variable andcomplex, and signs of early disease are often minute or indistinct. Readinga mammogram image is a skill that physicians develop over time, and con-fidently stating whether findings are cancerous or not is quite difficult andoften subjective. Suspicious findings are commonly clarified by follow-upimages, ultrasound, or MRI. On the other hand, it has been estimated that10 − 30% of cancers which could have been detected are missed (Oestre-icher et al., 2005). Thus, improving both the specificity and the sensitivityof mammographic diagnoses is an important goal in improving prognoseswhile also reducing the number of unnecessary procedures or surgical op-erations.
In high frequency and irregular data collected in real-life settings (bothnaturally occurring and human-made), a commonly occurring phenomenonis that of regular scaling. Examples of this have been found in a varietyof systems and processes including economics (stock market, exchange ratefluctuations), telecommunications (internet data), physics (hydrology, tur-bulence), geosciences (wind and rainfall patterns), and several applicationsin biology and medicine (DNA sequences, heart rate variability, auditorynerve-spike trains). The irregular behavior of these complex structures isdifficult or impossible to quantify by standard modeling techniques; butwhen observations are inspected at different scales, there is in fact a regu-lar relationship between the behavior at each scale. This phenomenon hasbeen demonstrated in many medical images, leading to its diagnostic useas a tool capable of quantifying statistical similarity of data patterns atvarious scales.
The standard measure of regular scaling is the Hurst exponent. Thismeasure can also be connected to the presence of long memory and fractal-ity in signals and images and is viewed as an informative summary. Manytechniques for estimating the Hurst exponent exist, and assessing the ac-curacy of these estimations can be complicated. Wavelet transforms arepowerful tool in estimating the Hurst exponent and modeling statisticalsimilarity at different scales. For example, Nicolis et al. (2011) proposed a
Sao Paulo J.Math.Sci. 8, 2 (2014), 265–284
Mammogram Diagnostics via 2-D Complex Wavelet-based Self-similarity Measures 267
method based on the wavelet spectra for extracting the self-similarity mea-sures in an isotropic and anisotropic spaces. Ramırez-Cobo et al. (2011)demonstrated a wavelet-based spectra method for estimating Hurst expo-nent in time-varying two-dimensional rainfall maps.
For an efficient representation of an image or signal, the wavelet basisis desirable to be orthogonal, symmetric and to have compact support.(Gao and Yan, 2010). An orthogonal basis has a variety of theoreticaland practical advantages: it leads to more efficient algorithms, and estab-lishing properties of a representation is often easier with orthogonal bases.Most importantly, orthogonal bases preserve the variances, a property crit-ical for the coherent definition of wavelet spectra. Symmetry guaranteesan orientation-free representation of features, preventing distortion in thetransformed domains. Moreover, the computational cost of performingwavelet transforms depends heavily on the support size of a basis. Apartfrom the Haar wavelet, complex wavelets with an odd number of vanish-ing moments are only compactly supported wavelets which are symmetric(Lawton, 1993). Due to this advantages, complex wavelet has been used invarious areas including motion estimation (Magarey and Kingsbury, 1998),texture image modeling (Portilla and Simoncelli, 2000), image denoising(Achim and Kuruoglu, 2005) and NMR spectra classification (Kim et al.,2008). However, to the best of our knowledge, there is no literature thatinvestigates self-similarity measures based on the complex wavelet spectra.
The novelty of this paper is to use the scale-mixing wavelet spectra basedon complex wavelet transforms for estimating the Hurst exponent. We fo-cus on the estimated Hurst exponent and show its ability to differentiatecancerous from normal tissue visible in the backgrounds of mammogramimages, and compare this performance with its counterpart obtained fromreal-valued wavelet transform. Moreover, complex wavelet transforms pro-duce an additional measure, the phase information. We also demonstratethe classification power of the phase information and use it as an additionalmodality in the discriminatory analysis.
A further novelty of our work is the use of the information contained inthe background tissue of images. Most of the references found in literaturedealing with breast cancer detection methods are based on microcalcifica-tions (Wang and Karayiannis, 1998; Netsch and Peitgen, 1999; Kesteneret al., 2001; El-Naqa et al., 2002). Only recently the information containedin the background is taken into consideration (Nicolis et al., 2011; Hamiltonet al., 2011). This classifying measure based on the irregularity measureof background tissue promises to be a new tool to be used in combinationwith existing clinical diagnostic tools, thus improving discriminatory powerof non-invasive diagnostic techniques.
Sao Paulo J.Math.Sci. 8, 2 (2014), 265–284
268 S. Jeon, O. Nicolis and B. Vidakovic
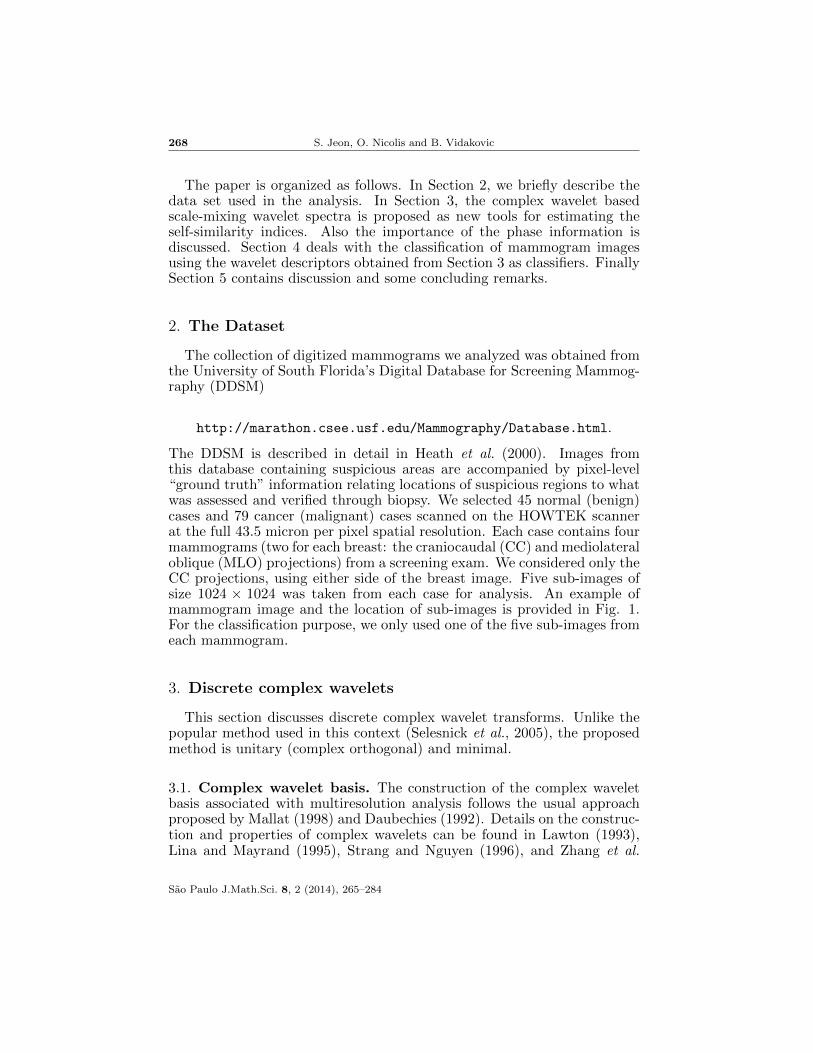
The paper is organized as follows. In Section 2, we briefly describe thedata set used in the analysis. In Section 3, the complex wavelet basedscale-mixing wavelet spectra is proposed as new tools for estimating theself-similarity indices. Also the importance of the phase information isdiscussed. Section 4 deals with the classification of mammogram imagesusing the wavelet descriptors obtained from Section 3 as classifiers. FinallySection 5 contains discussion and some concluding remarks.
2. The Dataset
The collection of digitized mammograms we analyzed was obtained fromthe University of South Florida’s Digital Database for Screening Mammog-raphy (DDSM)
http://marathon.csee.usf.edu/Mammography/Database.html.
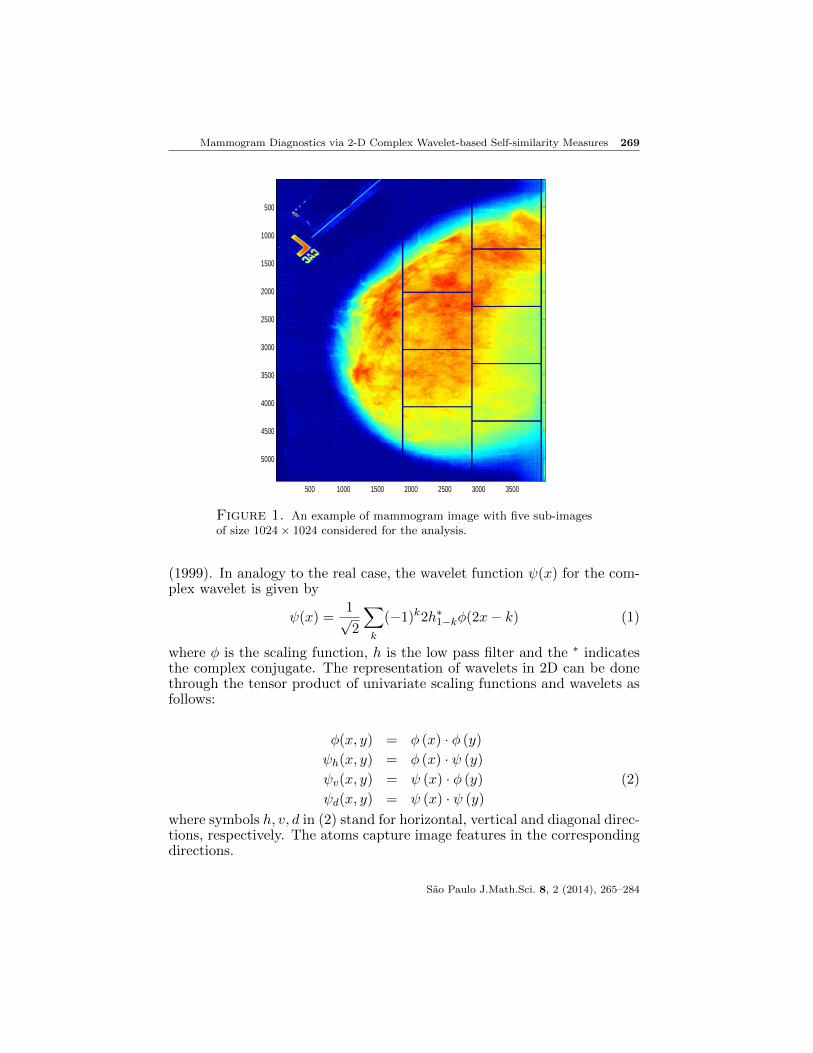
The DDSM is described in detail in Heath et al. (2000). Images fromthis database containing suspicious areas are accompanied by pixel-level“ground truth” information relating locations of suspicious regions to whatwas assessed and verified through biopsy. We selected 45 normal (benign)cases and 79 cancer (malignant) cases scanned on the HOWTEK scannerat the full 43.5 micron per pixel spatial resolution. Each case contains fourmammograms (two for each breast: the craniocaudal (CC) and mediolateraloblique (MLO) projections) from a screening exam. We considered only theCC projections, using either side of the breast image. Five sub-images ofsize 1024 × 1024 was taken from each case for analysis. An example ofmammogram image and the location of sub-images is provided in Fig. 1.For the classification purpose, we only used one of the five sub-images fromeach mammogram.
3. Discrete complex wavelets
This section discusses discrete complex wavelet transforms. Unlike thepopular method used in this context (Selesnick et al., 2005), the proposedmethod is unitary (complex orthogonal) and minimal.
3.1. Complex wavelet basis. The construction of the complex waveletbasis associated with multiresolution analysis follows the usual approachproposed by Mallat (1998) and Daubechies (1992). Details on the construc-tion and properties of complex wavelets can be found in Lawton (1993),Lina and Mayrand (1995), Strang and Nguyen (1996), and Zhang et al.
Sao Paulo J.Math.Sci. 8, 2 (2014), 265–284
Mammogram Diagnostics via 2-D Complex Wavelet-based Self-similarity Measures 269
500 1000 1500 2000 2500 3000 3500
500
1000
1500
2000
2500
3000
3500
4000
4500
5000
Figure 1. An example of mammogram image with five sub-imagesof size 1024 × 1024 considered for the analysis.
(1999). In analogy to the real case, the wavelet function ψ(x) for the com-plex wavelet is given by
ψ(x) =1√2
∑k
(−1)k2h∗1−kφ(2x− k) (1)
where φ is the scaling function, h is the low pass filter and the ∗ indicatesthe complex conjugate. The representation of wavelets in 2D can be donethrough the tensor product of univariate scaling functions and wavelets asfollows:
φ(x, y) = φ (x) · φ (y)
ψh(x, y) = φ (x) · ψ (y)
ψv(x, y) = ψ (x) · φ (y) (2)
ψd(x, y) = ψ (x) · ψ (y)
where symbols h, v, d in (2) stand for horizontal, vertical and diagonal direc-tions, respectively. The atoms capture image features in the correspondingdirections.
Sao Paulo J.Math.Sci. 8, 2 (2014), 265–284

270 S. Jeon, O. Nicolis and B. Vidakovic
3.2. The complex scale-mixing 2-D wavelet transform. The dis-crete complex wavelet transform (DCWT) can be considered as a complex-valued extension of the standard discrete wavelet transform (DWT). It usescomplex-valued filtering (analytic filter) for transforming the real/complexsignals. Complex wavelet coefficients can be computed by Mallat’s algo-rithm (Mallat, 1998; Morettin, 1997)
cj−1,l =∑k
h∗k−2lcj,k (3)
anddj−1,l =
∑k
g∗k−2lcj,k (4)
where h is as in (1) and g is the quadrature mirror filter. The ∗ denotesthe complex conjugate.
Conversely, the reconstruction is given by
cj,k =∑l
cj−1,lhk−2l +∑l
dj−1,lgk−2l. (5)
Moreover, the real and imaginary coefficients are used to compute the mod-ulus and phase information. The wavelet coefficients can be written as
dj,k = Re(dj,k) + i · Im(dj,k)
with magnitude
|dj,k| =√Re(dj,k)2 + Im(dj,k)2
and phase
∠dj,k = arctan
(Im(dj,k)
Re(dj,k)
)when |Re(dj,k)| > 0.
There are many versions of the 2-D wavelet transforms which lead todifferent tessellations, or tilings (Ramırez-Cobo et al., 2011). Here we definethe complex wavelet atoms as follows
φ(j1,j2),k(x) = 2(j1+j2)/2 φ(2j1x− k1, 2j2y − k2) (6)
ψδ,(j1,j2),k(x) = 2(j1+j2)/2 ψδ(2j1x− k1, 2j2y − k2), (7)
Sao Paulo J.Math.Sci. 8, 2 (2014), 265–284
Mammogram Diagnostics via 2-D Complex Wavelet-based Self-similarity Measures 271
where δ is one of directions h, v, or d, and (j1, j2) ∈ Z2. Then, any functionf ∈ L2(R2) can be represented as
f(x) =∑k
c(J0,J0),k φ(J0,J0),k(x)
+∑j>J0
∑k
d(J0,j),k ψh,(J0,j),k(x)
+∑j>J0
∑k
d(j,J0),k ψv,(j,J0),k(x)
+∑
j1,j2>J0
∑k
d(j1,j2),k ψd,(j1,j2),k(x),
and a 2-D wavelet transform, which we call the scale-mixing wavelet trans-form is obtained. The motivation for the name scale-mixing is obvious.Unlike the atoms in the traditional 2-D wavelet transform, the scale-mixingatoms mix the scale indices thus capturing the “energy flux” between thescales.
The scale-mixing detail coefficients are defined as
d(J0,j),k = 2(J0+j)/2∫f(x) ψ∗h(2J0x− k1, 2jy − k2) dx dy,
d(j,J0),k = 2(j+J0)/2∫f(x) ψ∗v(2
jx− k1, 2J0y − k2) dx dy,
d(j1,j2),k = 2(j1+j2)/2∫f(x) ψ∗d(2
j1x− k1, 2j2y − k2) dx dy, (8)
where ψ∗ is a complex conjugate of ψ. Note that (j1, j2) in (6) and (7) canbe indexed as (j1, j1 + s) with s ∈ Z.
Similar to the traditional one- and two-dimensional cases, the complexscale-mixing detail coefficients are linked to the original image (2-D signal)through a matrix equation. Suppose that a 2n × 2n image (matrix) A isto be transformed into the wavelet domain. The complex wavelet matrixW is first composed by the complex scaling and wavelet filter coefficientshk and gk as in Vidakovic (1999). Note that the wavelet filter is given bygk = (−1)kh∗1+N−k and N is a shift parameter which affects the locationof the wavelet. Then the rows of A are transformed by a one-dimensionaltransform given by the wavelet matrix W , resulting in WA†. The same isrepeated on the rows of WA†. The result is
B = W (WA†)† = WAW †, (9)
the scale-mixing wavelet transform of matrix A, which will be the basis fordefining the scale-mixing spectra. Here C† denotes Hermitian transpose
Sao Paulo J.Math.Sci. 8, 2 (2014), 265–284
272 S. Jeon, O. Nicolis and B. Vidakovic
50 100 150 200 250
50
100
150
200
250
50 100 150 200 250
50
100
150
200
250
(a) (b)
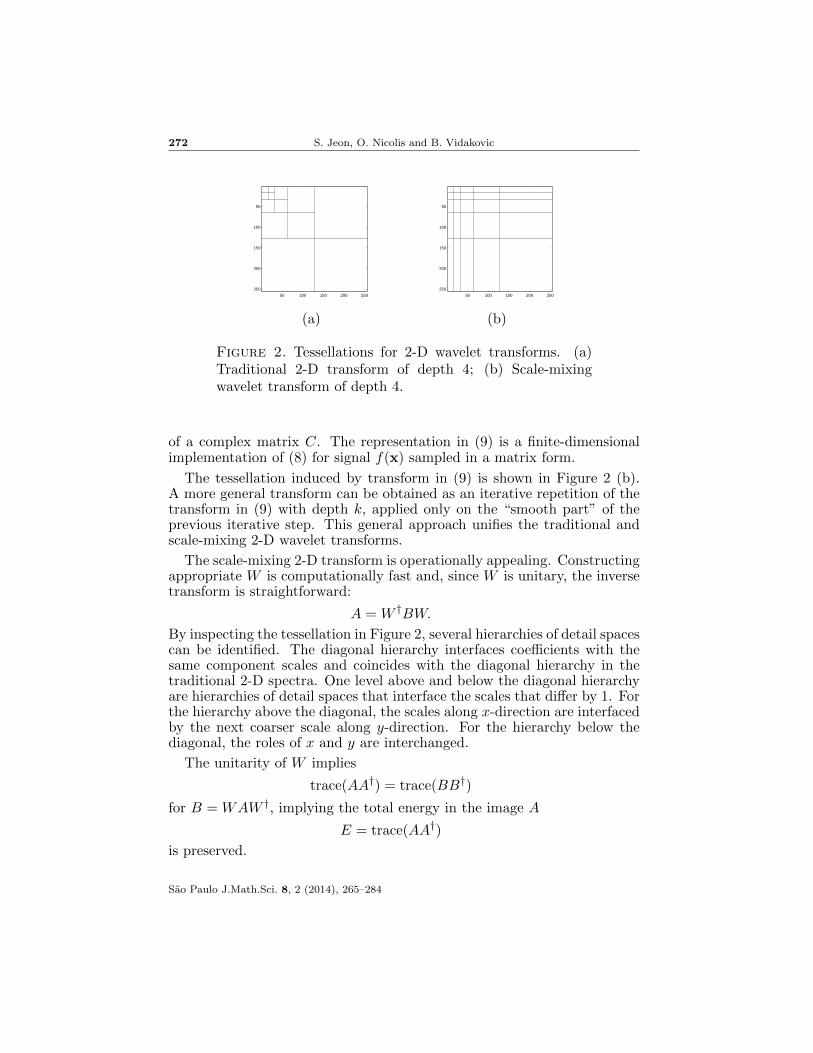
Figure 2. Tessellations for 2-D wavelet transforms. (a)Traditional 2-D transform of depth 4; (b) Scale-mixingwavelet transform of depth 4.
of a complex matrix C. The representation in (9) is a finite-dimensionalimplementation of (8) for signal f(x) sampled in a matrix form.
The tessellation induced by transform in (9) is shown in Figure 2 (b).A more general transform can be obtained as an iterative repetition of thetransform in (9) with depth k, applied only on the “smooth part” of theprevious iterative step. This general approach unifies the traditional andscale-mixing 2-D wavelet transforms.
The scale-mixing 2-D transform is operationally appealing. Constructingappropriate W is computationally fast and, since W is unitary, the inversetransform is straightforward:
A = W †BW.
By inspecting the tessellation in Figure 2, several hierarchies of detail spacescan be identified. The diagonal hierarchy interfaces coefficients with thesame component scales and coincides with the diagonal hierarchy in thetraditional 2-D spectra. One level above and below the diagonal hierarchyare hierarchies of detail spaces that interface the scales that differ by 1. Forthe hierarchy above the diagonal, the scales along x-direction are interfacedby the next coarser scale along y-direction. For the hierarchy below thediagonal, the roles of x and y are interchanged.
The unitarity of W implies
trace(AA†) = trace(BB†)
for B = WAW †, implying the total energy in the image A
E = trace(AA†)
is preserved.
Sao Paulo J.Math.Sci. 8, 2 (2014), 265–284
Mammogram Diagnostics via 2-D Complex Wavelet-based Self-similarity Measures 273
50
100
150150
200
25050 100 150 200 250
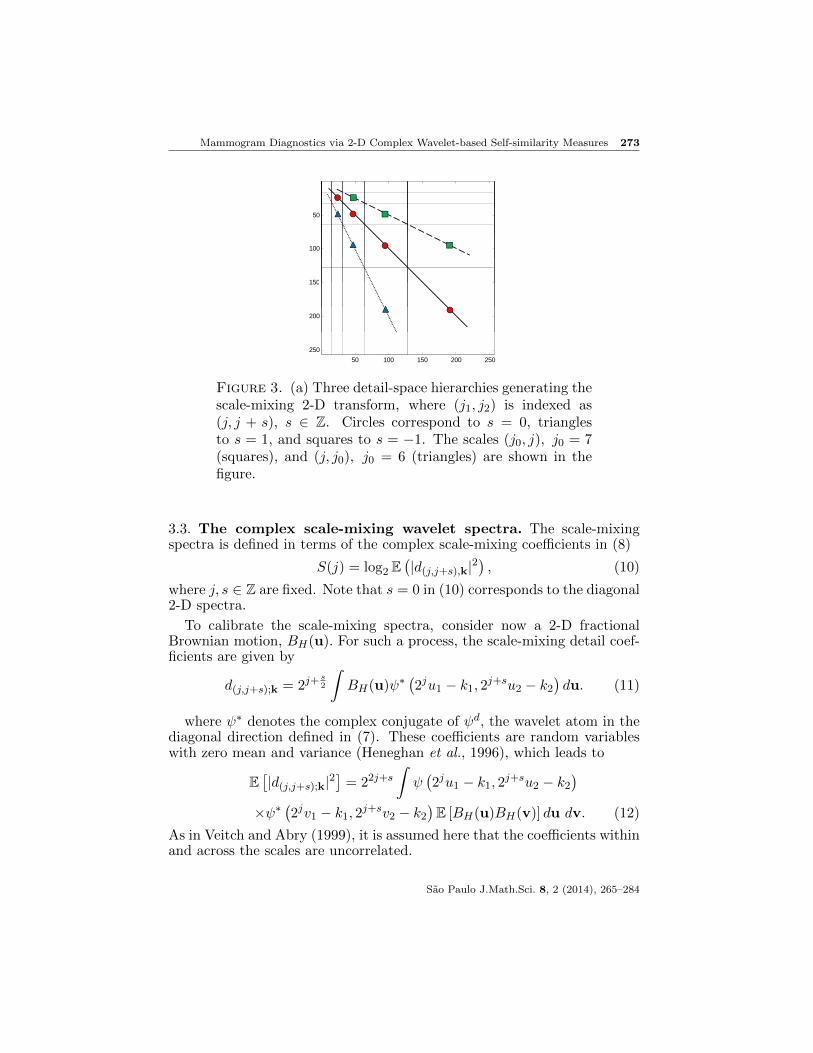
Figure 3. (a) Three detail-space hierarchies generating thescale-mixing 2-D transform, where (j1, j2) is indexed as(j, j + s), s ∈ Z. Circles correspond to s = 0, trianglesto s = 1, and squares to s = −1. The scales (j0, j), j0 = 7(squares), and (j, j0), j0 = 6 (triangles) are shown in thefigure.
3.3. The complex scale-mixing wavelet spectra. The scale-mixingspectra is defined in terms of the complex scale-mixing coefficients in (8)
S(j) = log2 E(|d(j,j+s),k|2
), (10)
where j, s ∈ Z are fixed. Note that s = 0 in (10) corresponds to the diagonal2-D spectra.
To calibrate the scale-mixing spectra, consider now a 2-D fractionalBrownian motion, BH(u). For such a process, the scale-mixing detail coef-ficients are given by
d(j,j+s);k = 2j+s2
∫BH(u)ψ∗
(2ju1 − k1, 2j+su2 − k2
)du. (11)
where ψ∗ denotes the complex conjugate of ψd, the wavelet atom in thediagonal direction defined in (7). These coefficients are random variableswith zero mean and variance (Heneghan et al., 1996), which leads to
E[|d(j,j+s);k|2
]= 22j+s
∫ψ(2ju1 − k1, 2j+su2 − k2
)×ψ∗
(2jv1 − k1, 2j+sv2 − k2
)E [BH(u)BH(v)] du dv. (12)
As in Veitch and Abry (1999), it is assumed here that the coefficients withinand across the scales are uncorrelated.
Sao Paulo J.Math.Sci. 8, 2 (2014), 265–284
274 S. Jeon, O. Nicolis and B. Vidakovic
From (12), it can be shown that
E[|d(j,j+s);k|2
]= 2−j(2H+2) Vψ,s(H), (13)
where Vψ,s(H) is an expression depending on ψ, H and s, but not on thescale j,
Vψ,s(H) = −σ2H2
∫ ∫ψ(p + q) ψ∗(q) |ps|2H2−s dp dq. (14)
A proof of (13) is provided in the Appendix. By taking logarithms in (13)
log2 E[|d(j,j+s);k|2
]= −(2H + 2)j + log2 Vψ,s(H) (15)
for j ∈ Z, the Hurst exponent can be estimated from the slope of the linearequation (15). Finally, the empirical counterpart of (15) is a regressiondefined on pairs j, log2
1
n
∑j,j+s
∣∣d(j,j+s),k∣∣2 , j, s ∈ Z. (16)
The slope of the regression would estimate the Hurst exponent, i.e., H =−(slope + 2)/2. Instead of the sample mean in (16), different locationmeasures could be used, such as the median.
Although (16) is traditionally fitted by the ordinary least squares (OLS)regression, the level-wise variance of wavelet coefficients is not constant.Therefore one can improve the estimator by using more robust approachthat accounts for the heteroscedasticity. Veitch and Abry (1999) usedweighted linear regression to improve the estimator. This method weightseach level by the inverse of the variance of that level. Hamilton et al.(2011) proposed estimation methods that are based on the Theil regres-sion, that is, a weighted average of all pairwise slopes sij between levelsi and j. Given a weight wij , the estimator of the overall slope in (16)is then
∑i,j wijsij/
∑i,j wij . Different types of weights are proposed, from
which we obtain more robust estimation methods. For example, one can useharmonic average weighted slope which is theoretically optimal, or level-enhanced weights that favor slopes from finer levels. In this paper weadopted robust estimators proposed in the literature along with the OLSregression based estimator to perform more comprehensive comparison.
3.4. The complex phase information. It is known that phase and spec-trum are intertwined in a nontrivial way to describe the data. While phasesencode most of the coherent (in space and scale) structure of the image,the spectrum mostly encode the strength of local information that could becorrupted with noise (Clonda et al., 2004). For this reason phase informa-tion have been used in edge detection and in the reconstruction of images.
Sao Paulo J.Math.Sci. 8, 2 (2014), 265–284
Mammogram Diagnostics via 2-D Complex Wavelet-based Self-similarity Measures 275
A classical illustration is given in Oppenheim and Lim (1981) where theimage reconstruction is more driven by the phase of the Fourier transformrather than by the magnitude.
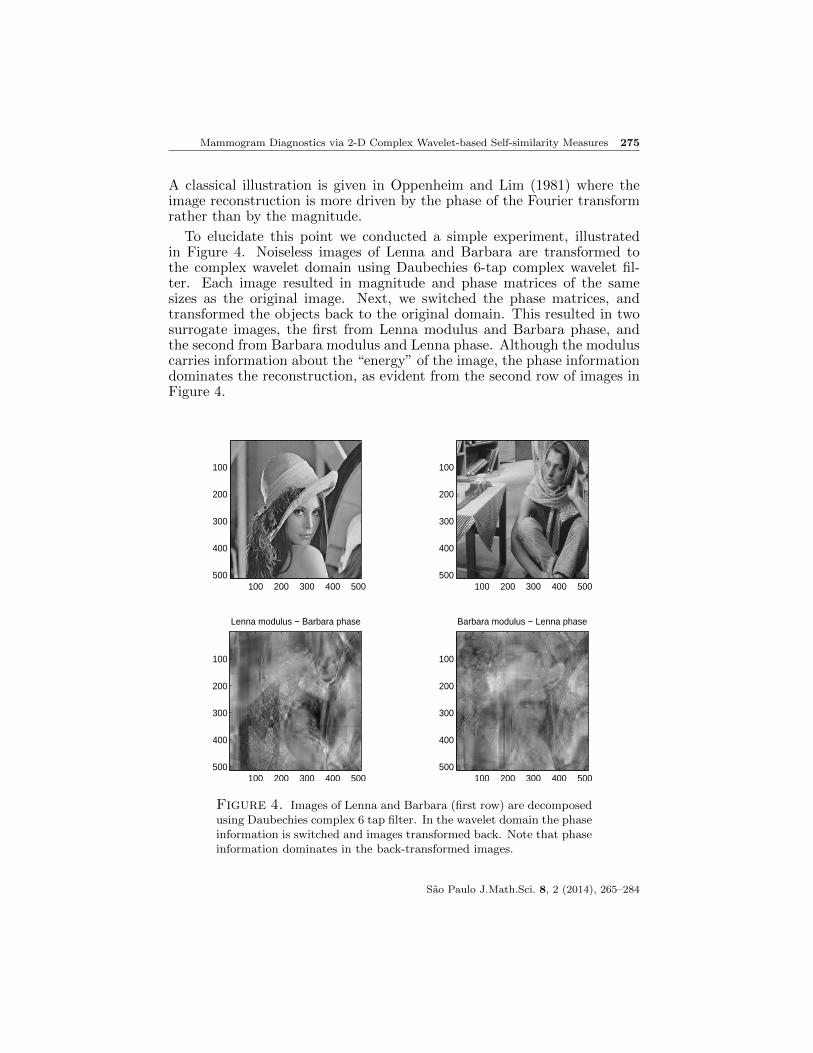
To elucidate this point we conducted a simple experiment, illustratedin Figure 4. Noiseless images of Lenna and Barbara are transformed tothe complex wavelet domain using Daubechies 6-tap complex wavelet fil-ter. Each image resulted in magnitude and phase matrices of the samesizes as the original image. Next, we switched the phase matrices, andtransformed the objects back to the original domain. This resulted in twosurrogate images, the first from Lenna modulus and Barbara phase, andthe second from Barbara modulus and Lenna phase. Although the moduluscarries information about the “energy” of the image, the phase informationdominates the reconstruction, as evident from the second row of images inFigure 4.
100 200 300 400 500
100
200
300
400
500100 200 300 400 500
100
200
300
400
500
Lenna modulus − Barbara phase
100 200 300 400 500
100
200
300
400
500
Barbara modulus − Lenna phase
100 200 300 400 500
100
200
300
400
500
Figure 4. Images of Lenna and Barbara (first row) are decomposedusing Daubechies complex 6 tap filter. In the wavelet domain the phaseinformation is switched and images transformed back. Note that phaseinformation dominates in the back-transformed images.
Sao Paulo J.Math.Sci. 8, 2 (2014), 265–284
276 S. Jeon, O. Nicolis and B. Vidakovic
Recently, many research studies have focused on using phase informa-tion from the complex wavelet transforms (Anderson et al., 2005; Hua andOrchard, 2008; Miller and Kingsbury, 2008; Rakvongthai and Oraintara,2008; Remenyi et al., 2014). In the wavelet domain the phase of a coef-ficient near an isolated feature varies linearly with its distance from thefeature. Despite of the numerous literatures focused on the usage of phasein detecting edges and the feature orientations, the discriminatory powerof phase in the complex wavelet domain has not yet been systematicallystudied.
In contrast to magnitudes of complex wavelet coefficients, their phasesdo not exhibit any scaling property. However, some summary statisticsof the phases turn out to be discriminatory. In the following section, wedemonstrate how the phase information could be used as a classificationmodality.
4. Mammogram Classification
In this section we illustrate how the complex wavelet-based spectra andthe phase information can be used to classify digitized mammograms. Wedemonstrate that the spectra slope and phase, as descriptors of digitizedimages, have good discriminatory power. It is straightforward to implementthe described analysis in various scientific areas in which 2-D data areinstrumental, such as geoscience or industrial applications.
For every sub-image of size 1024 × 1024, we performed discrete real-valued wavelet transform (DWT) and discrete complex wavelet transform(DCWT) using Daubechies 6 tap filter. After each transform, we esti-mated the slope of wavelet spectra using traditional ordinary least squaresregression (OLS) along with three robust estimation methods describedin Section 3.3. The robust estimation approaches include Abry-Veitchweighted regression (AV), level enhanced OLS (EOLS) and harmonic aver-age weighted slopes (HA). For more details on these robust estimators, werefer the readers to Veitch and Abry (1999); Hamilton et al. (2011). Notethat the wavelet spectra slope is used as a predictor instead of the Hurstexponent. It is because the estimated Hurst exponent H is empirical, andthe slowly decaying spectra (with slope > −2) caused by the presence ofcolored noise, could render H to be negative.
For each classification method, we randomly selected 67% of the data asa training set to fit the classifier and used the remaining 33% of the data totest performance. The random selection of training and testing sets was re-peated 10,000 times, so the reported prediction measures are averaged over10,000 runs. Performance was compared in terms of sensitivity, specificity,and overall correct classification rate.
Sao Paulo J.Math.Sci. 8, 2 (2014), 265–284
Mammogram Diagnostics via 2-D Complex Wavelet-based Self-similarity Measures 277
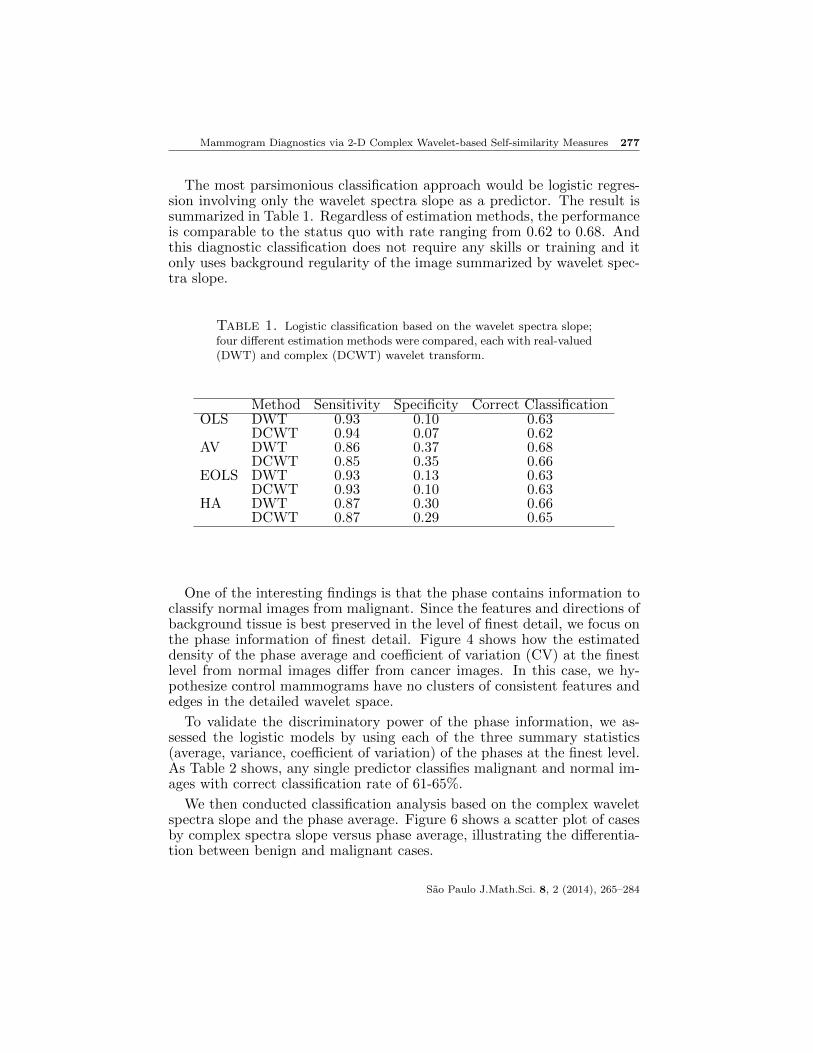
The most parsimonious classification approach would be logistic regres-sion involving only the wavelet spectra slope as a predictor. The result issummarized in Table 1. Regardless of estimation methods, the performanceis comparable to the status quo with rate ranging from 0.62 to 0.68. Andthis diagnostic classification does not require any skills or training and itonly uses background regularity of the image summarized by wavelet spec-tra slope.
Table 1. Logistic classification based on the wavelet spectra slope;four different estimation methods were compared, each with real-valued(DWT) and complex (DCWT) wavelet transform.
Method Sensitivity Specificity Correct ClassificationOLS DWT 0.93 0.10 0.63
DCWT 0.94 0.07 0.62AV DWT 0.86 0.37 0.68
DCWT 0.85 0.35 0.66EOLS DWT 0.93 0.13 0.63
DCWT 0.93 0.10 0.63HA DWT 0.87 0.30 0.66
DCWT 0.87 0.29 0.65
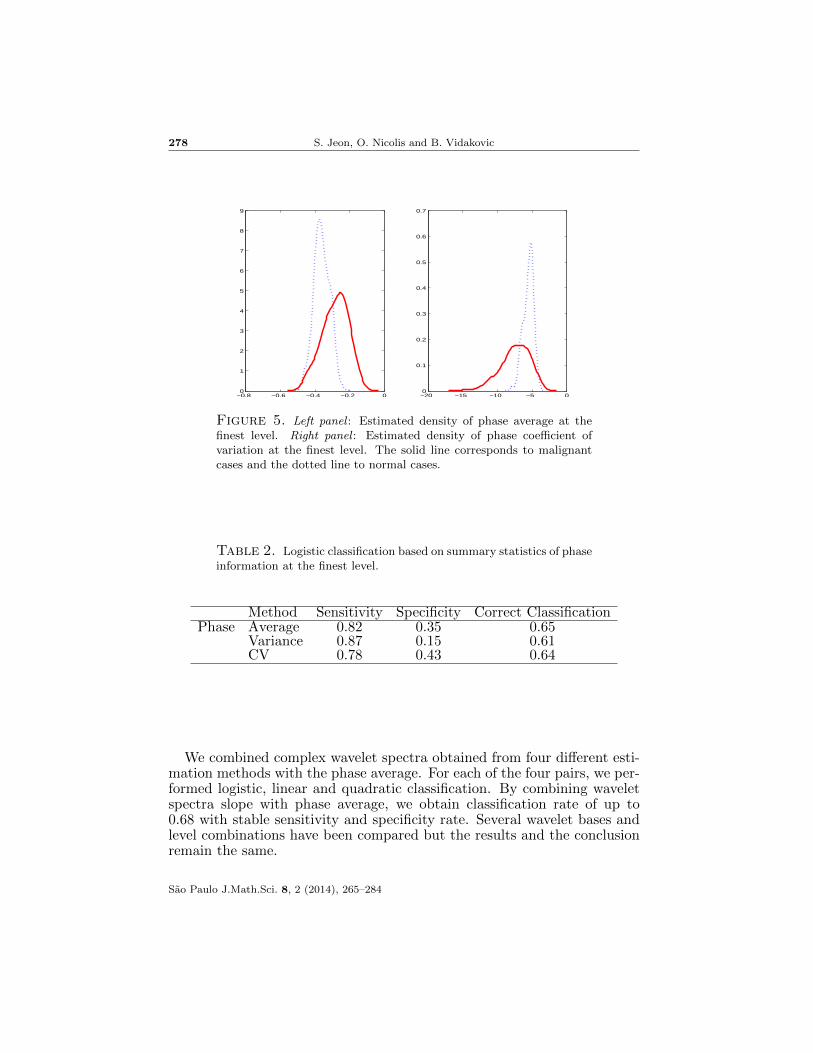
One of the interesting findings is that the phase contains information toclassify normal images from malignant. Since the features and directions ofbackground tissue is best preserved in the level of finest detail, we focus onthe phase information of finest detail. Figure 4 shows how the estimateddensity of the phase average and coefficient of variation (CV) at the finestlevel from normal images differ from cancer images. In this case, we hy-pothesize control mammograms have no clusters of consistent features andedges in the detailed wavelet space.
To validate the discriminatory power of the phase information, we as-sessed the logistic models by using each of the three summary statistics(average, variance, coefficient of variation) of the phases at the finest level.As Table 2 shows, any single predictor classifies malignant and normal im-ages with correct classification rate of 61-65%.
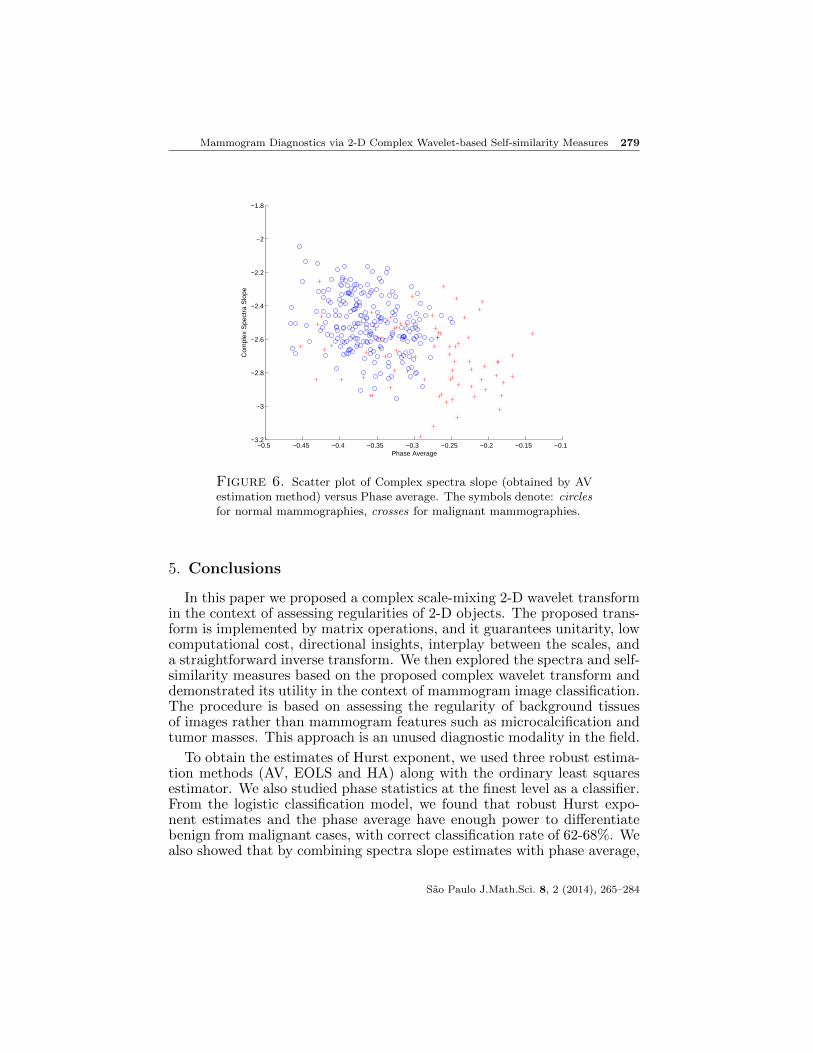
We then conducted classification analysis based on the complex waveletspectra slope and the phase average. Figure 6 shows a scatter plot of casesby complex spectra slope versus phase average, illustrating the differentia-tion between benign and malignant cases.
Sao Paulo J.Math.Sci. 8, 2 (2014), 265–284
278 S. Jeon, O. Nicolis and B. Vidakovic
−0.8 −0.6 −0.4 −0.2 00
1
2
3
4
5
6
7
8
9
−20 −15 −10 −5 00
0.1
0.2
0.3
0.4
0.5
0.6
0.7
Figure 5. Left panel : Estimated density of phase average at thefinest level. Right panel : Estimated density of phase coefficient ofvariation at the finest level. The solid line corresponds to malignantcases and the dotted line to normal cases.
Table 2. Logistic classification based on summary statistics of phaseinformation at the finest level.
Method Sensitivity Specificity Correct ClassificationPhase Average 0.82 0.35 0.65
Variance 0.87 0.15 0.61CV 0.78 0.43 0.64
We combined complex wavelet spectra obtained from four different esti-mation methods with the phase average. For each of the four pairs, we per-formed logistic, linear and quadratic classification. By combining waveletspectra slope with phase average, we obtain classification rate of up to0.68 with stable sensitivity and specificity rate. Several wavelet bases andlevel combinations have been compared but the results and the conclusionremain the same.
Sao Paulo J.Math.Sci. 8, 2 (2014), 265–284
Mammogram Diagnostics via 2-D Complex Wavelet-based Self-similarity Measures 279
−0.5 −0.45 −0.4 −0.35 −0.3 −0.25 −0.2 −0.15 −0.1−3.2
−3
−2.8
−2.6
−2.4
−2.2
−2
−1.8
Phase Average
Com
plex
Spe
ctra
Slo
pe
Figure 6. Scatter plot of Complex spectra slope (obtained by AVestimation method) versus Phase average. The symbols denote: circlesfor normal mammographies, crosses for malignant mammographies.
5. Conclusions
In this paper we proposed a complex scale-mixing 2-D wavelet transformin the context of assessing regularities of 2-D objects. The proposed trans-form is implemented by matrix operations, and it guarantees unitarity, lowcomputational cost, directional insights, interplay between the scales, anda straightforward inverse transform. We then explored the spectra and self-similarity measures based on the proposed complex wavelet transform anddemonstrated its utility in the context of mammogram image classification.The procedure is based on assessing the regularity of background tissuesof images rather than mammogram features such as microcalcification andtumor masses. This approach is an unused diagnostic modality in the field.
To obtain the estimates of Hurst exponent, we used three robust estima-tion methods (AV, EOLS and HA) along with the ordinary least squaresestimator. We also studied phase statistics at the finest level as a classifier.From the logistic classification model, we found that robust Hurst expo-nent estimates and the phase average have enough power to differentiatebenign from malignant cases, with correct classification rate of 62-68%. Wealso showed that by combining spectra slope estimates with phase average,
Sao Paulo J.Math.Sci. 8, 2 (2014), 265–284

280 S. Jeon, O. Nicolis and B. Vidakovic
Table 3. Logistic, Linear and Quadratic classification based on thepair of complex wavelet spectra and the phase average.
CorrectMethod Sensitivity Specificity Classification
(OLS; phase average) Logistic 0.83 0.35 0.65Linear 0.59 0.58 0.58Quadratic 0.58 0.73 0.62
(AV; phase average) Logistic 0.82 0.43 0.67Linear 0.59 0.68 0.62Quadratic 0.65 0.76 0.68
(EOLS; phase average) Logistic 0.83 0.36 0.65Linear 0.59 0.58 0.59Quadratic 0.59 0.73 0.63
(HA; phase average) Logistic 0.83 0.40 0.67Linear 0.60 0.63 0.61Quadratic 0.64 0.73 0.66
we obtained high classification rate with stable sensitivity and specificity.Therefore, complex wavelet transform greatly appeals to investigators seek-ing more robust and reliable classification method for various applicationarea.
It is well known that for the real wavelets there is no symmetric and com-pactly supported scaling function defining an orthogonal MRA. Complexwavelets assure symmetry, compact support and orthogonality (that is uni-tarity) of decomposing atoms which is desirable in image representations.Since complex wavelets provide the only compactly supported and symmet-ric basis which are unitary, it better represents the image than real-valuedwavelet transform. By using proposed method, complex wavelet transformscan be readily performed and applied to various domains to summarize,classify or interpret highly complex data.
Sao Paulo J.Math.Sci. 8, 2 (2014), 265–284
Mammogram Diagnostics via 2-D Complex Wavelet-based Self-similarity Measures 281
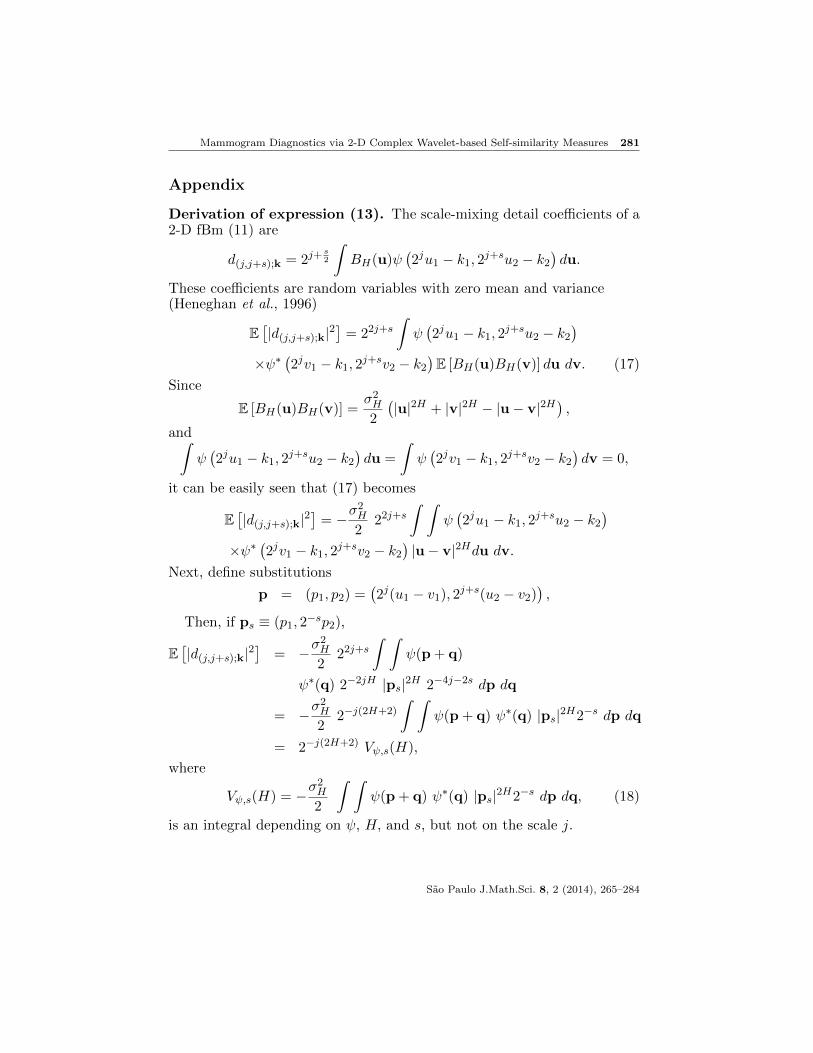
Appendix
Derivation of expression (13). The scale-mixing detail coefficients of a2-D fBm (11) are
d(j,j+s);k = 2j+s2
∫BH(u)ψ
(2ju1 − k1, 2j+su2 − k2
)du.
These coefficients are random variables with zero mean and variance(Heneghan et al., 1996)
E[|d(j,j+s);k|2
]= 22j+s
∫ψ(2ju1 − k1, 2j+su2 − k2
)×ψ∗
(2jv1 − k1, 2j+sv2 − k2
)E [BH(u)BH(v)] du dv. (17)
Since
E [BH(u)BH(v)] =σ2H2
(|u|2H + |v|2H − |u− v|2H
),
and∫ψ(2ju1 − k1, 2j+su2 − k2
)du =
∫ψ(2jv1 − k1, 2j+sv2 − k2
)dv = 0,
it can be easily seen that (17) becomes
E[|d(j,j+s);k|2
]= −
σ2H2
22j+s∫ ∫
ψ(2ju1 − k1, 2j+su2 − k2
)×ψ∗
(2jv1 − k1, 2j+sv2 − k2
)|u− v|2Hdu dv.
Next, define substitutions
p = (p1, p2) =(2j(u1 − v1), 2j+s(u2 − v2)
),
Then, if ps ≡ (p1, 2−sp2),
E[|d(j,j+s);k|2
]= −
σ2H2
22j+s∫ ∫
ψ(p + q)
ψ∗(q) 2−2jH |ps|2H 2−4j−2s dp dq
= −σ2H2
2−j(2H+2)
∫ ∫ψ(p + q) ψ∗(q) |ps|2H2−s dp dq
= 2−j(2H+2) Vψ,s(H),
where
Vψ,s(H) = −σ2H2
∫ ∫ψ(p + q) ψ∗(q) |ps|2H2−s dp dq, (18)
is an integral depending on ψ, H, and s, but not on the scale j.
Sao Paulo J.Math.Sci. 8, 2 (2014), 265–284

282 S. Jeon, O. Nicolis and B. Vidakovic
References
Achim, A. and Kuruoglu, E. (2005). Image denoising using bivariate α-stable distributions in the complex wavelet domain. IEEE Signal Pro-cessing Letters, 12, 17–20.
Altekruse, S., Kosary, C., Krapcho, M., Neyman, N., Aminou, R., andWaldron, W. (2010). Seer cancer statistics review: 1975-2007.
Anderson, R., Kingsbury, N., and Fauqueur, J. (2005). Determining mul-tiscale image feature angles from complex wavelet phases. Internationalconference on Image processing (ICIP), Toronto, Canada, September 28-30.
Clonda, D., Lina, J.-M., and Goulard, B. (2004). Complex daubechieswavelets: properties and statistical image modelling. Signal Processing,84, 1–23.
Daubechies, I. (1992). Ten Lectures on Wavelets. Number 61 in CBMS-NSFSeries in Applied Mathematics. SIAM, Philadelphia.
El-Naqa, I., Yang, Y., Wernick, M., Galatsanos, N., and Nishikawa, R.(2002). A support vector machine approach for detection of microcalci-fications. IEEE Transactions on medical imaging, 21(12), 1552–1563.
Gao, R. and Yan, R. (2010). Wavelets: Theory and Applications for Man-ufacturing. Springer.
Hamilton, E. K., Jeon, S., Cobo, P. R., Lee, K. S., and Vidakovic, B. (2011).Diagnostic classification of digital mammograms by wavelet-based spec-tral tools: A comparative study. The Proceedings of the 2011 IEEE Inter-national Conference on Bioinformatics and Biomedicine, pages 384–389.
Heath, M., Bowyer, K., Kopans, D., Moore, R., and Kegelmeyer, P. (2000).The digital database for screening mammography. The Proceedings of the5th International Workshop on Digital Mammography, Toronto, Canada,Medical Physics Publishing (Madison, WI).
Heneghan, C., Lown, S., and Teich, M. (1996). Two dimensional frac-tional Brownian motion: Wavelet analysis and synthesis. Image analysisand interpretation, proceedings of the IEEE Southwest Symposium, pages213–217.
Hua, G. and Orchard, M. T. (2008). Image reconstruction from the phase ormagnitude of its complex wavelet transform. Proceedings of the IEEE In-ternational Conference on Acoustics, Speech and Signal Processing, pages3261–3264.
Kestener, P., Lina, J., Saint-Jean, P., and Arneodo, A. (2001). Wavelet-based multifractal formalism to assist in diagnosis in digitized mammo-grams. Image analysis and stereology, 20(3), 169–175.
Kim, S., Wang, Z., Oraintarac, S., Temiyasathita, C., and Wongsawatc, Y.(2008). Feature selection and classification of high-resolution nmr spectrain the complex wavelet transform domain. Chemometrics and IntelligentLaboratory Systems, 90, 161–168.
Sao Paulo J.Math.Sci. 8, 2 (2014), 265–284
REFERENCES 283
Lawton, W. (1993). Applications of complex valued wavelet transforms tosubband decomposition. IEEE Transactions on Signal Processing, 41,3566–3568.
Lina, J.-M. and Mayrand, M. (1995). Complex daubechies wavelets. Appliedand Computational Harmonic Analysis, 2, 219–229.
Magarey, J. and Kingsbury, N. (1998). Motion estimation using a complex-valued wavelet transform. IEEE Transactions on Signal Processing, 46,1069–1084.
Mallat, S. G. (1998). A Wavelet Tour of Signal Processing. AcademicPress, San Diego.
Miller, M. and Kingsbury, N. (2008). Image modeling using interscale phaseproperties of complex wavelet coefficients. IEEE Transactions on ImageProcessing, 17(9), 1491–1499.
Morettin, P. A. (1997). Wavelets in Statistics. 3rd International Conferenceon Statistical Data Analysis Based on L1 Norm and Related Methods.Neuchatel, Switzerland.
Netsch, T. and Peitgen, H. (1999). Scale-space signatures for the detectionof clustered microcalcifications in digital mammograms. IEEE Transac-tions on medical imaging, 18(9), 774–786.
Nicolis, O., Ramırez-Cobo, P., and Vidakovic, B. (2011). 2-D wavelet-basedspectra with applications. Computational Statistics and Data Analysis,55(1), 738–751.
Oestreicher, N., Lehman, C., Seger, D., Buist, D., and White, E. (2005).The incremental contribution of clinical breast examination to invasivecancer detection in a mammography screening program. American Jour-nal of Roentgenology, 184(2), 428–432.
Oppenheim, A. and Lim, J. (1981). The importance of phase in signals.The Proceedings of the IEEE, 69, 529–541.
Portilla, J. and Simoncelli, E. P. (2000). A parametric texture model basedon joint statistics of complex wavelet coefficients. International journalof computer vision, 40, 49–70.
Rakvongthai, Y. and Oraintara, S. (2008). On phase statistics of complexwavelet coefficients at edges. European Conference on Signal Processing,pages 2–6.
Ramırez-Cobo, P., Lee, K. S., Molini, A., Porporato, A., Katul, G., andVidakovic, B. (2011). A wavelet-based spectral method for extractingself-similarity measures in time-varying two-dimensional rainfall maps.Journal of Time Series Analysis, 32(4), 351–363.
Remenyi, N., Nicolis, O., Nason, G., and Vidakovic, B. (2014). Imagedenoising with 2-d scale-mixing complex wavelet transforms. To Appearin IEEE Transactions on Signal Processing.
Selesnick, I. W., Baraniuk, R. G., and Kingsbury, N. G. (2005). Thedual-tree complex wavelet transform. IEEE Signal Processing Magazine,
Sao Paulo J.Math.Sci. 8, 2 (2014), 265–284
284 References
22(6).Strang, G. and Nguyen, T. (1996). Wavelets and Filter Banks. Wellesley-
Cambridge Press, Wellesley, MA.Veitch, D. and Abry, P. (1999). A wavelet-based joint estimator of the pa-
rameters of long-range dependence. IEEE Transactions on InformationTheory, 45, 878–897.
Vidakovic, B. (1999). Statistical Modeling by Wavelets. John Wiley & Sons,Inc.
Wang, T. and Karayiannis, N. (1998). Detection of microcalcificationsin digital mammograms using wavelets. IEEE Transactions on medicalimaging, 17(4), 498–509.
Zhang, X.-P., Desai, M., and Peng, Y. (1999). Orthogonal complex filterbanks and wavelets: Some properties and design. IEEE Transactions onSignal Processing, 47(4), 1039–1048.
Sao Paulo J.Math.Sci. 8, 2 (2014), 265–284