Maintaining Water Quality from Reverse Osmosis Systems in ...
66
Maintaining Water Quality from Reverse Osmosis Systems in Advanced Treated Water Facilities Presented by James C. Vickers, PE [email protected] SPI (Separation Processes, Inc.) 3156 Lionshead Ave. Suite 2 Carlsbad, CA 92010 (760) 400-3660 August 22, 2018 Presentation for
Transcript of Maintaining Water Quality from Reverse Osmosis Systems in ...

Maintaining Water Quality from Reverse Osmosis
Systems in Advanced Treated Water Facilities
Presented by James C. Vickers, PE
SPI (Separation Processes, Inc.) 3156 Lionshead Ave. Suite 2
Carlsbad, CA 92010 (760) 400-3660
August 22, 2018
Presentation for

Acknowledgements for Use of Data Shown
Orange County Water District

Agenda
1. Introduction
2. Reverse Osmosis Basics
3. Reverse Osmosis Removal
4. Data Normalization
5. Monitoring RO Integrity
6. Pathogen Removal
7. Yucaipa Virus Testing Results
8. Summary

Introduction


Volumetric Representation of Scale
1
10
100
1,000
10,000
Comparative Sizes 3 microns = Cryptosporidium 0.2 microns = smallest bacteria 0.04 microns = virus 0.002 microns = TOC 0.001 microns = sulfate ion 0.0002 microns = sodium ion

What are the Basics Reverse Osmosis?
• Removes constituents in water including:
– Inorganic Ions (sodium, chloride, calcium, sulfate)
– Total Organic Carbon (TOC)
– Synthetic Organic Compounds (SOC)
– Unregulated Constituents of Emerging Concern (CEC) • Personal Care Products
• Pharmaceutical Compounds
• Endocrine disrupting compounds
• RO permeate is essentially free of most contaminants of regulatory concern with the exception of:
– Nitrosamines (NDMA)
– 1,4-dioxane

GWRS Reverse Osmosis Removal Performance (Trains A-E)

GWRS Train E Percent Removal 2007-2017 (Raw Data)
Membrane Change
Membrane Cleaning

RO Basics

• RO membranes are non-porous. – Thin-Film Composite Membrane
– Membrane is coated on the surface of a Polysulfone UF Membrane
– Underlying non-woven support layer
• Thickness and Evenness of Membrane layer are important
• Pin holes are defects.
• Sealing of the membrane has improved over the years.
• Oxidants and improper cleaning can destroy the membrane
RO Membranes
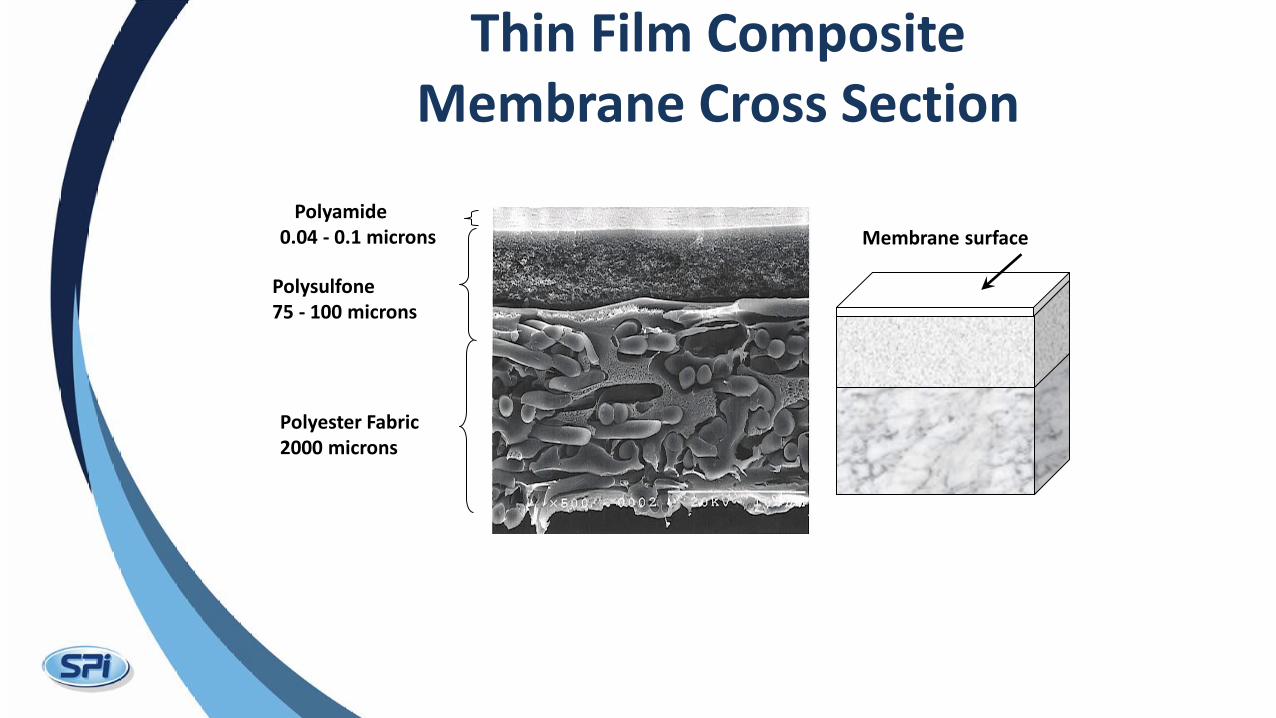
Thin Film Composite Membrane Cross Section
Polysulfone 75 - 100 microns
Polyester Fabric 2000 microns
Polyamide 0.04 - 0.1 microns Membrane surface

Reverse Osmosis Theory and Principals
• Water and Salt pass through interstitial (molecular) spaces
• Solution-Diffusion Model is most commonly used
• Water Flow is controlled by the Net Driving Pressure (NDP) • NDP is the Average Pressure Differential
minus the Osmotic Pressure
• Salt Flow is controlled by diffusion • Concentration Difference across the
membrane.

Feed
Flow
Na+
H2O
H2O
H2O
Cl-
H2O
H2O
Cl-
H2O
H2O
H2O
Na+
H2O
Na+
Concentrated
Salts
Permeate
SO4
2-
Cl- H2O
Ca
2+
HCO3
-
RO Removal Mechanism = Solution-Diffusion

Practical Points about Reverse Osmosis
• Membrane Performance is local to the element under consideration.
• Osmotic pressure can be viewed as a threshold pressure that must be overcome to obtain flow.
• The flow of water through a membrane is a function of the localized net driving pressure
• The flow of salt through a membrane is a function of the localized concentration difference.
• The osmotic pressure increases as salts are retained, lowering the net driving pressure
• Increasing water temperature will decrease feed pressure and increase salt flow.
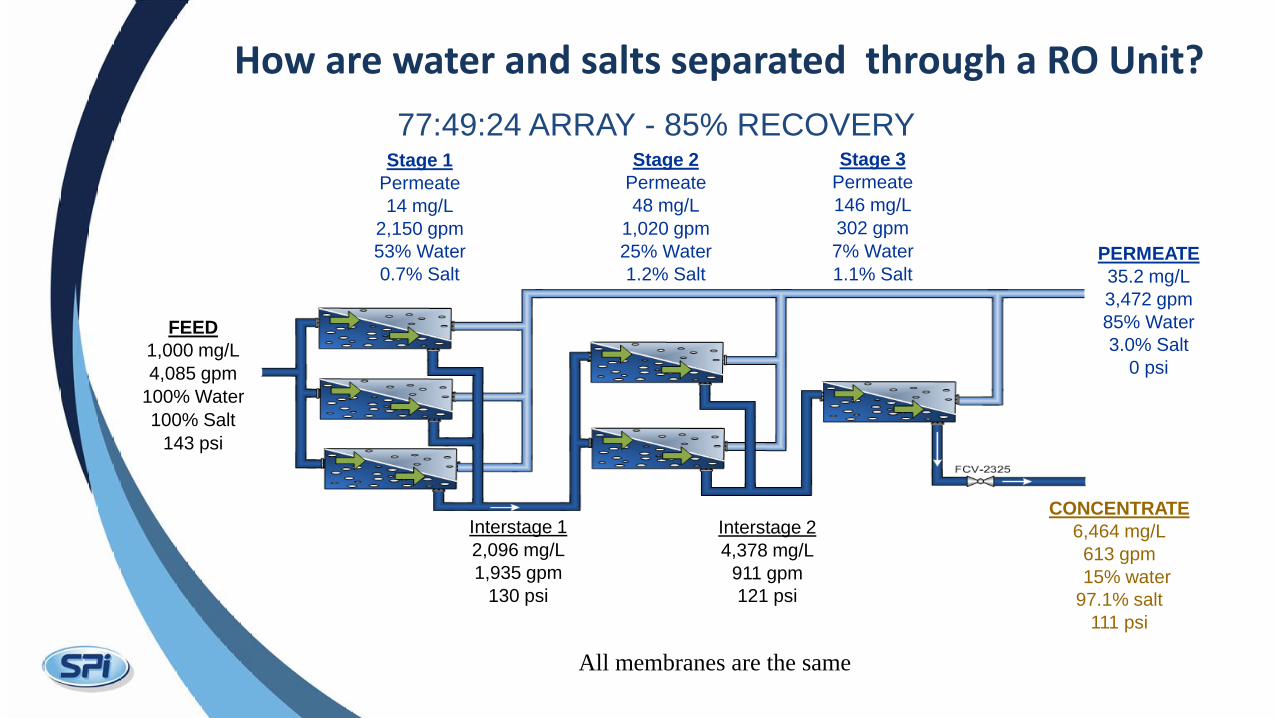
77:49:24 ARRAY - 85% RECOVERY
How are water and salts separated through a RO Unit?
FEED
1,000 mg/L
4,085 gpm
100% Water
100% Salt
143 psi
Stage 1
Permeate
14 mg/L
2,150 gpm
53% Water
0.7% Salt
Stage 2
Permeate
48 mg/L
1,020 gpm
25% Water
1.2% Salt
CONCENTRATE
6,464 mg/L
613 gpm
15% water
97.1% salt
111 psi
PERMEATE
35.2 mg/L
3,472 gpm
85% Water
3.0% Salt
0 psi
Stage 3
Permeate
146 mg/L
302 gpm
7% Water
1.1% Salt
Interstage 1
2,096 mg/L
1,935 gpm
130 psi
Interstage 2
4,378 mg/L
911 gpm
121 psi
All membranes are the same

RO Removal

where C
C
F
P
=
=
: Log Mean Average Conductivity of Feed/Brine (µS/cm)
Conductivity of Permeate (µS/cm)
Train/Unit Rejection (Feed to Permeate)
% Removal = 𝐶𝐹 − 𝐶𝑃
𝐶𝐹 𝑥 100%
Membrane Rejection (Avg. Feed to Permeate)
% Removal = 𝐶𝐹𝐵 − 𝐶𝑃
𝐶𝐹 𝑥 100%
where C
C
F
P
=
=
: Conductivity of Feed (µS/cm)
Conductivity of Permeate (µS/cm)

Removal of Constituents by RO
Feed mg/L Permeate mg/L % Rejection*
Ca2+ 93 0.01 100.0%
Mg 2+ 24.9 0.01 100.0%
Na+ 214 6.38 97.0%
NH4+ (as N) 30.2 1.24 95.9%
Cl- 236 3.64 98.5%
HCO3- 287.7 16.45 94.3%
SO42- 298.5 0.48 99.8%
TOC 11.1 0.18 98.4%
SiO2 23.7 0.10 99.6%
Total Nitrogen (as N) 33.5 1.53 95.4%
TDS 991 19.86 98.0%
100 TDS Feed
TDS Permeate-1 Rejection %
=
* System Rejection: 11gfd @ 85% Recovery

• Molecular Weight (size) • higher weight, higher removal
• Ionic Charge (valence) • Higher charge, higher removal
• Molecular Structure (shape) • Nitrogen Compounds have higher
diffusion (e.g. ammonium, (MW 17,+1), NDMA (MW 74)) and can “align” with polyamide membranes
• 1,4-dioxane (MW 88)
Chemical Constituent Factors that Effect Membrane Rejection
NDMA
1,4-Dioxane
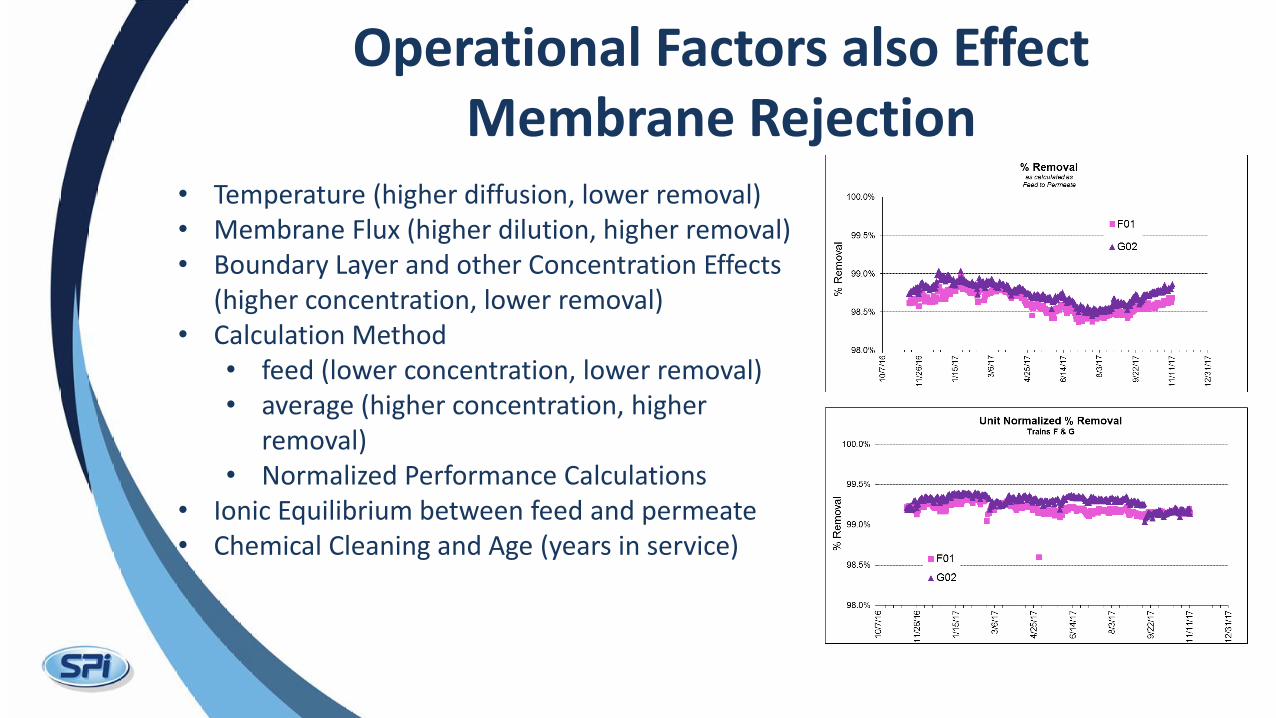
• Temperature (higher diffusion, lower removal) • Membrane Flux (higher dilution, higher removal) • Boundary Layer and other Concentration Effects
(higher concentration, lower removal) • Calculation Method
• feed (lower concentration, lower removal) • average (higher concentration, higher
removal) • Normalized Performance Calculations
• Ionic Equilibrium between feed and permeate • Chemical Cleaning and Age (years in service)
Operational Factors also Effect Membrane Rejection

• Membrane Test Conditions • 10,000 gpd = 25 gfd • Typical Design Flux is 12 gfd
• Test Data Normalization
• Average Feed Brine Concentration • Higher than Feed Concentration • Temperature Correction to 25
degrees C.
• Unit Staging
Why is my rejection less than the published values?

TDS Rejection West Basin MWD - Mobil Train 2
Membrane Rejection vs. System Rejection
90%
91%
92%
93%
94%
95%
96%
97%
98%
99%
100%
0 100 200 300 400 500 600 700 800 900 1000
Days in Operation
TD
S R
ejec
tion
Membrane Rejection
System Rejection

Data Normalization

Data Normalization
• Calculation of values that describe membrane performance at design conditions even when system is not operated at design conditions (flow, temperature, recovery, etc.)
• Allows the user to make an approximation of membrane performance despite changes in operating conditions to determine if the system performance is stable or developing problems
• Unit Specific – General Idea
• Stage Specific – Better for detailed analysis

Basics of Normalized Data
• Accounts for Multiple Variables of Interest – Feed Conductivity
– Temperature
– Flow
– Pressure
• Used as a tool to manage – Energy
– Cleaning
– Membrane Replacement
– Maintenance
• Monitor both Unit and Stage Performance – Specific Flux
– Normalized Differential Pressure
– Normalized Percent Removal
Percent Removal – Feed to Permeate

Why do we use Normalized Data?
• When Data is Normalized, variations are attenuated.
• Membrane Cleaning has a significant but temporary effect on removal.
• The duration is typically a week or so.
• Average Feed/Brine Conductivity – ASTM Standard
– higher removal than feed to permeate
Normalized Percent Removal - AFBC Method
Impact of Membrane Cleaning Becomes More Obvious

Normalized Percent Removal
% Normalized Removal = 𝐶𝐹𝐵𝑆 − 𝐶𝑃𝑁
𝐶𝐹𝐵𝑆 𝑥 100%
CFBS = AFBC Conductivity at Standard conditions (µS/cm)
CPN = Normalized Permeate Conductivity (µS/cm)

Monitoring RO Integrity

Compliance Monitoring & Reporting is beginning to approach the Drinking Water Standards • For IPR facilities,
– The percentage of time of non-compliance is determined
– Must be reported to the State
– Failure of greater than 10 percent requires corrective action.
• Operational Monitoring – SCADA Historians normally collect data at 1 to 5 minute intervals.
– SCADA Operational Data contains transitional /nuisance vents
• start up, shut and analyzer issues
• Compliance Monitoring (Key Elements) – Prepare the Compliance Report after the data is formatted in accordance with proceedure
– A time basis is established (15 min, 3 hour, daily)
– A singular event cannot be the basis of a compliance violation.
– Instrumentation used for regulatory compliance is designated
• verification and calibration protocols established

RO Permeate Water Quality is Very Stable
• Combined permeate conductivity is very low.
• Recent membrane replacement in 6 units lowered the overall system permeate conductivity.
• Conductivity removal is in the range of 97 to 98 percent.
• There are temperature effects.
GWRS – Combined Permeate
Membrane
Replacement

RO Membrane Issues and 12-10-10
• For IPR Facilities, meeting LRV 12-10-10 brings a new challenge to operations
• RO systems are being used to obtain LRV credit for virus, Giardia and Cryptosporidium. (e.g. 2-2-2)
• EC (Conductivity) and TOC are not the best indicators for microbial integrity
• There is an challenge with going above 3 log because of Membrane Filtration Guidance Manual precedence for Cryptosporidium Removal and the Direct Integrity Test Requirement.
Percent Removal – Feed to Permeate

Permeate Water TOC is Significantly less than 0.5 mg/L (BDL/BRL)
• Operationally, TOC is monitored sensitive equipment with a RDL of 0.05 mg/L.
• The lower range of the analyzer is 0.04 mg/L and is more accurate with lower conductivity water (35 µS/cm maximum).
• Technically this can a compliance issue
• Overall TOC removal is only slightly higher than 99 percent but approaches 99 percent (2 log) during summer.
GWRS – Combined Permeate TOC
Membrane
Replacement
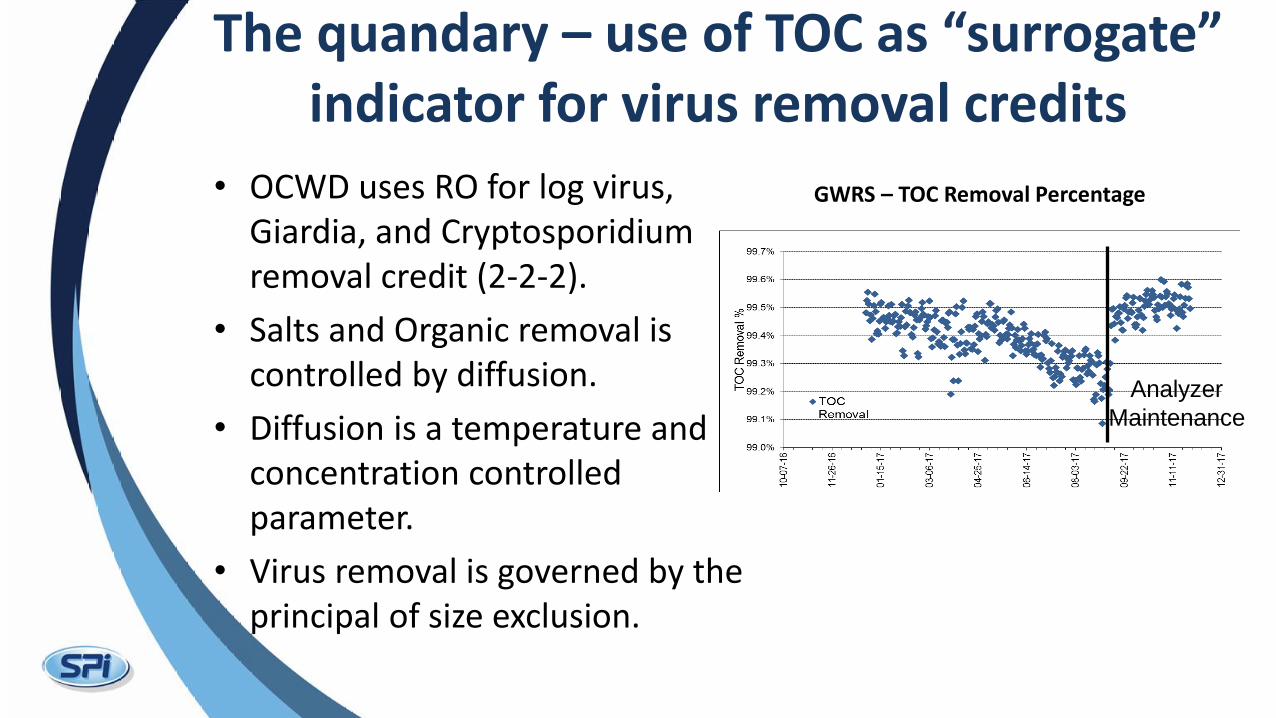
The quandary – use of TOC as “surrogate” indicator for virus removal credits
• OCWD uses RO for log virus, Giardia, and Cryptosporidium removal credit (2-2-2).
• Salts and Organic removal is controlled by diffusion.
• Diffusion is a temperature and concentration controlled parameter.
• Virus removal is governed by the principal of size exclusion.
Analyzer
Maintenance
GWRS – TOC Removal Percentage

Factors that Affect TOC Removal
• Amount of TOC in Feed Water – Secondary 12-16 mg/L
– Nitrified – 7 to 10 mg/L
– Nitrified/Denitrified 4-7 mg/L
• Ozonation Pretreatment to reduce MF Fouling creates smaller TOC fragments.
• The 0.25 mg/L (First 20 weeks) and 0.5 mg/L TOC requirements may pose challenges to facilities that use ozone or have low TOC.
GWRS – Combined Permeate TOC
Membrane
Replacement
Pathogen Removal

Feed
Flow
Na+
H2O
H2O
H2O
Cl-
H2O
H2O
Cl-
H2O
H2O
H2O
Na+
H2O
Na+
Concentrated
Salts
Permeate
SO4
2-
Cl- H2O
Ca
2+
HCO3
-
Basic Training for RO Removal Mechanism = Solution Diffusion

Feed
Flow
Na+
H2O
H2O
H2O
Cl-
H2O
H2O
Cl-
H2O
H2O
H2O
Na+
H2O
Na+
Concentrated
Salts
Permeate
SO4
2-
Cl- H2O
Ca
2+
HCO3
-
Virus, Giardia and Cryptosporidium
Are Orders of Magnitude larger in Size

What are the types of defects that would create a loss of microbial integrity?
• Missing or deteriorated o-rings on interconnectors and end adapters. (Some types of EPDM)
• Vessel sagging creating stress on vessel and interconnectors
• Broken Glue line (rarer occurrence than previously)
• High Feed Side Differential Pressure (telescoping)
• Permeate Backpressure Incident (catastrophic)
Most integrity occurrences are easily identifiable.
Integrity issues for RO are relatively uncommon

What causes an increase in permeate conductivity and is unrelated to integrity?
• Membrane Oxidation in Chloramines
• Aggressive Membrane Cleaning
• Scaling of Membranes
• Temperature Variations
• Increased Recovery
WateReuse -2015

What are the emerging methods that can be used to determine RO Membrane Integrity
• Fluorescence Marker Based Testing – Trasar (MW 610) – Uranine (MW 376) – Rhodamine WT (MW 440)
• All makers are relatively low molecular weight
• Higher Sensitivity because the compounds are Fluorescent at various wavelengths.
• Requires fluorometer and approach to the application
• Data suggests that sensitivity is increased to greater than 4 log.
• A combined permeate measurement does not tell us where the integrity is located.
WateReuse -2015
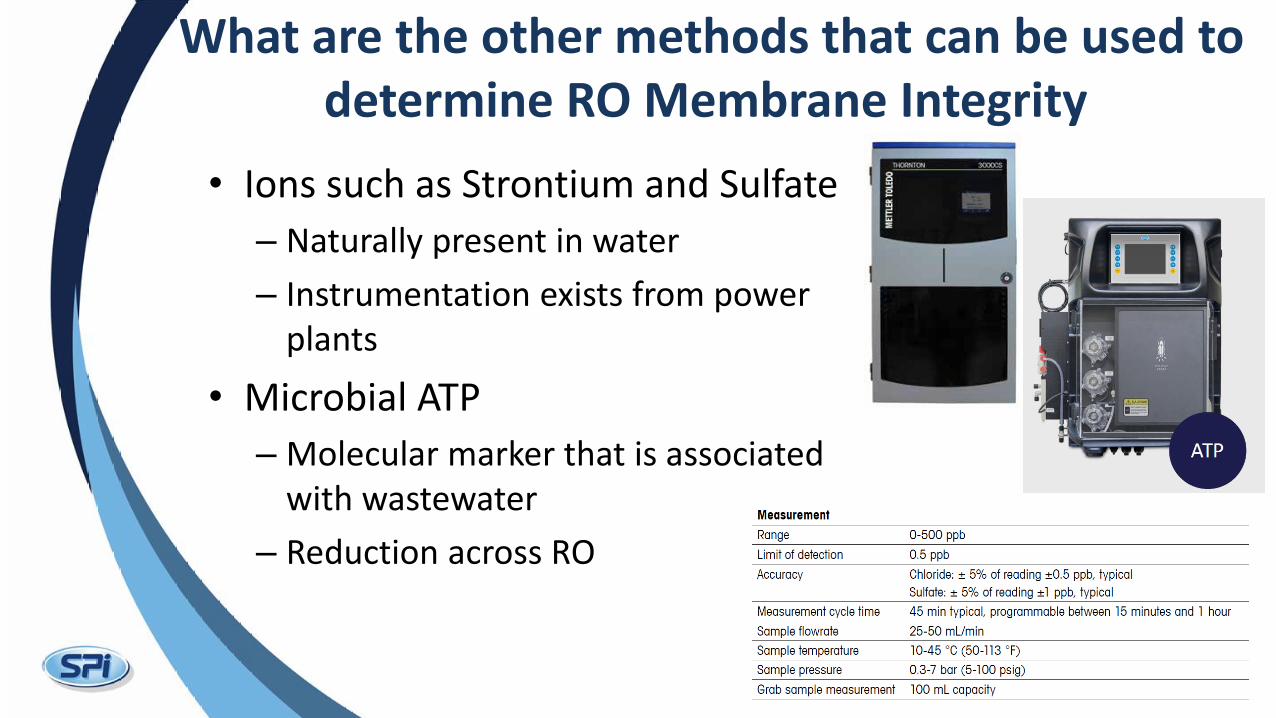
What are the other methods that can be used to determine RO Membrane Integrity
• Ions such as Strontium and Sulfate
– Naturally present in water
– Instrumentation exists from power plants
• Microbial ATP
– Molecular marker that is associated with wastewater
– Reduction across RO

Conductivity Profiling

Historical RO Integrity Monitoring Tools
• Conductivity profiles
• Vessel Probing
• Individual Element Testing
• Used as part of commissioning of a RO system to verify that all membranes are integral and performing similarly
• Routinely performed by most facilities to assure vessels are operating properly.

Conductivity Profiling – Fast and Reliable • Always use the same handheld meter and do not use any
values from unit conductivity meters.
• Write down conductivity values along with system flow and pressures.
• Vessels from each stage should have similar conductivity.
• Conductivity is lowest in the first stage, and highest in the third.
• Once per week initially, then once per month.
• Vessels that exhibit higher than normal conductivity should have their seals checked or the elements in the vessel profiled by probing.
• Review data from prior or similar testing to identify outliers

At the GWRS Integrity Defects are Identified by Conductivity Profiling
Stage to state performance is
variable, but similar within a stage
Limits for New Membranes: No more
than 40 percent of median
Limits for Installed Membranes: No
more than 50 percent of median
Routinely monitored
Membranes: ESPA2, 8 years

Principals associated with a Conductivity Profile
• Diffusion is an intrinsic property of RO Operation – Water Temperature
– Membrane Age and Flux
– Concentration Difference / Staging
• There is conductivity that is associated with normal operation, and conductivity (outliers) that would be associated with a defect.
• Parsing the data has been left to operators for interpretation, but statistical methods are available. (JAWWA August 2018)

RO Vessel Probing
End Adapter
R.O. Elements
Interconnector O-rings
Probe
Conductivity
Meter
Feed
Concentrate
* Direction of flows are critical to assessing the data

Example
RO Pressure Vessel Conductivity Probe Data
Stage 1 Pressure Vessel Concentrate Flow Feed Flow
Probe End
Date:
Operator:
RO Train No.:
Pressure Vessel No.:
Total Vessel Conductivity:
Feed pH:
Feed Cond. (umho/cm):
Feed Temperature (deg F):
Feed Pressure (psi):
Stage 1 dP (psi):
Stage 2 dP (psi):
Concentrate Flow (gpm):
Permeate Flow (gpm):
Permeate Cond. (umho/cm):
Permeate Pressure (psi):
Stage 1
Vessel Sample Location Conductivity (umho/cm)
End Connector
Element 6
Interconnector
Element 5
Interconnector
Element 4
Interconnector
Interconnector
Element 3
Interconnector
System Data
Element 1
End Connector
Element 2
Permeate Flow 6 5 4 3 2 1
1 2 3 4 5 6 7 8 9 10 11 12 13
1
2
3
4
5
6
7
8
9
10
11
12
13
RO Vessel Probing

Yucaipa Virus Testing Results

Yucaipa Valley UV/RO MS-2 Virus Testing • Full Scale MS-2 virus testing was required for open
channel UV System to update to the 2012 NWRI
Standard (Spot Check Bio-Assay)
• Partial RO is used to reduce salinity in order to comply
with Groundwater Basin Plan
• Single RO Unit
• 52:20 array
• 1650 gpm unit
• 85 percent recovery
• CSM RE-8040-FE Membranes (2013)
• A retest was required for the UV System, so the RO
system was tested as well.
• RO system was operating under normal conditions
• no special preparation

Rationale Behind Yucaipa Work
• Changes in IPR regulations (aka 12-10-10) means
that RO will be operated for virus removal credits.
• WateReuse and State of California suggest LRV’s
of 1.5 to 2.0 (although the actual range is broader)
• Water Reuse Project 12-07 suggests on a lab/pilot
level RO removal is above 5.0.
• Fluorescence Testing (WateReuse Project 09-06b)
indicates that LRV’s are above 4.0 based on RO
pilot studies.
• Information on full scale system RO performance is
limited (or non-existent).
• Because we wanted to find out for ourselves as the
information is missing.

Yucaipa Valley Water District Process Flow Diagram

Our Questions to be addressed • How does the feed concentrate?
• Is there different performance between vessels
and stages?
• Is Removal Flow/Flux dependent?
• Do chloramines make a difference in
performance (inactivation/disinfectant effect)
• Can a Loss of Integrity be detected by
Conductivity Profiling
• Does permeate water quality change as a result
of “osmotic shock”
• MS-2 die-off in permeate (aka inactivation)
• Laboratory Confirmed that MS-2 would not
survive overnight shipment in RO Permeate,
so buffer was necessary.

Testing Matrix – Spiked Challenge Testing Flux Characterization (w/o chloramine)
• Test 1: 10 gfd @ 85 percent Recovery
• Test 2: 12 gfd @ 85 percent Recovery
Chloramine Effect
• Test 3: Chloramines Dosed At 2-3 mg/L
Integrity (w/o chloramine)
• Test 4 : Compromised interconnector
Buffer Effect -Parallel Sampling
• Immediately into Buffer (KH2PO4)
• Wait 5 minutes before adding buffer

18 18 18 17 7
20 19 18 17 17 18 18 19 6
51 42 48 43 19 18 18 20 19 18 18 18 5
43 53 43 45 19 20 21 18 18 20 19 18 4
46 42 39 45 19 19 18 18 18 18 20 19 3
43 45 46 46 17 19 20 19 21 19 18 18 2
39 39 40 43 17 19 20 20 18 19 21 21 1
2-4 2-3 2-2 2-1 1-8 1-7 1-6 1-5 1-4 1-3 1-2 1-1
YVWD Initial Conductivity Profile
Yucaipa Valley Water District
August 2017

15 15 15 15 7
17 16 16 15 15 16 16 16 6
40 42 37 33 16 15 15 18 16 16 16 15 5
33 33 33 35 16 15 17 16 15 16 16 16 4
35 32 30 35 16 16 16 15 16 15 34 16 3
34 35 36 36 15 16 17 17 27 15 15 15 2
30 29 30 32 15 16 17 17 15 16 17 17 1
2-4 2-3 2-2 2-1 1-8 1-7 1-6 1-5 1-4 1-3 1-2 1-1
YVWD Conductivity profile with Compromised Interconnector
Yucaipa Valley Water District
August 2017
34

MS2 Testing – Spiked Feed Concentrations Feed Interstage Concentrate
Test 1 (10 gfd) 1.22*106 2.44*106 5.70*106
Test 2 (12 gfd) 1.21*106 2.55*106 6.10*106
Test 3 (Total Cl2) 1.45*106 5.55*106 5.70*106
Test 4 (Integrity) 1.33*106 2.22*106 4.30*106
Feed Interstage Concentrate
Test 1 (10 gfd) 1.04*106 3.08*106 7.30*106
Test 2 (12 gfd) 1.10*106 2.44*106 5.35*106
Test 3 (Total Cl2) 1.38*106 2.91*106 6.30*106
Test 4 (Integrity) 1.21*106 2.19*106 4.65*106
Feed
1.04-1.45 x 10⁶
Interstage
2.19-5.55 x 10⁶
Concentrate
4.3-7.3 x 10⁶

Permeate Virus (pfu/mL) – combined results
660
11 14
[Y VALUE]0
5
1
10
100
1000
Test 2
1P V-123 2P V-232 FP
1
25
410
100
47
1
10
100
1000
Test 1
1P V-123 2P V-232 FP
188
26400
510
0
93
1
10
100
1000
10000
100000
Test 4
1P V-123 2P V-232 FP
32 34
152 115
208
1
10
100
1000
Test 3
1P V-123 2P V-232 FP
Compromised
location
7
1
177
1 1
1
10
100
1000
Test 1
1P V-123 2P V-232 FP
30 51
287
104
0
1
10
100
1000
Test 3
1P V-123 2P V-232 FP
0
100
510
25
2
1
10
100
1000
Test 2
1P V-123 2P V-232 FP
9
23400
119
0 0
1
10
100
1000
10000
100000Test 4
1P V-123 2P V-232 FP

LRV (Avg. Feed to Avg. Permeate)
Average is Geometric Mean
5.63 5.35
3.62
5.05 5.22
0
1
2
3
4
5
6
7
1P V-123 2P V-232 FP
LRV
Test 1 - 10 gfd
4.65 4.54 4.14
5.36 5.56
0
1
2
3
4
5
6
7
1P V-123 2P V-232 FP
LRV
Test 2 - 12 gfd
4.66 4.53 3.83 4.11
4.99
0
1
2
3
4
5
6
7
1P V-123 2P V-232 FP
LRV
Test 3 - Total Cl2
4.11
1.71
3.61
>6.1
4.43
0
1
2
3
4
5
6
7
1P V-123 2P V-232 FP
LRV
Test 4 - Integrity
Compromised
location
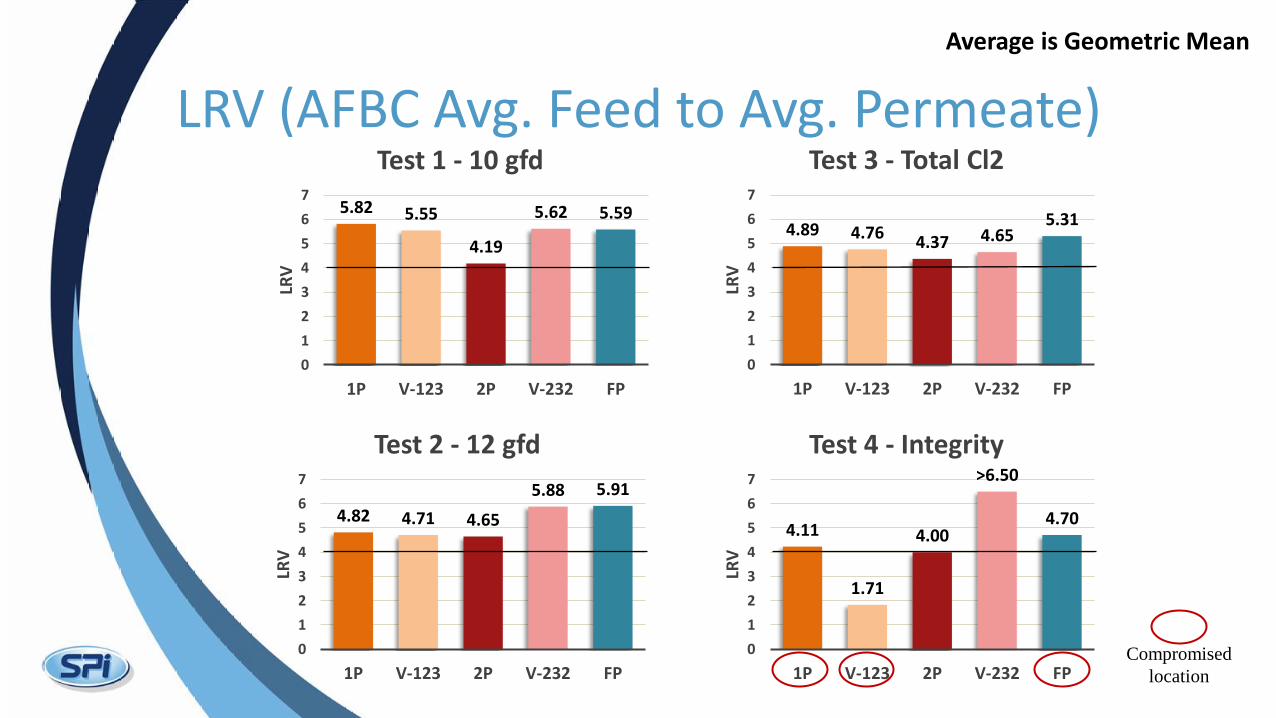
LRV (AFBC Avg. Feed to Avg. Permeate)
Average is Geometric Mean
5.82 5.55
4.19
5.62 5.59
0
1
2
3
4
5
6
7
1P V-123 2P V-232 FP
LRV
Test 1 - 10 gfd
4.82 4.71 4.65
5.88 5.91
0
1
2
3
4
5
6
7
1P V-123 2P V-232 FP
LRV
Test 2 - 12 gfd
4.89 4.76 4.37 4.65
5.31
0
1
2
3
4
5
6
7
1P V-123 2P V-232 FP
LRV
Test 3 - Total Cl2
Compromised
location
4.11
1.71
4.00
>6.50
4.70
0
1
2
3
4
5
6
7
1P V-123 2P V-232 FP
LRV
Test 4 - Integrity

What did we learn from the testing? • Scatter in the data results, take multiple
samples.
• Results of testing at 10 gfd and 12 gfd
membrane flux were similar and greater
than 5 log.
• We could identify a compromised vessel
with a conductivity profile, and the vessel
LRV as reduced from ~5 to less than 2.
• Overall reduction from the system
remained above 4 LRV even with a
compromised vessel.
Summary

Summary (1)
• RO Removal is diffusion based and affected by the feed composition/concentration and process conditions.
• Normalization of data is useful in characterizing RO system performance and diagnosing operational problems (temperature, conductivity, TOC, flow).
• Water Quality Indicators (Conductivity, TOC) are influenced by diffusion and unless considered, underestimate the removal of regulated virus, Giardia and Cryptosporidium.
• Fluorescence (marker) measurement is useful and provides higher sensitivity, and is useful for pilot testing and may be applied to full scale systems.

Summary (2)
• For full scale systems, integrity issues can be identified by conductivity profiling and subsequent diagnostic testing.
• Recent challenge studies suggests that virus removal through a RO unit is significantly higher than removal credits currently awarded.
• Membrane cleaning has a temporary effect upon salt removal performance.
• In the future, individual vessel integrity will require monitoring to obtain higher pathogen removal credits.
• Approved Compliance methods will be needed to obtain higher Log Removal Values for RO if used on combined permeate.

Questions?