Macarena Andrea Rodriguez Beltran Doctor of Philosophy
224
Macarena Andrea Rodriguez Beltran Thesis presented for the degree of Doctor of Philosophy Newcastle University School of Architecture, Planning and Landscape October 2017
Transcript of Macarena Andrea Rodriguez Beltran Doctor of Philosophy

Macarena Andrea Rodriguez Beltran
Thesis presented for the degree of
Doctor of Philosophy
Newcastle University
School of Architecture, Planning and Landscape
October 2017

ii
This page is intentionally left blank

iii
Abstract
Different policy instruments have been applied to raise the energy efficiency in low-
income and vulnerable households. However, previous studies suggested that, due
to temperature take-back, occupants take part of the energy consumption saving
after energy efficiency upgrades as increased internal air temperatures.
The aim of this study was to investigate the effects of retrofit insulation on space
heating consumption to deepen the understanding of the temperature take-back.
This study used an integrated approach to take into account the complex
interactions of physical and occupants’ behavioural factors; quasi-experimental and
qualitative approaches. A quasi-experimental approach involved detailed internal
air temperature monitoring of a sample in a high-rise building pre- and post-retrofit,
and monthly space heating consumption for over a year of each flat dwelling at the
retrofitted building, which was compared to a control building. A qualitative
approach involved the collection of occupant responses pre- and post-retrofit.
The main findings were: 1. Following retrofit the mean internal air temperature of
the high-rise retrofitted building increased +0.46˚C (22.07˚C to 22.53˚C at 5˚C
external temperature) and could attain a 27% space heating saving (34% relative to
a control group); 2. The effect known as saturation was taking place due to internal
temperatures’ reaching a maximum level of thermal comfort (~22.5°C); 3. No
evidence was found that would suggest that occupants were using their homes more
intensively or had changed the use of space.
These empirical findings suggested that assumptions normally made about low-
income dwellings ‘taking back’ energy savings as increased temperatures did not
accurately reflect the reality of the energy efficiency upgrades in the case study –
particularly, energy efficiency retrofit upgrades that achieve saturation. The study
suggested that energy efficiency measures targeting low-income dwellings
designed to achieve saturation might prevent temperature take-back, and achieve
both thermal comfort and low-energy use. However, a possible risk of overheating
was also suggested in the non-heating season.

iv
…to my granny

v
Acknowledgements
I would firstly like to thank my supervisor, Carlos Calderon for his guidance over
the years of my PhD. I would like to acknowledge the support I received from the
Sustainable Institute that provided funding for data loggers and gift cards. In
addition, from Your Homes Newcastle staff. I would especially like to thank Tom
Jarman for all his invaluable contributions.
I would also like to thank many other people, who have provided help in all kinds
of disciplines, such as Tom Bradley from NAREC, Peter Kellet, Simin Davoudi,
Rose Gilroy and Neveen Hamza from Newcastle University. I also wish to thank
Aidan Wightman for his help in checking my English. In addition, I would also
like to thank several fellow students, in particular, Montse Ferres, Javier Urquizo
and Tianqi for helping me with the interviews and Najla Mansur for the poster
design. It would also not have been possible without all the incredibly generous
participants. I am grateful for the time and interest that they invested in the project.
Last but not least, I give thanks to my family and Manos for all their support and
encouragement.

vi
This page is intentionally left blank

vii
List of Abbreviations and Acronyms
ACE Association for the Conservation of Energy
AS Advanced Subsidiary
ASHRAE American Society of Heating, Refrigerating and Air-
Conditioning Engineers
BREDEM BRE Domestic Energy Model
BS British Standard
BTEC National Award Certificate/Diploma.
˚C Degrees Celsius
CARB Carbon Reduction in Buildings
CERO Carbon Emissions Reduction Obligation
CERT Carbon Emissions Reduction Target
CESP Community Energy Savings Programme
CSE Certificate of Secondary Education
CI Confidence interval
CIBSE Chartered Institution of Building Services Engineers
CO2 Carbon dioxide
CHP Combined heat and power
CPH Cruddas Park House
CSCO Carbon Saving Community Obligation
DECC Department of Energy & Climate Change
DIY Do-it-yourself
ECF Energy cost factor
ECO Energy Company Obligations
EE Energy efficiency
EU European Union
EN European Norm
EST Energy Saving Trust
EWI External wall insulation
FT Full-time
GCSE General Certificate of Secondary Education
HD High density

viii
HDD Heating degree days
HHCRO Home Heating Cost Reduction Obligation
HLP Heat Loss Parameter
INCA Insulated Render and Cladding Association
ISO International Standards Organisation.
IT Internal temperature
IWI Internal wall insulation
LED Light-emitting diode
LTHW Low temperature hot water
m2 Square metre
Met Metabolic rate
mtoe Million tonnes of oil equivalent
MW Megawatt
NHS National Health Service
Ofgem The Office of Gas and Electricity Markets
PC Personal computer
PMV Predicted mean vote
PPD Predicted Percentage of Dissatisfied
PT Part-time
PWM Position Weight Matrix
RH Relative humidity
SAP Standard Assessment Procedure
SHC Space heating consumption
STBA Sustainable Traditional Buildings Alliance
TWh Terawatt-hour
UK United Kingdom
YHN Your Homes Newcastle

ix
Publications
Some ideas and figures have appeared previously in the following publication:
Rodriguez M, Calderon C (2017). Building fabric retrofit insulation in a UK high-
rise social housing building: an appraisal of temperature take-back and energy
consumption, in process of publication.
Rodriguez M, Calderon C (2014). Modelling approaches for retrofitting energy
systems in cities: current practice and future challenges in Newcastle upon Tyne.
disP: The Planning Review, 50(3), 76-89.

x
Table of Contents
Abstract iii
List of Abbreviations and Acronyms vii
Publications ix
List of Tables xv
List of Figures xvii
1. Chapter 1. Introduction 1
1.1. Introduction 1
1.2. Key Terms 2
1.3. Research Context 4
1.3.1. Energy efficiency policies aimed at raising the energy
efficiency in low-income and vulnerable households 5
1.3.2. Energy efficiency policies and fuel poverty in social
housing 10
1.3.3. Energy efficiency policies and CO2 emissions targets 12
1.3.4. Summary of research context 14
1.4. Research Questions 15
1.5. Research Aim and Objectives 16
1.6. Scope and Limitations of the Thesis 16
1.7. Structure of the Thesis 17
1.8. Summary 20
2. Chapter 2. Literature Review 21
2.1. Introduction 21
2.2. Building Retrofit 22
2.2.1. Building retrofit motivations 22
2.2.2. Building retrofit insulation strategies 23
2.2.3. Retrofit insulation for building envelopes 26
2.2.4. Building retrofit thermal performance metrics 31
2.2.5. Building retrofit regulations 33
2.2.6. Building regulations compliance/SAP 35
2.3. Predicting energy saving from building retrofit insulation 37
2.3.1. Miscalculation of physics-based models 39
2.3.2. Technical failures 42

xi
2.3.3. Occupant factors 42
2.3.4. Temperature take-back 43
2.3.5. Summary of the difference between predicted performance
and actual saving 43
2.4. Research Assumptions 44
2.4.1. Energy consumption saving and temperature take-back 44
2.4.2. Temperature take-back and low-income dwellings 45
2.4.3. Temperature take-back and saturation effects 46
2.4.4. Temperature take-back and CO2 savings 46
2.4.5. Temperature take-back, and the relationship between
physical factors and occupant’s behaviour factor 46
2.4.6. Temperature take-back and occupant’s behaviour factor in
the retrofit context 47
2.4.7. Summary of the research assumptions 49
2.5. Main Theoretical Approaches 50
2.5.1. Physics-based model approach 50
2.5.2. Thermal comfort models 51
2.5.3. Economic approach 54
2.5.4. Summary of the main theoretical approaches 55
2.6. Researching People and Buildings 56
2.6.1. Quasi-experimental approach 56
2.6.2. Quasi-experimental approach and qualitative approach 57
2.7. Conclusion 58
3. Chapter 3. Research Methodology 60
3.1. Introduction 60
3.2. Research Strategy and Justification 61
3.2.1. Quasi-experimental approach 63
3.2.2. Qualitative approach 65
3.3. Case Study 69
3.3.1. Why a case study is desirable 69
3.3.2. Appraising the effects of building fabric retrofitted
insulation on social housing 70
3.3.3. Finding a suitable case study 70
3.4. Case Study Description 71
3.4.1. Socio-demographic characteristics. Riverside Dene area 72
3.4.2. Buildings description 74
3.5. Sampling Approach 77
xii
3.6. How Validity is addressed in this Case Study 77
3.7. Ethical Considerations 78
3.8. Summary 78
4. Chapter 4. Data Collection 80
4.1. Introduction 80
4.2. Description of Data Collection Methods 81
4.2.1. Detailed monitoring 81
4.2.2. Structured questionnaires 82
4.2.3. Self-completion diaries and follow-up interviews 83
4.2.4. Semi-structured questionnaire 85
4.3. Data Collection Method Implementation 86
4.3.1. Monitoring internal air temperature and external air
temperature 86
4.3.2. Meter readings (gas consumption for space heating and hot
water, and electricity consumption) 87
4.3.3. Structured questionnaires 88
4.3.4. Self-completion diaries and follow-up interviews 88
4.3.5. Semi-structured questionnaire 89
4.4. Implementation Overview 89
4.5. Data Analysis and Construction of Metrics 93
4.5.1. Data cleaning and preparation 93
4.5.2. Mean standardised internal air temperature calculation 94
4.5.3. Internal temperature profile calculation 96
4.5.4. Normalised space heating consumption calculation 96
4.5.5. Secondary heating: electricity consumption for space
heating calculation 97
4.5.6. Activity profile calculation 97
4.5.7. Actively occupied rooms calculation 99
4.5.8. Use of heating 101
4.5.9. Thermal comfort perception calculation 101
4.5.10. Theme analysis 101
4.6. Limitations of the Data Collection Methods 102
4.7. Summary 103
5. Chapter 5. Results Part 1: Internal Air Temperatures and Space
heating Consumption 104
5.1. Introduction 104
5.2. Internal Air Temperature 105

xiii
5.2.1. Mean standardised internal air temperature 105
5.2.2. Internal temperature profile 106
5.3. Space Heating Consumption 110
5.3.1. Normalised space heating consumption 110
5.3.2. Gas consumption in the target building and national average
110
5.3.3. Electricity consumption for the non-heating season 111
5.4. Conclusion 112
6. Chapter 6. Results Part 2: Interactions between Occupant
Behavioural and Physical Factors 114
6.1. Introduction 114
6.2. Activity Profile 115
6.3. Actively Occupied Rooms 116
6.4. Use of Heating 116
6.5. Thermal Comfort Perception 117
6.6. Conclusion 119
7. Chapter 7. Results Part 3: Why Internal Air Temperatures Change
Afterwards? 121
7.1. Introduction 121
7.2. Heating Usage 122
7.3. Secondary Heating 123
7.4. Thermal Comfort 123
7.5. Ventilation 123
7.5.1. The use of fans 124
7.6. Infiltration 125
7.7. Other Positive Outcomes from the Retrofit Insulation 126
7.8. Level of Knowledge of the Occupant about the Imposed Retrofit
Insulation 127
7.9. Conclusion 128
8. Chapter 8. Discussion 129
8.1. Introduction 129
8.2. Results 130
8.2.1. Energy saving and temperature take-back 130
8.2.2. Temperature take-back and saturation effects 130
8.2.3. Temperature take-back, and the relationship between
physical factors and occupant behavioural factors 132

xiv
8.2.4. Temperature take-back and occupant behavioural factors
132
8.2.5. Thermal discomfort 133
8.2.6. Measuring overheating 134
8.3. Critical Reflection on the Research Methodology and Implications for
Future Research 135
8.3.1. Counterfactual, exogenous factors and sample size 136
8.3.2. Monitoring set-up 137
8.3.3. Occupant behaviour 138
8.4. Summary 139
9. Chapter 9. Conclusion 140
9.1. Introduction 140
9.2. Summary of the Thesis 140
9.3. Key Findings 143
9.4. Contribution to the Knowledge 144
9.5. Recommendations for Future Studies 146
9.6. Recommendations for the Housing Association for Future Projects
147
Annex A 165
Annex B 166
Annex C 168
Annex D 170
Annex E 171
Annex F 195
Annex G 198
Annex H 201
Annex I 206

xv
List of Tables
Table 1.1. Estimates of final energy consumption saving by household policies in
TWh. Source: based on Table 2 – ‘Final energy consumption savings by year
from UK policies included for Article 7 policy plan, TWh’ (DECC, 2014c)’. 7
Table 1.2. Summary of energy efficiency obligation targets for the domestic sector
in mtoe of CO2, between 2008 and 2015. Source: Ofgem (2013b), Ofgem
(2013c), Ofgem (2015). ................................................................................... 8
Table 1.3. Measures installed under CERT by type and group. Source: based on
‘Table 4.1 The number of measures installed’ (Ofgem, 2013b). .................... 9
Table 1.4. Measure type installed under CESP. Source: based on ‘Table 1: Total
number of measures delivered’ (Ofgem, 2013a). .......................................... 10
Table 1.5. Average energy efficiency rating by tenure 2011-2012. Source: based on
‘Table 2.3: Average SAP 12 ratings by tenure, 2011–2012’ (DECC, 2015). 12
Table 1.6. Remaining number of houses with potential for insulation measures
(million). Source: based on ‘Table 1: Remaining potential for measure within
UK housing stock’ (DECC, 2014c)’. ............................................................. 13
Table 2.1. Pay-back period for energy saving investments in the UK applied to a
typical 3-bedroom semi-detached house. Source: Shorrock et al. (2005) .... 24
Table 2.2. Remaining potential cavity wall insulation, loft insulation and solid wall
insulation, December 2016. Source: Table 4.4, Table 4.5 and Table 4.6 from
BEIS (2017). .................................................................................................. 25
Table 2.3. Evolution of wall construction in the UK. Source: based on Table 4 from
EST (2010) and University of West England, 2009 (UWE, 2009). .............. 27
Table 2.4. Description of insulation materials. Source: INCA (2015) ................. 29
Table 2.5. U-value of an upgraded 220 mm solid brick wall using thermal laminated
plasterboard or in-situ applied closed cell insulation. Source: based on Table
5. EST (2010). ............................................................................................... 33
Table 2.6. Thermal conductivity and density of insulation materials. Source: Table
1 from EST (2002). ........................................................................................ 33
Table 2.7. Minimum standards for heat loss that need to be achieved for upgrading
walls, floors and roofs in Building Regulations part L1B – Conservation of

xvi
fuel and power in existing dwellings. Source: Table 3 – Upgrading retained
thermal elements (HM Government, 2015). ..................................................35
Table 2.8. SAP rating bands. Source: ‘Table 14: Rating bands’ (BRE, 2014).....36
Table 2.9. Pre-intervention temperatures and theoretical energy-consumption
savings from p.420 of Milne and Boardman (2000). .....................................45
Table 2.10. Range of PMV and PPD by building categorizations in ISO 7730:2005
(British Standards Institution, 2005). .............................................................53
Table 2.11. Limits of the comfort zones by building categorizations EN 15251:2007
(British Standards Institution, 2007) for free-running buildings. ..................54
Table 3.1. Riverside Dene area income level. Source: YHN (2015) ....................73
Table 3.2. Riverside Dene area dweller characteristics. Source: YHN (2015) .....73
Table 3.3. Target and control group physical building descriptions. .....................76
Table 4.1. Gemini data logger specs. Source: Tinytag (2016) ..............................86
Table 4.2. Meter reading data from the control building and target building. .......94
Table 4.3. Activity types codified into 10 characters. ...........................................98
Table 4.4. Metabolic Rates for Typical Tasks. Source: ‘Table 5.2.1.2 Metabolic
rates for Typical tasks’ (ANSI/ASHRAE, 2013) ........................................100
Table 5.1. Internal temperature profile (˚C) pre- and post-retrofit (non-standardised,
n = 9). ...........................................................................................................109
Table 5.2. Normalised space heating consumption percentage change in the target
building, control building, and relative to each other. .................................110
Table 5.3. Annualised mean gas consumption for England and Wales against the
target building consumption between 2012 and 2013. Source: DECC (2013a)
......................................................................................................................111
Table 5.4. Mean electricity consumption pre- and post-retrofit and standard error of
mean in the target building. Source: monitored energy meter readings (n = 8).
......................................................................................................................112
Table 6.1. Actively occupied rooms pre- and post-retrofit (n = 9). .....................117
Table 6.2. Mean preference votes of ‘cold-related illness’, appearance and draught
from the longitudinal study (n = 9). .............................................................119

xvii
List of Figures
Figure 1.1. Structure of the thesis ......................................................................... 20
Figure 2.1. Overview of an EWI system. Source: INCA (2015), pag. 6. ............ 28
Figure 2.2. Rigid insulation plasterboard technique. Source. Based on Figure 1
from EST (EST, 2002) ................................................................................... 30
Figure 2.3. Studwork frame insulation, fixed to battens and counter-battens. Based
on Figure 5 from EST (EST, 2002). .............................................................. 30
Figure 2.4. Shortfall diagram. ............................................................................... 38
Figure 2.5. Internal temperature profile used in BREDEM-based model. Source:
reproduced from figure 10.1 of BREDEM-12 (Anderson et al., 2002). ....... 41
Figure 3.1. Research methodology of this study – Intervention design ................ 62
Figure 3.2. Quasi-experimental approach adopted in this study. .......................... 67
Figure 3.3. Qualitative approach adopted in this study. ........................................ 68
Figure 3.4. Left image, Cruddas Park House building (target building) before
retrofit insulation (March 2014). Right image, Cruddas Park House building
after retrofit insulation (March 2015). ........................................................... 72
Figure 4.1. Target building floor plan and data logger location ........................... 87
Figure 4.2. Overview of case study’s implementation stages. .............................. 92
Figure 4.3. Pre-retrofit activity profile including the most frequent activities whose
frequency is above 0.2. .................................................................................. 99
Figure 4.4. Post-retrofit activity profile including the most frequent activities
whose frequency is above 0.2. ....................................................................... 99
Figure 5.1. Standardised mean internal air temperature of the target building, at 5°C
external temperature. Pre- and post-retrofit (n = 9). ................................... 106
Figure 5.2. Internal temperature profile, pre-retrofit (non-standardised mean
internal air temperature) (n = 9). ................................................................. 108
xviii
Figure 5.3. Internal temperature profile, post-retrofit (non-standardised mean
internal air temperature) (n = 9). ..................................................................108
Figure 6.1. Graph showing the activity profiles, pre- and post-retrofit. ..............115
Figure 6.2. Bar plot of mean thermal preferences (n = 9), the lines in the bars
represent the standard deviation votes of thermal perception, pre- and post-
retrofit...........................................................................................................118
Figure 8.1. Frequency distribution of internal temperature above 23.5°C (%) – pre-
retrofit insulation (n = 9). .............................................................................132

1
1. Chapter 1. Introduction
1.1. Introduction
This chapter introduces the research problem, key terms, research context, and
presents the research questions and research aim/objectives. It also describes the
scope and limitations of this thesis and the research outline. Energy efficiency is
one of the central objectives of the European Union Strategy 2020 to achieve energy
security goals, reduce CO2 emissions and boost economic growth (European
Parliament and Council, 2012). Consequently, current UK policy has placed an
emphasis and large funding on promoting energy efficiency measures so as to tackle
climate change, energy security and fuel poverty concerns. The energy supplier
obligations such as CERT, CESP and ECO were expected to raise the energy
efficiency in low-income and vulnerable households (DECC, 2014c). ECO 1
targets, for example, focused on the lowest 15% of the UK’s most deprived areas
(DECC, 2012).
However insufficient consideration has been given to the implications of the
“temperature take-back” and “rebound effect” on energy efficiency policy (Sorrell,
2007). Occupants may take part of the energy saving after retrofit as increased
internal temperatures, particularly in dwellings occupied by low-income
householders (Milne and Boardman, 2000; Sorrell, 2007). One example is the
Warm Front Energy Efficiency Scheme, which had a positive health and quality of
life impact (Green and Gilbertson, 2008); however, it had a negligible impact on
energy saving (Hong, 2011).
2.
Therefore, in order to avoid unintended consequences, assessing the benefits of
these initiatives requires more than simply counting the number of dwellings
retrofitted, the factors determining energy use in buildings need to be understood.
However, to date, those factors are complex and often poorly understood
1 This is referred to in the first version of ECO.

2
(Oreszczyn and Lowe, 2010). This is where studies adding new empirical evidence
to deepen the understanding of the effects of retrofit insulation on space heating
consumption could play a role, also shining a more critical light on how future
research design could be improved. This is of even greater importance, also taking
into account the higher investment needed before 2050. For example, an estimated
cost for a whole house retrofit programme will range between £16,000 and £34,000
per property for at least 1,000 properties (SHAP, 2009 as cited in URBED, 2016).
Personally, this research is also important, since my main scholarly interest is in
self-sufficient cities, especially in the provision of resources for urban populations
with regard to energy. In this context, if we look at the pathway to meet the carbon
reductions, the first step is demand reduction whilst simultaneously getting the
building stock insulated. Demand reduction and building insulation measures are
linked with a strong human factor component, which adds more complexity to
current technical solutions to a low-carbon transition. This made me wonder if
there is a real impact of current technical solutions to a low-carbon transition. This
sparked my interest to research the issue of energy efficiency, as an Engineer and
marketing researcher, it evoked an inspiration to study how the understanding of
physical factors and behavioural factors can contribute to the low-carbon transition.
1.2. Key Terms
Since the study cuts across different fields of study, this section introduces some
key terms in order to clarify some concepts that are used through the thesis. These
terms are considered in greater detail in Chapter 2 (Literature Review).
Shortfall
There are several definitions that have emerged to explain the difference between
the actual energy consumption saving achieved from the energy efficiency
measures and the estimated saving from theoretical models. For example, this
difference has been termed as the “Reduction factor” by Sanders and Phillipson
3
(2006) or “Shortfall” by Sorrell et al. (2009). The Reduction Factor2 is defined as
“the amount by which the measured energy saving following refurbishment is less
than the saving predicted from theory” (Sanders and Phillipson, 2006, p.?).
Shortfall is defined as “the difference between actual savings in energy
consumption and those expected on the basis of engineering” (Sorrell et al., 2009,
p. 1358).
The known reasons for this difference are the occupants’ behaviour with the
remainder due to other factors, such as inexact equations (mathematical models of
heat transfer), inputs (U-values) and/or technical failures (i.e. installation,
performance of equipment) (Sanders and Phillipson, 2006; Sorrell et al., 2009). To
avoid ambiguity in this study, the term shortfall by Sorrell et al. (2009) is used and
is limited to residential space heating only.
Temperature take-back
There are several definitions that have emerged to explain the predicted energy
consumption saving converted into an increase of internal temperature such as
“comfort factor”, “take-back” and “temperature take-back”. Comfort factor is
defined as “the part of the reduction factor which can be identified as being caused
through improved internal temperatures” (Sanders and Phillipson, 2006, p.?3).
Milne and Boardman for example describe take-back as “the amount of energy
taken as extra warmth following an energy efficiency improvement, expressed as a
percentage of the energy which could have been saved if there had been no
temperature increase” (Milne and Boardman, 2000, p. 416).
Temperature take-back is defined as “the change in mean internal temperatures
following the energy efficiency improvement, or the reduction in energy savings
associated with that change” (Sorrell et al., 2009, p. 1358).
2 Sanders and Phillipson (2006) proposed that the difference between actual and
predicted energy saving following an energy efficiency upgrade can be expressed
as:
Reduction factor (RF) = Comfort factor (CF) + Other factor (OF).
3 Paper without pages

4
The basic assumption is that only a part of temperature take-back is accounted by
the occupants’ behavioural change and the remainder by the physical factors
(Sorrell, 2007; Sorrell et al., 2009). This study uses the term temperature take-back
by Sorrell et al. (2009) but limited to residential space heating only.
Behavioural change
There are several theories of energy consumption behaviour. Chatterton (2011)
identified four theories for understanding energy consumption behaviour.
Economic theories define energy as an action, in which “consumers will adapt
usage in response to price signal” (Chatterton, 2011, p. 7). Psychological theories
describe energy use on the base of “stimulus-response mechanisms”, in which
people may respond to a feedback campaign, meter readings or more information
(ibid., 2011). Sociological theories propose that energy is perceived as the result of
its services “people do not directly use energy, instead we carry out a range of
activities or ‘practices’ that lead to the consumption of energy” (Chatterton, 2011,
p.7).
Sorrell et al. (2009) define behavioural change as: “the proportion of the change in
internal temperature that derives from adjustments of heating controls and other
variables by the user (e.g. opening windows), or the reduction in energy savings
associated with those changes” (Sorrell et al., 2009, p. 1358).
However, the concept of behaviour is not limited to a set of adaptive actions (e.g.
switching on/off heating, adding clothes or adjustments of heating controls). For
the purposes of this thesis, the behavioural change definition by Sorrel et al. (2009)
is suitable, since it is limited to the adaptive actions performed by occupants to
adapt their environment to feel comfortable. For example, an occupant can open
the windows to regulate a desired internal temperature, following retrofit.
1.3. Research Context
This section describes the key energy efficiency policies aimed at reducing carbon
emissions and tackling fuel poverty in the household sector. First it reviews the

5
Energy Efficiency Obligations imposed on to the suppliers aimed at raising the
energy efficiency in low-income and vulnerable households. The second part of
this section seeks to understand better the relationship between energy efficiency
policies and fuel poverty in social housing. The third part analyses the relationship
between energy efficiency policies and carbon emission (or energy saving) targets.
1.3.1. Energy efficiency policies aimed at raising the energy efficiency in low-
income and vulnerable households
Energy efficiency is one of the central objectives of the European Union Strategy
2020 to achieve energy security goals, reduce CO2 emissions and boost economic
growth (European Parliament and Council, 2012). The 2012/27/EU Directive set a
primary4 energy saving target of 20% by 2020 against a 2007 business-as-usual
projection (ibid., 2012). In response to the Directive, the UK’s government adopted
a target of 129.2 mtoe5 (saving) for final6 energy consumption, equivalent to a 20%
reduction in primary energy consumption (DECC, 2014c). From Article 7 of the
2012/27/EU Directive, which requires a cumulative final energy savings target of
1.5% relative to the average final energy consumption over the period 2010-2012,
the binding target was set at 324 TWh in 2013, to comply with the ‘EU Strategy
2020’ (DECC, 2014c).
A total of 19 different policy measures have been used to implement the
2012/27/EU Directive (DECC, 2014c). Particularly, three supplier obligations such
as the Carbon Emissions Reduction Target (CESP), Community Energy Saving
Programme (CERT) and Energy Company Obligation (ECO) were expected to
raise the energy efficiency of households in low-income and vulnerable households
(DECC, 2014c). These three obligations were projected to contribute 167 TWh in
4 Primary energy consumption is defined as gross inland consumption minus non-
energy uses (European Parliament and Council, 2012).
5 Million tonnes of oil equivalent.
6 Final energy consumption is defined as “all energy supplied to industry, transport,
households, services and agriculture” (European Parliament and Council, 2012,
p.10).

6
energy savings, by 2023 (Table 1.1) (DECC, 2014c), meet the carbon targets in
Table 1.2, and assist the fuel poor (DECC, 2011; DECC, 2012).
CERT aimed at reducing 293 mtoe of CO2 savings by overcoming barriers to the
uptake of cost-effective energy efficiency interventions i.e. insulation, heating and
lighting (DECC, 2014b). CERT also required meeting at least 40% of its target to
a ‘Priority Group7’ (ibid., 2014a). CERT’s five years of existence (from April 2008
to December 2012) achieved 296.9 mtoe of CO2 savings and 41% of resulted
measures were provided to the Priority Group (Ofgem, 2013b). 3.9 million
households received loft insulation and over 2.6 million cavity wall insulation, of
these about 25% were social tenants (Watson and Bolton, 2013). See details of
measures installed under CERT by type and group in Table 1.3.
CESP (Community Energy Saving Programme) was designed to reduce 19.25 mtoe
of CO2 emissions and fuel bills in the most deprived geographical areas (DECC,
2014b). CESP ran from October 2009 to December 2012 and incentivised a ‘whole-
house’ upgrade approach, involving one or more energy efficiency measures (ibid.,
2014a). Under CESP 293,922 energy efficient measures were provided to more than
154,000 low-income dwellings, of these 49% were insulation and 39% heating
measures (see Table 1.4) (Ofgem, 2013a). Many of these measures were delivered
through social housing providers (working in partnership with private households)
(DECC, 2014b). CESP and CERT were succeeded by the Energy Companies
Obligations (ECO), which was launched in 2013 (Hough and Page, 2015).
ECO (Energy Company Obligation) aimed at reducing household carbon emissions
by up-taking cost-effective energy efficiency interventions which were not fully
financeable through the ‘Green Deal’8, focusing on subsided measures for low-
income and vulnerable households (DECC, 2012). Three obligations were imposed
7 Priority Group refers to “households where particular benefits are claimed and/or
a household member is 70 years old or above” (DECC, 2014b, p.10). 8 The ‘Green Deal’ is a financial mechanism that moves responsibility onto
homeowners to make energy efficiency improvements. Energy efficient measures
are paid to the electricity provider in instalments, attached to the electricity bills,
with a ‘Golden Rule’ that estimated savings must be greater than repayments
(DECC, 2012).

7
on to suppliers under ECO: the Carbon Emissions Reduction, the Carbon Saving
Community and the Home Heating Cost Reduction Obligation (HHCRO) (Ofgem,
2015). HHCRO, also known as Affordable Warmth, was intended to make heat
more affordable in low-income and vulnerable dwellings (Ofgem, 2015). ECO is
currently running in its second obligation period until March 20179 and the plan is
to run for the next 5 years, from April 2017-2022, with an emphasis on tackling fuel
poverty and CO2 emissions (DECC, 2016b). Under the current ECO the Affordable
Warmth obligation is exclusively dedicated to private tenure households; a further
proposal aims to include energy inefficient social housing (DECC, 2016b).
As can be seen, past programmes have made progress to achieve policy goals, yet
focusing on cost-effective energy-efficient measures such as loft insulation and
cavity-wall insulation, so-called ‘low-hanging fruit’ (Rosenow and Eyre, 2014).
TWh 201
0
2011 2012 2013 2014 2015 2016 2017 2018 2019 2020 2021 2022 2023 total
CERT
*
2.7 5.7 9.1 9 9 9 9 9 9 9 9 8.9 8.8 8.6 116
CESP* 0 0.1 0.4 0.4 0.4 0.4 0.4 0.4 0.4 0.4 0.4 0.4 0.4 0.4 5
ECO 0.7 1.4 2.1 2.8 3.6 4.4 5.1 5.7 6.4 7.1 7.1 46
Total 167
Green
Deal
0.2 0.4 0.5 0.7 0.8 0.9 1.1 5
Total 124 172
*(2010-2012)
Table 1.1. Estimates of final energy consumption saving by household policies in
TWh. Source: based on Table 2 – ‘Final energy consumption savings by year from
UK policies included for Article 7 policy plan, TWh’ (DECC, 2014c)’.
9 From April 2015 until March 2017.

8
Scheme Target mtoe of
CO2
Year Target (low-
income)
Target achieved
mtoe of CO2, (%)
CERT 293 (lifetime)*
DECC, 2014
2008-
2012
40% focused on
priority group
customers
296.9 (101)*
CESP 19.25
(lifetime)**
2009-
2012
Specific low-
income areas
16.31 (85) **
ECO
1st
period
Carbon emissions
reduction
obligation
(CERO****)
(lifetime)***
Carbon saving
community
obligation
(CSCO) – 6.8
(lifetime)***
Home Heating
Cost Reduction
Obligation
(HHCRO) £4.2
bn***
2013-
2015
Carbon saving
community target
focused on the
lowest 15% of the
UK’s most deprived
areas
CERO: 18.33
(131)***
CSCO: 9.87
(145)***
HHCRO £5.16bn
(123)***
*(Ofgem, 2013b), **(Ofgem, 2013c), ***(Ofgem, 2015), **** a reduction of the
CERO target was done by 33%, from 20.9 mtoe CO2 to 14 mtoe CO2.
Table 1.2. Summary of energy efficiency obligation targets for the domestic sector
in mtoe of CO2, between 2008 and 2015. Source: Ofgem (2013b), Ofgem (2013c),
Ofgem (2015).

9
Measure type Measures Priority group
(thousands)
Non-priority
group
(thousands)
Total
(thousands)
Insulation
Cavity wall insulation 1,260 1,309 2,569
Loft insulation 2,334 1,564 3,897
DIY insulation (m2) 18,008 94,843 112,851
Solid-wall insulation 44 15 59
Window glazing (m2) 113 34,478 34,590
Other insulation (*) 107 613 720
Heating
Other heating (control &
boilers) (**)
619 977 1,596
Other heating network (***) 3 6 9
Lighting
Compact Fluorescent Lamps 121,489 182,463 303,953
Other lighting system(****) 112 904 1,016
Real Time
Displays
Real Time Displays 761 2,239 3,000
Other
Shower regulators 1,526 8,128 9,653
TVs 10,336 20,146 30,482
EE. cold and wet appliances 851 3,580 4,432
Standby savers 2,399 2,528 4,927
(*) Other insulation: draught proofing, hot water tank jackets, radiator panels (m2)
and flat-roof insulation. (**) Other heating controls and boilers: fuel switching,
replacement boilers, heating controls installed and communal heating. (***) Other
heating networks: ground source heat pump, air source heat pump, solar water
heating and large-scale CHP. (****) Other lighting: other lighting and LEDs.
Table 1.3. Measures installed under CERT by type and group. Source: based on
‘Table 4.1 The number of measures installed’ (Ofgem, 2013b).

10
Measure type Measure Number of
measures %
Measure
type (%)
Insulation
Cavity wall insulation 3,000 1
49
Loft insulation 23,503 8
Solid wall insulation 80,257 27
Window glazing (m2) 21,779 7
Other insulation (*) 14,952 5
Heating Heating other (control and
boilers) (**) 113,980 39 39
District heating Connection to, upgrade
and meter 23,732 8 8
Microgeneration
Heat pump, solar water
heater 1,079 0
4
Photovoltaic panel 11,546 4
Energy advice
package 94 0 0
Total 293,922 100 100
(*) Other insulation: draught proofing, flat-roof insulation and under-floor
insulation. (**) Heating other controls and boilers: fuel switching, replacement
boilers and heating controls.
Table 1.4. Measure type installed under CESP. Source: based on ‘Table 1: Total
number of measures delivered’ (Ofgem, 2013a).
1.3.2. Energy efficiency policies and fuel poverty in social housing
The social housing sector is one of the most important sectors in the UK, around
4.1 million dwellings (17% of the stock), of which 2.4 million dwellings are owned

11
by housing associations and around 1.7 million owned by local authorities (DCLG,
2016a). There are different pressing issues in this sector such as low income10, fuel
poverty and unemployment. One in ten households in the social-rented tenures is
classified as living in fuel poverty11 (DECC, 2015). Fuel poverty has been linked
with increased morbidity and mortality, especially among the most vulnerable
groups (Wilkinson et al., 2001; Institute of Health Equity, 2014). In addition, the
degree of exposure to cold temperatures is linked with respiratory, circulatory and
mental health problems (Institute of Health Equity, 2014).
Although fuel poverty in the social sector has decreased since 2003, particularly
eight percentage points of fuel poverty in local authority housing (DECC, 2016a)12,
there is a further risk of more households in the social sector going into fuel poverty,
given the increase in energy bills. However, to some extent smaller floor areas and
improved energy efficiency (see Table 1.5) contribute to reduce the level of fuel
poverty in this group (DECC, 2015). It is therefore important for a long-term
solution to continue fostering energy efficiency measures in the social housing
sector i.e. insulation and heating systems.
However, the positive impact of energy efficiency measures on fuel poverty or
health (due to better living conditions provided by the increase in internal
temperatures) may be decoupled from the energy saving. One example is the Warm
Front Energy Efficiency Scheme, one of the main programmes to tackle fuel
10 Local authority tenant incomes: £13,662. Social housing tenant incomes:
£13,344. Values expressed in median equivalised AHC (after housing cost), in
which incomes, mortgages and rent payments are deducted from the full income of
each household. (DECC, 2015).
11 Fuel poverty has been subject to different debatable redefinitions; the last
definition is that fuel poverty is calculated under the low-income/high-costs
indicator (Hills, 2012). The previous 10% indicator was very sensitive to energy
prices, bringing people living in large inefficient homes into the fuel poverty
statistics, who were reasonably well-off (DECC, 2015).
12 Housing belonging to local authorities or social landlords has an ‘above-average
energy performance’ compared to other households since it has been much more
likely to get energy-efficiency improvements (Palmer, J. and Cooper, I. (2013)
United Kingdom housing energy fact file 2013. [Online]. Available at:
https://www.gov.uk/government/uploads/system/uploads/attachment_data/file/345
141/uk_housing_fact_file_2013.pdf (Accessed: 15/10/2017).

12
poverty among the low-income and vulnerable households (Green and Gilbertson,
2008). The Warm Front Scheme had a positive health and quality of life impact
(Green and Gilbertson, 2008); however, it has a negligible impact on energy saving
(Hong, 2011). This is explored in more detail in a later section (2.4).
Tenure 2011 2012 2013
Social 63.4 64.7 65.6
Privately rented 55.6 57.3 58.8
Owner-occupied 55.7 57.5 58.7
Table 1.5. Average energy efficiency rating by tenure 2011-2012. Source: based on
‘Table 2.3: Average SAP 12 ratings by tenure, 2011–2012’ (DECC, 2015).
1.3.3. Energy efficiency policies and CO2 emissions targets
Despite the measures installed or provided to households in Tables 1.3 and 1.4,
there is concern as to whether the energy efficiency policies can meet the energy-
saving goals. The identified issues could be divided into two categories: retrofit
uptake and predicted energy saving. It has been noted that the retrofit uptake has
been less than needed, indeed since 2013 there is a slow-down in the rate of
installation of energy efficiency upgrades in buildings (Energy and Climate Change
Committee, 2016). Although there is still an energy-saving potential for dwelling
insulation and heating measures of 54TWh, between now and 2020, it implies that
millions of homes need to be insulated (DECC, 2014c). 7.3 million solid wall, 5.1
million cavity wall, 7.4 million loft insulation and 20.1 million floor insulations,
among other measures, are shown in Table 1.6 (ibid., 2014b).
The impact of retrofits on energy saving has been less than predicted, particularly
in low-income and vulnerable households. To date, insufficient consideration has
been given to the implications of the temperature take-back and rebound effect on
energy efficiency policy (Sorrell, 2007). However, there is a growing awareness
that normative models, such as the one used to account for the energy saving from
energy efficiency policies, do not represent the actual energy saving. The difference
between the actual saving achieved from the energy efficiency measures and the

13
estimated one from theoretical models has been termed shortfall (Sorrell et al.,
2009). This shortfall can be attributed to occupant behaviour with the remainder
due to other factors, such as technical failures (i.e. installation, performance of
equipment) and poor engineering estimates of potential savings. Particularly in
household heating, the term temperature take-back has been used to explain the
predicted energy consumption saving converted into increases of internal
temperature.
It has been established that standard physical models overestimate the energy
savings from energy efficiency improvements in household heating systems by one
half or more in low-income households (Sorrell et al., 2009).
Insulation measures Number of houses
(million)
Solid wall insulation 7.3
Cavity wall insulation 5.1
Loft insulation 7.4
Floor insulation 20.1
Double glazing 19.2
Insulated, energy-efficient doors 11.1
Draught proofing (draught stripping) 1.9
Reduced infiltration (foam, strips, sealant use) 23.7
Table 1.6. Remaining number of houses with potential for insulation measures
(million). Source: based on ‘Table 1: Remaining potential for measure within UK
housing stock’ (DECC, 2014c)’.
For example, the impact of the Warm Front Scheme had a negligible impact on
energy saving (and consequently carbon emissions) (Hong, 2011). The author
reported that following the energy efficiency upgrades the internal air temperature
increased by 1.6°C and fuel consumption increased by 12% (Hong, 2011). Several
researchers (such as Hong et al., 2006; Oreszczyn et al., 2006; Hong, 2011), have
suggested that occupants may take part of the energy saving after retrofit as
increased internal temperatures. Particularly, it was noted that temperature take-
14
back is usually higher in dwellings occupied by low-income householders (Milne
and Boardman, 2000; Sorrell, 2007). It is therefore very important to understand
the factors determining energy use in buildings, as this lack of knowledge is a
concern in the achievement of energy and carbon emissions policy goals. However
to date these factors determining energy use in buildings are complex and often
poorly understood (Oreszczyn and Lowe, 2010).
1.3.4. Summary of research context
The European Union Strategy 2020 has influenced the UK’s energy efficiency
policies in the household sector. The policy reviewed in this section identified
particularly three energy efficiency supplier obligations aimed at raising the energy
efficiency in low-income and vulnerable households. Despite the measures
installed under the three energy efficiency supplier obligations and the Warm-front
scheme, concerns have been noted that they have been insufficient to meet the
energy-saving targets. One of the reasons is the insufficient consideration given to
the implications of the temperature take-back and rebound effect on energy
efficiency policy (Sorrell, 2007).
Occupants may take part of the energy saving after retrofit as increased internal
temperatures, particularly in dwellings occupied by low-income householders
(Milne and Boardman, 2000; Sorrell, 2007). One example is the Warm Front
Energy Efficiency Scheme, which had a positive health and quality of life impact
(Green and Gilbertson, 2008); however, it had a negligible impact on energy saving
(Hong, 2011). It is therefore very important to understand the factors determining
energy use in buildings, as this lack of knowledge is a concern in the achievement
of energy and carbon emissions policy goals. However, to date, these factors
determining energy use in buildings are complex and often poorly understood
(Oreszczyn and Lowe, 2010).

15
1.4. Research Questions
The following research questions are stated to explore the effects of retrofit
insulation on space heating consumption to deepen the understanding of the
temperature take-back.
- How do internal air temperatures change following an imposed building
fabric retrofit insulation?
- How does space heating consumption changes following an imposed
building fabric retrofit insulation?
- Which interactions between occupant behavioural factors and physical
factors may account for space heating consumption change?
- Why do internal air temperatures change afterwards?
These Research Questions are situated within the current research assumptions and
main theoretical approaches (see Chapter 2 Literature Review). The first and
second Research Questions are based on the premise that temperature take-back
after retrofit exists and can be observed (Chapter 2). Concerning this premise,
previous quantitative studies have measured the temperature take-back, which is
usually higher in low-income dwellings, as those are often not warm enough for
occupancy (Milne and Boardman, 2000; Sorrell et al., 2009) (Section 2.4).
Having included in the previous research questions the change of internal air
temperatures and space heating consumption following building fabric retrofit
insulation, the third Research Question is based on the premise that the physical and
occupant’s behavioural factors seem to form a complex system (Lowe et al., 2012;
Love, 2014), in which temperature take-back is accounted for by the physical
factors and the remainder by the occupant’s behavioural change (Hong et al., 2006;
Sanders and Phillipson, 2006; Sorrell, 2007) (Section 2.4). However, to date, the
factors determining energy use in buildings are complex and often poorly
understood (Oreszczyn and Lowe, 2010). Trying to catalogue the types of
interactions that occur following retrofit insulation, this study includes changes in
the use of space.

16
A fourth Research Question was added at the end of the study to include the insight
gained through the face-to-face interviews to understand why those outcomes
occurred. Indeed, this “why” question tries to understand why internal air
temperatures change afterwards. Together, these four Research Questions describe
the extent to which retrofit insulation may impact on space heating consumption in
a high-rise social housing building.
1.5. Research Aim and Objectives
The aim of this study is to investigate the effects of retrofit insulation on space
heating consumption to deepen the understanding of the temperature take-back, in
which occupants take part of the energy saving after energy efficiency upgrades as
increased indoor temperatures, through an empirical study. The objectives of this
study are as follows:
1. To examine the effect of energy efficiency upgrade on energy consumption for
space heating using a method of analysis that quantifies the change of the energy
service – internal air temperature;
2. To examine the effect of energy efficiency upgrade on energy consumption for
space heating using a method of analysis that quantifies the change of the energy
input – space heating consumption;
3. To identify occupant responses that can explain the effect of the energy efficiency
upgrade on energy consumption for space heating.
1.6. Scope and Limitations of the Thesis
This thesis is an investigation of the effect of building fabric investments on space
heating consumption in a high-rise social housing building. In order to understand
this effect, the change of space heating consumption along with the changes in
internal air temperature are measured, as current thinking argues that energy service
is the most relevant output of a system (Sorrell, 2015). In addition, the link between
physical and behavioural factors is observed in response to the installation of energy
efficiency measures through the change in the use of space, and the insight gained

17
from the occupants tries to understand why internal air temperatures change
afterwards.
The study area was limited to the retrofit project at the Cruddas Park House (CPH),
as it was the only project managed by the social housing association ‘Your Homes
Newcastle’ 13 which had secured retrofit funding 14 at the time of the survey
(February 2014). The CPH building underwent specific insulation type – external
solid wall insulation and double glazing of windows. Therefore, the study results
obtained need to be considered under this scope. The results of this study are
indicative of the effect of building fabric investments on space heating consumption
in a high-rise social housing; other dwellings or other types of retrofit insulation are
not considered. It is noted that generally every building is different either in design,
construction, or operational characteristics. Ultimately, this research might shine a
more critical light on how future research design could be improved and may lead
to recommendations which can be used as a basis for larger studies which can
inform energy policies.
1.7. Structure of the Thesis
This thesis is structured in the following way (see Figure 1.1).
Chapter 1 ‘Introduction’ introduces the research problem, research context, and
presents the research questions and research aim/objectives. It also describes the
scope and limitations of this thesis and the research outline.
Chapter 2 ‘Literature Review’. The literature review is divided into two parts. The
first part introduces the building retrofit under the current paradigms. Indeed, it
explains the building retrofit motivation and cost-benefit evaluation strategy for
upgrading domestic buildings in the UK. In addition, it also reviews the thermal
13 Your Homes Newcastle is the housing association responsible for managing
council homes on behalf of Newcastle City Council.
14 ECO funding to develop other retrofit projects was cancelled and support
(interviewers) from YHN to undertake the survey was revoked.

18
performance metrics used to describe the energy efficiency upgrades of dwellings
such as U-value and SAP. Moreover, it reviews the causes that might create
discrepancies between energy-modelling predictions and actual energy saving pre-
and post-retrofit such as: miscalculation of physics-based models, technical
failures, occupant factors and temperature take-back, therefore introducing in this
section the temperature take-back concept. Following this, the main research
assumptions related to temperature take-back and energy consumption are
reviewed.
The second part of this chapter reviews theoretical approaches that might be used
to explain how occupants might respond to the introduction of energy efficient
measures in the domestic sector: economic, engineering/physics-based model
approaches and thermal comfort models. This part of the chapter also reviews work
in this area undertaken by previous researches using a quasi-experimental approach
and presents the rationale for the selection of the quasi-experimental and qualitative
approaches used in this study.
Chapter 3 ‘Research methodology’ describes the research methodology for this
study. Firstly, an overview of the research strategy ‘intervention design’ (Creswell,
2015), adopted to address the Research Questions, is presented. Intervention design
strategy is an advanced mixed method that comprises a quasi-experimental design
and qualitative method. Secondly, the chapter describes the case study and its
justification. The study comprises two high-rise social housing buildings located
in the Riverside Dene Area of Newcastle upon Tyne, UK: Cruddas Park House
(CPH), the target building, and The Hawthorns, the control group building. The
chapter also describes the sampling approach, building physical characteristics,
socio-demographic characteristics. Finally, this chapter describes how validity is
addressed in this case study and how ethical considerations are taken into account
in this case study.
Chapter 4 ‘Data Collection’ provides a summary of the research methods used to
collect the evidence used in this research. The research methods for data collection
such as detailed monitoring, meter readings, structured questionnaire, self-
completion diaries and follow-up interview, and semi-structured questionnaire are
described and justified. In addition, the implementation of the research methods is
19
explained. This chapter also describes the data analysis steps and the metrics
constructed to answer the Research Questions in Chapters 5, 6 and 7. Finally, this
chapter describes the main limitations of the research methodology.
Chapter 5 ‘Results part 1: Internal Air Temperatures and Space heating
Consumption’. First, this chapter presents the findings of the impact of the energy
efficiency retrofit interventions on changes in internal air temperatures in the target
building. Secondly, the chapter shows the findings of the impact of the energy
efficiency retrofit interventions on changes in space heating consumption of the
target building relative to the control group building.
Chapter 6 ‘Results Part 2: Interactions between Occupant Behavioural and
Physical Factors’ presents the findings of the interaction between behavioural and
physical factors through the changes in the use of space and thermal comfort
perception.
Chapter 7 ‘Results Part 3: Why internal air temperatures change afterwards?’ is
devoted to gain qualitative insights to explain the change of internal temperatures
after retrofit insulation.
Chapter 8 ‘Discussion’ brings together all the result chapters and discusses the
findings in comparison with the main assumptions reviewed in Chapter 2. It reflects
on the theoretical and practical methodological limitations so providing a critical
light on the methodology and ways for improving it.
Chapter 9 ‘Conclusion’ starts with a summary of the thesis and brings this thesis to
a close by summarising the key findings, contribution to the knowledge and it draws
out the main recommendations for future studies and projects.

20
Figure 1.1. Structure of the thesis
1.8. Summary
This chapter first introduces the research problem and explains some key terms in
order to clarify some concepts that are used through the thesis. Secondly, it reviews
the current energy efficiency policy and outlines the research questions and research
aim/objectives to understand the effect of building fabric investments on space
heating consumption in a high-rise social housing building. This chapter also
describes the scope, limitations and structure of the thesis, which is structured into
five sections that comprise nine chapters.

21
2. Chapter 2. Literature Review
2.1. Introduction
This chapter is divided into two parts. The first part introduces the building retrofit
under the current paradigms. Indeed, Section 2.2 explains the building retrofit
motivation and cost-benefit evaluation strategy for upgrading domestic buildings in
the UK. In addition, Section 2.2 also reviews the thermal-performance metrics used
to describe the energy efficiency upgrades of dwellings such as U-value and SAP.
Section 2.3 reviews the causes that might create discrepancies between energy-
modelling predictions and actual energy saving, pre- and post-retrofit, such as:
miscalculation of physics-based models, technical failures, occupant factors and
temperature take-back, therefore introducing in this section the temperature take-
back concept. Section 2.4 presents the main research assumptions related to
temperature take-back and energy consumption. Thus, in this chapter current
research assumptions are presented and summarised so as to provide a context for
the study’s research questions and results.
The research assumptions are broken down into the following six stages:
Energy consumption saving and temperature take-back;
Temperature take-back and low-income dwellings;
Temperature take-back and saturation effects;
Temperature take-back and CO2 savings;
Temperature take-back, and the relationship between physical factors and
occupant behaviour;
Temperature take-back and occupant behaviour in the retrofit context.
The second part of this chapter (Section 2.5) provides a summary of the main
theoretical approaches that might be used to explain the reason for temperature take-
back in the domestic sector such as: economic, engineering/ physics-based model
approaches and thermal comfort models. This part of the chapter also reviews work

22
in this area undertaken by previous research by using a quasi-experimental
approach and presents the rationale for the selection of the quasi-experimental and
qualitative approaches used in the current study.
2.2. Building Retrofit
This section firstly provides a review of the building retrofit motivations. Secondly,
this section reviews the main building retrofit insulation strategy for upgrading
domestic building in the UK. Thirdly, this section reviews the retrofit insulation
for building envelopes, revising the internal and external insulation available for
each wall type. Following this, thermal performance metrics used to describe the
energy efficiency upgrades of dwellings such as U-value are revised in Section
2.2.4. Finally, Sections 2.2.5 and 2.2.6 examine the existing building regulations
when renovating existing residential dwellings in England and the compliance
mechanism for building retrofit under SAP 2012.
2.2.1. Building retrofit motivations
The primary motivation for domestic retrofit insulation is to reduce CO2 emissions.
In the UK, more than 25% of the CO2 emission are attributed to domestic energy
use, in which energy for heating is by far the biggest contributor (Palmer and
Cooper, 2012). Retrofit insulation is particularly important in the UK because most
of the residential buildings were constructed before 1980 with relatively low levels
of energy efficiency (Sweatman and Managan, 2010). England’s housing stock
comprised 23.4 million dwellings in 2014, of which the social housing stock is
made up of over 4 million dwellings (17% of the stock); approximately 2.4 million
owned by housing associations and 1.7 million owned by local authorities (DCLG,
2016a). The housing stock is made up of a range of diverse housing types and sizes,
of which 6% of the social housing stock are high-rise flats (DCLG, 2016b).
According to the Association for the Conservation of Energy (ACE), the UK’s
dwellings stock is one of the most energy inefficient stock in Europe, performing
poorly in how much heat they lost through their walls, floors, roofs and windows
(U-value) (ACE, 2013; ACE, 2015) and with the largest components of older

23
buildings (Buildings Performance Institute Europe, 2011). The average SAP rating
of the dwelling stock was 62 in 2015 (moderate SAP rating Band D). Although
from 1996 to 2015 the average SAP rating of the dwelling stock has improved 45
points (DCLG, 2017b), the large majority of the dwellings are still under the
reasonable standard of energy efficiency SAP rating Band C. Moreover,
approximately 5 million of dwellings in England are still rated with a poor SAP
Rating below 54 (SAP rating Band E, F, G) (DCLG, 2017a). (See SAP rating in
Table 2.8 in p.42).
The second motivation for domestic retrofit is to increase the energy security
through reduced space heating demand. The third motivation is the reduction of
fuel poverty, caused by the combination of inefficient dwellings, high energy cost
and low income. However, the ability of energy efficiency upgrades (including
building retrofit insulation) actually to deliver real reductions in space heating
consumption (hereby CO2) and fuel poverty has not been always achieved,
particularly in low-income dwellings (see more in detail in Section 1.3).
2.2.2. Building retrofit insulation strategies
Retrofit insulation strategies aim to reduce space heating consumption through the
reduction of thermal transmittance of building envelopes (i.e. external walls, floor
and roof areas, etc.). Previous retrofit schemes had been implemented through a
cost-benefit strategy, which in many cases had led to focus on energy-efficient
measures such as loft insulation or cavity wall insulation, so-called ‘low hanging
fruit’ (Rosenow and Eyre, 2014).
A cost-benefit strategy considers energy efficiency upgrades for which the payback
period does not exceed the predicted energy efficiency measure’s lifespan. For
example, Shorrock et al. (2005) reviewed the potential for energy saving
investments applied to a typical 3-bedroom semi-detached house in the UK. The
study estimated that loft insulation to 300 mm, with less than 150 mm of insulation
already in place, and cavity wall insulation might have payback periods that do not
exceed the predicted energy efficiency measure’s lifespan (low and high capital
costs), therefore justifying the capital investment based on the energy saving
calculated with high and low capital costs of wall insulation.

24
A cost-benefit strategy tends also to maximize the capital investment, hereby many
energy efficiency measures, such as loft insulation to 300 mm (currently 70 mm or
100 mm) or solid wall insulation are not desirable under this strategy, calculated
with high capital costs. For example, the solid wall insulation payback period
ranges from 9 to 22.5 years, a long-term payback. These data are shown in Table
2.1.
Capital Cost Annual
savings
Lifetime Lifetime
saving
Payback period
(£) (£/year) (years) (£) (years)
Retrofit measure low1 high1 low1 high1
Loft insulation to 300 mm
(currently 0 mm) 138 273 86.2 30 2586 1.6 3.2
Loft insulation to 300 mm
(currently 50 mm or less) 137 254 38.21 30 1146 3.6 6.6
Loft insulation to 300 mm
(currently 70 mm) 103 223 15.5 30 465 6.6 14.4
Loft insulation to 300 mm
(currently 100 mm) 86 211 11.26 30 338 7.6 18.7
Loft insulation to 300 mm
(currently 150 mm) 69 199 5.39 30 162 12.8 36.9
Loft insulation to 300 mm
(currently 200 mm) 35 170 2.7 30 81 13.0 63.0
Cavity wall insulation
(pre-1976) 300 325 80.1 40 3204 3.7 4.1
Cavity wall insulation
(post-1976) 300 325 47.1 40 1884 6.4 6.9
Solid wall insulation 1309 3272 145.6 30 4368 9.0 22.5
1 Low and high estimates of the capital costs of measures
Assumptions: No grant available. Take back: 30% of the energy savings. Payback
calculations: simple return on investment calculation.
Table 2.1. Pay-back period for energy saving investments in the UK applied to a
typical 3-bedroom semi-detached house. Source: Shorrock et al. (2005)
This cost-benefit strategy, combined with a slow-down in the rate of the installation
of energy efficiency upgrades in buildings from 2013 onwards, has created a real
challenge for meeting energy efficiency targets. Energy efficiency measures will
tend to be less viable under a cost-benefit decision, as the ‘low hanging fruits’ have

25
already been picked. For example, there is a high remaining potential for cavity
wall insulation, loft insulation and solid wall insulation; however, a large proportion
is considered hard-to-treat or unfillable. According to BEIS (2017) there are
approximately 5.4 million homes across the UK without cavity wall insulation, 1.3
million of these are hard-to-treat homes. 8.1 million uninsulated lofts15, of these,
around 2.3 million are hard-to-treat or unfillable (ibid., 2017). Unfillable cavities
mean the loft would be hard/costly to insulate or cannot be insulated (ibid., 2017).
Approximately one-third of properties have solid walls in the UK, which are also
considered hard-to–treat, and the vast majority of these homes (7.8 million) have
no wall insulation (ibid., 2017). See data in Table 2.2.
Energy
efficiency
measures
Insulated1 Uncertainty
2
Remaining
potential3
Remaining
potential of
which:
Total
properties
Easy
to treat
Hard to
treat
Cavity wall
insulation 13,291 504 5,444 4,120 1,324 19,239
Loft
insulation 15,783 22 8,126 5,815 2,311 23,931
Solid wall
insulation 718 7,785 8,502
1 Properties with full insulation.
2 Properties which may or may not have insulation.
3 This includes some properties with partial insulations. Not all remaining potential
properties could be insulated or cost-effective to insulate.
Table 2.2. Remaining potential cavity wall insulation, loft insulation and solid
wall insulation, December 2016. Source: Table 4.4, Table 4.5 and Table 4.6
from BEIS (2017).
Hard-to-treat 16 properties represent a real challenge for meeting energy
efficiency targets, because they cannot be insulated in a cost-effective way
15 Lofts without at least 125 mm of insulation 16 ‘Hard to treat’ includes dwellings off the gas network, without loft and also high-
rise flats. BRE (2008) A study of hard-to-treat homes using the English house
condition survey, Part 1 – dwelling and household characteristics of hard-to-treat
homes. London: Building Research Establishment Limited.

26
(BRE, 2008). Similarly, high-rise buildings (flats with more than six storeys),
predominantly (78%) built post-war, can also be seen as hard-to-treat due to
poor physical condition, lack of maintenance and lack of gas supply (BRE,
2008), in particular, buildings constructed from 1953 to 1972 (Beaumont,
2007). There are 326,000 dwellings in high-rise buildings, 4% of the total hard-
to-treat stock (ibid., 2007).
2.2.3. Retrofit insulation for building envelopes
Retrofit insulation for building envelopes can be classified according to the types
of wall construction; there are retrofit insulations aimed at solid-walled dwellings
and cavity-walled dwellings (EST, 2010). Solid-walled dwellings usually have
been built before the 1930s of masonry material with a wall width equal or greater
than 9 inches (Hulme and Beaumont 2008 as cited in Milsom, 2014). External walls
are made of brick, block, stone or flint without a cavity (DCLG, 2013). Cavity-
walled dwellings have usually been built from the late 1920s onwards with two wall
layers of masonry (brick or block) separated by a gap (a cavity) (EST, 2010)17. In
mid-1970 the building regulations required a maximum wall U-value of 1.0 W/m2K
(ibid., 2010). See the evolution of wall construction in Table 2.3.
Solid-walled dwellings
External wall insulation (EWI) and internal wall insulation (IWI) might both be
suitable for solid-walled dwellings. Particularly external wall insulation might be
a better option if it is desirable to keep the same internal space and improve the
exterior appearance. In addition, EWI has a lower risk of moisture and
condensation, and heat loss is slower than IWI. However, it tends to be more
expensive than IWI and it can also have a significant impact on the appearance of
the building, which may not be suitable for heritage buildings. It also has
restrictions on the execution of work such as the weather. IWI tends to be cheaper;
17 Although houses built after 1930 may have built with cavity walls.

27
however, it might have problems with moisture build-up, condensation and cold
bridges in the installation.
Time Description
19th century Houses walls of at least one-brick thickness
Stone used for prestigious buildings or in areas where it was
available.
1920s-1930s Solid wall still dominates, but cavity wall became the accepted
form of construction (cavity width 50 mm-100 mm)
1940s-1960s Cavity width became standardised at 50 mm and mortars
gradually became cement-based rather than lime-based. Also
non-traditional construction (pre-cast frames, panels)
1970s-1980s Insulation standards slowly improved. In 1972, a maximum 'U'
value of 1.70 was introduced. In 1980, the maximum U value
dropped to 1; this required lightweight blockwork in the inner
leaf. From this period to the present day most lightweight
blocks have been made from aerated concrete.
1990 onwards Full-fill cavity-wall insulation is dominant (cavity width 50-
100 mm)
Table 2.3. Evolution of wall construction in the UK. Source: based on Table 4
from EST (2010) and University of West England, 2009 (UWE, 2009).
External wall insulation (EWI)
EWI involves an insulation layer applied to the existing wall, and a protective
render and/or decorative cladding (i.e. clays, stones, etc.) (EST, 2010). EWI usually
is installed by a contractor (Milsom, 2014) and the system is approved by a suitable
independent authority. The Insulated Render and Cladding Association (INCA) has
a register of authorized contractors/systems (EST, 2010). In general, an EWI
system consists of the following components: adhesive, fixing/mechanical anchors,
28
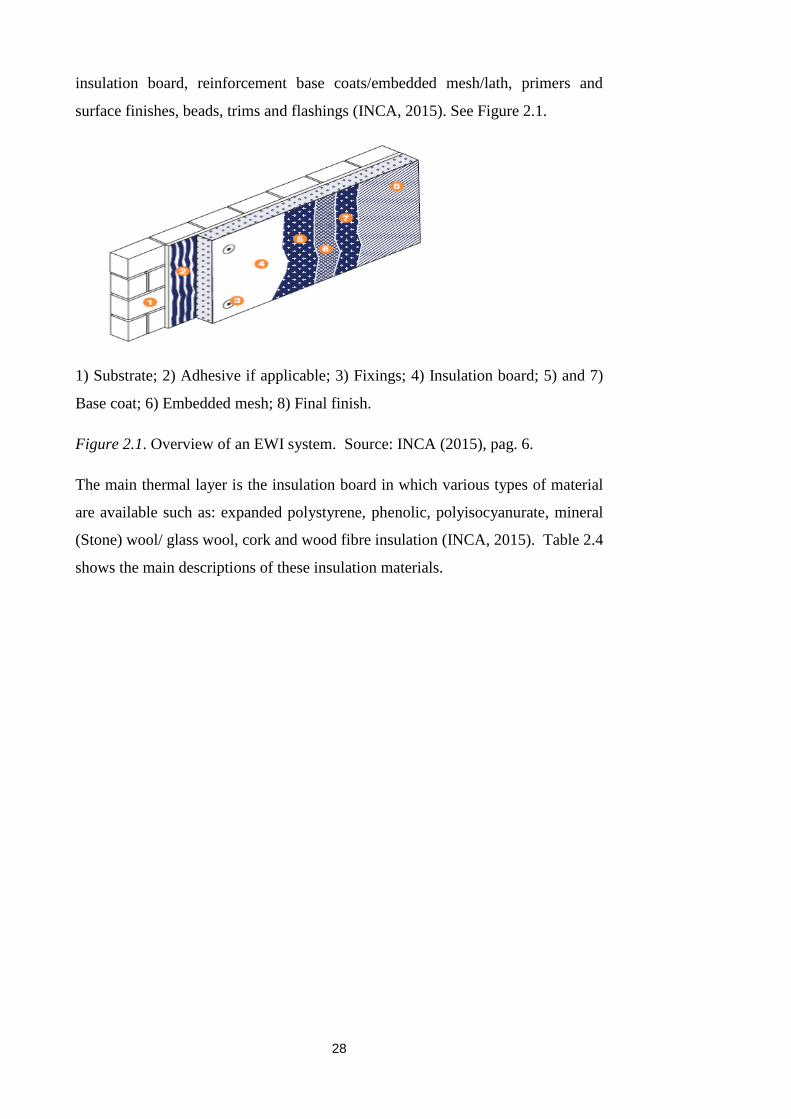
insulation board, reinforcement base coats/embedded mesh/lath, primers and
surface finishes, beads, trims and flashings (INCA, 2015). See Figure 2.1.
1) Substrate; 2) Adhesive if applicable; 3) Fixings; 4) Insulation board; 5) and 7)
Base coat; 6) Embedded mesh; 8) Final finish.
Figure 2.1. Overview of an EWI system. Source: INCA (2015), pag. 6.
The main thermal layer is the insulation board in which various types of material
are available such as: expanded polystyrene, phenolic, polyisocyanurate, mineral
(Stone) wool/ glass wool, cork and wood fibre insulation (INCA, 2015). Table 2.4
shows the main descriptions of these insulation materials.

29
Material Description
Expanded
polystyrene
Lightweight, rigid, plastic foam insulation material.
Phenolic Phenolic foam is closed cell insulation, formed by the
evaporation of a high-performance blowing agent; it has good
fire resistance properties, but is classed as combustible.
Polyisocyanurate
(PIR)
PIR foam is closed cell insulation; it has good fire resistance
properties, but is classed as combustible.
Mineral (Stone)
Wool/ Glass
Wool
Manufactured from molten rock or silica sand heated and blown
to form thin fibres with binders and oils. Excellent fire resistant
properties, classed as non-combustible.
Cork Cellular structure which makes it a natural insulator. It has good
fire resistance properties, but is classed as combustible.
Wood Fibre
Insulation
Manufactured from wood chippings and natural binders. It is
both vapour permeable and hygroscopic.
Table 2.4. Description of insulation materials. Source: INCA (2015)
Internal wall insulation (IWI)
There are three main techniques for IWI: insulation that can be applied with rigid
insulation plasterboards18 (Figure 2.2) or between and across a studwork frame
(Figure 2.3) (fitted between battens) or a combination of both (EST, 2010; Thorpe,
2013). Rigid insulated plasterboard can achieve a high-thermal performance and
may include a water vapour barrier to avoid condensation (EST, 2010).
18 e.g. thermal insulation board such as polystyrene or polyurethane.

30
Figure 2.2. Rigid insulation plasterboard technique. Source. Based on Figure 1
from EST (EST, 2002)
The second technique, the insulation is fitted between and across a studwork frame,
which can be made of timber or steel (EST, 2002). Once the insulation has been
installed, a new sheet of plasterboard is then fitted to the battens (Milsom, 2014).
Materials such as polystyrene, polyurethane or mineral wool (or similar) can be
used to insulate (ibid., 2014). See Figure 2.3.
Figure 2.3. Studwork frame insulation, fixed to battens and counter-battens. Based
on Figure 5 from EST (EST, 2002).
Cavity-walled dwellings
Cavity wall insulation for cavity-walled dwellings is considered the most cost-
effective insulation measure (EST, 2010). Unfilled cavity walls are filled to reduce
the heat loss through the walls (ibid., 2010). Materials such as blown mineral wool

31
(rock wool or glass wool) and bonded polystyrene beads are suitable to be injected
into the cavity (Milsom, 2014).
2.2.4. Building retrofit thermal performance metrics
Thermal performance of insulation materials is often represented by physical
metrics such as the U-value. Thermal transmittance or the U-value can be defined
as the “Heat flow rate in the steady state divided by area and by the temperature
difference between the surroundings on each side of a system” (British Standards
Institution, 1996, p. 5). The rate of heat transfer is expressed in W/m²K (i.e. watts
of heat lost per square metre per degree). U-values are used to describe the tendency
of walls to lose heat. This value tells how well an element (e.g. windows, walls)
insulates, thus a well-insulated wall will have a low U-value. According to ISO
7345 (British Standards Institution, 1996) the U-value is calculated using the
following equation:
U = 𝚽
(𝑻𝟏−𝑻𝟐)𝑨 Equation 2-1
Where:
A = area (m2);
T1 and T2 are the reference temperatures (K);
Φ = the rate of heat loss (W).
Although U-value measurement can be obtained by measuring the difference in
temperature on both sides of the wall under steady state conditions, for existing
walls a simplified procedure for U-value calculation (thermal transmittance) can be
implemented for thermally homogenous or inhomogeneous layers, which may
contain air layers up to 0.3 m thick and metal fasteners (British Standards
Institution, 2017).
For a homogeneous layer the thermal resistance of a component is calculated as:
𝐑 =𝐝
𝝀 Equation 2-2
Where:

32
R = thermal resistance of a component in m2K/W;
d = thickness of the layer in the component;
𝜆 = design thermal conductivity of the material.
And therefore:
U =𝟏
𝑹𝒕𝒐𝒕 Equation 2-3
Where:
U = thermal transmittance in W/(m2·K);
Rtot = the total thermal resistance in m2·K/W.
As a wall can have different layers (i.e. brick, plasterboard, etc.) the total thermal
resistance of consisting of homogeneous layers is calculated by the following
expression:
Rtot = Rsi + R1 + R2 + ...+ Rn + Rse Equation 2-4
Where:
Rsi = internal surface resistance; m2·K/W;
R1, R2 ... Rn = the thermal resistances of each layer; m2·K/W;
Rse = external surface resistance; m2·K/W;
Standardised assumptions are used for U-value calculations of existing walls as
published in Appendix S – SAP 2012 (BRE, 2014). For example, a 220 mm solid
brick wall is assumed to have a U-value of 2.1 W/m²K (see more detail in Table S6,
BRE (2014)) and therefore an upgraded 220 mm solid brick wall will have a lower
U-value. Table 2.5 provides an example of the change of U-values for an upgraded
220 mm solid brick wall using thermal laminated plasterboard or in-situ applied
closed-cell insulation (typical thermal conductivity insulation of 0.035 W/mK).
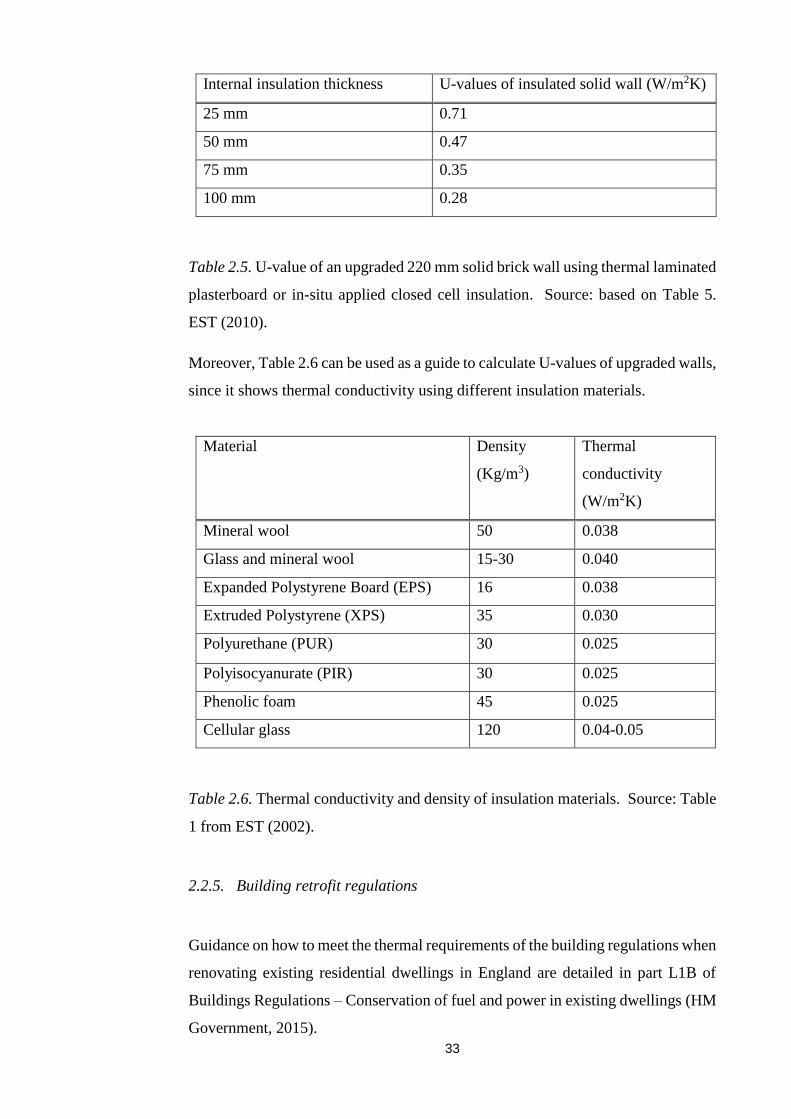
33
Internal insulation thickness U-values of insulated solid wall (W/m2K)
25 mm 0.71
50 mm 0.47
75 mm 0.35
100 mm 0.28
Table 2.5. U-value of an upgraded 220 mm solid brick wall using thermal laminated
plasterboard or in-situ applied closed cell insulation. Source: based on Table 5.
EST (2010).
Moreover, Table 2.6 can be used as a guide to calculate U-values of upgraded walls,
since it shows thermal conductivity using different insulation materials.
Material Density
(Kg/m3)
Thermal
conductivity
(W/m2K)
Mineral wool 50 0.038
Glass and mineral wool 15-30 0.040
Expanded Polystyrene Board (EPS) 16 0.038
Extruded Polystyrene (XPS) 35 0.030
Polyurethane (PUR) 30 0.025
Polyisocyanurate (PIR) 30 0.025
Phenolic foam 45 0.025
Cellular glass 120 0.04-0.05
Table 2.6. Thermal conductivity and density of insulation materials. Source: Table
1 from EST (2002).
2.2.5. Building retrofit regulations
Guidance on how to meet the thermal requirements of the building regulations when
renovating existing residential dwellings in England are detailed in part L1B of
Buildings Regulations – Conservation of fuel and power in existing dwellings (HM
Government, 2015).

34
The requirement of this regulation is that:
Reasonable provision shall be made for the conservation of heat and power
in buildings by: limiting heat gains and losses – i) through thermal elements
and other parts of the building fabric; and ii) from pipes, ducts and vessels
used for space heating, space cooling and hot water services; ...
(HM Government, 2015, p. 5).
The L1B regulation sets energy efficiency requirements where renovation work is
at least 50% of a thermal element or 25% of the entire building envelope (HM
Government, 2015). Renovation of thermal elements (i.e. wall, floor or roof), is
either provided by a new layer or the replacement of an existing layer, but it does
not include windows, doors, roof windows or roof-lights (ibid., 2015).
A new layer could include the following activities: cladding, rendering, plastering
or dry-lining a thermal element, while an existing layer could be replaced by
stripping down the thermal elements and then rebuilding it to achieve the thermal
performance or replacing the waterproof membrane on a flat roof (HM
Government, 2015).
Table 2.7 shows the minimum standards for heat loss that need to be achieved for
upgrading walls, floors and roofs. For example, if the existing U-value of a wall is
over 0.70 W/m2K (the U-value threshold), the improved U-value should be equal
or less than 0.3 W/m2K for external or internal insulation (the lower the U-value the
better). Nevertheless, if it is not technically, functionally or economically feasible
to meet the standard given in Table 2.7, the thermal element should be upgraded to
a lower possible U-value achievable within a 15 year payback. In addition,
traditional and historic buildings are exempt from complying with Part L of the
Buildings Regulations in situations where it would be detrimental to the character
and appearance of the building.

35
Retrofit measures Threshold U-value
W/(m2*K)
Target U-value
W/(m2*K)
Wall – cavity insulation 0.70 0.55
Wall – external or internal
insulation
0.70 0.30
Floor 0.70 0.25
Pitched roof – insulation at
ceiling level
0.35 0.16
Pitched roof – insulation at rafter
level
0.35 0.18
Flat roof or roof with integral
insulation
0.35 0.18
Table 2.7. Minimum standards for heat loss that need to be achieved for upgrading
walls, floors and roofs in Building Regulations part L1B – Conservation of fuel and
power in existing dwellings. Source: Table 3 – Upgrading retained thermal
elements (HM Government, 2015).
2.2.6. Building regulations compliance/SAP
The Government’s Standard Assessment Procedure (SAP) is predominantly used
for assessing compliance with Part L1 of the Building Regulations (HM
Government, 2015). SAP ratings range from 1 to 100, so that a rating of 100 is then
converted into a letter grade from A to G (ibid., 2014). The higher values or first
letters (e.g. 100 or A) represent the most energy efficiency dwellings. SAP is a
physics-based methodology that gives an output of energy use taking into account
of factors such as floor area, heating system and thermal performance of the fabric.
SAP calculation is based on the BRE Domestic Energy Model and is consistent
with the standard BS EN ISO 13790 (BRE, 2014). SAP calculates different energy
ratings such as the annual energy cost, the environmental impact rating (based on
CO2 annual emissions) and the dwelling’s CO2 emission rate (BRE, 2014). See
rating bands in Table 2.8.

36
Rating Band
1 – 20 G
21 – 38 F
39 – 54 E
55 – 68 D
69 – 80 C
81 – 91 B
92 or more A
Table 2.8. SAP rating bands. Source: ‘Table 14: Rating bands’ (BRE, 2014).
The annual energy costs are associated with space heating, water heating,
ventilation and lighting, and fewer cost savings from energy generation
technologies (BRE, 2014). For example, space heating consumption is calculated
by multiplying the dwelling’s fuel consumption by appropriate factors (e.g. heat
from biomass boilers in a community heating scheme is assumed to have a cost of
3.78 p/kWh).
The annual energy cost is converted to the SAP rating 19 , which enables
comparability of properties based on physical factors, which is independent of
occupant behaviour (such as heating demand temperatures and heating periods),
climatic inputs, the number of people in the building or ownership of domestic
appliances.
As much of this thesis is concerned with determining the changes of internal air
temperatures following retrofit, it is important to understand how SAP calculates
the mean internal temperature. Calculation of the mean internal temperature for
each month is based on pre-defined heating patterns, in which the average
temperature is obtained separately for the living area (zone 1) and elsewhere (Zone
2) (BRE, 2014). The demand temperature (Th1) in the zone 1 is 21ºC and the zone
19 ECF = deflator × total cost / (TFA + 45);
if ECF >= 3.5, SAP 2012 = 117 – 121 x log10 (ECF);
if ECF < 3.5, SAP 2012 = 100 – 13.95 x ECF
where TFA is the total floor area, m² and ECF is the energy cost factor.
37
2 demand temperature (Th2) assumes that it is usually cooler than zone 1, which
may vary depending on the heating system (i.e. for boiler systems with radiators or
under-floor heating, Th2 = 21 – 0.5 HLP20) (ibid., 2014).
2.3. Predicting energy saving from building retrofit insulation
The Warm Front scheme (Hong et al., 2006; Oreszczyn et al., 2006; Hong et al.,
2009) offered one of the main insights into the shortfall in the residential retrofit
programmes. The programme consisted of providing grants to vulnerable
households for the installation of cavity-wall insulation, loft insulation, draught
proofing and heating system. Engineering-based estimates based on BREDEM
model algorithms predicted a theoretical decrease in the energy consumption of
25%-35% after the upgrade. However, the monitored space heating consumption
pre-and post-intervention found that the energy efficiency measures had little
impact. The authors attributed this discrepancy, between the modelled and
monitored results, to errors in the monitored data or the simplicity of the model.
Errors in the monitored space heating consumption were attributed to the
disaggregation of the heating consumption (space heating and non-space heating
consumption) or to the use of non-utility fuel-based heating systems (not measured
accurately) or to the construction of the average internal air temperatures of zone 2
(rest of the house apart of living room) based on bedroom temperature. The
simplicity of the model means that the theoretical model, for predicting the energy
use, simplified the occupant’s behaviour. For example, the authors highlighted the
ventilation rate predictions, which were assumed to be dependent on the physical
characteristics of the dwellings; however, in practice, ventilation parameters depend
also on internal and external temperatures.
Other factors might also be incomplete insulation filling of exterior wall and loft
spaces, or a lower efficiency of the heating system compared with laboratory
efficiency tests, due for example to uninsulated under-floor piping or the incorrect
installation of boilers and heating controls.
20 HLP = Heat Loss Parameter, (W/m²K).

38
The difference between the actual saving achieved from the energy efficiency
measures and that estimated from theoretical models has been termed shortfall by
Sorrell et al. (2009). Figure 2.4 shows the shortfall diagram. In general, the known
reasons for the shortfall are the occupant factors with the remainder due to other
factors, such as equations (e.g. mathematical models of heat transfer), input
parameters of the physical-based models (e.g. baseline U-values) and technical
failures (i.e. installation, performance of equipment) (Sanders and Phillipson, 2006;
Sorrell et al., 2009).
Eto: energy consumption time 0. Et1 mon: monitored energy consumption time 1.
Et1 mod: modelled energy consumption time 1.
Figure 2.4. Shortfall diagram.
This section reviews evidence about the following factors that might create
discrepancies between energy modelling predictions and actual energy savings, pre-
and post-retrofit:
- Miscalculation of physics-based models (mathematical models of heat transfer
and input parameters of the physical-based models and Pre-bound effect);
- Technical failures;
- Occupant factors;
- Temperature take-back.

39
2.3.1. Miscalculation of physics-based models
It has been established that standard physical models overestimate the energy
savings from energy efficiency improvements in household heating systems by one
half or more in low-income households (Sorrell et al., 2009). This review compiles
evidence about three sources of discrepancy in the calculation of predicted
performance compared to the actual savings pre- and post- retrofit: mathematical
models of heat transfer, input parameters of the physical-based models and the pre-
bound-effect.
Mathematical models of heat transfer
Physics-based models estimate the energy heating demand by using physical laws
such as heat transfer. The mean rate of heat output over a period is estimated by
BREDEM-12 (Anderson et al., 2002) by using the following equation, which shows
the balance between heat losses against gains:
Φ = H (Tint - G/H – Text) Equation Equation 2-5 21
Where:
- Φ is the mean daily heat output from the heating system (W);
- Tint is the mean internal temperature (˚C);
- G is the mean useful gains (W) (e.g. internal gains are due to water heating,
cooking, use of lights, appliances and metabolic gains, external gains are due solar
gains);
- H is the specific heat loss for the dwelling (W/˚C);
- Text is the mean external temperature (˚C).
If there were no heating (heat output from the heating system) the internal
temperature would be higher than the external temperature due to external and
internal gains.
G = H (Tint – Text) E Equation 2-622
21 BREDEM Anderson, B.R., Chapman, P.F., Cutland, N.G., Dickson, C.M.,
Doran, S.M., Henderson, G., Henderson, J.H., Iles, P.J., Kosmina, L. and Shorrock,
L.D. (2002) BREDEM-12 Model description: 2001 update. Garston, Watford, UK. 22 BREDEM ibid., 2002.

40
Tint = G/H + Text Equation 2-723
Space heating is needed to raise the internal temperature (Tint) to the desired
internal temperature (Anderson et al., 2002). In theory, with a steady state
condition, the space heating needed to raise the internal temperature to the desired
internal temperature should be less following building fabric, as the heat loss for
the dwelling (H) decreases24 . BREDEM will assume a fixed heating demand
temperature and periods. For zone 1, the living room, the heating demand
temperature (thermostat heating) is 21°C, while the heating period is 9 hours on
weekdays (07:00-09:00 hrs, 16:00-23:00 hrs), and 16 hours at weekends (07:00-
23:00) (Anderson et al., 2002; Huebner et al., 2013a). Outside these time periods
the heating is assumed to be off (Anderson et al., 2002; Huebner et al., 2013a) (see
Figure 2.5).
For estimating potential savings from retrofit interventions, the same heating
demand temperature is assumed for before and after retrofit. Thus, in theory, the
space heating needed post-retrofit to raise the internal temperature to the desired
internal temperature should be less than pre-retrofit. Therefore, for example: gas
use for home heating may be reduced by insulating the walls or roof.
23 BREDEM ibid., 2002.
24 Changes in the cooling rate following retrofit are not reviewed for simplicity.

41
Figure 2.5. Internal temperature profile used in BREDEM-based model. Source:
reproduced from figure 10.1 of BREDEM-12 (Anderson et al., 2002).
Therefore BREDEM’s ‘standardised’ occupant influence assesses the building’s
performance independently of occupant effects (Huebner et al., 2013a). In practice,
however, there is not a fixed heating demand. Heating demand temperature and
heating periods following retrofit may be higher or lower depending on how people
actually use heating.
Input parameters
Another source of error of the physics-based models is the input parameters such
as the fabric and ventilation heat loss. For example, Milsom (2014) reviewed
evidence from different studies to understand how the heat is lost through solid
walls. The review pointed out that the difference between predicted and
experimental behaviour of walls in existing dwellings is due to erroneous
representations of the baseline performance (ibid., 2014). The review highlighted
that the U-value of materials determined from the current methodology and the
influence of moisture content may not be able to represent the baseline performance
of materials, in particular pre-1919 dwellings and traditional buildings (ibid., 2014).
Pre-bound effect
Regarding the difference between the actual savings achieved from the energy
efficiency measures and that estimated from the physics-based models, Galvin and
Sunikka-Blank (2013) noted that this can also be attributed to a smaller energy
consumption prior to the upgrade. The authors noted that German occupants
consume, on average, 30% less heating energy than predicted by theoretical models
(as physical-based models); this has been termed the pre-bound effect (Sunikka-
Blank and Galvin, 2012).
The pre-bound effect is defined as “the tendency to consume less energy than the
calculated rating” (Galvin and Sunikka-Blank, 2013, p. 76). This is referred to as
“the situation before a retrofit, and indicates how much less energy is consumed
than expected. As retrofits cannot save energy that is not actually being
consumed…” (Sunikka-Blank and Galvin, 2012, p. 265).

42
The authors particularly reported that low-income occupants, in poorly insulated
dwellings, consume less energy prior to the upgrade than the predicted energy
consumption using normative assumptions (Galvin, 2015).
2.3.2. Technical failures
Other factors that may cause the difference between predicted performance
compared to the actual saving following retrofit insulation are the construction
quality of the retrofit work (Milsom, 2014; Galvin, 2015). For example, some of
the construction aspects studied are:
- Gaps in the insulation (Galvin and Sunikka-Blank, 2014), for example, the
insulation gap in some areas of the walls (Hong, 2011);
- Building skills (Galvin, 2015) that may affect, for example, the specifications or
the execution of details at junctions (Milson, 2014).
A significant technical error in the construction could jeopardise the achievement
of the predicted saving. Both the design and the implementation of quality control
systems are central to ‘bridge the gap’ between predicted fabric performance and
actual savings.
2.3.3. Occupant factors
Occupant behaviour can be seen as “The proportion of the change in internal
temperature that derives from adjustments of heating controls and other variables
by the user (e.g. opening windows), or the reduction in energy savings associated
with those changes” (Sorrel et al., 2009, p.1358). Therefore, it covers occupants’
adaptive actions such as opening/closing windows, putting on/taking off clothing
layers, adjusting solar shading, drinking warm fluids, switching on/off heating and
adjusting heating controls (e.g. adjusting thermostat controls, zoning controls, how
many rooms are heated, etc.).

43
Occupant behaviour has an influential effect on energy consumption, therefore
unrealistic occupant behaviour parameters embedded in the theoretical models
might lead to a difference between the actual and the estimated energy savings from
retrofit interventions. For example, standardised occupant behaviour parameters
such as the use of a fixed temperature in the theoretical models for all insulation
levels leads to an inaccurate predictions of energy savings, when for example, a
pre-intervention internal temperature of 18°C is assumed in poorly insulated
dwellings (Deurinck et al., 2012). Furthermore, the ways that users achieve
comfort in the houses differ from occupants, for example, opening windows to
provide fresh air during winter while having the heating system switched on
(Sharpe and Shearer, 2012).
2.3.4. Temperature take-back
In terms of household heating, the term temperature take-back has been used to
explain the predicted energy consumption saving converted into an increase of
internal temperature. Temperature take-back is defined as “the change in mean
internal temperatures following the energy efficiency improvement, or the
reduction in energy savings associated with that change” (Sorrell et al., 2009, p.
1358).
Previous studies have showed the temperature take-back, especially in poorly
insulated houses (Hong et al., 2006; Hong, 2011; Shipworth, 2011), ranges from
0.4°C to 0.8°C (Sorrel, 2007). However, temperature take-back cannot be equated
with occupant behaviour, since only a part of temperature take-back is accounted
for by the occupant’s behavioural change and the remainder by the physical factors.
(Sorrell, 2007; Sorrell et al., 2009).
2.3.5. Summary of the difference between predicted performance and actual
saving
This section explained the difference between predicted performance and actual
saving based on: (i) miscalculation of physics-based models due to heat-loss

44
equations, input parameters (e.g. U-values) and lower pre-retrofit energy uses than
estimated (Pre-bound effect); (ii) technical failures affecting construction quality of
the retrofit work; (iii) occupant factors, in which unrealistic occupant parameters
embedded in theoretical models lead to a difference between the actual and the
estimated energy savings from retrofit interventions; and (iv) temperature take-
back.
2.4. Research Assumptions
2.4.1. Energy consumption saving and temperature take-back
The study’s primary assumption is that the reduction in energy-consumption
savings through temperature take-back exists and can be observed. This is based
on previous quantitative studies, for example Sorrell (2007) brought together a
meta-review of 15 quasi-experimental studies of household heating consumption
and concluded that the temperature take-back ranged from 0.4°C to 0.8°C. Hence,
this may imply that a 1°C increase of the internal temperature led to approximately
10% of space heating consumption (Sorrell, 2007).
Oreszczyn et al. (2006) reported from a Warm Front Scheme study that heating and
insulation measures increased internal temperatures by 1.6°C in living rooms (day
time) and 2.8°C in bedrooms (night time) (under standardized external temperature
of 5˚C). Hong (2011), also from a Warm Front study, reported that following the
energy efficiency upgrades the internal air temperature increased by 1.6°C and fuel
consumption increased by 12%. The mean standardised internal temperature varied
depending on the energy efficiency measure type as follows: with full insulation by
0.73°C (95% CI: 0.26, 1.20), central heating by 2.28°C (95% CI: 1.81, 2.75) and
full insulation and central heating by 3.11°C (95% CI: 2.25, 3.98)25 (Hong, 2011) .
25 Summarised from Table 8.3, a comparison of mean monitored standardized
internal temperature (‘Tmon’), p.185, Hong (2011). Full insulation criteria = full
cavity-wall insulation (≥50mm) + full loft insulation (≥100mm) (Hong, 2011, p.68).

45
2.4.2. Temperature take-back and low-income dwellings
Several studies have proposed that temperature take-back is usually higher in
dwellings occupied by low-income householders (Milne and Boardman, 2000;
Sorrell, 2007). One suggested reason is that financial constraints would lead to low
pre-intervention temperatures (Milne and Boardman, 2000). This, combined with
a post-intervention increase of the internal temperature as a result of the unfulfilled
demand, would lead to a higher temperature take-back. Milne and Boardman
(2000) suggested that in low-income dwellings the potential energy-consumption
saving is achieved when pre-intervention internal temperatures are around 19˚C-
20˚C. Milne and Boardman’s results are reproduced in Table 2.9, where pre-
intervention temperatures are shown along with the % of theoretical energy-
consumption saving achieved.
The relationship between household income and temperature take-back is not
always apparent and could be also confounded by pre-intervention internal
temperatures (Sorrell et al., 2009). Therefore, pre-intervention internal
temperatures may be the underlying factor that explains temperature take-back
rather than low income.
Pre-intervention temperature (◦C) Theoretical energy-consumption saving
(%)
14 54
16 66
18 78
20 90
Table 2.9. Pre-intervention temperatures and theoretical energy-consumption
savings from p.420 of Milne and Boardman (2000).

46
2.4.3. Temperature take-back and saturation effects
Temperature take-back may operate independently of socio-economic
characteristics when internal air temperatures saturate (approaching 21ºC). Sorrel
suggested that temperature take-back decreases owing to the saturation effect when
pre-intervention temperatures saturate (approaching 21ºC) (Sorrell, 2007). In other
words, adding more energy efficiency to the household will, at some point, when
internal temperatures approach a maximum level for thermal comfort, yield lower
incremental energy-consumption saving. This has been conceptualised as the
saturation effect, which is defined as:
The reduction in the pace of increase in the level of service required, as
the gap between the effective level of service and the comfort level is
reduced (e.g. when the effective heating temperatures reaches 22°C)
(Maxwell et al., 2011, p. 34).
The saturation effect does not imply that adding more energy efficiency will not
decrease the energy consumption for space heating, rather it may imply that it is
negligible in absolute terms.
2.4.4. Temperature take-back and CO2 savings
Some authors have also noted that the reduction of the energy savings associated
with the extra warmth obtained from energy efficiency improvement might have a
detrimental influence on the cost per tonne of CO2 saved. Jenkins (2010) estimated
that a reduction of 30% of energy consumption saving through temperature take-
back will lead to an increase between £3,220/tCO2 and £14,640/tCO2 saved.
2.4.5. Temperature take-back, and the relationship between physical factors and
occupant’s behaviour factor
Research studies have theorised that a part of the temperature take-back is
accounted by the physical factors (i.e. building fabric retrofit insulation and heating

47
system) and the remainder by the occupant’s behavioural change (Sanders and
Phillipson, 2006; Sorrell, 2007). Sorrel, for instance, estimated that temperature
take-back appeared to average between 0.4ºC and 0.8ºC, of which physical
characteristics accounted for nearly half and behavioural change for the reminder
(Sorrell, 2007).
2.4.6. Temperature take-back and occupant’s behaviour factor in the retrofit
context
In the retrofit context research studies have theorised that physical and occupant
behaviour factors form a complex system whose interactions change and co-evolve
afterwards (Lowe et al., 2012; Love, 2014). So far, not enough empirical studies
have been carried out to identify interaction changes in the occupants’ behaviour
following fabric retrofit, as a result of temperature take-back.
Lomas (2010), based on the CaRB projects26 reported that the evidence is not
conclusive to understand the relationship between temperature take-back and
occupant behaviour in houses with double-glazing and draught stripping. The
increase in internal temperature can be explained by the physical fabric (as the
dwelling can be more easily heated) or higher space temperatures increased by
occupants (Lomas, 2010).
Other evidence has appeared from studies of how people’s lives might improve
following energy efficiency upgrades. They have proposed that, as a result of the
‘extra warmth’, occupants may adjust the use of space. Gilbertson et al. (2006), for
example, reported that the warmer environment achieved through the Warm Front
Scheme improved social interaction, wellbeing and the use of space was expanded
during the cold months. Another author also has observed that, after energy
efficiency upgrades, rooms became warm enough to perform different activities.
Galvin and Sunnika-Blank reported that at least half of the people interviewed were
26 Carbon Reduction in Buildings (CARB) is a socio-technical, longitudinal study
of carbon use in buildings.

48
occupying their dwellings more intensively (Galvin and Sunnika-Blank, 2014a, as
cited in Galvin, 2015).
The change in the use of space in old houses in Britain is denoted by Galvin (2015)
in the following quotes:
– “one [household] had installed an electric heater in a loft, as this [loft]
had become useable as a workroom now that the ceiling was insulated”
(Galvin, 2015, p. 17);
– “A large Victorian home with two occupants was now heated throughout
in every room, and daily activities had expanded to fill most of the house.
A room with a piano was used more frequently because the householder
could play without his fingers ‘freezing’ ”
(Galvin, 2015, p. 17).
For example, studies concerned with fuel poverty have suggested that people tend
to turn the heating down and/or limit heating to certain rooms to minimise fuel bill
expenditure (Anderson et al., 2010 ).
Regarding other adaptive actions such as wearing more or fewer clothes when
energy-efficient measures are introduced, it has been reported that the level of
clothes27 was slightly reduced with the introduction of energy efficiency upgrades
(Hong et al., 2009).
Regarding heating usage, Love (2014) 28 reported that thermal comfort was
achieved with fewer hours of heating per day, demand temperature increased and
daily heated hours shortened following retrofit.
It should be noted that further research is needed, as it is not possible to discern
from the current literature whether retrofitting might change the occupants’ use of
27 In comparison with the control group, the mean clothing insulation level was 0.07
less in dwellings that were fully insulated and centrally heated (Hong, 2011). 28 Study of 19 retrofitted social dwellings.
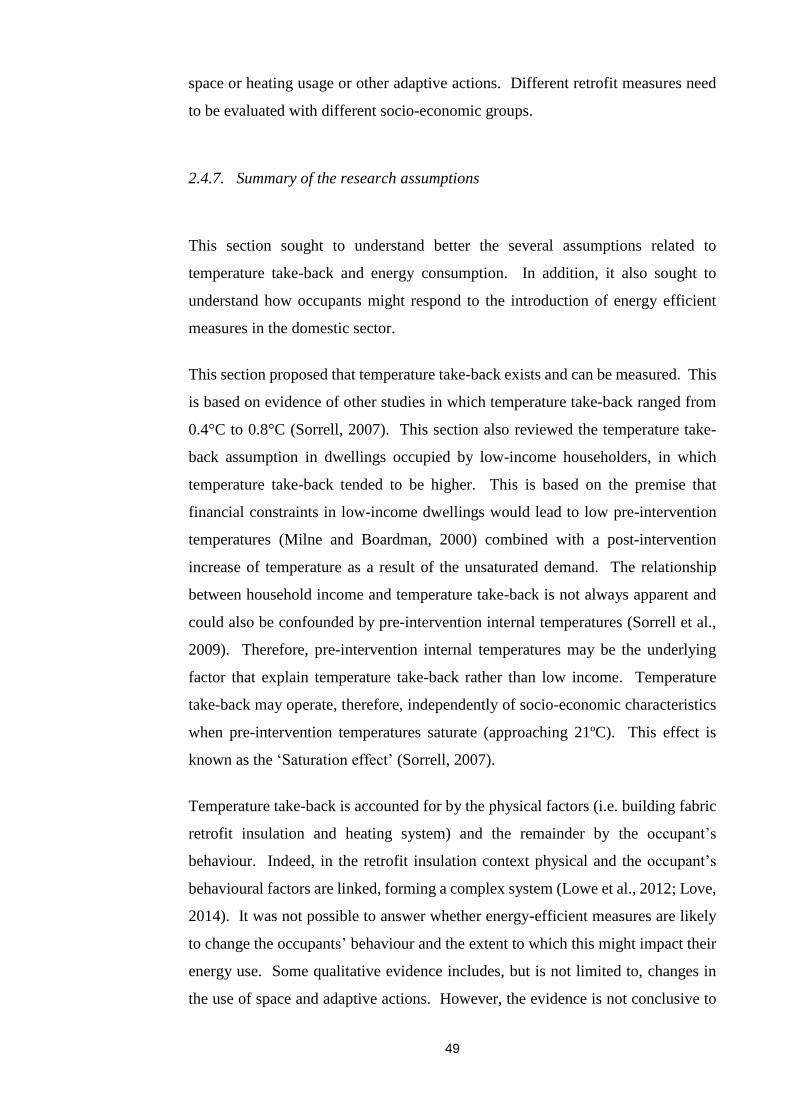
49
space or heating usage or other adaptive actions. Different retrofit measures need
to be evaluated with different socio-economic groups.
2.4.7. Summary of the research assumptions
This section sought to understand better the several assumptions related to
temperature take-back and energy consumption. In addition, it also sought to
understand how occupants might respond to the introduction of energy efficient
measures in the domestic sector.
This section proposed that temperature take-back exists and can be measured. This
is based on evidence of other studies in which temperature take-back ranged from
0.4°C to 0.8°C (Sorrell, 2007). This section also reviewed the temperature take-
back assumption in dwellings occupied by low-income householders, in which
temperature take-back tended to be higher. This is based on the premise that
financial constraints in low-income dwellings would lead to low pre-intervention
temperatures (Milne and Boardman, 2000) combined with a post-intervention
increase of temperature as a result of the unsaturated demand. The relationship
between household income and temperature take-back is not always apparent and
could also be confounded by pre-intervention internal temperatures (Sorrell et al.,
2009). Therefore, pre-intervention internal temperatures may be the underlying
factor that explain temperature take-back rather than low income. Temperature
take-back may operate, therefore, independently of socio-economic characteristics
when pre-intervention temperatures saturate (approaching 21ºC). This effect is
known as the ‘Saturation effect’ (Sorrell, 2007).
Temperature take-back is accounted for by the physical factors (i.e. building fabric
retrofit insulation and heating system) and the remainder by the occupant’s
behaviour. Indeed, in the retrofit insulation context physical and the occupant’s
behavioural factors are linked, forming a complex system (Lowe et al., 2012; Love,
2014). It was not possible to answer whether energy-efficient measures are likely
to change the occupants’ behaviour and the extent to which this might impact their
energy use. Some qualitative evidence includes, but is not limited to, changes in
the use of space and adaptive actions. However, the evidence is not conclusive to

50
identify interaction changes in the occupants’ behaviour following fabric retrofit,
as a result of temperature take-back.
2.5. Main Theoretical Approaches
This section provides a summary of the main theoretical approaches that might be
used to explain the reason for temperature take-back in the domestic sector such as:
economic, engineering/ physics-based model approaches and thermal comfort
models. This section also reviews work in this area undertaken by previous research
using the quasi-experimental approach and presents the rationale for the selection
of the quasi-experimental approach used.
2.5.1. Physics-based model approach
The physics-based model approach, also known as ‘Engineering models approach’
estimates the energy heating demand by using physical laws such as heat transfer.
In the UK, the foremost physics-based models for estimating the residential energy
demand belong to the BREDEM family (The Building Research Establishment's
Domestic Energy Model) (Anderson et al., 2002), forming the basis of the Standard
Assessment Procedure (SAP) (Kavgic et al., 2010; Huebner et al., 2013a). It is also
the most widely used model for estimating potential savings from retrofit
interventions. BREDEM models work with a series of heat-balance equations in
steady state conditions (see detail in Section 2.3.1) and other algorithms to estimate
the residential energy consumption. For example, energy consumption of lights
and appliances are based on floor area and the number of occupants (Kavgic et al.,
2010). This type of model is applied to the national and individual dwelling scales
(Love, 2014).
Other physics-based models share also the BREDEM core calculation engine such
as, for example, BREHOMES (Shorrock and Dunster, 1997), the UK domestic
carbon model (UKDCM) (Boardman et al., 2005) and DECarb (Natarajan and
Levermore, 2007). BREDEM has a modular structure which gives flexibility to
upgrade some parts to suit particular needs. At the national scale, engineering
models have been used to evaluate the uptake of energy efficiency measures
51
(Shorrock and Dunster, 1997; Natarajan and Levermore, 2007), showing that the
energy efficiency technologies could play a central role in delivering a reduction in
the carbon dioxide emissions of the domestic sector.
This type of model is applied at the national and individual dwelling scales (Love,
2014). For instance, at the national scale this approach can be seen in the uptake of
energy efficiency measures (Shorrock and Dunster, 1997; Natarajan and
Levermore, 2007), showing that the energy efficiency technologies could play a
central role in delivering a reduction in the carbon dioxide emissions of the
domestic sector, but this is a theoretical potential, so the real potential is likely to
be much less since the main drawback of the physics based approach is that it does
not capture appropriately the occupants’ behaviour. For example, (Sorrell et al.,
2009) suggested that physical models overestimate the energy savings from energy
efficiency improvements in household heating systems by one half or more in low-
income households.
2.5.2. Thermal comfort models
Thermal comfort is defined as the “… condition of mind which expresses
satisfaction with the thermal environment” (Fanger, 1970, p. 13). Principally, two
types of model have analysed thermal comfort: predictive (thermal physiology29);
and adaptive models (Humphreys et al., 2007). Predictive models simulate the
thermal sensation of occupants based on the principles set by the heat balance in
the human body. Fanger (1970) model, one of the most notable predictive models,
proposes that the human body is in a state of equilibrium; the following quote
describes the main principle.
… the purpose of the thermoregulatory system of the body is to maintain an
essentially constant internal body temperature, it can be assumed that for
long exposures to a constant (moderate) thermal environment with a
constant metabolic rate.
(Fanger, 1970, p. 22).
29 Humphreys uses the term thermal physiology to refer to predictive models.

52
Fanger (1970) summarises the heat balance in the following equation:
H − Ed − Esw − Ere − L = K = R + C Equation 2-830
Where:
H = the internal heat production in the human body;
Ed = the heat loss by water vapour diffusion through the skin;
Esw = the heat loss by evaporation of sweat from the surface of the skin;
Ere = the latent respiration heat loss;
L = the dry respiration heat loss;
K = the heat transfer from the skin to the outer surface of the clothed body;
R = the heat loss by radiation from the outer surface of the clothed body;
C = the heat loss by convection from the outer surface of the clothed body.
Fanger’s model predicts a thermal sensation with the Predicted Mean Vote (PMV)
index, which is a function of activity (kcal/hrm2), clothing (clo), air temperature
(◦C), mean radiant temperature, relativity air velocity (m/s) and air humidity
(mmHg). The thermal sensation prediction of thermal comfort is quantified by a 7-
point scale with values ranging from -3 to +3 (cold to hot, including 0 neutral).
The recommended categories for the design of mechanically heated and cooled
buildings from the International Standard ISO 7730 (British Standards Institution,
2005) are summarised in Table 2.10.
30 Fanger, P.O. (1970) Thermal comfort. Analysis and applications in environmental engineering. Copenhagen: Danish Technical Press

53
ISO 7730 Category Range of PMV PPD (%)
A −0.2 < PMV < +0.2 < 6%
B −0.5 < PMV < +0.5 < 10%
C −0.7 < PMV < +0.7 < 15%
Table 2.10. Range of PMV and PPD by building categorizations in ISO 7730:2005
(British Standards Institution, 2005).
A major limitation of the predictive model is that, in practice, thermal comfort is
not steady; people adapt their environment to feel comfortable, especially when
they have control over their thermal comfort, as in the residential arena. In the
residential arena people adapt their environment to feel comfortable using a wide
range of possibilities such as opening windows and curtains, drinking cold/warm
drinks, switching on/off heating and so on (Peeters et al., 2009). This is not to say
that they cannot be useful, but rather that it should be recognised that predictive
models are not entirely suitable for the prediction of thermal comfort in a domestic
context. For example, evidence presented by Hong et al. (2009) shows that there
are variations between the model and the actual thermal comfort perception.
The adaptive approach model, on the other hand, implicitly builds on the hypothesis
that occupants are able to change their comfort temperature (neutral) through
adjustment of actions (Nicol et al., 2012). In principle, adaptive models may be
applied to the domestic sector; however, empirical data have not been collected on
a large scale in the domestic sector to be applicable to residential buildings. For
example, the acceptable indoor temperatures for buildings is specified in the
standard EN 15251:2007 (British Standards Institution, 2007) for free-running
buildings in Table 2.11. However, this Standard is only applicable for free-running
buildings when thermal conditions are regulated by occupants (opening/closing
windows and adding/reducing clothing layers), occupants are engaged in near-
sedentary physical activities (1 to 1.3met31).
31 Metabolic rate

54
Category Upper limit * Lower limit *
Category I Θ0 = 0.33 Θrm + 18.8+ 2 Θ0 = 0.33 Θrm + 18.8 -2
Category II Θ0 = 0.33×Θrm + 18.8 +3 Θ0 = 0.33×Θrm + 18.8-3
Category III Θ0 =0.33×Θrm + 18.8 +4 Θ0 = 0.33×Θrm + 18.8 -4
*To upper-margins (10◦C to 30◦C) and to lower-margins (15◦C to 30◦C). Θ0 = limit
value of indoor operative temperature, ◦C. Θrm = external running mean
temperature, ◦C.
Table 2.11. Limits of the comfort zones by building categorizations EN 15251:2007
(British Standards Institution, 2007) for free-running buildings.
2.5.3. Economic approach
Econometric theory explores the effect of retrofit insulation on the reduction in
energy saving under the so-called ‘direct rebound effect’ (Sorrell et al., 2009).
The direct rebound effect is defined as
Improved energy efficiency for a particular energy service will decrease the
effective price of that service and should therefore lead to an increase in
consumption of that service. This will tend to offset the reduction in energy
consumption provided by the efficiency improvement.
(Sorrell and Dimitropoulos, 2008, p. 637).
The direct rebound effect is calculated as elasticities of demand, in which elasticity
is a relation between two variables that are changing in relation to each other (e.g.
energy consumption and energy efficiency). Two empirical relationships between
the rebound effect and elasticities can be identified: direct rebound effect as
efficiency elasticity and as price elasticity (Sorrell and Dimitropoulos, 2008). For
example, the direct rebound as a consequence of the price effect can be estimated
considering exogenous fuel prices (prices that householders pay to suppliers) or
endogenous (prices that consumers pay per unit of energy services). (See equations
in Annex A).

55
This approach has several advantages such as comparability from different areas
(i.e. housing, transport, heating, etc.) using the concept of elasticity (Galvin, 2015).
Econometric estimates for the direct rebound effect have provided comparable
results, and it is considered as a robust methodology (Sorrell, 2007). However, the
rebound effect depends upon how ‘behaviour’ is defined by the classic economic
theory: i.e. consumers make ‘rational’ decisions and have complete information
(Johnson, 1971; Nicholson, 2005). In addition, the rebound effect accounted as
price elasticity follows contestable assumptions of ‘symmetry’ and ‘exogeneity’.
Symmetry relies upon the assumption that “consumers respond the same way to
increases (decreases) in energy prices as to decreases (increases) in energy
efficiency” (Sorrell and Dimitropoulos, 2008, p. 639). Furthermore, regarding
‘exogeneity’, the authors reported that “most studies also assume that any change
in energy efficiency derives solely from outside the model (i.e. energy efficiency is
‘exogenous’)” (Sorrell and Dimitropoulos, 2008, p. 1362). However, in contrast, if
energy prices are considered endogenous, the effect of the direct rebound may
change as, for example, a householder may choose to heat, for example, unoccupied
rooms.
2.5.4. Summary of the main theoretical approaches
Temperature take-back can be explained with different theories such as the physics-
based, economic and thermal comfort models. The physics-based model suggests
that the space heating needed to raise the internal temperature to the desired internal
temperature should be less following the building’s retrofit, as the heat loss for the
dwelling decreases. The heating regime relies on a fixed schedule and demand
temperature. Since the point of view of economic theories, consumers decide
rationally to adapt their energy usage in response to price signals (Chatterton,
2011), therefore people might rationally decide to increase their thermal comfort
level following retrofit. Thermal comfort models, such as the adaptive approach
model, propose that people are able to change their comfort temperature (neutral)
through an adjustment of actions. However, empirical data have not been collected
on a large scale in the domestic sector to be applicable to the residential building.

56
2.6. Researching People and Buildings
2.6.1. Quasi-experimental approach
Due to the limitations given by the perspectives reviewed (economic, physics-based
model and unsuitability of the actual thermal comfort models to predict domestic
scenarios), other studies have followed the so-called physical paradigm approach.
The physical paradigm does not predetermine the occupant influences; it is based
on physical monitoring before and after the retrofit to measure the change of energy
service demand and energy input. The physical monitoring, before and after the
retrofit, is compared to a counterfactual scenario. The counterfactual helps to
portray what demand ‘would have been’ in the absence of the upgrade (Sorrel,
2015) and its value should be obtained without the use of modelling to avoid error
due to model miscalculation (such as the one described in the physics-based
models). This approach has been termed Quasi-experimental by Sorrel (2007).
In the wider term a quasi-experimental study involves
…to determine if a specific treatment influences an outcome. This impact
is assessed by providing a specific treatment to one group and withholding
it from another and then determining how both groups scored on an outcome
… that use nonrandomized designs.
(Creswell, 2009, p. 12).
Several researchers have studied the reduction in energy saving through the
temperature take-back by using a quasi-experimental design such as Oreszczyn et
al. (2006), Hong et al. (2006), Love (2014) and Hong (2011)32. For example, the
UK’s dwelling beneficiaries of the Warm Front programme were monitored for
internal temperatures in the living room and main bedroom, for 2 to 4-week periods
over two winters in five urban areas (Oreszczyn et al., 2006). The cross-sectional33
study compared temperatures in households that received retrofit insulation with
those that have not received it (Oreszczyn et al., 2006). Love (2014) used a quasi-
32 Only the monitored part of the study can be considered as Quasi-experimental.
33 This study was mainly cross-sectional.

57
experimental design to compare internal temperatures monitored before and after
retrofit insulation in 13 social dwellings. Hong (2011) used fuel consumption data
collected for 3 to 4 weeks and internal temperature data collected over two
successive winters from the Warm Front programme to compare the effect of
retrofit insulation before and after the retrofit.
Quasi-experimental studies have been useful to quantify the temperature take-back.
Sorrell (2007), who brought together a meta-review of 15 quasi-experimental
studies of household heating consumption, concluded that the temperature take-
back ranged from 0.4°C to 0.8°C, of which physical characteristics accounted for
nearly half and behavioural change for the reminder. This may imply that a 1°C
increase of the internal temperature led to approximately 10% of space heating
consumption.
However Quasi-experimental studies have been subject to criticism, in which the
lack of a counterfactual scenario in the research study design was a common
criticism or explicitly controlling for confounding variables (Sorrell, 2007).
Further, use of small sample sizes, small periods of monitoring, multiple retrofit
interventions and the self-selection of participants were also showed as barriers to
applying the results of these interventions to wider populations (Sorrell, 2007).
2.6.2. Quasi-experimental approach and qualitative approach
This study uses an integrated approach; a quasi-experimental approach and
qualitative approach. A quasi-experimental approach is used because this research
is principally interested on the study of temperature take-back following an energy
efficiency upgrade, accounted without predetermining the occupant influences.
Design issues pointed out by Sorrell (2007) are considered in the Methodological
Chapter 4. This study also uses a qualitative approach as it is interested in what are
the effects of interaction between the physical and occupant’s behavioural change
on space heating consumption following a retrofit. To date, the factors determining
energy use in buildings are complex and often poorly understood (Oreszczyn and
Lowe, 2010). Recent studies have suggested that this complexity is underpinned
by the fact that physical and occupant behavioural factors form a complex system
(Lowe et al., 2012; Love, 2014).

58
2.7. Conclusion
Building retrofit is particularly important in the UK because most of the residential
buildings were constructed before 1980 with relatively low levels of energy
efficiency (Sweatman and Managan, 2010). The primary motivation for domestic
retrofit insulation is the reduction of space heating energy use, thereby reducing
CO2 emissions. The second motivation for domestic retrofit is increasing the
energy security through reduced space heating demand. The third motivation is the
reduction of fuel poverty, caused by the combination of inefficient dwellings, high
energy cost and low income.
Energy efficiency of dwellings is often represented using physical metrics such as
the SAP rating and U-value. Similarly, normative models used to account for the
energy heating savings from energy efficiency upgrades use physical laws such as
heat transfer. However, there is a growing awareness of the difference between the
actual savings achieved from the energy efficiency measures and those estimated
from the theoretical models. This has been termed by Sorrell et al. (2009) as
shortfall. The known reasons for the shortfall are the occupant factors with the
remainder due to other factors, such as equations (e.g. mathematical models of heat
transfer), input parameters of the physical-based models (e.g. baselines U-values)
and technical failures (i.e. installation, performance of equipment) (Sanders and
Phillipson, 2006; Sorrell et al., 2009). Particularly, in terms of household heating,
the term temperature take-back has been used to explain the predicted energy
consumption saving converted into an increase in internal temperature.
This chapter proposed that temperature take-back exists and can be measured. This
is based on evidence of other studies in which temperature take-back ranged from
0.4°C to 0.8°C (Sorrell, 2007). The reason for the temperature take-back can be
explained with the different theories revised: physics-based models; economic
approach; thermal comfort models; and the physical paradigm approach.
Physics-based models propose that space heating decreases when the heat loss for
the dwelling decreases. This is because of the upgrade of the building fabric and
the steady state conditions of the heating regime. The heating regime relies on a

59
fixed schedule and demand temperature. From the point of view of economic
theories, consumers decide rationally to adapt energy usage in response to price
signals (Chatterton, 2011), therefore people might rationally decide to increase their
thermal comfort level following a retrofit. Thermal comfort models, such as the
adaptive approach model, propose that people are able to change their comfort
temperature (neutral) through the adjustment of actions (Nicol et al., 2012).
However, empirical data have not been collected on a large scale in the domestic
sector to be applicable to the residential building.
This study uses an integrated approach: a quasi-experimental approach (physical
paradigm approach) and qualitative approach. A quasi-experimental approach is
used because this study is principally interested on the study of temperature take-
back following an energy efficiency upgrade, accounted without predetermining the
occupant influences. This study also uses a qualitative approach as it is interested
in what are the effects of interaction between the physical and occupant’s
behavioural change on space heating consumption following a retrofit.

60
3. Chapter 3. Research Methodology
3.1. Introduction
The Literature Chapter reviewed several assumptions related to temperature take-
back and energy consumption and how occupants might respond to the introduction
of energy efficient measures in the domestic sector (Section 2.4). The main
theoretical approaches for assessing the benefits of domestic building energy
efficiency initiatives were also revised to provide a theoretical framework for this
research study (Section 2.5). The literature review concludes that temperature take-
back exists and can be measured. This is based on evidence of other studies in
which temperature take-back ranges from 0.4°C to 0.8°C (Sorrell, 2007). The
reason for the temperature take-back can be explained with the different theories
revised: physics-based model; economic approach; thermal comfort models; and
the physical paradigm approach
This chapter describes the research methodology, which is one of the biggest
challenges in this research as it has to balance the availability of data and resources
with the theoretical framework. The research strategy and its justification are
explained in this chapter, in which a quasi-experimental approach is proposed to be
used, because this study is principally interested in the change of temperature take-
back following an energy efficiency upgrade (Research Questions 1 and 2). This
study also proposes to use a qualitative approach as it is interested in which the
effects of the interaction between physical and occupant behavioural changes are
on space heating consumption following a retrofit, which cannot be answered
purely by a quasi-experimental design (Research Question 3) and why internal air
temperatures change afterwards (Research Question 4).
This chapter also discusses why a case study is desirable (Section 3.3.1) and
outlines why this case study focuses on social housing (Section 3.3.2). The
‘challenges’ in finding a suitable case study in Newcastle upon Tyne are described
(Section 3.3.3). Further, Section 3.4 describes the social and building descriptions

61
of the study site. Section 3.5 describes the sampling approach. Finally, the validity
and ethical considerations are described in Sections 3.6 and 3.7.
3.2. Research Strategy and Justification
An integrated approach, i.e. a quasi-experimental approach and qualitative
approach, was adopted to address the Research Questions. This integrated approach
has been termed as ‘intervention design’ (Creswell, 2015) (see Figure 3.1).
Intervention design can be defined as to “…study a problem by conducting an
experiment or an intervention trial and adding qualitative data into it”
(Creswell, 2015, p. 43).
An intervention design is a mixed method strategy referred to as an “integration of
the data at one or more stages in the process of research”
(Creswell, 2009, p. 212).
The mixed-method strategy has been increasingly applied in social science
(Creswell, 2015) so adding a ‘concurrent triangulation design’ to validate the
findings, and checking the different findings obtained with the different methods
(Denscombe, 2014). For example, in this study, the findings obtained using
occupant behavioural data (self-completion diaries, and follow-up interviews and
other interviews) and physical monitoring data (heating consumption and internal
temperature) are compared.
Despite its utility a ‘mixed-method’ strategy poses different challenges for the
researcher such as the ability to deal with both quantitative and qualitative forms of
research (Creswell, 2009). In addition, the ‘mixed-method’ strategy is scarce in the
field of energy and buildings, as it integrates physical and quantitative data. Studies
evaluating the effect of energy efficient measures on heating consumption tend to
focus only on physical factors such as changes in internal temperature and/or energy
consumption following retrofit insulation (such as Hong (2011), Hong et al. (2006),
Oreszczyn et al. (2006)). In contrast are the interactions between occupant

62
behavioural factors and physical factors that may account for space heating
consumption changes have been not researched in depth.
Despite the lack of precedent of ‘mixed-method’ methodologies in the field of
energy and building, insight can be gained from Love (2014) study which combines
physical and social data. For example, the following quote by Love exemplify how
data should be collected
… data should be gathered on the influence of all these elements on each
other. Given the presence of occupants in this set of interactions,
uncovering the reasons for their influence on the other two elements
should involve a description from their perspective of their home
environment, its changes after retrofit and their interactions with it.
(ibid, 2014, p. 91).
Furthermore, texts on combining different types of social data can still be of use
here, such as Creswell (2015), and Andrew and Halcomb (2009). These latter
suggested that this integration may be undertaken in the data collection, data
analysis and/or data interpretation.
Figure 3.1. Research methodology of this study – Intervention design

63
3.2.1. Quasi-experimental approach
A quasi-experimental approach involves
… to determine if a specific treatment influences an outcome. This
impact is assessed by providing a specific treatment to one group and
withholding it from another and then determining how both groups
scored on an outcome … that use nonrandomized designs.
(Creswell, 2009, p. 12).
Energy efficiency intervention effects using a quasi-experimental approach can be
measured in two categories: measuring the change in ‘energy service’ or ‘energy
inputs’ (Sorrell et al., 2009). The quasi-experimental design for the measurement
of the change in ‘energy service’ and ‘energy input’ in this study is represented in
Figure 3.2. A review by Sorrell (2007) provides a critique of the methodologies of
these types of studies, in which the lack of a counterfactual scenario in the research
study design or explicitly controlling for confounding variables were common
criticisms. Further, the use of small sample sizes, small periods of monitoring and
the self-selection of participants were also showed as barriers to applying the results
of these interventions to wider populations (Sorrell, 2007). The following
paragraphs show how most of the research study design issues mentioned by Sorrell
(2007) have been addressed.
Energy service
The effects of energy efficiency interventions can be measured as the change in
energy service before and after an energy efficiency upgrade (Sorrell et al., 2009).
Indeed, current thinking argues that energy service is the most relevant output of a
system (Sorrell, 2015). An energy service can be defined as the benefit that
occupants get from energy-heating consumption such as thermal comfort, higher
indoor air temperatures or indoor air quality (Galvin, 2015).
It could be argued that a truer reflection of the energy service being demanded is
thermal comfort. However, evidence presented by Hong et al.’s results (Hong et
al., 2009) shows that the predictive models are not entirely suitable for the

64
prediction of comfort in a domestic context. A major limitation of the predictive
model in residential buildings is that, in practice, thermal comfort is not steady as
people adapt their environment to feel comfortable using a wide range of
possibilities such as opening windows and curtains, drinking cold/warm drinks,
switching on/off heating, etc. (Peeters et al., 2009). Adaptive models, on the other
hand, may be suitable to measure the energy service as they implicitly build on the
hypothesis that occupants are able to change their comfort temperature (neutral)
through adjustments of actions (Nicol et al., 2012). However, empirical data have
not been collected on a large enough scale on the domestic environment for them
to be applicable to residential buildings (Zero Carbon Hub, 2015) (see discussion
in Chapter 2, Section 2.5.2).
Internal air temperature has been taken as a pathway towards measuring
temperature take-back in retrofit insulation studies (Oreszczyn et al., 2006; Love,
2014). This is because the energy service being demanded is a certain internal
temperature during certain time periods through the day. Following this approach,
this study measures the change in internal air temperature to provide a better
understanding of the effects of energy efficiency interventions.
The energy service internal air temperature is measured before and after the retrofit
in the target building, internal air temperature prior to the retrofit acts as a
counterfactual scenario portraying ‘would have been’ in the absence of the retrofit
insulation (Sorrell et al., 2009). In addition, as various exogenous factors may
modify the demand of energy service (Frondel and Schmidt, 2005), the research
needs to control for confounding variables (Sorrell, 2007). Confounding factors
might compromise the internal validity of the experiment
In terms of the ‘comparability-based’ definition, confounding is said to
occur when there are differences in outcome in the unexposed and
exposed populations that are not due to the exposure, but are due to other
variables that may be referred to as ‘confounders.
(Law et al., 2012, p. 7).
This study addressed the confounding factors imposing the “exogeneity” (Frondel
and Schmidt, 2005) by looking at populations with similar social conditions and

65
living in buildings with similar characteristics. This means weather conditions,
energy prices (the same tariff applies to each occupant supplied by the district
heating network), energy supplier (occupants cannot change energy supplier as it is
a district heating system), socio-economic characteristics (low-income), the type of
retrofit insulation (the target building received the same energy efficiency measure),
the physical characteristics (similar floor size, same location and similar building
fabric) cannot be confounded with the independent variable – the retrofit building
fabric.
Energy input
The effects of energy efficiency interventions can be measured through the change
in ‘energy input’ before and after an energy efficiency upgrade (Sorrell, 2007). The
space heating consumption before and after the retrofit is measured in the target
building and a counterfactual was constructed by using space heating consumption
for a control group building over the same period of time. For this counterfactual
scenario (at least) two sources of errors have been identified: the energy
consumption that ‘would have been’ in the absence of the retrofit insulation and
without behavioural change (Sorrell et al., 2009). A modelled counterfactual was
not introduced to limit uncertainties introduced with the model predictions as
pointed out by Sorrell et al. (2009). The quasi-experimental design for the energy
input is represented in Figure 3.2.
3.2.2. Qualitative approach
This study seeks to understand the effects of the interaction between physical and
occupant behavioural factors on space heating consumption, following a retrofit
insulation. As this interaction is more complex than determining the magnitude of
the change in space heating consumption or internal air temperatures, energy has
been conceptualised as “… an ingredient of the social practices and complexes of
practice of which societies are composed” (Shove and Walker, 2014, p. 6).

66
As Shove has pointed out about consumption of energy “… it is bound up with
routine and habit and with the use as much as the acquisition of tools, appliances,
and household infrastructures” (Shove, 2003, p. 395).
This representation of consumers and consumption are mirrored in the qualitative
strategy adopted, which sees interactions between the physical and occupant factors
as a consequence of everyday practices and routines.
Previous studies of how people’s lives might improve following energy efficiency
upgrades have proposed that as a result of the warmer environment, occupants may
adjust the use of space (see Section 2.4.6). In the process of understanding how
occupants may adjust the use of space, this research study proposes to study: 1)
changes that may derive from the effects of retrofit insulation on the common
patterns of activities (activity profile); and 2) changes that may derive from the
effects of retrofit insulation on the level of activities during the time that occupants
were at home (actively occupied room). In addition, as the change of the use of
space was related to the warmer environment this study uses qualitative methods to
understand if the energy efficiency upgrade changes the perception of thermal
comfort perception and heating patterns. The methods used to collect qualitative
data are explained in detail in Chapter 4, which comprises self-completion diaries,
follow-up interviews and face-to-face semi-structured questionnaires. The
qualitative design for this study is represented in Figure 3.3.

67
Figure 3.2. Quasi-experimental approach adopted in this study.

68
Figure 3.3. Qualitative approach adopted in this study.

69
3.3. Case Study
3.3.1. Why a case study is desirable
A case study is defined as “an empirical enquiry that investigates a contemporary
phenomenon in depth and within its real-life context, especially when the
boundaries between phenomenon and context are not clearly evident”
(Yin, 2014, p. 16).
This research fits well with a case study research definition as it studies a
contemporary phenomenon – the effects of retrofit insulation on space heating
consumption – in which a case study is desirable because occupant behavioural and
physical factors are linked in a complex context (see research assumption in Section
2.4). Furthermore, there is a large number of factors influencing the thermal
performance of the dwellings related to the occupants, building fabric and heating
system, and it is not clear what the boundaries between these factors are. This case
study also fits well with the ‘how’ and ‘why’ type of research questions that
investigate a contemporary phenomenon (Yin, 2014). Case study research has been
well established in the social sciences (Yin, 2009) and its utility in energy and
building has been more recently demonstrated by Lowe et al. (2012) and Love
(2014). Moreover, case study research is compatible with a ‘mixed-methods’
strategy (Rosenberg and Yates, 2007; Yin, 2014) and with long-term observation
(Bryman, 2012). This research study has chosen a longitudinal comparison; a two-
year-long empirical study on the effects of imposed retrofit insulation on a high-
rise social housing building in Newcastle upon Tyne, UK.
In spite of its benefits a case study poses different challenges in terms of
generalizing research findings (Bryman, 2012). However, Bryman (2012)
suggested that a case study can meet the criteria of reliability, replicability and
validity, and that generalization has never been the purpose of the case study
method. Other challenges are resource restrictions in terms of time and cost (Yin,
2009; Bryman, 2012), which are considered in the case study research design.

70
3.3.2. Appraising the effects of building fabric retrofitted insulation on social
housing
This case study focuses on social housing for three reasons: 1) the suggestion of
higher temperature take-back in low-income dwellings; 2) methodological benefits;
and 3) policy priority. First, the literature suggests that temperature take-back is
usually higher in dwellings occupied by low-income householders (Milne and
Boardman, 2000; Sorrell, 2007). Thus, internal air temperature change might be
greatest in social housing and thus easiest to detect. This is because pre-retrofit
unsaturated energy service demand would lead to a post-retrofit internal
temperature increase. Secondly, focusing on a high-rise social housing building
provides methodological benefits in avoiding biased results, and reducing
extraneous factors not controlled by the researcher, as all the dwellings receive the
same energy efficiency upgrade, and are influenced by the same environmental
factors (i.e. external temperature, relative humidity, etc.) and also the socio-
demographic variables are similar. However, this reduces the wider applicability
of this research’s results (see scope and limitations in Section 1.6). Third, low-
income and vulnerable households have been priority groups for achieving the
UK’s carbon target (DECC, 2012). Consequently, it is expected that energy
efficiency upgrades in social housing might contribute to reductions in CO2
emissions and fuel poverty.
3.3.3. Finding a suitable case study
A suitable retrofit insulation project had to be located, from which a case study’s
dwellings could be conducted to study the effect of retrofit insulation on space
heating consumption in a high-rise social housing building. For this purpose, at the
beginning of the research, contact was made with the housing organization
responsible for managing the council homes on behalf of Newcastle City Council –
Your Homes Newcastle. Following the research design of Hong et al. (2006), the
focus of this study was to conduct a quantitative cross-sectional comparison
between a mixture of properties which had been upgraded recently (mostly over the
past six months) and those due to receive the energy efficiency intervention.
Different buildings expected to be retrofitted were visited; however, these retrofit

71
projects were not financed. In October 2013 the researcher was also informed that
interviewers available to carry out the survey, who aimed to interview a quantitative
large sample size, were also cancelled. The research study was re-evaluated and
the research strategy was adjusted to an intervention design strategy (Section 3.2)
using a case study. The research criteria to find a suitable case study were:
- High-rise building(s) due to receive the energy efficiency intervention to take
place within the non-heating period in 2014/2015;
- Access to the meter readings of the occupants during the survey, pre- and post-
retrofit;
- Social housing (vulnerable dwellings);
- Access to the building to start the survey the winter before retrofit, in order to
collect pre-retrofit and post-retrofit in-home practices;
- Find (a) building(s) with a large number of residents to get more chances to find
at least 30 residents able to fill an activity diary for 1 week, 4 times within a
year (before and after buildings receive solid wall insulation) and able to accept
a 15-20 min interview and follow-up interviews to understand the diaries and
collect socio-demographic data;
- Occupants that can perform their daily routine without major problems, i.e. they
can perform tasks such as personal care, domestic chores and other activities.
Finding a suitable case study with the above criteria proved to be difficult, because
insulation projects available with secured funding were scarce. The housing
organization was extremely helpful and a new site was proposed in the Riverside
Dene area, in which one of the tower buildings was due to be retrofitted in 2014.
3.4. Case Study Description
The study uses two high-rise social housing buildings located in the Riverside Dene
Area of Newcastle upon Tyne, UK, managed by Your Homes Newcastle. The
buildings were Cruddas Park House, the “target building”, and The Hawthorns, the
“control group building”. The target building underwent retrofit insulation
(external solid wall and double-glazing windows) from September 2014 to
February 2015 (Figure 3.4).

72
Figure 3.4. Left image, Cruddas Park House building (target building) before
retrofit insulation (March 2014). Right image, Cruddas Park House building after
retrofit insulation (March 2015).
3.4.1. Socio-demographic characteristics. Riverside Dene area
The Riverside Dene project was originally a 10-block scheme and a shopping centre
built in the 60s (Jones, 2013) as part of a programme of slum clearance and
redevelopment (Glendinning and Muthesius, 1994). Currently, only six tower
blocks remain on the site, the rest were demolished before 2011 (Jones, 2013) (see
the history of the site in Annex B). The majority of the occupants living in the
Riverside Dene blocks have incomes that fall below the regional average (£13,329
per year) (YHN, 2015) (Table 3.1). In addition, it is very likely that those
pensioners living in the Riverside Dene buildings are retired workers with no formal
qualifications (YHN, 2015) (Table 3.2).

73
Total net income per annum Riverside Dene
tenants (n)
Riverside Dene
tenants (%)
Less than £5,199 94 18
£5,200 – £10,399 260 50
£10,400 – £15,599 111 21
£15,600 – £20,799 40 8
more than £20,800 3 3
Table 3.1. Riverside Dene area income level. Source: YHN (2015)
UK
average *
Pensioners in
social rented
flats
Young
renters in
flats
Employment status
Employed Full-Time 100 22 110
Employed Part-Time 100 28 79
Self-employed (FT) 100 22 77
Self-employed (PT) 100 38 61
Retired 100 310 42
Unemployed and seeking work 100 40 186
Education Level
Full-Time education 100 10 171
No formal qualifications 100 274 92
GCSE / O levels / CSE /
School Certificate 100 62 101
ONC / BTEC / apprenticeship 100 80 81
A-levels/ AS levels or Highers 100 29 107
Higher education below degree
level 100 55 105
Degree or higher degree 100 24 117
(*) This table is based on two sources: Northgate (YHN’s housing data base) and
ACORN (A Classification Of Residential Neighbourhood). The score indicates
probability with 100 being a UK average.
Table 3.2. Riverside Dene area dweller characteristics. Source: YHN (2015)

74
3.4.2. Buildings description
The target and the control buildings share similar physical building fabric
characteristics, location and heating system. Both are high-rise residential
buildings built in the 60s in the Riverside Dene area in Newcastle upon Tyne.
Heating is supplied by a biomass community heating system, a 750 kW biomass
boiler is the primary energy source, and a 1.5 MW gas-fired boiler, and two 1.2
MW gas boilers (Armstrong group, 2012) work in peak periods of demand. The
heat is distributed to the tower blocks via heating pipes, which comprise the heat
network. Individual flat metering monitors the heat and then bills are based on the
amount of heat used. Both buildings are under the same gas price tariff and the
information recorded in both meters is automatically transmitted every month to a
central database.
For the target building, the heating pipework in vertical riser ducts in the main
corridors serves horizontal runs on the 6th 7th, 13th and 14th floors, which pass
through the ceiling voids in the corridors then through a flat to drop vertically within
the bedroom cupboard passing to the flats below. Branches tee off within the
cupboard for each individual flat (see Annex C). Ducted air stub ducts supply heat
to the flats, which is controlled by a heating control through an ‘on/off’ button
(thermostat or zoned controls are not available in the target building – see Annex
D). There is no heating to the kitchen or bathroom within the flats.
Unmetered heat might have been benefiting the target building flats; heat might be
given off in the horizontal runs to the bedrooms and then runs vertically within in
the cupboard, in turn serving the flats above and below. Thus it might also affect
some of the main corridors, most likely the ones with the horizontal pipework and
the corridors immediately above.
For the control group building, primary mains from the boiler house serve a heat
station on the ground floor. Plastic vertical risers carry LTHW (low temperature
hot water) from the plate heat exchangers up through the building. Horizontal runs
pass through each flat to the local bespoke heat exchange unit in a cupboard. This
unit provides heating via a plate heat exchanger and hot water indirectly via a coil
running through a stored mass of hot water. Two wet-pipe systems using panel

75
radiators supply heat to the flats, which is controlled by a programmable room
thermostat (see Annex C).
After retrofit the target building was modified as follows: new external façade-wall
construction with a corresponding U-value of 0.28 (W/m2K) and new double-glazed
windows with a corresponding U-value of 1.7 (W/m2K). The system used to
upgrade the walls was an external insulation render system incorporating 100 mm
of HD mineral wool insulation (nominal density 140kg/m³).34 A base coat (7 mm)
and reinforcing mesh were also applied along with a top coat of silicon-resin of 1.5
mm. The windows were upgraded with 28-mm air-filled double-glazed units,
which have 4 mm of inner pane, 20 mm air space between the panes and 4 mm
outer pane. The window energy rating (WER) specified were band C. The air
tightness was not addressed nor anything done to the heating system and controls
as part of the retrofit project. Table 3.3 summarises the physical characteristics of
both buildings.
Physical building
descriptions Target building Control group
Building use Residential Residential
Construction year 1960s 1960s
Number of storeys 23 15
Number of dwelling units 157 76
Number of bedrooms 1 or 2 1 or 2
Floor area in m2 (average
per flat)
70 59
Energy efficiency rating
before the upgrade
76 points (band C) 83 points (band B)
Wall construction (outside
to inside)
Precast concrete frame
with concrete infill panel
Precast concrete
frame with
concrete infill
panel
34 This information is based on the project specs provided by YHN, this study
neither did look at fire regulations nor give recommendation about insulation
system/materials.

76
Wall U-value (W/m2K) 0.53 to 0.89* 0.30***
Window U-value (W/m2K) 4.3 0.17***
Orientation 10˚ due East 10˚ due West
Completion of improving
the energy efficiency
February 2015
Heating system **
Heat source
Primary source: 750 kW biomass community
heating system.
For peak demand periods: one 1.5MW gas fired
boiler plant and 2 existing 1.2MW gas boiler
acts a back-up serving Riverside Dean blocks.
Heat network-pipes Combination of a mild steel LTHW35 heating
pipework and steel pre-insulated primary with
ducted air stub duct system and panel radiators.
Heat network-pipes routing LTHW heating pipework
in vertical risers in ducts
in main corridors serving
horizontal runs on
different floors. These
runs pass through the
ceiling voids in the
corridors then through a
flat to drop vertically
within the bedroom
cupboard passing to the
flats below.
Plastic vertical
risers carry LTHW
from the plate heat
exchangers up
through the
building.
Horizontal runs
pass through each
flat to the local
bespoke heat
exchange unit in a
cupboard.
(*) variable wall U-value due to uneven construction in the original façade
(source: information provided by YHN). (**) Armstrong group (2012)
(***) Yu (2016)
Table 3.3. Target and control group physical building descriptions.
35 Low temperature hot water

77
3.5. Sampling Approach
A convenience sample suited both the practical constraints of the study (e.g. small
number of flats, limited financial resources) and the research strategy. A
convenience sample was deemed the most appropriate sampling approach for
addressing the research strategy ‘intervention design’ (Creswell, 2015), as
agreement from the participants is needed for the installation of the data loggers in
their flats and to carry out the qualitative survey (self-completion diaries and
follow-up interviews and other interviews). All residents of the target building were
invited to participate; however, ‘selection’ bias can affect the sample if, for
example, dwellers with a particular interest in energy consumption are more likely
to participate than other dwellers. However, “unobserved household-specific
heterogeneity” (Davis, 2008, p. 534) of the propensity to participate in the study is
not affected for the propensity to adopt the energy efficiency measures, as it was
imposed for all the occupants of building.
3.6. How Validity is addressed in this Case Study
Case study research can achieve integrity or rigour of validity through ‘construct
validity’, ‘internal validity’, ‘external validity’ and ‘reliability’ (Yin, 2014, p. 18).
Following Yin’s approach (2014), this study seeks to demonstrate validity based on
previous concepts constructed by previous researchers. For example, the impact of
energy efficiency on space heating is revised through specific concepts such as
temperature take-back, which are related to the main objective of this research
(Research Questions 1 and 2).
In addition, evidence collected from different data sources is triangulated to provide
verification and validity while complementing similar data, making the results more
believable. In other words, physical monitoring data (space heating consumption
meter readings and internal air temperature) and occupant data (from self-
completion diary and follow-up interview) are triangulated to compare the findings
from both data sources.

78
In terms of ‘internal validity’, counterfactual scenarios are considered in the
research study design for the evaluation of the changes of energy service and input,
portraying what ‘would have been’ in the absence of the retrofit insulation (Section
3.2.1). In addition, as various exogenous factors may modify the demand of energy
service (Frondel and Schmidt, 2005), the research controlled for confounding
variables (see Section 4.3.1). ‘Reliability’ is addressed by keeping a record of data
collected (database, interview transcripts, interview notes and secondary sources)
and documenting the procedure used in this study to create a chain of evidence, as
can be seen in Chapter 4.
3.7. Ethical Considerations
Consent for the study was granted by the Newcastle University committee before
the study was undertaken. Ethical considerations taken into account involved
confidentiality and informed consent from the participants (see Annex E). A
briefing meeting was carried out with each participant in order to explain: a) the
purpose of the study; b) the right to participate and withdraw whenever they want;
c) a guarantee of confidentiality and non-traceability in the research (as no names
or flat numbers are published). In addition, at the beginning of the research study
(Stage 2), a survey brochure was given to each dweller with the same information
delivered verbally (see survey brochure in Annex E). A letter of consent was signed
by each participant and it was explained what type of information the temperature
data logger records (see letter of consent in Annex E).
3.8. Summary
This research adopts a ‘mixed-methods’ strategy design called ‘intervention design’
(Creswell, 2015) that combines quasi-experimental and qualitative approaches for
answering the Research Questions. The quasi-experimental design measures the
effect of energy efficiency interventions through the change in ‘energy service’ and
‘energy inputs’.
79
The energy service measures internal air temperature, before and after the retrofit
in the target building, and internal air temperature prior to the retrofit acts as a
counterfactual scenario portraying what ‘would have been’ in the absence of the
retrofit insulation. The energy input measures space heating consumption, before
and after the retrofit in the target building, and a counterfactual scenario will be
constructed using space heating consumption for a control group building, over the
same period of time.
In addition, this study also seeks to understand which the effects of the interactions
between physical and occupant behavioural factors are in space heating
consumption, following a retrofit and why internal air temperature changes
afterwards. Thus, qualitative responses to changes that may derive from the effects
of retrofit insulation and change in the use of space are also studied.
This research uses a case study to understand the effects of retrofit insulation on
space heating consumption. A case study is desirable due to the large number of
factors influencing the thermal performance of the dwellings related to the
occupants, building fabric and heating system, and it is not clear what the
boundaries are between these factors. The case study research uses two high-rise
social housing buildings located in the Riverside Dene Area of Newcastle upon
Tyne, UK. These buildings are managed by the housing organization Your Homes
Newcastle. For the purpose of this research these buildings are called the target
building, and the control group building. The target building underwent retrofit
insulation (solid wall and double-glazing windows) from September 2014 to
February 2015 (Figure 3.4).
A ‘convenience sampling’ strategy was employed as volunteers are needed to carry
out the study. The case study research achieves integrity or rigour of validity
through ‘construct validity’, ‘internal validity’, and ‘reliability’. Ethical
considerations such as confidentiality and informed consent from the participants
were also taken into account in the implementation of this study.

80
4. Chapter 4. Data Collection
4.1. Introduction
Chapter 3 described the ‘mixed-method’ research strategy ‘intervention design’
adopted to address the Research Questions, which combines a quasi-experimental
design and qualitative methods. This strategy was chosen to analyse the effect of
retrofit insulation on space heating consumption in the case study described in
Chapter 3. The Research Questions are as follows:
- How do internal temperatures change following an imposed building fabric
retrofit insulation?
- How does space heating consumption changes following an imposed building
fabric retrofit insulation?
- Which interactions between occupant behavioural factors and physical factors
may account for space heating consumption change?
- Why do internal air temperatures change afterwards?
This chapter discusses the research methods applied to collect data that allow for
addressing the Research Questions. Research methods involve “the forms of data
collection, analysis, and interpretation that researchers propose for their studies”
(Creswell, 2009, p. 233). Research methods also “…should follow research
questions in a way that offers the best chance to obtain useful answers. Many
research questions and combinations of questions are best and most fully answered
through mixed research solutions” (Johnson and Onwuegbuzie, 2004, pp. 17-18).
This chapter firstly discusses the data collection methods (Section 4.2), justifying
why these research methods were chosen and how they were designed. Secondly,
Section 4.3 describes the implementation of the data collection methods in the case
study. Thirdly, Section 4.4 describes the implementation stages of the study, which
was divided into eight stages in order to capture long-term patterns of physical

81
monitoring and occupancy data in the residential building. Fourth, Section 4.5 –
data analysis and construction of metrics – describes how the data collected turn
from raw data into meaningful information. Finally, Section 4.6 discusses the
limitations of the research methods.
4.2. Description of Data Collection Methods
This section describes the Research Methods for data collection, justifying why
these research methods were chosen and how they were designed:
- Detailed monitoring (monitoring air temperature and heating consumption data);
- Structured questionnaires;
- Self-completion diaries and follow-up interviews;
- Semi-structured questionnaires.
4.2.1. Detailed monitoring
The study of changes in energy services needs recording in a high resolution of time
series of internal air temperature data and space heating consumption data in order
to observe changes pre-and post-upgrade. Data loggers are needed to collect air
temperature accurately, although all data loggers have sources of errors, which can
be limited by placing the data logger away from direct sources of heat and light, as
suggested by ISO 7726:2001 (British Standards Institution, 2001). In addition, an
uncertainty in the source due to sensor characteristics could be mitigated by
following the guides provided by ISO 7726:2001 (British Standards Institution,
2001). The guidelines suggest a sensor response measuring range (10˚C – 40 ˚C)
with an accuracy (required ± 0.5˚C and desirable ± 0.2˚C) for a 90% response time.
Moreover, data loggers can be calibrated in a thermal chamber under known
conditions (for example, set at 20˚C and 50% relative humidity).
Regarding space heating consumption data, ideally heat meters installed on the
meters or on the heaters, which provide a high-time-resolution analysis of heating

82
usage (switch on/off), are needed to collect SHC. However, this equipment tends
to be very expensive. Another option is the meter readings. Meter readings have
several sources of errors; SHC often needs to be collected from different fuel
sources such as electricity and gas, and then disaggregated from the other energy
consumption data. For example, gas consumption might record both space heating
consumption and hot water data. Disaggregation through modelling is open to bias,
because of the assumptions that need to be made about the consumption (e.g.
different space heating consumption and hot-water gas in summer time compared
to winter time) such as in Hong (2011). This source of error can be mitigated if
different meter readings measure space heating and water heating.
4.2.2. Structured questionnaires
Structured questionnaires are needed to:
1. Identify the demographic profile of the respondent household and to
characterize the population of the target building (e.g. family size, sex, age,
household composition, occupation and education);
2. Identify the ownership and use of secondary heating during the retrofit process;
3. Describe the thermal comfort perception before and after the upgrade.
The design of the thermal comfort perception questionnaire was designed to
understand how warm or cold they feel in their living room using five items of
thermal comfort-related perception. Items used a 5-point Likert scale (for example
1= Very cold, 2 = cold, 3 = neutral, 4 = warm, 5 = Very warm) (Annex E). Other
thermal comfort-related factors, that it might be related to, were also asked such as
level of draught, level of noise (external noise), external appearance of the building
and level of health (related to cold–diseases).
Structured questionnaires enable households to be surveyed with relative ease but
they are limited in the amount and type of information that can be collected. For
this reason, practices and routines were surveyed using self-completion diaries and
follow-up interviews.
The structured questionnaires can be seen in Annex E.

83
4.2.3. Self-completion diaries and follow-up interviews
Different research methods have been used by previous researchers to capture the
use of space, for example, the use of longitudinal self-completion diaries reported
by other researchers to explore day-to-day adaptive actions of thermal comfort that
enable predicting energy consumption in office environments (Langevin et al.,
2013). Langevin et al. (2013) monitored adaptive activities such as switched-on/off
heating, drinking cold/warm drinks and closed/open windows.
However, there is no perfect technique; this means that there is a trade-off between
viability, reliability and invasion of privacy. For example, one of the more intrusive
methods to study the use of space is filming participants at their place, which is
exposed to bias to know what really happened in the absence of the camera; this
has been described as the ‘Hawthorne Effect’ (Parsons, 1974; Wickström and
Bendix, 2000; Gale, 2004; Schwartz et al., 2013). On the other hand, the least
intrusive technique would perhaps be to carry out an interview, in which how an
occupant uses the space may not be accurate, because of the bias of the interview
as a technique. Acknowledging these limitations and after the evaluation of
different methods, this study sought to capture only the general routine of the
occupants from the diaries. There are also practical reasons why self-completion
diaries and follow-up interviews were desirable in the context of this study, such as
being less intrusive, cheaper and a more suitable solution than filming or using
sensors.
Self-completion diaries were chosen because they are principally based on the
premise that “we can analyse and learn about when, where and what energy-related
activities occur in a household context and by whom (and in what social context)
they are performed” (Ellegård and Palm, 2011, p. 1921). This along with the
premise that “people can talk about their practices” (Hitchings, 2012), was used to
support the use of follow-up interviews.
These premises can be tested with the concurrent triangulation design applied to
this study in which self-completion diary data, follow-up interviews, internal air
temperature and space heating consumption data were used to check the findings.
Triangulation has often been conducted on other mixed method researches to
enhance the credibility of the findings (Bryman, 2012).

84
Self-completion diaries and follow-up interviews have limitations such as ‘risk of
honest forgetfulness’ in which participants fail to remember the scheduled response
times or fail to have the diaries at hand (Bolger et al., 2003, p. 594). For example,
a participant commented on the first follow-up interview that her TV was always
switched on in the background during the time when she was at home. She did not
know how to include this ‘activity’, because it is not a leisure activity by its own,
rather she used it to feel companionship.
Another example is the level of consciousness of the practices, this may indicate
that participants are not necessarily conscious about all their daily practices and
some activities could have been missed. For instance, a participant commented that
he had not realised what his life routine was until he started to complete the diaries.
In addition, the ‘risk of retrospection error’ (Bolger et al., 2003, p. 594), in which
participants may fill in the diary at the end of the day and some activities could have
been missed or deliberately fabricated to complete missed entries. Both the ‘risk of
honest forgetfulness’ and ‘risk of retrospection error’ may lead to ‘uncertain
compliance’ (Bolger et al., 2003). The use of follow-up interviews can be used to
verify information on household practices, obtaining additional information to
complement the self-completion diaries.
Self-completion diaries were designed specifically for this study by including
activities in which an individual might perform at home, based on the concept of
previous diary surveys used in transport studies (Doherty and Miller, 2000). The
self-completion diaries contain time-based diaries with ‘fixed-time schedules’
(Bolger et al., 2003) to capture the heating schedule and hourly activities that are
centred around the person’s daily life and during one week.
In order to test the design a pilot study was undertaken in January 2014 (see Annex
G). Ideally, this pilot would had been tested with the sample group; however, a
small sample size prevented testing it with the participants. The pilot was carried
out with Newcastle PhD students, although they have different socio-demographic
characteristics, the expert input given by Newcastle University PhD students was
worth it. This pilot primarily led to the questionnaire being shortened, and the
structure of the activity survey sheet was amended (Annex G). In addition, in order

85
to collect heating usages, a heating schedule diary was added in the final version of
the self-completion diary which is shown in Annex E.
The PhD students were asked to fill in the diary survey and evaluate it, they also
were interviewed after the completion of the survey with a semi-structured
questionnaire in order to collect information about the survey design such as length,
style, clarity of the language, instruction information and understanding of the
activity diaries. For a simplified analysis it was proposed that the PhD students
only fill in the diary for one day, on an average weekday routine, in winter season
and exclude activity diaries for family members.
The final version of the self-completion diary can be seen in Annex E.
4.2.4. Semi-structured questionnaire
Semi-structured interviews were chosen to:
1) Identify any other relevant changes to their domestic environment that may affect
energy consumption during the retrofit process (i.e. change of employment status,
family members, health conditions);
2) Capture the perception of the retrofit insulation and its process. The final
interview aimed to address some of the socio-technical issues surrounding the
perception of the effect of retrofit insulation and its process. The script explored
the predetermined themes as follows, whilst still allowing for the emergence of
unanticipated themes:
- Use of main heating and secondary heating;
- Thermal comfort perception;
- Ventilation;
- Infiltration;
- Unanticipated themes.
Semi-structured questionnaires can be seen in Annex E.

86
4.3. Data Collection Method Implementation
This section describes the implementation of the research methods for data
collection, represented in Figures 3.2 and 3.3.
4.3.1. Monitoring internal air temperature and external air temperature
Internal air temperatures were monitored at 30-minute intervals before and after the
retrofit, by placing data loggers in the participant’s living room. Gemini Tinytag
data loggers (Table 4.1) were placed away from direct sources of heat and light.
Internal air temperature data were monitored in the living room (Figure 4.1). As
internal air temperatures are strongly influenced by external meteorological
conditions, external air temperatures were monitored and collected using a Gemini
data logger installed on the roof of the target building, set at 30-minute intervals
(Table 4.1).
Table 4.1. Gemini data logger specs. Source: Tinytag (2016)
Data logger specs
Tinytag Plus 2
(external
temperature)
Tinytag Transit 2
(internal temperature)
Model TGP-4017 TG-4080
Temperature range Min/
Max: -40°C/+85°C
-40°C/+70°C
Sensor type 10K NTC
Thermistor
(Internally
mounted)
10K NTC Thermistor
(Internally mounted)
Reading resolution 0.01 °C or better 0.01 °C or better
Logging Interval 1 sec to 10 days 1 sec to 10 days
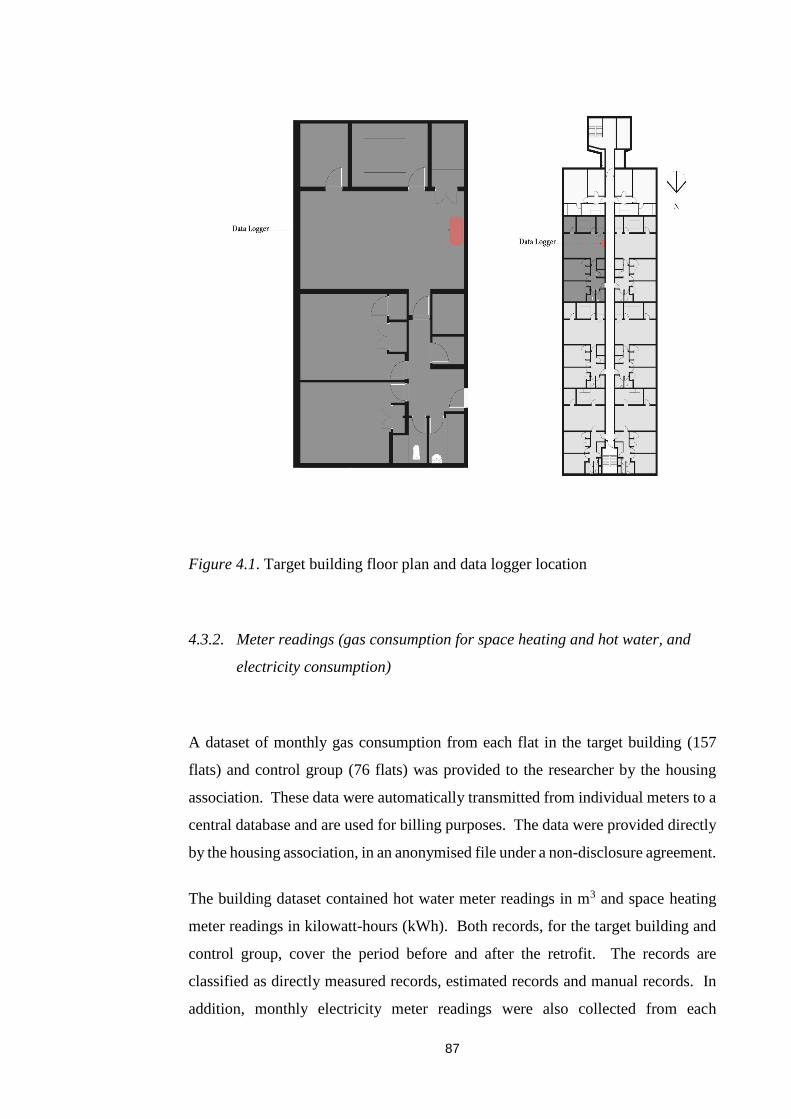
87
Figure 4.1. Target building floor plan and data logger location
4.3.2. Meter readings (gas consumption for space heating and hot water, and
electricity consumption)
A dataset of monthly gas consumption from each flat in the target building (157
flats) and control group (76 flats) was provided to the researcher by the housing
association. These data were automatically transmitted from individual meters to a
central database and are used for billing purposes. The data were provided directly
by the housing association, in an anonymised file under a non-disclosure agreement.
The building dataset contained hot water meter readings in m3 and space heating
meter readings in kilowatt-hours (kWh). Both records, for the target building and
control group, cover the period before and after the retrofit. The records are
classified as directly measured records, estimated records and manual records. In
addition, monthly electricity meter readings were also collected from each

88
participant’s dwelling, before and after retrofit insulation. Interviews were carried
out during the different stages of the retrofit process to obtain information about
secondary heating (see the implementation overview in Section 4.4).
4.3.3. Structured questionnaires
Interviews with structured questionnaires were carried out at different stages of the
retrofit project at the target building. First, at the beginning of the project socio-
demographic information was collected (see information detail in Annex E).
Secondly, before and after the retrofit information regarding thermal comfort
perception and use of secondary heating was collected (Annex E).
4.3.4. Self-completion diaries and follow-up interviews
Self-completion diaries were implemented by guidance on using diaries by
Alaszewski (2006) such as guidance on how to complete the diaries, a model
example of a completed diary and a checklist of activities can be seen in Annex E.
Self-completion diaries were carried out at different stages of the project at the
target building, before and after the upgrade, as to ascertain whether occupants
change their use of space and heating usage (see the implementation stage details
in Section 4.4).
Each participant filled in a self-completion diary (activity and heating diaries) for
one week. A follow-up interview at the end of this week was carried out to
understand the information in the diaries in detail. Furthermore, follow-up
interviews were used to corroborate the information from self-completion diaries.
Therefore, notes were made in the diaries by the researcher about the activities
performed by the participant when more detail was needed. For example, the self-
completion diaries primarily provided information of the main activities during the
day (e.g. meal time, getting up, out of home period). Follow-up interviews were
used to describe with whom, or what other activities are done during this period.

89
4.3.5. Semi-structured questionnaire
A final interview was carried out at the end of the study. The first topic was the use
of main heating and secondary heating. The interview commenced with what
brought them to the use of heating or not. This part was designed to build up a
broad picture of how they are heating their flat and it was also partly for
triangulation with the self-completion diaries. It moved on to the thermal comfort
perception: “how cold or warm do they feel at their flat?”. This was used to build
up a broad picture of how thermally comfortable they are in their flat and it was
also partly for triangulation with the thermal comfort perception questionnaire and
mean internal air temperature. These questions were followed by ventilation and
infiltration questions, including comparisons before and after the retrofit. These
interviews were audio recorded with the permission of the participants.
4.4. Implementation Overview
Implementation of the study was divided into eight stages in order to capture long-
term patterns of physical monitoring and occupancy data in the residential building.
See the overview of the case study’s implementation stages in Figure 4.2, p.100.
Stage 1: recruitment
The recruitment was initiated by the housing association in March 2014, a letter
was sent to all tenants introducing the study in the target building. Because a poor
response rate from a case study, with a small population would have been very
damaging to the research, responses were encouraged through the inclusion of a
£50 gift card provided by the Institute for Sustainability at Newcastle University.
To reinforce the message, posters were located in the building area (i.e. lifts and at
the local café) and postcards were also sent to all the residents (Annex E). The
researcher and supervisor also attended to the stakeholder meeting organized by the
city council. A drop-in session was also organized at the community café (Annex
E).

90
There was a greater difficulty in recruiting volunteers for a one-year study, in which
participants were also required to live at least one year before retrofit (in order to
have historical energy heating records). As recruiting participants amongst
vulnerable communities is challenging, the study’s strategy focused in gaining the
trust of residents by using different techniques: letters, posters located at the
building, a drop-in session, and the author with a YHN’s staff member went twice
to knock on doors encouraging residents to participate. The idea that residents were
involved in a research study design to understand the impact of the proposed retrofit
was well received and aided with participant recruitment. 25 volunteers agreed to
participate in the study; 15 residents met the recruitment criteria.
Stage 2: briefing and data monitoring settings
A briefing meeting 36 with each participant was carried out in order to: 1) explain
how to fill in the self-completion diaries; 2) where to locate the temperature data
loggers; and 3) get the research consent forms signed. A survey brochure was given
to each participant with the same information delivered verbally (Annex E). The
survey brochure contains the self-completion diaries used to record activities,
heating usage periods and information for placing the temperature data loggers.
The data loggers were instructed to be placed in the participant’s living room on a
surface away from direct sunlight and heating37. The data loggers were previously
set at 30-minute intervals by the author. The participants also signed the research
consent form in Annex E, which expresses the willingness to participate in the
survey and the authorization to access their electricity and gas meters.
The electricity meter readings started to be collected monthly after the debriefing
meeting. In addition, a dataset of monthly gas consumption from each flat in the
target building and control group was provided by the housing association.
Retrospective gas consumption data were also provided for 2012 and 2013. A
36 At the café located at Cruddas Park shopping mall. 37 In the absence of any previous protocol to collect internal temperatures: i.e. how
temperature should be monitored; where data loggers should be placed; and how
many rooms should be measured.
91
Gemini data logger, set-up at 30-minute intervals was placed on the roof of the
target building to measure external air temperature.
Stage 3: first self-completion diary and follow-up interview
The first self-completion diary was undertaken from 22nd to 28th May 2014. Each
participant filled in a self-completion diary (activity and heating diaries) for one
week. A follow-up interview at the end of this week was carried out to understand
the information in the diaries in detail. This week was chosen because it was the
most appropriate proxy to interpret winter time 2014 after retrofit insulation as the
average external air temperatures were forecasted to be lower than 15˚C (see Annex
F). As the reader would have noted, it was not possible to monitor the internal air
temperatures from December 2013 to February 2014, because of all the constraints
explained in Section 3.3.3. This stage also collected information regarding thermal
comfort perception, socio-demographic information and use of secondary heating
(Annex E).
Stage 4: retrieving air temperature data
Air temperature data from the internal and external temperature data loggers were
collected and retrieved from May to July 2014.
Stage 5: second self-completion diary and follow-up interview
A second self-completion diary was undertaken from 4th to 10th February 2015.
Each participant filled in the diaries for one week and a follow-up interview at the
end of this week was conducted to understand the diaries in detail. This week was
chosen because was the most appropriate proxy to interpret winter time 2015 after
retrofit insulation as the average external air temperatures were forecasted to be
lower than 15˚C (see Annex F). However, as the retrofit insulation work was still
in process, as some double-glazed windows were not replaced yet in the target
building, this self-completion diary was repeated in April 2015.
Stage 6: third self-completion diary and follow-up interview
A third self-completion diary was undertaken from 4th to 10th April 2015. Each
participant filled in the diaries for one week and a follow-up interview at the end of
this week was also conducted to understand the diaries in detail. This week was

92
chosen because was the most appropriate proxy to interpret winter time 2015 after
retrofit insulation, again the average external air temperatures were forecasted to be
lower than 15˚C (see Annex F). This stage also included information regarding
thermal comfort perception and use of secondary heating (Annex E).
Stage 7: retrieving air temperature data
Air temperature data from the internal and external temperature data loggers were
retrieved from February to July 2015 and downloaded into a PC for analysis. 10
participants out 15 had completed the survey pre- and post-retrofit.
Stage 8: final stage
The participants agreed to be interviewed about their insights into the retrofit
process (see semi-structured questionnaire in Annex E). The interviews were
carried out at the community café or in their flats. In this latter a colleague
accompanied the researcher.
As a summary, 10 participants completed the survey. 9 dwellings were accounted
as valid responses since relevant changes were not present in the property over the
longitudinal survey, such as, for example, family members leaving/coming home.
Figure 4.2. Overview of case study’s implementation stages.

93
4.5. Data Analysis and Construction of Metrics
This section describes how the data collected were converted from raw data into
meaningful information. The following metrics were constructed to answer the
Research Questions.
Metrics:
Mean standardised internal air temperature and Internal temperature profile
(Research Question 1);
Normalised space heating consumption and secondary heating (electricity
consumption for space heating) (Research Question 2);
Activity profile, actively occupied rooms and use of heating (change in the
use of space, Research Question 3);
Thermal comfort perception (Research Question 3).
Theme analysis (Research Question 4).
These metrics are explained in the following sections.
4.5.1. Data cleaning and preparation
The first step in the data analysis was to clean the space heating meter reading
meters of negative values and estimated records, and convert meter readings into
monthly consumption. A total of 1398 meter reading data were collected (456
meter readings from the control building and 942 from the target building) and 1136
records were analysed from a total of 233 flats (see Table 4.2). Potentially
erroneous data points from space heating meter reading records, including negative
values and estimated records, were removed.

94
Space heating consumption meter readings.
Total meter readings/ (analysed meter readings (**))
Year Control building Target building Total
2014 (*) 228 (191) 471 (427) 699 (618)
2015 (*) 228 (194) 471 (324) 699 (518)
Total 456 (385) 942 (751) 1398 (1136)
(*) 3 months (March, April and May).
(**) Analysed meter readings = total meter readings - potentially erroneous data
points.
Table 4.2. Meter reading data from the control building and target building.
These months were chosen to allow comparability pre-and post-retrofit, as the
target building underwent retrofit from September 2014 until February 2015. The
building data show the advantage of the meter readings was not being embedded
with the general gas use, so avoiding technique errors from disaggregating it from
general gas use. There are two different meter reading records, one for hot water
and another for space heating in kWh.
Temperature data were not cleaned as there was insufficient information to decide
what points are erroneous, as participants do not follow a pattern or physical rules.
As Love (2014) noted in a similar study where temperature data were collected,
“…in this study of people and buildings in which the true model is unknown and,
unlike building fabric, people do not follow physical rules, it cannot be assumed
that points which lie far from the others are erroneous” (ibid., 2014, p.146).
4.5.2. Mean standardised internal air temperature calculation
This metric of mean standardised internal air temperature comparisons was
constructed following other studies (Oreszczyn et al., 2006; Love, 2014) to ensure
comparability from one year to another in this study and permit comparability with
other studies. Standardisation makes internal temperatures independent of external

95
meteorological conditions (Oreszczyn et al., 2006). This work standardises mean
internal air temperatures to a fixed external temperature of 5ºC38 according to the
following four steps.
First, days with mean external temperatures above 15ºC were excluded to improve
the prediction of mean internal air temperatures in the heating season, because the
heating system would normally be switched off because incidental heat gains
provided adequate heating (Oreszczyn et al., 2006).
Second, the mean internal temperature was calculated daily. Third, two regressions
between mean internal and mean external temperatures were carried out: one pre-
retrofit and other post-retrofit. Fourth, a 5ºC single external temperature was
selected so as to derive the internal air temperature for the target building pre-
retrofit (T1) and post-retrofit (T2) using the calculated regressions.
The metric’s change in mean standardised internal air temperature is calculated as:
𝜟 𝑻 = (𝑻𝟐 (𝑻𝒆𝒙 = 𝟓º𝑪) – 𝑻𝟏(𝑻𝒆𝒙𝒕 = 𝟓º𝑪)) Equation 4-1
Where:
𝛥 𝑇 is the difference in mean internal air temperature under standardised
conditions;
T1 is the standardized mean internal air temperature (°C) for pre-retrofit;
T2 is the standardized mean internal air temperature (°C) for post-retrofit.
38 It should be noted that the average heating season temperature in the UK is higher
– 6.3ºC (Oreszcyn et al., 2006). Oreszczyn, T., Hong, S.H., Ridley, I. and
Wilkinson, P. (2006) 'Determinants of winter indoor temperatures in low income
households in England', Energy and Buildings, 38(3), pp. 245-252.

96
4.5.3. Internal temperature profile calculation
The profile temperature was constructed by plotting the daily mean internal air
temperatures (°C) so as to observe changes in 24-hour heating periods. The derived
plotted graphs show hourly mean internal air temperature values. A trend curve
was also plotted on the profile temperature graphs, before and after the upgrade so
as to compare them to the BREDEM-12 internal temperature profile (Anderson et
al., 2002).
4.5.4. Normalised space heating consumption calculation
The metric change in normalised space heating consumption was constructed
following other studies (e.g. Hong et al., 2006) to provide a means of comparing
the consumption before and after the upgrade. Space heating consumption was
normalised for the variation in indoor–external temperature (heating degrees
days39) and dwelling size (e.g. Hong et al., 2006). The daily mean internal base
temperature was set up to the number of days that the mean outdoor temperature
was equal to or below 15°C.
The change in space heating consumption following the retrofit is calculated for the
target building (Ea) and control building (Eb) through the difference in space
heating consumption under normalised weather and dwelling size conditions:
𝜟 𝑬𝒂 = 𝑬𝒂𝟐 (𝑯𝑫𝑫 = 𝟏𝟓) – 𝑬𝒂𝟏(𝑯𝑫𝑫 = 𝟏𝟓) Equation 4-2
𝜟 𝑬𝒃 = 𝑬𝒃𝟐 (𝑯𝑫𝑫 = 𝟏𝟓) – 𝑬𝒃𝟏(𝑯𝑫𝑫 = 𝟏𝟓) Equation 4-3
1 = pre-retrofit and 2 = post-retrofit
Where,
𝜟 𝑬𝒔 = 𝑬𝒂 − 𝑬𝒃 Equation 4-4
39 Heating degree days use external temperature data from the weather station at
Newcastle Airport.

97
Δ Es is the difference in space heating consumption under normalized weather and
dwelling size conditions for the buildings under study (target (a) and control (b))
(Wh/K/m2/day);
Ea is the weather-normalised space heating consumption for the target building
(Wh/K/m2/day);
Eb is the weather-normalised space heating consumption for the control building
(Wh/K/m2/day).
4.5.5. Secondary heating: electricity consumption for space heating calculation
As was noted in Section 4.3.2, monthly electricity meter readings were collected
from each participant’s dwelling at the target building, before and after retrofit
insulation. Furthermore, structured interviews were carried out to identify the
ownership and use of secondary heating during the retrofit process. Interviews were
carried out during the different stages of the retrofit process to obtain information
about secondary heating (see implementation overview in Section 4.4).
Additionally, self-completion diaries and follow-up interviews were carried out at
different stages of the project in the target building, before and after the upgrade, in
which each participant filled in self-completion heating diaries for one week. The
information provided from the different sources showed that residents did not use
other heating sources such as electrical heaters; therefore, this metric and analysis
were not developed for this research study.
4.5.6. Activity profile calculation
The aim of the analysis was to explore the change in the use of space that may
derive from the effects of retrofit insulation on common patterns of activities. This
method groups common daily activities from self-completion diary data from the
sample group. 126 diaries were analysed (14 days x 9 dwellings), according to the
following method.

98
The first step is concerned with the codification of the sequence of activities for
each day and dwelling in which 126 sequences were obtained. The activities are
classified according to Table 4.3.
Activity types Activity code
Sleeping A
Personal care B
Mealtime C
Creative and fun D
Physical activities E
Social activities F
Work or study related G
Joint activities H
Cleaning I
Out of home J
Table 4.3. Activity types codified into 10 characters.
Secondly, sequences of activities are transformed on the activity profile by using a
method to group the sequences (see more detail in Annex H). Identification of the
activity profile is obtained by manipulating sequences of activities. One of the
simplest methods of obtaining the activity profile is that of the use of a Position
Weight Matrix (PWM) method. The PWM is a matrix M, generated by A×w, where
A is a sequence of activities (e.g. A, B, C, An) and w is the length of a window on
a sequence (e.g. 19 hours).
A position weight matrix can be obtained by using different methods such as a direct
frequency method or Markov chain. Using parsimonious criteria a direct frequency
method was chosen, whereby the matrix M for each pattern can be defined as the
relative frequency of x at position p, selecting the highest value from each column
in which each column represents a probability distribution (Dong and Pei, 2007).
The suitability of the PWM method was first tested using data from the pilot survey.
More detail is given in Annex H.
Two activity profiles for pre- and post-retrofit are constructed by using this method.
The two activity profiles are diagrammed and compared to provide a means of

99
evaluating the change in the use of space before and after the upgrade in Figures
4.3 and 4.4.
Figure 4.3 shows the pre-retrofit activity profile to represent how occupants
perform common in-home activities.
Figure 4.3. Pre-retrofit activity profile including the most frequent activities whose
frequency is above 0.2.
Figure 4.4 shows the post-retrofit activity profile to represent how occupants
perform different in-home activities.
Figure 4.4. Post-retrofit activity profile including the most frequent activities
whose frequency is above 0.2.
Finally, the activity profiles are:
Pre-retrofit =
[AB][DAB][DC][DIJ][JD][JD][JD][JD][JD][JD]DDDDDD[AD]AA;
Post-retrofit =
[AB][B][C][JI][JD][DJ][DJ][JD][JD][JD][JD][JD][DCJ][DJ][DJ][DJ][DA]AA.
4.5.7. Actively occupied rooms calculation
The aim of the analysis was to explore whether the level of activities change during
the time that occupants were at home as a response to the retrofit. The activities
that occupants perform within a day were derived from the activity profiles
1 2 3 4 5 6 7 8 9 10 11 12 13 14 15 16 17 18 19
56% 28% 21% 25% 34% 43% 29% 34% 35% 27% 34% 34% 31% 33% 35% 45% 33% 58% 82%
27% 26% 20% 24% 26% 20% 21% 20% 26% 25% 33%
22% 21%
A D D D J J J J J J D D D D D D A A A
B A C I D D D D D J D
B J
Activity frecuency above
20%
Time period
Activity Profile
1 2 3 4 5 6 7 8 9 10 11 12 13 14 15 16 17 18 19
71% 44% 30% 28% 42% 39% 35% 36% 36% 30% 51% 36% 23% 24% 34% 34% 40% 77% 92%
12% 19% 26% 28% 30% 33% 27% 21% 23% 25% 21% 23% 28% 22% 37%
21%
A B C J J D D J J J J J D D D D D A A
B I D J J D D D D D C J J J A
J
Activity frecuency above
20%
Time period
Activity Profile

100
constructed in the previous section 4.5.6. Following this, the activities have been
matched to metabolic rates from Table 4.4.
Activity Metabolic Rate (met unit)
Sleeping 0.7
Reclining 0.8
Seated, quiet 1.0
Standing, relaxed 1.2
Reading, seated 1.0
Writing 1.0
Cooking 1.6–2.0
House cleaning 2.0–3.4
Seated, heavy limb movement 2.2
Dancing, social 2.4–4.4
Calisthenics/exercise 3.0–4.0
Table 4.4. Metabolic Rates for Typical Tasks. Source: ‘Table 5.2.1.2 Metabolic
rates for Typical tasks’ (ANSI/ASHRAE, 2013)
The number of hours per day that rooms might be actively occupied is a binary
status 0 and 1 that represents the condition of occupied rooms when the met is ≥ 1.
The metrics’ change in actively occupied rooms is calculated as:
𝜟 𝑨𝒐 = 𝑨𝒐𝟐 – 𝐀𝐨𝟏 Equation 4-5
Where:
Δ Ao is the difference in the number of hours per day that occupants might occupy
their rooms, pre- and post-retrofit;
Ao1 is the number of hours per day that occupants might occupy their rooms pre-
retrofit;
Ao2 is the number of hours per day that occupants might occupy their rooms post-
retrofit.

101
4.5.8. Use of heating
This study uses self-completion heating diaries to understand if the energy
efficiency upgrade changes the perception of heating patterns. An analysis based
on the information of the self-completion heating diaries was planned, but this
metric was not further developed because self-completion heating diaries were
handed back in blank.
4.5.9. Thermal comfort perception calculation
This study investigates the changes in the perception of thermal comfort following
retrofit insulation. Thermal comfort perception data were collected from the
structured questionnaires carried out pre- and post-retrofit (see Section 4.3.3 and
questionnaire in Annex E). This study compared the change in mean thermal
comfort perception. In addition, the mean thermal comfort-related topics perception
was also measured such as level of draught, noise level (external noise), external
appearance and level of health (related to cold–diseases).
4.5.10. Theme analysis
Two sets of analysis were carried out on the interview data, one for the
predetermined themes related to:
- Use of main heating and secondary heating,
- Thermal comfort perception,
- Ventilation,
- Infiltration;

102
while the other analysis method was used to analyse the emergent themes from the
post-retrofit data. Three or more quotes were linked and superimposed to form a
theme from this analysis.
4.6. Limitations of the Data Collection Methods
Quasi-experimental methods have proved to be useful in other research studies
(Hong et al., 2006; Oreszczyn et al., 2006; Love, 2014). However, they have
known theoretical and practical limitations (Sorrell, 2007). In this study there have
been major practical limitations. First, exogenous factors, which may modify the
demand of the energy service, and confounding variables40 have not been fully
controlled. Second, there was the use of a small and non-randomised sample size,
15 participants for measuring the internal air temperature with a high attrition rate
of 40%. Third, there was a reduced spatial and data capture monitoring set-up (one
internal air temperature data logger in each participant’s living room) and reduced
time-resolution data (space heating consumption collected one per month).
The study includes qualitative measures, which enables the study of interactions
between occupants and the physical system. However, self-completion diaries have
limitations such as the ‘risk of honest forgetfulness’ and the ‘risk of retrospection
error’ which may lead to ‘uncertain compliance’ (Bolger et al., 2003, p. 594).
Although the qualitative and quantitative information was tested with the
concurrent triangulation design, in which self-completion diary data, follow-up
interviews, internal air temperature and space heating consumption data were used
to check the findings. Furthermore, follow-up interviews were used to corroborate
the information from self-completion diaries. Acknowledging these limitations,
this study sought to capture only the general routine of the occupants from the
diaries. The use of space was evaluated estimating the activity profile, which
represents the common patterns of activities, and estimating the actively occupied
rooms, which represent the level of activities at home.
40 Differences in the space-heating outcome in the target building and control
building that are not due to the retrofit insulation.

103
It is important to note that these measurements do not give information to quantify
how much heating consumption has changed (or the heating periods) as a result of
retrofitting. This is not an exact description of every practice under the use of either
space concept or exact number of hours of heating. But rather it is expected to
explain qualitatively the change in the use of space following retrofit, understanding
the circumstances of individual households and factors which might be lost in an
analysis of space heating consumption or internal air temperatures by itself.
In the Discussion Chapter, theoretical and practical limitations are critically
explored to suggest how the methodology could be improved in future studies.
4.7. Summary
This chapter has outlined the research methods used for the data collection, analysis
and construction of metrics. The research methods for data collection such as
detailed monitoring, meter readings, structured questionnaire, self-completion
diaries and follow-up interviews, and a semi-structured questionnaire, have been
explained and justified. This chapter explains also how the study was implemented
in eight stages, in order to capture long-term patterns of physical monitoring and
occupancy data in a high-rise social housing building.
This chapter has also described the data analysis steps and the metrics constructed
to answer the Research Questions in Chapters 5, 6 and 7. Finally, this chapter has
also described the main methodological limitations of this research.

104
5. Chapter 5. Results Part 1: Internal Air Temperatures and
Space heating Consumption
5.1. Introduction
To understand the effect of retrofit insulation in a high-rise social building, four
research questions have to be addressed:
- How do internal temperatures change following an imposed building fabric
retrofit insulation?
- How does space heating consumption changes following an imposed
building fabric retrofit insulation?
- Which interactions between occupant behavioural factors and physical
factors may produce space heating consumption change?
- Why do internal air temperatures change afterwards?
These Research Questions are situated within current research assumptions and the
main theoretical approaches (Chapter 2). The first and second Research Questions
are based on the premise that temperature take-back after a retrofit exists and can
be observed (see research assumptions in Section 2.4). Previous quantitative
studies have measured the temperature take-back, which is usually higher in low-
income dwellings, as those are often not warm enough for occupancy (Milne and
Boardman, 2000; Sorrell et al., 2009) (Section 2.4). However, it was also shown
that there is a limited understanding of the relationship between temperature take-
back and low-income dwellings as other variables also influence the space heating
consumption following retrofit as pre-intervention internal temperatures.
First, the results related to internal air temperatures (Research Question 1) are
presented in this chapter, according to the data analysis procedure described in
105
Section 4.5. Section 5.2.1 shows the change of mean internal air temperature,
standardised at 5˚C external temperature, following retrofit and Section 5.2.2 shows
the internal temperature profile. This profile is constructed to understand whether
the study’s internal temperature profile follows the heating regime assumption of
the BREDEM-12 internal temperature profile (Anderson et al., 2002).
The results related to the impact of the energy efficiency retrofit interventions on
changes in space heating consumption (Research Question 2) are presented in
Section 5.3. Section 5.3.1 shows the normalised space heating consumption
following retrofit for the target building and the relative difference between the
target building and control group building. Section 5.3.2 shows a comparison of
the gas consumption of the target building with the national average. The reader is
reminded that each table and graph shown in this thesis should be interpreted with
caution, because it is unlikely to be representative of a larger sample than the
building scale studied.
5.2. Internal Air Temperature
5.2.1. Mean standardised internal air temperature
Figure 5.1 shows internal air mean temperatures at different external temperatures
before and after the retrofit. Figure 5.1 also shows that the mean standardised
internal air temperature (at 5°C external temperature) ranged from 22.07°C to
22.53°C for the sample (9 dwellings). This is +0.46°C or +2% higher than before
the upgrade.
If it is assumed that 21°C, the recommended temperature for healthy environments
(DCLG, 2006), is the maximum level of thermal comfort, then Figure 5.1 shows
that the internal threshold temperature was achieved even before the retrofit. This
may suggest that the fabric efficiency upgrade increased internal air temperatures
beyond the recommended internal air temperature for a healthy environment.

106
Figure 5.1. Standardised mean internal air temperature of the target building, at 5°C
external temperature. Pre- and post-retrofit (n = 9).
5.2.2. Internal temperature profile
Figure 5.2 and Figure 5.3 illustrate the observed internal temperature profile, pre-
and post-retrofit respectively. Figure 5.2 and Figure 5.3 are represented by a fourth-
order polynomial and show that the mean internal temperature profiles (non-
standardised), pre-and post-retrofit, are similar. Furthermore, the figures show that
the maximum temperature difference within a day is negligible. For example, pre-
retrofit, there is a small difference of less than 1°C between 23.7°C and 24.5°C
within a day. Post-retrofit, there is also a small difference from 22.8°C to 24.0°C
(1.2°C). These small maximum temperature differences (1°C-1.2°C) suggest that
before and after the retrofit dwellings have a quasi-flat internal temperature profile.
This profile is constructed to understand if the study’s internal temperature profile
follows the heating regime assumption of the BREDEM-12 internal temperature
profile. BREDEM assumes a fixed heating demand. For zone 1, the living room,
the heating demand temperature (thermostat heating) is 21°C, while the heating
period is 9 hours on weekdays (07:00-09:00 hrs, 16:00-23:00 hrs), and 16 hours at
weekends (07:00-23:00) (Anderson et al., 2002; Huebner et al., 2013a). Outside

107
these time periods the heating is assumed to be off (Anderson et al., 2002; Huebner
et al., 2013a) (see Figure 2.5. p.47).
The flat internal temperature profile of this study does not follow the heating regime
assumption of the BREDEM-12 internal temperature profile (Anderson et al.,
2002). This may suggest the absence of occupant-controlled heating periods and
the heating period length changes as defined by BREDEM-12. See h1 and h2
defined heating period lengths in Figure 2.5. p.47. Consequently, this absence of
pre- and post-retrofit heating periods may suggest that the increase in the
standardised mean internal air temperature following the upgrade (+0.46°C) is the
result of unheated periods. In other words, the increase in the standardised mean
internal temperature is the result of building-related physical processes rather than
occupant behavioural factors.

108
Figure 5.2. Internal temperature profile, pre-retrofit (non-standardised mean
internal air temperature) (n = 9).
Figure 5.3. Internal temperature profile, post-retrofit (non-standardised mean
internal air temperature) (n = 9).
This can also be seen in Table 5.1, in which the single shift in internal air
temperatures was 0.3˚C from 08:00 to 09:00 (pre-retrofit) and -0.5˚C from 23:00 to
00:00 (post-retrofit).
.

109
Time
hr
Time range
(hr)
Mean internal
air
temperature
Pre-retrofit
(˚C)
Change in
mean internal
air
temperature
Pre-retrofit
per hour (˚C)
Mean
internal air
temperature
Post-retrofit
(˚C)
Change in mean
internal air
temperature Post-
retrofit per hour (˚C)
1 01:00 - 02:00 24.0 -0.1 23.2 -0.1
2 02:00 - 03:00 23.9 -0.1 23.0 -0.2
3 03:00 - 04:00 23.8 -0.1 22.9 -0.1
4 04:00 - 05:00 23.7 -0.1 22.8 -0.1
5 05:00 - 06:00 23.7 0 22.8 0
6 06:00 - 07:00 23.8 0.1 22.8 0
7 07:00 - 08:00 23.9 0.1 23.0 0.2
8 08:00 - 09:00 24.2 0.3 23.3 0.3
9 09:00 - 10:00 24.1 -0.1 23.5 0.2
10 10:00 - 11:00 24.0 -0.1 23.5 0
11 11:00 - 12:00 24.0 0 23.5 0
12 12:00 - 13:00 24.1 0.1 23.4 -0.1
13 13:00 - 14:00 24.2 0.1 23.4 0
14 14:00 - 15:00 24.2 0 23.5 0.1
15 15:00 - 16:00 24.2 0 23.7 0.2
16 16:00 - 17:00 24.3 0.1 24.0 0.3
17 17:00 –
18:00
24.4 0.1 23.9 -0.1
18 18:00 - 19:00 24.4 0 23.9 0
19 19:00 - 20:00 24.3 -0.1 23.9 0
20 20:00 - 21:00 24.2 -0.1 23.8 -0.1
21 21:00 - 22:00 24.1 -0.1 23.7 -0.1
22 22:00 - 23:00 24.1 0 23.8 0.1
23 23:00 - 00:00 24.0 -0.1 23.3 -0.5
24 00:00 - 01:00 24.1 0 23.3 0
Table 5.1. Internal temperature profile (˚C) pre- and post-retrofit (non-standardised,
n = 9).

110
5.3. Space Heating Consumption
5.3.1. Normalised space heating consumption
Table 5.2 shows that the change in normalised space-heating consumption
following the retrofit for the space heating target building was -27%. Table 5.2 also
shows that the change in mean space heating consumption in the control building
during the same period was 7%. As a result, the relative difference between the
target and control group is -34%.
Target
building
Wh/K/m2/day
Control
building
Wh/K/m2/da
y
Difference Target vs
Control Building (%)
Pre-retrofit 2014
0.0184 0.0460
Post-retrofit 2015 0.0134 0.0494
∆ % -27% 7% -34%
Table 5.2. Normalised space heating consumption percentage change in the target
building, control building, and relative to each other.
5.3.2. Gas consumption in the target building and national average
Table 5.3 shows the annualised gas consumption for an average property in England
and Wales with the following characteristics: floor area (50 m2 or less); tenure
(council housing); income (less than £15,000 per year); number of adults living at
the residence (1 adult living at the property); and deprivation level (1st Quintile
most deprived) for the years 2012 and 2013. This gas consumption is compared
with the target building.

111
The comparison shows that the target building dwellings consumed considerably
less than an average national consumer, in each category and every year analysed.
For instance, in 2013 this difference was more than 5000 kWh per year in each
category. This comparison should be treated with caution, because UK national gas
consumption has been adjusted to external temperature. The normalised space
heating consumption following the retrofit for the target building of -27% or -34%
relative to the control building is contextualised relative to the national average and
should be seen in the context of low gas consumption for the target building (see
also SHC including all the meter readings, estimated and directed, in Annex I).
Annualised mean gas consumption (kWh)
Year/
Category
Target
building
(n=88)
50 m2
or
less1
By
tenure,
council
housing2
Less than
£15,000 per
year income
3
By
number
of adults;
1 adult 4
1st
Quintile
(most
deprived)5
2012 1632 7400 10700 11700 11900 11600
2013 1660 7300 9800 11200 11400 11100
1Table 1: Gas consumption by floor area (square metres). England and Wales
2Table 9: Gas consumption by tenure. England and Wales `
3Table 11: Gas consumption by household income. England and Wales
4Table 13: Gas consumption by number of adults. England and Wales
5 Table 23: Gas consumption by Index of Multiple Deprivation (England)
Table 5.3. Annualised mean gas consumption for England and Wales against the
target building consumption between 2012 and 2013. Source: DECC (2013a)
5.3.3. Electricity consumption for the non-heating season
Table 5.4 compares the mean electricity consumption between pre- and post-retrofit
between June and September (non-heating season) 2014/2015, in order to
understand if occupants may adapt their environment by using cooling appliances
(i.e. fan, air conditioning) after the retrofit. The change in electricity consumption

112
following the retrofit for the target building (n = 8) was +2%. Thus, the presence
of energy efficiency retrofits appears to have not much of an impact on electricity-
consumption increases in the non-heating season. However, it should be noted that
these data have not been weather-standardised, because there is not enough
information to determine which proportion of the electricity consumption is related
to cooling appliances and only a small sample size was analysed.
Electricity consumption
(n=8)
Mean electricity
consumption (kWh)
Standard error of mean
(kWh)
Pre-retrofit 123 16
Post-retrofit 126 20
∆ % (2%)
Table 5.4. Mean electricity consumption pre- and post-retrofit and standard error of
mean in the target building. Source: monitored energy meter readings (n = 8).
5.4. Conclusion
This chapter set out to answer Research Questions 1 and 2. The first Research
Question – How do internal temperatures change following an imposed building
fabric retrofit insulation? was answered by comparing the changes of the mean
standardised internal air temperature and the internal temperature profile, before
and after the retrofit by using monitored data from 9 flats.
The mean internal air temperature increased +0.46˚C, or 2% following the upgrade,
from 22.07˚C to 22.53˚C (at standardised condition 5˚C external temperature). If
21˚C is defined as the ‘comfort temperature’ desired by occupants, the energy
efficiency upgrade increased internal temperatures beyond the “comfort
temperature”. In addition, the analysis of the internal temperature profile suggests
that dwellings tended to have a flat temperature profile, which contrasted with the
BREDEM-12 (Anderson et al., 2002) heating regime assumption of constant daily
heated hours throughout the heating season. Hence, this may imply that the increase
in the mean internal temperature is due to physical processes, since the increase of
the mean internal air temperature is the result of the unheated periods.
113
The second Research Question – How does space heating consumption change
following an imposed building fabric retrofit insulation? was answered by
comparing the changes of normalised space heating consumption pre- and post-
retrofit. The normalised space heating consumption change following the retrofit
relative to control group was -34%. The results of space heating consumption
seems like a very successful undertaking; however, a 34% space heating
consumption reduction after the retrofit should be seen in the context of low gas
consumption for the target building. In addition, the presence of energy efficiency
retrofits appears to have very little impact on electricity consumption in the non–
heating season (i.e. cooling).
In attempting to explain the effects on space heating consumption and internal air
temperature, this type of analysis of monitored data has been successful. However,
it has limitations, since it cannot explain which interaction between behaviour and
the physical factor may explain the change in space heating consumption following
the retrofit. The next chapter addresses these limitations by the analysis of how
occupants adjust the use of space and thermal comfort perception. In addition,
Chapter 7 includes the insight gained through the face-to-face interviews to
understand why those outcomes occurred.
114
6. Chapter 6. Results Part 2: Interactions between Occupant
Behavioural and Physical Factors
6.1. Introduction
The previous chapter described how the mean internal temperature and space
heating consumption changed following the retrofit. This Result Chapter is devoted
to understanding which interaction between behavioural and physical factors may
produce a space heating consumption change (Research Question 3).
Research Question 3:
- Which interactions between occupant behavioural factors and physical
factors may account for space heating consumption change?
The third Research Question is based on the premise that physical and occupant
behavioural factors seem to form a complex system (Lowe et al., 2012; Love,
2014), in which temperature take-back is accounted for by the physical factors and
the remainder by the occupant’s behavioural change (Hong et al., 2006; Sanders
and Phillipson, 2006; Sorrell, 2007) (see research assumptions in Section 2.4).
However, to date, the factors determining energy use in buildings are complex and
often poorly understood (Oreszczyn and Lowe, 2010). Based on previous research
this research proposed to investigate how occupants may adjust the use of space
and use of heating.
Trying to catalogue the types of interactions in the use of space that may occur
following retrofit insulation, this research proposed to study: 1) changes that may
derive from the effects of retrofit insulation on the common patterns of activities
(activity profile); and 2) the change in the level of activities during the time that
occupants were at home, as a response to retrofit insulation (actively occupied
room).

115
In addition, this study uses qualitative methods to understand whether the energy-
efficiency upgrade changes the perception of thermal comfort.
6.2. Activity Profile
Figure 6.1 shows the activity profile or the common daily activities41 performed
pre- and post-retrofit. Figure 6.1 also shows that the common activities performed
pre- and post- retrofit, in the same period, were similar. In general, a morning
period of activity (i.e. cleaning, cooking and personal care), is followed with a
period of inactivity when the occupants may go out or perform an activity at home
classified as creative and fun, such as watch TV. Following this period, after 17:00,
there is another period of activity until 22:00, when bed-time comes. Perhaps, the
major difference between pre- and post-retrofit seems to be that post-retrofit
emphasises the likelihood of being out-of-home between 17:00 and 22:00 hrs.
Consequently, comments collected from the participants through the follow-up
interviews also indicated the occupants do not perceive that retrofit insulation
changes common routines at home.
Figure 6.1. Graph showing the activity profiles, pre- and post-retrofit.
41 10 daily activities measured (see Annex H).

116
6.3. Actively Occupied Rooms
Table 6.1 shows that the level of activities during the time that occupants were at
home between 06:00 to 01:00. Table 6.1 also shows that a shift in the level of
activities that rooms might be actively occupied (>=1 met), pre- and post-retrofit
was similar. It should be noted that this metric is not a measurement of space
heating consumption and therefore does not give quantitative information about
how much heating consumption has changed (or the heating periods) as a result of
retrofitting. It shows, however, that the number of hours that level of activities
measured through metabolic rate did not change considerably.
6.4. Use of Heating
It was not possible to categorize the heating periods of the dwellings from the self-
completion heating diaries, because most of them did not use the heating at all.
Self-completion ‘heating diaries’ were most of the time returned blank even in the
pre-retrofit surveying periods and others had very inconsistent heating schedules,
for example, a short length of time after the shower.

117
Pre-retrofit Post-retrofit
Time period Activity
profile *
Average
Met unit
**
Actively
occupied
rooms
(hrs)
Activity
profile
*
Average
Met unit
**
Actively
occupied
rooms
(hrs)
06:00-07:00 [AB] 1.0 1 [AB] 1.0 1
07:00-08:00 [DAB] 1.0 1 [B] 1.2 1
08:00-09:00 [DC] 1.4 1 [C] 1.8 1
09:00-10:00 [DIJ] 1.9 1 [JI] 2.7 1
10:00-11:00 [JD] 1.0 1 [JD] 1.0 1
11:00-12:00 [JD] 1.0 1 [DJ] 1.0 1
12:00-13:00 [J] 0 0 [DJ] 1.0 1
13:00-14:00 [JD] 1.0 1 [JD] 1.0 1
14:00-15:00 [JD] 1.0 1 [JD] 1.0 1
15:00-16:00 [JD] 1.0 1 [JD] 1.0 1
16:00-17:00 [DJ] 1.0 1 [JD] 1.0 1
17:00-18:00 [D] 1.0 1 [JD] 1.0 1
18:00-19:00 [D] 1.0 1 [DCJ] 1.4 1
19:00-20:00 [D] 1.0 1 [DJ] 1.0 1
20:00-21:00 [D] 1.0 1 [DJ] 1.0 1
21:00-22:00 [D] 1.0 1 [DJ]` 1.0 1
22:00-23:00 [AD] 0.9 1 [DA] 0.9 1
23:00-00:00 [A] 0.7 0 A 0.7 0
00:00-01:00 [A] 0.7 0 A 0.7 0
(*) activities described in Table ‘Activity types’ in Annex H
(**) met unit described in Table 5.4.
Table 6.1. Actively occupied rooms pre- and post-retrofit (n = 9).
6.5. Thermal Comfort Perception
Figure 6.2 shows that the energy efficiency upgrade appears to have been associated
with an increased thermal comfort perception in which occupants reported

118
transitioning from feeling warm to very warm. This topic is further investigated
with qualitative data in Chapter 7.
The thermal comfort-related topics in Table 6.2 show that it appeared that the
building had an improvement from bad to good (mean). In addition, both the level
of draught and perceived cold-related illness were not perceived as big
improvements since they were well evaluated before the upgrade.
Items used a 5-point Likert scale (for example 1= Very cold, 2 = cold, 3 = neutral,
4 = warm, 5 = Very warm)
Figure 6.2. Bar plot of mean thermal preferences (n = 9), the lines in the bars
represent the standard deviation votes of thermal perception, pre- and post-retrofit.

119
Mean
Thermal comfort-related topics Pre-retrofit Post-retrofit
Appearance 4 - bad 2 - good
Cold-related illness 2 - good 2 - good
Draught 3 - neutral 5 - no draught at all
Table 6.2. Mean preference votes of ‘cold-related illness’, appearance and draught
from the longitudinal study (n = 9).
6.6. Conclusion
This chapter set out to answer Research Question 3, namely: which interactions
between occupant behavioural factors and physical factors may account for space
heating consumption change?. Based on previous research assumptions (Section
2.4), this research proposed to investigate how occupants may adjust the use of
space and use of heating.
Trying to catalogue the types of interactions in the use of space that may occur
following retrofit insulation, this research proposed to study: 1) changes that may
derive from the effects of retrofit insulation on the common patterns of activities
(activity profile); and 2) change in the level of activities during the time that
occupants were at home, as a response to retrofit insulation (actively occupied
room). The results showed that the common activities performed pre- and post-
retrofit, in the same period, were similar in terms of metabolic rates and time of the
day, pre- and post-retrofit.
In addition, this study uses qualitative methods to understand if the energy
efficiency upgrade changes the perception of thermal comfort. The study also
found that the presence of the energy efficiency upgrade appears to be associated
with an increased thermal comfort perception, transitioning from a perception of
feeling warm to very warm. Appearance of the building had a perceived

120
improvement and both the level of draught and perceived cold-related illness were
not perceived as big improvements since they were well evaluated before the
upgrade. It was not possible to categorize the heating periods of the dwellings from
the self-completion heating diaries, because most of them did not use the heating at
all.

121
7. Chapter 7. Results Part 3: Why Internal Air Temperatures
Change Afterwards?
7.1. Introduction
Having described in the previous chapters the detailed findings from the following
Research Questions:
- How do internal temperatures change following an imposed building fabric
retrofit insulation?
- How does space heating consumption changes following an imposed
building fabric retrofit insulation?
- Which interactions between occupant behavioural factors and physical
factors may account for that space heating consumption change?
this part of the analysis is devoted to gain qualitative insights to answer the research
question:
- Why do internal air temperatures change afterwards?
Sections 7.2 and 7.3 show the perception of heating usage. The perception of the
level of warmth is described in Section 7.4. Following this, Sections 7.5 and 7.6
address the perception of infiltration and ventilation. Other perceived positive
outcomes of the retrofit such as a reduction in noise and external appearance
improvement are described in Section 7.7. Finally, the level of knowledge of the
occupant about the imposed retrofit insulation is described in Section 7.8.

122
7.2. Heating Usage
The level of heating usage mentioned by the occupants, pre- and post- retrofit is
low. A male participant mentioned that they have not switched-on the heating for
years.
“I’ve never used … strange enough they are coming to check the heating
now, because I think they looked at the meter and you see it doesn’t move for so
many years, and so maybe they think is broken … it doesn’t move because I’ve
never turned up”
(Participant 5, post-retrofit interview).
A male occupant described that he had switched-on the heating only on cold days.
“Since March, which was the same with the previous system (referring to
the heating periods), I don’t have the heating on, other than one or two extreme,
extremely cold days, which you will see on the survey … they got switched-on in the
back of April, for I think it was just for 1 hour or 2, 2 or three days, that was all.
But generally, the heating’s not been on since March”
(Participant 4, post-retrofit interview).
Participant 8 mentioned that he does not use the heating even pre-retrofit, “I’ve
never used my heating anyway in the whole time that I’ve been in here” (Participant
8, post-retrofit interview).
This was also evident when occupants were asked to fill in self-completion ‘heating
diaries’ (Section 6.4). It was not possible to categorize the heating periods of the
dwellings using the heating diaries, because most of them did not use the heating at
all (self-completion ‘heating diaries’ were most of the time returned blank even in
the pre-retrofit surveying periods) and others had very inconsistent heating
schedules, e.g. a short length of time after the shower.
123
7.3. Secondary Heating
Before the retrofit it was unusual that the occupants felt the need to use secondary
heating. Structured interviews were carried out to identify the ownership and use
of secondary heating during the retrofit process, and during the different stages of
the retrofit process (see Section 5.4) it was showed that residents did not use other
heating sources such as electrical heaters. At the time of the pre-retrofit monitoring
all of them mentioned that they regularly do not use the primary heating system,
and neither had they used a backup heating (secondary system). Although, at the
time of the post-retrofit interview, a participant did mention the use of secondary
heating, but rarely, this appeared to be because of the noise of the primary heating.
7.4. Thermal Comfort
Consistently with the thermal comfort perception in Section 6.5 and the mean
internal temperature (>22º C), the post-retrofit interviews show that they have
transitioned from a level of warm to very warm.
“I can’t see any difference … It feels about the same to me … really warm”
(Participant 1, post-retrofit interview).
Moreover, concern about the summer time increased post-retrofit.
“It feels warm straight away, after the insulation of the wall, like you know
… the only thing that I don’t know when you got the summer, it is really hot”
(Participant 3, post-retrofit interview).
7.5. Ventilation
From the interviews opening windows appears to be the mean way of cooling down
the flats. According the occupants’ views, opening the windows wide was a
common behaviour even before the retrofit.

124
“I always have windows open all the time” (Participant 1, post-retrofit
interview);
“I tend to have at least one window open or a couple of windows open for
ventilation in and out, but it hasn’t changed, I’m still doing the same amount, and
I can’t see any comparative difference at this stage”
(Participant 4, post-retrofit interview).
One participant noticed an increase in his windows opening behaviour after the
retrofit - “I have to open the windows this year, just for a bit of fresh air”
(Participant 3, post-retrofit interview).
A conflict between fresh air and warmth was noticed during the night time by the
same male participant.
“It is still warm you know (after retrofit), I feel it more at night time in
bed. It is like a sauna sometimes, but the thing is you can’t leave the windows open
at night because the draught […] is very uncomfortable”
(Participant 3, post-retrofit interview).
However, on the positive side, the fact that residents can open the windows and
“control” the level of ventilation was well evaluated.
“The ventilation is pretty good, when you open the windows”
(Participant 3, post-retrofit interview);
“If you can open fully way [it] is good, it is alright until you get really hot
… in very hot weather you need the windows wide open, because of the
insulation now you don’t lose so much heat”
(Participant 8, post-retrofit interview).
7.5.1. The use of fans
The use of fans emerged from the conversations as a mechanism of adaptation for
cooling down the flats, which may have implications in the energy consumption in
summer or under future uncertain (warmer) climate conditions.

125
“It is fine, I just open the windows, if it gets hot, you know, I use my fan”
(Participant 1, post-retrofit interview);
“I’m using the fan a bit so it is getting a bit too warm”
(Participant 8, post-retrofit interview).
The analysis of electricity consumption in the non-heating season in Section 5.3.3
showed that there is not a considerable difference between the summer electricity
consumption before and after the retrofit. However, the electricity consumption
analysis may have a bias since the comparison was not weather-standardised as it
was not possible to isolate the cooling appliances’ consumption with the other
appliances. In addition, it includes September 2014, when the retrofit process
started.
7.6. Infiltration
Infiltration is referred to as an involuntary draught or air exchange through unsealed
parts of the building fabric such as the wall, windows or doors. Occupants
mentioned that they did not experience any draughts with the previous windows.
Although another finding emerged from the interviews; some residents commented
on draughts through the door.
“The only draught that I get is when it’s windy is from the front door …
when it is really windy, wind comes up from the staircase, you can't really stop it
… like you know”
(Participant 3, post-retrofit interview);
“... but the door still occasionally bang, I get a draught by my main door”
(Participant 5, post-retrofit interview).
This leads to another problem, the corridor has been mentioned by the occupants as
a common area where the heat is concentrated, although the opinions are diverse

126
about whether or not the installation of new windows improved the air ventilation
and indoor temperatures decreased in the corridor:
“I think it’s still the same, in fact that they modernised the windows, but it
was still the same windows, it is the last window, it is not really big…”
(Participant 3, post-retrofit interview);
“The corridor has a vast improvement, because overheating isn’t player
anymore, because previously you could not use the windows, because of the extreme
windows’ draught that come through, so you now can open the windows so the air
outside in the corridor can circulate ventilation and temperature is down. So that
it is good”
(Participant 4, post-retrofit interview);
“The corridor, it is as hot as it was”
(Participant 8, post-retrofit interview).
7.7. Other Positive Outcomes from the Retrofit Insulation
Occupants also commented about the positive effects of the retrofit such as the
reduction in noise and the improvement in external appearance:
“The building looks better on the outside and it is a pity that they have not
done inside” (Participant 1, post-retrofit interview);
“As I said, there is no noise I can’t hear anything”
(Participant 3, post-retrofit interview);
“It is definitely more quiet [sic], no external noise, so that’s a good thing”
(Participant 5, post-retrofit interview).

127
7.8. Level of Knowledge of the Occupant about the Imposed Retrofit
Insulation
Perceived understanding of the energy efficiency upgrade on actual energy savings
was not clear for the occupants, mainly because the level of heating usage was low
before the retrofit. Therefore, the extent to which dwellers perceived that the
upgrade was positive for them was not clear. For example, occupants identified
clearly the change with the windows, though they did not clearly perceive the
benefit of changing the windows (apart from the aesthetic, which did not please
everybody either).
“I did not see any difference, because before as well the windows were
double-glazed, they were quite new, I mean in the heating as I told you before it is
always warm, because of the people, the old people put the heating on”
(Participant 6, post-retrofit interview).
Note that this participant thinks the building is always very warm (even pre-retrofit)
because other tenants (mainly the older ones) tend to turn the heating on all the
time.
Interviewer: “Did you have any draught before with the previous
windows?”
Participant: “No, that’s why I did not see why they changed it…”
(Participant 7, post-retrofit interview).
“I think it is the glass, and what they said was, they are supposed to keep
the flat cool in the summer and warm in the winter, but to me it is just a myth …
Why they are so thick? (she asked to the window installer), they said they are really
good windows”
(Participant 2, post-retrofit interview).

128
7.9. Conclusion
This chapter provided a qualitative insight to explain why internal air temperatures
change following retrofit insulation. This qualitative evidence may indicate that
the studied building reached a limit of comfortable temperature. Participants
reported the low heating usage in Section 7.2. In addition, occupants reported
transiting from feeling warm to very warm (Section 7.4), the need for fresh air and
the trade-off between fresh air and warmth during the night time (Section 7.5). The
main adaptive action for cooling down the flat was opening windows. The changes
are fairly consistently negative in terms of perception of an increase in temperature
and ventilation; occupants perceived some positive effects of the retrofit such as the
reduction in noise and the improvement in external appearance.

129
8. Chapter 8. Discussion
8.1. Introduction
Four research questions were chosen to address the extent of the retrofit insulation
impact on space heating consumption in a high-rise social housing building:
- How do internal temperatures change following an imposed building fabric
retrofit insulation?
- How does space heating consumption changes following an imposed
building fabric retrofit insulation?
- Which interactions between occupant behavioural factors and physical
factors may account for space heating consumption change?
- Why do internal air temperatures change afterwards?
The results discussed in the result chapters provided useful insights into temperature
take-back after the building retrofit, but they are subject to theoretical and practical
methodological limitations. In this chapter the results are first discussed in Section
8.2 and a critical light is shed on the methodology and ways for improving it are
suggested in Section 8.3.

130
8.2. Results
8.2.1. Energy saving and temperature take-back
At first glance, the results of the upgrade42 seem to be a very successful undertaking,
providing a double-dividend; increased internal temperatures and reduced energy
consumption for space heating. The study observed that there is a reduction in
normalised space heating consumption of 27% or 34% (relative to the control
group) and an estimated increase in mean internal air temperatures was +0.46˚C
(from 22.07˚C to 22.53˚C). However, the empirical results do not support
assumptions normally made about low-income dwellings ‘taking back’ energy
savings as increased temperatures as the change in space heating consumption is
negligible in absolute terms and temperature take-back is relatively small (0.46˚C),
when it is compared to other authors, 0.73ºC43 (Hong, 2011) or from 0.4°C to 0.8°C
(Sorrel, 2007).
At the beginning of the research income restriction was proposed to explain the low
level of heating usage. Previous studies concerned with fuel poverty have
suggested that people tend to turn the heating down and/or limit heating to certain
rooms to minimise fuel bill expenditure (Anderson et al., 2010 ). However, the
evaluations of the empirical results suggest that a saturation effect has taken place,
which is explained in the next section.
8.2.2. Temperature take-back and saturation effects
The evidence collected from the study in the heating season suggests that the
internal temperature of the target building is reaching a limit of a maximum level
of thermal comfort (for example, 22.5˚C at 5˚C external temperature). Therefore,
42 Following the combined installation of external solid wall insulation and double
glazing
43 Full insulation

131
it seems to support Sorrel’s (2007) assumption that a saturation effect has taken
place.
Living room temperatures in the retrofitted dwellings for the heating season under
standardised external conditions of 5˚C temperatures are more than 2.5˚C higher
than conditions reported by previous studies for dwellings with energy efficiency
upgrades from the Warm Front study (Oreszczyn et al., 2006; Hong, 2011) and are
also considerably warmer than the average English dwelling conditions (Shipworth
et al., 2010). The evidence collected from the study suggests the flat dwellings
following retrofit insulation are reaching an upper level for temperature demanded
by occupants, the uncontrolled heat from the heating system and from hot water
pipes probably may also contribute to saturation, which is regulated by frequent
window opening.
This upper-level temperature may be taken as a saturation (neutral) temperature that
corresponds to an indoor air temperature from 22.8˚C to 24.0˚C for living rooms.
This result is consistent with saturation temperatures reported by Kavgic et al.
(2012), the authors reported temperatures from 22.5–24.5˚C in dwellings with
district heating, but it is higher than previous assumptions (Sorrell, 2007; Shorrock
and Utley, 2008).
This is further supported by four observations from the study. First, high internal
air temperatures were prevalent in the sample dwellings, both before and after the
retrofit. For example, 63% of the pre-upgrade recorded internal temperature was
above 23.5°C (Figure 8.1). This temperature is categorized by SAP-2012 as at
‘high risk’ of overheating (BRE, 2012) because, during hot weather, it is more likely
to be exposed to high internal temperatures (Zero Carbon Hub, 2015). Second,
space heating consumption is very low, before and after the retrofit and its change
is negligible in absolute terms. Third, the dwellings tended to have a flat internal
air temperature, which contrasted with the BREDEM-12 assumption of constant
daily heated hours throughout the heating season (Anderson et al., 2002). Fourth,
the presence of the energy efficiency upgrade appears to have been associated with
an increased thermal comfort perception in which occupants reported transitioning
from feeling warm to very warm.

132
Figure 8.1. Frequency distribution of internal temperature above 23.5°C (%) – pre-
retrofit insulation (n = 9).
8.2.3. Temperature take-back, and the relationship between physical factors and
occupant behavioural factors
The results based on the analysis of the internal temperature profile suggest that a
flat internal temperature profile in the heating season may be interpreted as showing
that physical factors (such as the increase in thermal resistance of the building)
could be playing a more important role than behavioural factors. The dwellings
tended to have a flat internal temperature profile which contrasted with the
BREDEM-12 assumption of constant daily heated hours throughout the heating
season (Anderson et al., 2002). This link, however, needs to be further investigated
as recent studies have theorised that occupant behavioural and (building) physical
factors form a complex system whose interactions change and co-evolve over time
(Lowe et al., 2012; Love, 2014).
8.2.4. Temperature take-back and occupant behavioural factors
The results suggest that the common daily activities were not adjusted in response
to the retrofit insulation (as a response to the internal air temperature increases).
This is in terms of metabolic rates and type of activities. Perhaps it is not surprising

133
that the empirical evidence collected in this study does not support the idea of a
change in the use of space, based on three main reasons.
First, flats are small (40-80m2) and therefore there is not enough space for
unoccupied areas, in which dwellers tend to use most of the space. Occupants in
smaller dwellings are less likely to expand the use of space in comparison with
larger dwellings with unheated rooms, as they perceive their dwelling as a ‘single
space’ (DECC, 2013b). Second, it is not possible to limit heating to certain rooms
to minimise fuel bill expenditure, as occupants only interact with their heating
system through the ’on/off’ button and thermostat or zoned controls are not
available in the heating control system (Annex D) (at least the main fuel heating
and there is no evidence of secondary heating usage). Third, if the dwellers would
have decided to turn the heating down in every room to minimise fuel-bill
expenditure, as mentioned by previous authors44, the retrofit works seemed to make
very little difference in changing heating usage.
8.2.5. Thermal discomfort
Qualitative evidence from interviews indicates a degree of thermal discomfort
following the retrofit, in which occupants perceive a transition from warm to very
warm (Sections 6.5 and 7.4). This thermal discomfort was also noticed at night
time as a conflict between fresh air and warmth (Section 7.4). For example, a
participant exemplifies this discomfort as sleeping in a ‘sauna’. Occupants tend to
adapt their environment when higher temperatures are experienced over an
extended period (Zero Carbon Hub, 2015). For example, in order to maintain an
adequate supply of fresh air following the upgrade, the occupants tend to keep the
windows opened or increased the window-opening behaviour (Section 7.5). Other
studies may offer further support to the idea that occupants tend to open the
windows when higher temperatures are experienced. Papantoniou (2015) observed,
in a study of similar high-rise social house buildings, that the east façade of the
building has always more than 50% of windows opened, no matter the day or the
time observed, ranging between 50% and 95%. However, Papantoniou’s study has
44 Although this was not mentioned by the participants.

134
to be interpreted with caution since the window-opening behaviour was observed
over a short time period and does not take account of other behavioural data.
The thermal discomfort experienced by the occupants and the increase in the
window-opening behaviour (as occupants can open their windows wide) may
suggest the existence of a maximum comfortable temperature in the heating season.
However, a risk of overheating in summer needs to be further investigated.
8.2.6. Measuring overheating
This study has not measured the effect of the retrofit on overheating, because it was
not the purpose of the research. However, the qualitative results show changes in
window-opening behaviour and thermal discomfort. More research is clearly
needed to establish whether or not there is a risk of overheating, especially when
there is a concern about the unintended overheating effects of a building fabric’s
retrofit on the occupant’s health (Davies and Oreszczyn, 2012).
In order to study overheating, it is recommended to include direct monitoring in
future attempts to measure overheating. This includes physical and behavioural
data, in longitudinal studies, as is shown in this study. In addition, an overheating
threshold needs a consensual agreement in the domestic sector to be reached. This
research area (overheating) has several thresholds and approaches in different
thermal standards (e.g.ANSI/ASHRAE, 2004; CIBSE, 2006) which generate
confusion to classify overheating in a building.
In terms of absolute threshold, for example, CIBSE45 set a design threshold that
specifies discomfort temperature thresholds (CIBSE guide A). For a free-running
building CIBSE suggests a discomfort temperature of 28°C for living room areas
and 26°C for bedrooms (CIBSE, 2006), whilst overheating criteria are defined as
an annual exceedance of the internal temperature over the discomfort threshold of
more than 1%, for the period during which the home is occupied (CIBSE, 2006).
A Standard Assessment Procedure (SAP) (Appendix P) provides a compliance tool
45 Chartered Institution of Building Services Engineers

135
designed to test if a dwelling is at risk of high internal temperatures in summer. The
calculation is based on steady state conditions, and takes into consideration heat
gains and fabric characteristics of the building to calculate monthly mean summer
internal air temperatures (Zero Carbon Hub, 2015). The risk of overheating is
defined as over the monthly mean temperature of 23.5ºC. This temperature or
higher is considered as “High level of risk associated” (BRE, 2012).
An adaptive model, on the other hand, takes into account the relationship between
external conditions and internal temperatures in which occupants do not experience
thermal discomfort. For example, CIBSE TM52 46 includes a definition and
prediction of overheating in free-running buildings by incorporating the outdoor
temperature. The overheating threshold is dynamic and sets out three criteria, with
a 'pass' dependent on meeting two out of the three criteria (Zero Carbon Hub, 2015).
The British Standard European norms (BS EN) 15521:2007 classify the building
into four categories according to the ability of occupants to modify their
environment (Zero Carbon Hub, 2015). Another criterion is the maximum
temperature recommended for a healthy indoor environment (DCLG, 2006).
Moreover, empirical data need to be collected on a large scale in the domestic sector
to predict appropriate thermal comfort and overheating reliably. Empirical data for
the thermal models have been collected principally in work environments.
8.3. Critical Reflection on the Research Methodology and Implications for
Future Research
This study also provides critical reflections on the research design that may have
implications for future work in energy efficient studies in high-rise social housing
buildings. For these types of studies, methodology is one of the biggest challenges
as it has to balance the availability of data and resources with theoretical design. It
is suggested that larger scale longitudinal, ideally randomised, studies with a well-
designed counterfactual and comprehensive monitoring set-up of physical building
variables (whilst capturing occupants’ behaviour) would be needed to explore
46 Published in 2015

136
further the effects of a building fabric retrofit. This is, however, a challenging and
difficult task which may require a refinement of the quasi-experimental approach
as a research design protocol to be applied in future case studies. Critical reflections
of the research methodology that may have implications for future work in energy
efficient studies are discussed below in Sections 8.3.1, 8.3.2 and 8.3.3.
8.3.1. Counterfactual, exogenous factors and sample size
Longitudinal studies are needed to capture the long-term effects of building fabric
retrofit interventions. Comparative studies before and after without a
counterfactual are limited as they assume that, in the absence of the intervention,
the energy consumption remains unchanged. However, counterfactual evaluations
for energy consumption are challenging as they have at least two sources of error:
a) for instance, the energy consumption that would have occurred without the
energy efficiency improvement; and (b) the energy consumption that would have
occurred following the energy efficiency improvement had there been no
behavioural change (Sorrell, 2007). Although this study uses a counterfactual for
space heating consumption, a more rigorous matching method to determining the
eligibility of a control building might have improved the analysis. This remains a
limitation for this study, but also for future researchers, since the access to physical
and occupants’ data of buildings is limited and, thus, the matching physical building
characteristics are approximated (e.g. heating system and heating pipes are identical
but the internal pipes’ routing is not. This might be having an effect as unmetered
heat may benefit the target building flats). A regression model based on pre-
intervention variables could be used to determine the eligibility of a control
building. The dependent variable could have been, for this case, mean monthly
consumption per flat per m2 by building (j) in time (t). The regressors could have
included physical and occupants’ factors to indicate whether or not the target and
control buildings are similar.
Equally, there is a need for controlling various exogenous factors which may
modify the demand of the energy service (Frondel and Schmidt, 2005). This study
addressed the exogenous factors imposing the “exogeneity” (Frondel and Schmidt,

137
2005) to control conditions such as the type of retrofit insulation, building physical
characteristics, energy tariff, and energy supplier. However, future studies should
control further exogenous factors, in particular, those related to occupants’
interactions with the building’s physical and heating systems such as window
opening.
Quasi-experimental studies are subject to selection bias (Shadish et al., 2002). In
this case, it was not feasible to perform a randomized sample selection due to, for
instance, occupants’ resistance to installing a data logger in their flat. In this study,
there is also the uncertainty of a small sample size (n=9 internal air temperature,
n=157 space heating consumption). Finding the right sample size for the
measurement of internal air temperature will probably involve a subjective
judgment by the researcher as a full sample size would not be attainable when
evaluating a high-rise building (or even 2 or 3 buildings). This judgment could be
driven by how representative energy service demand variable(s) (i.e. mean internal
air temperature in our case) of the selected sample is. For example, a paired t-test
which compares the means of internal air temperature pre-retrofit and post-retrofit
might be a way forward. Another option could be to analyse the energy service
demand variable(s) of each dwelling with a qualitative research design (see, for
example, Love, 2014).
8.3.2. Monitoring set-up
Improving the spatial and data capture monitoring set-up of the energy service
demand variable(s) would have been beneficial to the study. For instance, spatially
the living room temperature was used in this study as a proxy to construct internal
air temperatures in the participants’ flats. This is based on the assumption that
occupants in small dwellings perceive their place as ‘one space’ (DECC, 2013b)
and the SAP assumption that the living room is the warmest place in a dwelling
(Huebner et al., 2013b). However, other studies have shown differences between
the living room and other rooms (see, for example, DECC (2009)). Therefore, for
future research designs, other rooms such as bedrooms and bathrooms could be
included.

138
Similarly, manipulation of data loggers by occupants is also a source of uncertainty
(e.g. exposing a data logger to a source of heat such as a hair drier or secondary
heating), which is not controlled by the researcher. In this study, guidelines to
occupants were provided to keep data loggers away from sources of direct light and
heat. Another source of uncertainty is due to the sensor’s characteristics which
could be mitigated by following the guides provided by ISO 7726:2001 (British
Standards Institution, 2001). The guidelines suggest a sensor response measuring
range (10˚C – 40˚C), accuracy (required ± 0.5˚C and desirable ± 0.2˚C), 90%
response time and should be located away from any thermal radiation. In addition,
data loggers can be calibrated in a thermal chamber under known conditions (for
example, set at 20˚C and 50% relative humidity). It is suggested that, for further
research, an updated measurement protocol, that enables the comparability between
studies, takes these issues into account.
Space heating consumption nested in other gas consumption (e.g. cooking) is open
to bias when data are disaggregated through modelling (e.g. space heating
consumption and hot water gas in one gas meter record) such as in Hong (2011).
In this study, bias was avoided by obtaining space heating meter readings from the
energy supplier. Additionally, during the sample control process, space heating
consumption by secondary sources was checked. Other uncertainties such as
transmission from the meters (at the buildings) to the energy supplier are also
present. For future research, ideally a heat meter installed on the meter may be
suitable for an accurate measurement. This also enables a high-time-resolution
analysis of heating usage (switch on/off).
8.3.3. Occupant behaviour
The study also includes qualitative measures, which enable the study of interactions
between occupants and the physical system. However, self-completion diaries have
limitations such as the ‘risk of honest forgetfulness’ and the ‘risk of retrospection
error’, which may lead to ‘uncertain compliance’ (Bolger et al., 2003, p. 594). To
study the changes produced by retrofit insulation in terms of the use of space and
adaptive actions such as switching heating on/off, or closing/opening windows, this
qualitative measure needs to be complemented with sensors installed on the doors

139
(occupants move room), on the meters (switching heating on/off) and on the
windows (opening the windows). In addition, in order to analyse these data
comprehensibly, there is a need to upgrade or create thermal comfort models aimed
at the domestic sector. However, it is important to note that they need to face
challenges that installing sensors pose, especially within home environments.
Monitoring occupancy directly might lead to a change in the results; this is because
people act differently when they are being monitored (e.g. the Hawthorne effect)
and typically requires greater funding.
8.4. Summary
This chapter discussed useful insights regarding energy consumption saving and
temperature take-back, temperature take-back and saturation effects, temperature
take-back, and the relationship between physical factors and occupant behaviour
and thermal discomfort. Since this study and in general studies of temperature take-
back following building retrofits are subject to theoretical and practical
methodological limitations, a critical light is shed on methodology and ways for
improving it were suggested.
140
9. Chapter 9. Conclusion
9.1. Introduction
This chapter summarises the background of the research, research questions,
research aim/objectives, methodology and limitations in Section 9.2. Section 9.3
describes the key findings of this research. Sections 9.4 and 9.5 describe the
contribution to knowledge and necessary further work is proposed if the findings
are to be used to inform retrofit policy, respectively. Finally, Section 9.6 suggests
recommendations for the housing association for future projects.
9.2. Summary of the Thesis
The European Union Strategy 2020 has influenced the UK’s energy efficiency
policies in the household sector. Despite the measures installed under the energy
efficiency supplier obligations and the Warm-front scheme, concerns have been
noted that they have been insufficient to meet the energy saving targets. One of the
reasons is the insufficient consideration given to the implications of the temperature
take-back and rebound effect on energy efficiency policy (Sorrell, 2007).
In addition, it was identified in the literature review that the energy efficiency of
dwellings is often represented using physical metrics such as the U-value or SAP
rating. However, the relationship between physical metrics and energy saving is
not straightforward, as energy consumption is driven by complex interactions of
physical & occupants’ behavioural factors, which are often poorly understood using
current paradigms. This can be also seen in normative models used to account the
energy heating saving from energy efficiency upgrades.

141
There is a growing awareness of the difference between the actual savings achieved
from the energy efficiency measures and the estimates from the theoretical models.
This has been termed by Sorrell et al. (2009) as shortfall. The known reasons for
the shortfall are the occupant factors with the remainder due to other factors, such
as equations (e.g. mathematical models of heat transfer), input parameters of the
physical-based models (e.g. baseline U-values) and technical failures (i.e.
installation, performance of equipment) (Sanders and Phillipson, 2006; Sorrell et
al., 2009). Particularly, in terms of household heating, the term temperature take-
back has been coined to explain the predicted energy consumption savings
converted into increased internal temperatures. Occupants may take part in the
energy saving after the retrofit as increased internal temperatures, particularly in
dwellings occupied by low-income householders (Milne and Boardman, 2000;
Sorrell, 2007). The temperature take-back ranges from 0.4°C to 0.8°C and this
may imply that a 1°C increase of the internal temperature leads to approximately
10% of space heating consumption (Sorrel, 2007).
However, it was not clear how occupant behaviour might respond to a retrofit in
terms of changing their heating behaviour. Particularly, it was unclear how people
respond to a retrofit insulation in a high-rise social housing building, for example,
whether or not they adapt their heating behaviour or change their use of space or
increase their thermal comfort. The factors determining energy use in buildings are
complex and often poorly understood (Oreszczyn and Lowe, 2010). Recent studies
have suggested that this complexity is underpinned by the fact that physical and
occupant behavioural factors form a complex system (Lowe et al., 2012; Love,
2014).
With this problem in mind the following research questions were developed. These
four research questions were situated within current research assumptions and
methodologies to address the extent to which retrofit insulation impact on space
heating consumption in a high-rise social housing building:
- How do internal air temperatures change following an imposed building
fabric retrofit insulation?

142
- How does space heating consumption changes following an imposed
building fabric retrofit insulation?
- Which interactions between occupant behavioural factors and physical
factors may account for space heating consumption change?
- Why do internal air temperatures change afterwards?
The aim of this study was to investigate the effects of retrofit insulation on space
heating consumption to deepen the understanding of the temperature take-back, in
which occupants take part of the energy saving after energy efficiency upgrades as
increased indoor temperatures, through an empirical study. The objectives of this
study were as follows:
1. To examine the effect of an energy efficiency upgrade on energy consumption
for space heating by using a method of analysis that quantifies the change of the
energy service – internal air temperature;
2. To examine the effect of an energy efficiency upgrade on energy consumption
for space heating by using a method of analysis that quantifies the change of the
energy input – space heating consumption;
3. To identify occupant responses that can explain the effect of the energy efficiency
upgrade on energy consumption for space heating.
This research follows an intervention design approach (Creswell, 2015) which
combines a ‘quasi-experimental’ (Sorrell, 2007; Sorrell et al., 2009) and qualitative
approach. The evidence was collected over a two-year-long study including
physical monitoring and qualitative data before and after the retrofit, carried out on
a high-rise social housing building in the Riverside Dean area in Newcastle upon
Tyne, UK.
This study area was limited to a case study, the retrofit project at the Cruddas Park
House, as it was the only project managed by the social housing association ‘Your

143
Homes Newcastle’47 which had secured retrofit funding48 at the time of the survey
(February 2014). Therefore, the study results obtained need to be considered under
this scope. The results of this study are indicative of the effect of building fabric
investments (regarding one type of retrofit insulation, external solid wall and
double-glazing windows) on space heating consumption in a high-rise social
housing, other dwellings or retrofits might lead to different responses. However, it
is noted that generally every building is different either in design, construction, or
operational characteristics. Ultimately, this research shines a more critical light on
how future research design could be improved and lead to what can be translated
into hypotheses for future studies with larger sample sizes, which can inform energy
policies.
9.3. Key Findings
The main findings of this case study in a high-rise social housing building are
summarised as follows.
A change in normalised space heating consumption of -27% or -34% relative to
a control group, following the combined installation of external solid wall
insulation and double glazing was observed. This 34% of space heating
consumption reduction after the retrofit should be seen in the context of low gas
consumption for the target building. This is also supported by the qualitative
evidence that also suggests a low usage of heating (before and after the retrofit).
The mean internal air temperature change, with weather standardised at 5˚C
external temperature, was +0.46˚C. Temperature take-back is relatively small
(i.e. 0.46°C at 5°C external temperature) compared to other studies. Thus, the
empirical results do not support assumptions normally made about low-income
dwellings ‘taking back’ energy savings as increased temperatures. More
47 Your Homes Newcastle is the housing association responsible for managing
council homes on behalf of Newcastle City Council.
48 ECO funding to develop other retrofit projects were cancelled and support
(interviewers) from YHN to undertake the survey was revoked.

144
generally, the study also indicates a potential upper-limit to an indoor air
temperature of 22.8˚C to 24.0˚C for living rooms.
The effect known as saturation (Maxwell et al., 2011) might be taking place due
to internal air temperatures reaching a limit of the maximum level of thermal
comfort (e.g. 22.5°C). This supports Sorrel's (2007) assumptions that
temperature take-back decreases owing to saturation effects when pre-
intervention internal air temperatures saturate (approaching 21ºC).
When temperature take-back reaches the saturation level, the increase of
internal air temperature might be more dependent on the physical factor and less
dependent on occupant behaviour in the heating season. Thus, the increase of
the standardised mean internal air temperature following the upgrade (+0.46°C)
is the result of unheated periods.
The findings also suggest that the change in the ‘use of space’ was relatively
small in the heating season, and there is no evidence that occupants are using
their homes more intensively or previously unused rooms become occupied.
The saturation of temperatures led to occupant thermal dissatisfaction, in
response to which occupants were cooling their dwellings by frequent window
opening. It might be a risk of overheating in summer time which needs to be
observed, as this study has not measured the effect of retrofit insulation on
overheating.
9.4. Contribution to the Knowledge
The empirical study undertaken in the case study indicated that following retrofit
insulation the achieved internal air temperatures were high in the living room (>
22˚C), reaching saturation in the heating season49 with a potential upper limit to the
49 The uncontrolled heat from the heating system and from hot water pipes,
probably, may also contribute to higher temperatures.

145
internal air temperature of 22.8˚C to 24.0˚C for living rooms. The saturation of
temperatures has led to a very low space heating consumption. These findings
perhaps suggest that assumptions normally made about low-income dwellings
‘taking back’ energy savings as increased temperatures do not accurately reflect the
reality of the energy efficiency upgrades in low-income dwellings, particularly, an
energy efficiency retrofit that achieves saturation. These results also suggest that
low-income households are not necessarily willing to pay for higher levels of
heating.
In recent years the academic discussions and policymakers have expressed concern
about temperature take-back of energy saving policies, which significantly reduce
the impacts of energy efficiency programmes, especially in low-income households
in the UK. However, this study provides evidence that energy efficiency measures,
targeting low-income dwellings, designed to achieve saturation might prevent
temperature take-back, achieving both thermal comfort and low energy use.
In light of this evidence, and if this results were found to be broadly true in the UK,
the energy policies need to revise some of their assumptions on take-back of energy
saving space. For example, the efficiency savings from the household measures in
the UK for the ECO and Green Deal assume a comfort factor of 15% (DECC,
2014a) and Ireland’s national energy efficiency action plan assumes for the Better
Energy Warmer Homes Scheme (WHS) a comfort uptake of 70% in low-income
households (DCENR, 2014). This study perhaps suggests that temperature take-
back needs to be accounted for as a response of the temperature saturation achieved
by the different energy efficiency improvements.
Saturation of temperatures has also led to occupant thermal dissatisfaction, in
response to which occupants were cooling their dwellings by frequently opening
windows. Therefore, retrofit projects that tend to achieve saturation effect (e.g.
deep retrofit insulation) need to be delivered in such a way so as to achieve the main
motivations for energy efficiency upgrades, reducing space heating (hereby CO2)
and fuel poverty, and also to prevent thermal dissatisfaction and risk of overheating.
Overheating might increase the energy demand for cooling (hereby increasing CO2)
and create health hazards for occupants. This study might have important
implications for predicting the effectiveness of energy efficiency upgrades on future
works for residential buildings; however, the wider applicability of this case study

146
research’s results is restricted. Other types of buildings, socio-economic dweller
characteristics or energy efficiency interventions may lead to different responses.
This thesis therefore suggests recommendations from this work that can be
translated into hypotheses for future studies in the following section.
9.5. Recommendations for Future Studies
This study suggests that it is necessary to investigate further the saturation effect in
different dwellings, following the critical reflection on the research methodology in
Section 8.3. For example, studies with larger sample sizes and (ideally) randomised
samples, other types of buildings, socio-economic dweller characteristics or energy
efficiency interventions.
The following hypotheses related to the saturation effect can be formed by using
the findings in this study:
When temperature take-back reaches saturation effect, the space heating
consumption decreases and internal air temperatures increase following the
retrofit;
When temperature take-back reaches saturation effect, the empirical results do
not support assumptions normally made about low-income dwellings ‘taking
back’ energy savings as increased temperatures;
When temperature take-back reaches saturation effect, behavioural factors play
a minor role compared to physical factors in the heating season to increase the
internal air temperature.
Furthermore, since the current discussion of implementing deep retrofit insulation
may create a scenario of saturation effect, it might be interesting to test these
hypotheses in a deep retrofit project, and examine the risk of overheating.
In addition, the likely performance of retrofit projects needs to be assessed by taking
into account a methodology that includes occupants, building fabric and heating-
147
system factors. Similarly, energy models, that neglect the importance of these
interactions, need to include more empirical data to improve their predictions.
9.6. Recommendations for the Housing Association for Future Projects
This research provides recommendations for the housing association for future
projects, since this study stemmed from a query of a social provider (YHN) to
understand the effects of building fabric retrofit better.
Evaluation of heating and cooling needs
Particularly, for the target building there is a need to establish clearly whether or
not there is a risk of overheating, especially when other authors have suggested the
unintended overheating effects of a building fabric retrofit on occupant health
(Davies and Oreszczyn, 2012). If so, improving ventilation or a heating system
upgrade might be considered as part of the solution for the target building.
In general, for future buildings that are planned to be retrofitted, pre-retrofit
monitoring evaluation might help to understand the current needs of heating and
cooling. For example, a retrofit protocol might be created, including a
comprehensive analysis of the building’s physical factors (e.g. insulation, draught
proofing, glazing, heating system, thermostatic controls, etc.) and occupant factors
interacting with physical factors (e.g. internal air temperature and space heating).
Funding is needed for the pre-monitoring evaluation as part of the retrofit scheme.
This quote from STBA (2015) exemplifies a more comprehensive approach that is
needed to evaluate a retrofit project:
Achieving responsible retrofit often requires compromises between
different values. It also requires a Whole Building Approach whereby
there is integration of the fabric measures (such as insulation, new
windows, draught proofing), and services (particularly ventilation,
heating, controls and renewables) along with proper consideration of how
people live and use the building. All of these must be adapted to the

148
context of the building (its exposure, status, condition, form, etc.). When
these are integrated well, a building is in balance.
(STBA, 2015, p. 6).
Collaborative process between the stakeholders
A feedback loop between the dwellers and other stakeholders (council, builders,
etc.) might be beneficial for improving the process of retrofitting. For example, it
would be beneficial to include occupant thermal comfort perception as an input,
thus occupants are consulted, improving the accuracy of the results.
Other authors also support the importance of understanding the effects of energy
upgrades on energy saving (Caird et al., 2012). Although the importance of
understanding often refers to new technology in which occupants have to learn how
to use it (for example, heating systems), community involvement might help to
avoid problems with the building fabric (e.g. ventilation) and, in turn, for its
occupants (e.g. health issues) following retrofit measures. It is important to note
that dwellers were informed at different stages of the retrofit process. For example,
at the start of the study, occupants were invited to a stakeholder meeting, in which
information was given about the project. However, there are social and technical
language barriers that may prevent social tenants from being involved in the project.

149
10. References
ACE (2013) 'Fact-file: The Cold Man of Europe'. London: Association for the
Conservation of Energy.
ACE (2015) 'The Cold Man of Europe – 2015 update'. London: Association for the
Conservation of Energy.
Alaszewski, A.M. (2006) Using Diaries for Social Research. SAGE Publications
[Online]. Available at: http://ncl.eblib.com/patron/FullRecord.aspx?p=334610
(Accessed: 14 February 2017).
Anderson, B.R., Chapman, P.F., Cutland, N.G., Dickson, C.M., Doran, S.M.,
Henderson, G., Henderson, J.H., Iles, P.J., Kosmina, L. and Shorrock, L.D. (2002)
BREDEM-12 Model description: 2001 update. Garston, Watford, UK.
Anderson, W., White, V. and Finney, A. (2010 ) "You just have to get by". Coping
with low incomes and cold homes. Bristol.
Andrew, S. and Halcomb, E.J. (2009) Mixed Methods Research for Nursing and the
Health Sciences. Oxford, UK: Wiley-Blackwell.
ANSI/ASHRAE (2004) ASHRAE Standard 55-2004. Thermal Environmental
Conditions for Human Occupancy. Atlanta, USA: American Society of Heating,
Refrigerating and Air-Conditioning Engineers, Inc.
ANSI/ASHRAE (2013) 'ASHRAE Standard 55-2013. Thermal Environmental
Conditions for Human Occupancy'. Atlanta, USA: American Society of Heating,
Refrigerating, and Air-Conditioning Engineers, Inc.

150
Armstrong group (2012) 'Powering up for UK district heating project', World
Pumps, 2012(8), pp. 22-23.
BBC News (2013) 'T.Dan Smith',edn), 24th February, 2003. [Online] Available at:
http://www.bbc.co.uk/insideout/northeast/series2/tdansmith_newcastlepolitics.sht
ml (Accessed: 14 February 2017).
Beaumont, A. (2007) 'Hard to Treat Homes in England', ENHR conference.
Rotterdam, 25-28 June 2007.
BEIS (2017) Household Energy Efficiency National Statistics. Detailed Report
2016. London: Department for Business, Energy & Industrial Strategy.
Boardman, B., Darby, S., Killip, G., Hinnels, M., Jardine, C. and Palmer, J. (2005)
40% House. Oxford, UK.
Bolger, N., Davis, A. and Rafaeli, E. (2003) 'Diary Methods: Capturing Life as it is
Lived', Annual Review of Psychology, 54(1), pp. 579-616.
BRE (2008) A study of hard-to-treat homes using the English house condition
survey, Part 1 – dwelling and household characteristics of hard-to-treat homes.
London: Building Research Establishment Limited.
BRE (2012) The Government’s Standard Assessment Procedure for Energy Rating
of Dwellings. SAP 2012 version 9.92. Watford, UK: Building Research
Establishment Limited.
BRE (2014) SAP 2012: the government’s standard assessment procedure for
energy rating of dwellings, version 9.92 (OCT 2013). Watford, UK: Building
Research Establishment Limited.
British Standards Institution (1996) BS EN ISO 7345:1996. Thermal insulation —
Physical quantities and definitions. European Committee for Standardization
(CEN).

151
British Standards Institution (2001) BS EN 7726:2001. Ergonomics of the thermal
environment - Instrument for measuring physical quantities London: BSI
publications.
British Standards Institution (2005) 'BS EN ISO 7730. Ergonomics of the thermal
environment - Analytical determination and interpretation of thermal comfort using
calculation of the PMV and PPD indices and local thermal comfort criteria'. ISO.
Available at: https://books.google.co.uk/books?id=0cclPwAACAAJ.
British Standards Institution (2007) 'BS EN 15251:2007. Indoor environmental
input parameters for design and assessment of energy performance of buildings-
addressing indoor air quality, thermal environment, lighting and acoustics'.
Brussels: European Committee for Standardization (CEN).
British Standards Institution (2017) BS EN ISO 6946:2017. Building components
and building elements - Thermal resistance and thermal transmittance -
Calculation methods. London: BSI Standards Limited 2017.
Bryman, A. (2012) Social research methods. Oxford: Oxford University Press.
Buildings Performance Institute Europe (2011) 'Europe’s buildings under the
microscope – A country-by-country review of the energy performance of buildings'.
Belgium: BPIE.
Caird, S., Roy, R. and Potter, S. (2012) 'Domestic heat pumps in the UK: user
behaviour, satisfaction and performance', Energy Efficiency, 5(3), pp. 283-301.
Chatterton, T. (2011) An introduction to Thinking about ‘Energy Behaviour’: a
Multi Model Approach, a paper for the Department of Energy and Climate Change.
London: Department of Energy & Climate Change.
CIBSE (2006) CIBSE Guide A, Environmental design. London, UK: Chartered
Institution of Building Services Engineers.

152
Creswell, J. (2009) Research design: Qualitative, quantitative, and mixed methods
approaches. 3rd edn. Thousand Oaks, California: SAGE Publications, Inc.
Creswell, J. (2015) A concise introduction to mixed methods research. 3rd edn.
Thousand Oaks, California: SAGE Publications, Inc.
Davies, M. and Oreszczyn, T. (2012) 'The unintended consequences of
decarbonising the built environment: A UK case study', Energy and Buildings, 46,
pp. 80-85.
Davis, L.W. (2008) 'Durable goods and residential demand for energy and water:
evidence from a field trial', The RAND Journal of Economics, 39(2), pp. 530-546.
DCENR (2014) National energy efficiency action plan 2014.Department of
Communications, Energy and Natural Resources.
DCLG (2006) Housing health and safety rating system- guidance for landlords and
property related professionals. London: Department for Communities and Local
Government.
DCLG (2013) English Housing Survey: HOMES Annual report on England’s
housing stock, 2011. London: Department for Communities and Local Government.
DCLG (2016a) English Housing Survey Headline Report 2014-15. London:
Department for Communities and Local Government.
DCLG (2016b) English Housing Survey Headline Report 2014-15 Section 2:
Tables, Figures and Annex Tables. London:Department for Communities and Local
Government.
DCLG (2017a) 2015-16 English Housing Survey Headline Report Section 2. Annex
Table 2.7: Energy efficiency rating bands, by tenure, 2005 and 2015. London:
Department for Communities and Local Government.

153
DCLG (2017b) English Housing Survey Headline Report 2015-16 London:
Department for Communities and Local Government.
DECC (2009) Final report: In situ: monitoring of efficiencies of condensing boilers
and use of secondary heating. London: Department of Energy & Climate Change.
DECC (2011) Research report. Evaluation synthesis of energy supplier obligation
policies. London: Department of Energy & Climate Change.
DECC (2012) Final Stage Impact Assessment for the Green Deal and Energy
Company Obligation. London: Department of Energy & Climate Change.
DECC (2013a) Consumption headlines tables 2013. London: National Energy
Efficiency Data Framework (NEED). [Online]. Available at:
https://www.gov.uk/government/statistics/national-energy-efficiency-data-
framework-need-report-summary-of-analysis-2015 (Accessed: 14 February 2017).
DECC (2013b) What people want from their heating controls: a qualitative study.
Tech. Rep. October. London: Department of Energy & Climate Change.
DECC (2014a) Estimated impacts of energy and climate change policies on energy
prices and bills. London: Department of Energy & Climate Change.
DECC (2014b) Evaluation of the Carbon Emissions Reduction Target and
Community Energy Saving Programme: Executive Summary. Research undertaken
for DECC by Ipsos MORI, CAG Consultants, UCL and Energy Saving Trust.
London: Department of Energy & Climate Change.
DECC (2014c) UK National Energy Efficiency Action Plan. London: Department
of Energy & Climate Change.
DECC (2015) Annual Fuel Poverty Statistics Report 2015. London: HM
Government.

154
DECC (2016a) Annual Fuel Poverty Statistics Report, 2016. London: Department
of Energy & Climate Change.
DECC (2016b) ECO: Help to Heat. Consultation document. London: Department
of Energy & Climate Change.
Denscombe, M. (2014) The Good Research Guide: For Small-scale Social
Research Projects. McGraw-Hill Education. Available at:
http://ncl.eblib.com/patron/FullRecord.aspx?p=1910221> (Accessed: 14 February
2017).
Deurinck, M., Saelens, D. and Roels, S. (2012) 'Assessment of the physical part of
the temperature takeback for residential retrofits', Energy and Buildings, 52, pp.
112-121.
Doherty, S. and Miller, E. (2000) 'A computerized household activity scheduling
survey', Transportation, 27(1), pp. 75-97.
Dong, G. and Pei, J. (2007) Sequence Data Mining. New York: Springer.
Ellegård, K. and Palm, J. (2011) 'Visualizing energy consumption activities as a
tool for making everyday life more sustainable', Applied Energy, 88(5), pp. 1920-
1926.
Energy and Climate Change Committee (2016) Home energy efficiency and
demand reduction. Fourth Report of Session 2015–16. London: House of
Commons.
EST (2002) 'Good practice guide 138. Internal wall insulation in existing housing,
a guide for specifiers and contractors'. Energy Saving Trust. Available at:
http://regulations.completepicture.co.uk/pdf/Energy%20Conservation/Insulation/I
nternal%20wall%20insulation%20in%20existing%20housing%20-
%20a%20guide%20for%20specifiers%20and%20contra.pdf (Accessed: 15
October 2017).

155
EST (2010) Sustainable refurbishment Towards an 80% reduction in CO2
emissions, water efficiency, waste reduction, and climate change adaptation.
London.
European Parliament and Council (2012) Directive 2012/27/EU of the European
Parliament and of the Council of 25 October 2012 on energy efficiency, amending
Directives 2009/125/EC and 2010/30/EU and repealing Directives 2004/8/EC and
2006/32/EC.Official Journal of the European Union. [Online]. Available at:
http://www.buildup.eu/en/practices/publications/directive-201227eu-european-
parliament-and-council-25-october-2012-energy (Accessed: 14 February 2017).
Fanger, P.O. (1970) Thermal comfort. Analysis and applications in environmental
engineering. Copenhagen: Danish Technical Press
Frondel, M. and Schmidt, C.M. (2005) 'Evaluating environmental programs: the
perspective of modern evaluation research', Ecological Economics, 55, pp. 515-
526.
Gale, E.A.M. (2004) 'The Hawthorne studies—a fable for our times?', QJM, 97(7),
pp. 439-449.
Galvin, R. (2015) The Rebound Effect in Home Heating: A guide for policymakers
and practitioners. Abingdon,Oxon; New York, NY: Routledge.
Galvin, R. and Sunikka-Blank, M. (2013) A Critical Appraisal of Germany's
Thermal Retrofit Policy: Turning Down the Heat. London; New York: Springer-
Verlag.
Galvin, R. and Sunikka-Blank, M. (2014) 'Disaggregating the causes of falling
consumption of domestic heating energy in Germany', Energy Efficiency, 7(5), pp.
851-864.
156
Gilbertson, J., Stevens, M., Stiell, B. and Thorogood, N. (2006) 'Home is where the
hearth is: grant recipients' views of England's home energy efficiency scheme
(Warm Front)', Soc Sci Med, 63(4), pp. 946-56.
Glendinning, M. and Muthesius, S. (1994) Tower Block: Modern Public Housing
in England, Scotland, Wales, and Northern Ireland. New Haven: Paul Mellon
Centre for Studies in British Art by Yale University Press.
Green, G. and Gilbertson, J. (2008) Warm Front Better Health, Health Impact
Evaluation of the Warm Front Scheme.
Hitchings, R. (2012) 'People can talk about their practices', Area, 44(1), pp. 61-67.
HM Government (2015) The building regulation 2010. Approved document L1B:
conservation of fuel and power in existing dwellings. 2015 edition. London: NBS.
Hong (2011) Changes in space heating energy consumption following energy
efficient refurbishment in low-income dwellings in England. Ph.D. thesis. UCL.
Hong, Oreszczyn, T. and Ridley, I. (2006) 'The impact of energy efficient
refurbishment on the space heating fuel consumption in English dwellings', Energy
and Buildings, 38(10), pp. 1171-1181.
Hong, S.H., Gilbertson, J., Oreszczyn, T., Green, G. and Ridley, I. (2009) 'A field
study of thermal comfort in low-income dwellings in England before and after
energy efficient refurbishment', Building and Environment, 44(6), pp. 1228-1236.
Hough, D. and Page, R. (2015) ECO, the Energy Company Obligation (Number
CBP 06814). [Online]. Available at:
http://researchbriefings.parliament.uk/ResearchBriefing/Summary/SN06814
(Accessed: 14 February 2017).
Huebner, G.M., McMichael, M., Shipworth, D., Shipworth, M., Durand-Daubin,
M. and Summerfield, A. (2013a) 'Heating patterns in English homes: Comparing
157
results from a national survey against common model assumptions', Building and
Environment, 70, pp. 298-305.
Huebner, G.M., McMichael, M., Shipworth, D., Shipworth, M., Durand-Daubin,
M. and Summerfield, A. (2013b) 'The reality of English living rooms – A
comparison of internal temperatures against common model assumptions', Energy
and Buildings, 66, pp. 688-696.
Humphreys, M.A., Nicol, J.F. and Raja, I.A. (2007) 'Field Studies of Indoor
Thermal Comfort and the Progress of the Adaptive Approach', Advances in
Building Energy Research, 1(1), pp. 55-88.
INCA (2015) 'Best Practice Guide External Wall Insulation INCA Insulated Render
and Cladding Association'. London: Insulated Render and Cladding Association
Ltd.
Institute of Health Equity (2014) Local action on health inequalities: Fuel poverty
and cold-home related health problems. London: UCL Institute of Health Equity
Jenkins, D.P. (2010) 'The value of retrofitting carbon-saving measures into fuel
poor social housing', Energy Policy, 38(2), pp. 832-839.
Johnson, M.B. (1971) Household behaviour: consumption, income and wealth.
Harmondsworth: Penguin Education.
Johnson, R.B. and Onwuegbuzie, A.J. (2004) 'Mixed Methods Research: A
Research Paradigm Whose Time Has Come', Educational Researcher, 33(7), pp.
14-26.
Jones, A. (2013) 'Re-Generate Newcastle DECC Heat Networks Roadshow'
Presentation to DECC Heat Networks Roadshow 18th July 2013. Newcastle.
Kavgic, M., Mavrogianni, A., Mumovic, D., Summerfield, A., Stevanovic, Z. and
Djurovic-Petrovic, M. (2010) 'A review of bottom-up building stock models for

158
energy consumption in the residential sector', Building and Environment, 45(7), pp.
1683-1697.
Kavgic, M., Summerfield, A., Mumovic, D., Stevanovic, Z.M., Turanjanin, V. and
Stevanovic, Z.Z. (2012) 'Characteristics of indoor temperatures over winter for
Belgrade urban dwellings: indications of thermal comfort and space heating energy
demand', Energy and Buildings, 47, pp. 506-514.
Langevin, J., Wen, J. and Gurian, P.L. (2013) IAQ 2013. Vancouver, Canada, Oct
15–18. ASHRAE.
Law, G.R., Green, R. and Ellison, G.T.H. (2012) 'Confounding and Causal Path
Diagrams', in Tu, Y.-K. and Greenwood, C.D. (eds.) Modern Methods for
Epidemiology. Dordrecht: Springer Netherlands, pp. 1-13.
Lomas, K.J. (2010) 'Carbon reduction in existing buildings: a transdisciplinary
approach', Building Research & Information, 38(1), pp. 1-11.
Love, J. (2014) Understanding the interactions between occupants, heating systems
and building fabricin the context of energy efficient building fabric retrofit in social
housing. Ph.D. thesis. UCL.
Lowe, R., Chiu, L.F., Raslan, R. and Altamirano, H. (2012) Retrofit insights:
perspectives for an emerging industry. London.
Maxwell, D., Owen, P., McAndrew, L., Muehmel, K. and Neubauer, A. (2011)
Addressing the Rebound Effect, a report for the European Commission DG
Environment. [Online]. Available at:
http://ec.europa.eu/environment/eussd/pdf/rebound_effect_report.pdf (Accessed:
14 February 2017).
Milne, G. and Boardman, B. (2000) 'Making cold homes warmer: the effect of
energy efficiency improvements in low-income homes A report to the Energy
Action Grants Agency Charitable Trust', Energy Policy, 28(6), pp. 411-424.

159
Milsom (2014) Solid wall heat losses and the potential for energy saving, Literature
review Watford, UK: Building Research Establishment Ltd.
Natarajan, S. and Levermore, G.J. (2007) 'Domestic futures—Which way to a low-
carbon housing stock?', Energy Policy, 35(11), pp. 5728-5736.
Nicholson, W. (2005) Microeconomic Theory: Basic Principles and Extensions. 9th
edn. Mason, Ohio: Thomson/South-Western.
Nicol, F., Humphreys, M. and Roaf, S. (2012) Adaptive Thermal Comfort:
Principles and Practice. Abingdon, Oxfordshire, UK: Taylor & Francis.
O’Doherty, B. (2000) Riverside Dene Regeneration. Newcastle: Newcastle city
council.
Ofgem (2013a) Community Energy Saving Programme Update. London: The
Office of Gas and Electricity Markets (Ofgem e-serve).
Ofgem (2013b) The final report of the Carbon Emissions Reduction Target (CERT)
2008-2012. London: The Office of Gas and Electricity Markets (Ofgem).
Ofgem (2013c) The final report of the Community Energy Saving Programme
(CESP) 2009-2012 London: The Office of Gas and Electricity Markets (Ofgem).
Ofgem (2015) Energy Companies Obligation. Final report January-13 - March
15. London: The Office of Gas and Electricity Markets (Ofgem).
Oreszczyn, T., Hong, S.H., Ridley, I. and Wilkinson, P. (2006) 'Determinants of
winter indoor temperatures in low income households in England', Energy and
Buildings, 38(3), pp. 245-252.

160
Oreszczyn, T. and Lowe, R. (2010) 'Challenges for energy and buildings research:
objectives, methods and funding mechanisms', Building Research & Information,
38(1), pp. 107-122.
Palmer, J. and Cooper, I. (2012) United Kingdom housing energy fact file 2012.
[Online]. Available at:
https://www.gov.uk/government/uploads/system/uploads/attachment_data/file/201
167/uk_housing_fact_file_2012.pdf (Accessed: 15/10/2017).
Palmer, J. and Cooper, I. (2013) United Kingdom housing energy fact file 2013.
[Online]. Available at:
https://www.gov.uk/government/uploads/system/uploads/attachment_data/file/345
141/uk_housing_fact_file_2013.pdf (Accessed: 15/10/2017).
Papantoniou (2015) Impact of Natural Ventilation on high-rise social housing
buildings, in Newcastle Upon Tyne, UK. MSc. thesis. Newcastle University.
Parsons, H.M. (1974) 'What Happened at Hawthorne?', New evidence suggests the
Hawthorne effect resulted from operant reinforcement contingencies, 183(4128),
pp. 922-932.
Peeters, L., Dear, R.d., Hensen, J. and D’haeseleer, W. (2009) 'Thermal comfort in
residential buildings: Comfort values and scales for building energy simulation',
Applied Energy, 86(5), pp. 772-780.
Rosenberg, J.P. and Yates, P.M. (2007) 'Schematic representation of case study
research designs', Journal of Advanced Nursing, 60(4), pp. 447-452.
Rosenow, J. and Eyre, N. (2014) 'Residential energy efficiency programmes in the
UK: a roadmap for recovery', 10th BIEE Academic Conference: Balancing
Competing Energy Policy Goals St John's College, Oxford, 17/18 September 2014.

161
Sanders, C. and Phillipson, M. (2006) An Analysis of the Difference between
Measured and Predicted Energy Savings when Houses are Insulated Centre for
Research on Indoor Climate and Health, Glasgow Caledonian University; 2006.
Schwartz, D., Fischhoff, B., Krishnamurti, T. and Sowell, F. (2013) 'The Hawthorne
effect and energy awareness', Proceedings of the National Academy of Sciences,
110(38), pp. 15242-15246.
Shadish, W.R., Cook, T.D. and Campbell, D.T. (2002) Experimental and Quasi-
experimental Designs for Generalized causal inference. Wadsworth Cengage
Learning.
Sharpe and Shearer (2012) Proceedings of Retrofit 2012 conference, University of
Salford, Manchester.
Shipworth, M. (2011) 'Thermostat settings in English houses: No evidence of
change between 1984 and 2007', Building and Environment, 46(3), pp. 635-642.
Shipworth, M., Firth, S.K., Gentry, M.I., Wright, A.J., Shipworth, D.T. and Lomas,
K.J. (2010) 'Central heating thermostat settings and timing: building demographics',
Building Research & Information, 38(1), pp. 50-69.
Shorrock and Utley (2008) Domestic energy fact file 2008. Watford: Building
Research Establishment.
Shorrock, L.D. and Dunster, J.E. (1997) 'The physically-based model BREHOMES
and its use in deriving scenarios for the energy use and carbon dioxide emissions of
the UK housing stock', Energy Policy, 25(12), pp. 1027-1037.
Shorrock, L.D., Henderson, J. and Utley, J.I. (2005) Reducing carbon emissions
from the UK housing stock. Watford: Building Research Establishment.
Shove, E. (2003) 'Converging Conventions of Comfort, Cleanliness and
Convenience', Journal of Consumer Policy, 26(4), pp. 395-418.

162
Shove, E. and Walker, G. (2014) 'What Is Energy For? Social Practice and Energy
Demand', Theory, Culture & Society, 31(5), pp. 41-58.
Sorrell, S. (2007) The Rebound Effect: An Assessment of the Evidence for Economy-
wide Energy Savings from Improved Energy Efficiency. [Online]. Available at:
http://www.ukerc.ac.uk/programmes/technology-and-policy-assessment/the-
rebound-effect-report.html (Accessed: 14 February 2017).
Sorrell, S. (2015) 'Reducing energy demand: A review of issues, challenges and
approaches', Renewable and Sustainable Energy Reviews, 47, pp. 74-82.
Sorrell, S. and Dimitropoulos, J. (2008) 'The rebound effect: Microeconomic
definitions, limitations and extensions', Ecological Economics, 65(3), pp. 636-649.
Sorrell, S., Dimitropoulos, J. and Sommerville, M. (2009) 'Empirical estimates of
the direct rebound effect: A review', Energy Policy, 37(4), pp. 1356-1371.
STBA (2015) Planning responsible retrofit of traditional buildings. [Online].
Available at: http://www.sdfoundation.org.uk/downloads/Guide-1-Planning-
Responsible-Retrofit-2015-08.pdf (Accessed: 14 February 2017).
Sunikka-Blank, M. and Galvin, R. (2012) 'Introducing the prebound effect: the gap
between performance and actual energy consumption', Building Research &
Information, 40(3), pp. 260-273.
Sweatman, P. and Managan, K. (2010) Financing Energy Efficiency Building
Retrofits. Madrid.
Thorpe, D. (2013) Energy Management in Buildings: The Earthscan Expert Guide.
London, New York: Taylor & Francis.
Tinytag (2016) Data Loggers. Available at: geminidataloggers.com. (Accessed: 30
September, 2016).

163
URBED (2016) Retrofit factfile. A short summary of facts and publications
relevant to domestic retrofit. [Online]. Available at:
http://carbon.coop/sites/default/files/attachments/2016-09-
12/2016%20URBED%20Tyndall%20The%20Retrofit%20factfile%20-
%20facts%20and%20publications.pdf (Accessed: 14 February 2017).
UWE (2009) Evolution of Building Elements. Available at:
https://fet.uwe.ac.uk/conweb/house_ages/elements/print.htm (Accessed: 29 June
2017).
Watson, C. and Bolton, P. (2013) Carbon Emissions Reduction Target (CERT)
(SN/SC/06196). [Online]. Available at:
http://researchbriefings.parliament.uk/ResearchBriefing/Summary/SN06196
(Accessed: 14 February 2017).
Wickström, G. and Bendix, T. (2000) 'The "Hawthorne effect" - what did the
original Hawthorne studies actually show?', Scandinavian Journal of Work,
Environment & Health, (4), pp. 363-367.
Wilkinson, P., Landon, M., Armstrong, B., Stevenson, S., McKee, M. and Fletcher,
T. (2001) Cold comfort: the social and environmental determinants of excess winter
death in England, 1986-1996. Bristol, UK.
YHN (2015) Unpublished document - Socio-demographic characteristics of
Riverside Dene buildings.
Yin, R.K. (2009) Case Study Research: Design and Methods. Los Angeles,
California: SAGE Publications.
Yin, R.K. (2014) Case Study Research: Design and Methods. Los Angeles,
California: SAGE Publications.
Yu, Y. (2016) High Domestic Tower Energy Demand Reduction via Retrofitting: a
simulation based study. MSc. thesis. Newcastle University.

164
Zero Carbon Hub (2015) Defining overheating. Evidence Review. London.
[Online]. Available at:
http://www.zerocarbonhub.org/sites/default/files/resources/reports/ZCH-
OverheatingEvidenceReview-Definitions.pdf (Accessed: 14 February 2017).

165
Annex A
Equations of direct rebound effect as an efficiency elasticity (direct measure):
𝛈𝛆(𝚬) = 𝛈𝛆(𝐒) − 𝟏
(0-1)50
𝜂𝜀(𝛦) is the elasticity of the demand for energy (E) with respect to energy
efficiency (ε);
𝜂𝜀(𝑆) is the elasticity of the demand for energy services (S) with respect to energy
efficiency.
Equations of direct rebound effect as price elasticity (indirect measure):
𝜼𝜺(𝜠) = −𝜼𝒑𝒔(𝑺) − 𝟏
(0-2)51
𝜼𝜺(𝜠) = −𝜼𝑷𝑬(𝑬) − 𝟏
(0-3)52
𝜂𝜀(𝛦) is the elasticity of the demand for energy (E) with respect to energy
efficiency (ε);
𝜂𝑝𝑠(𝑆) is the elasticity of the demand for energy services (S) with respect to energy
cost of energy services (𝑝𝑠).
𝜂𝑝𝐸(𝐸) is the elasticity of the demand for energy with respect to energy price.
50 Sorrel et al., 2009
51 Sorrel et al., 2009
52 Sorrel et al., 2009

166
Annex B
Riverside Dene Area history
As part of a programme of slum clearance and redevelopment, houses in the
Riverside Dene area were pulled down and new high-rise buildings were built in
the 60s (Glendinning and Muthesius, 1994). This project was pursued by
Newcastle’s major, Mr. T. Dan Smith, nicknamed as 'Mr Newcastle', who
envisioned Newcastle upon Tyne as 'the Brasilia of the North’ (BBC News, 2013).
He mentioned that “I wanted to see the creation of a 20th century equivalent of
[John] Dobson's masterpiece” (Smith autobiography as cited in BBC News, 2013).
As a result 11 blocks were built: 8 15-storey blocks, 2 12-storey blocks and Cruddas
Park House (CPH). CPH is a 23-storey tower block built in 1969, 1- and 2-
bedroom-flats and originally electrically heated.
Insufficient finance investment for long-term maintenance and high levels of anti-
social behaviour and crime led to a downturn in popularity in the area (annual
turnover of tenancies were as high as 20.4%) (O’Doherty, 2000). In 2000, the
government responded with a range of area-based initiatives: 5 towers were
demolished and the remaining tower blocks were refurbished (Jones, 2013). The
regeneration used a mixed-tenure strategy, providing 5 tower blocks for social
tenants (full occupancy) and 1 tower block for home-owners (with assisted
mortgages from Newcastle City Council), the site was renamed as Riverside Dene
to overcome the stigma from people’s associations with the place.

167
Figure Annex B1.‘Last days of The Poplars’. Demolition of the Poplars building
and the Hawthorns building (control building), recently refurbished, is to the right.
Source: geograph.org.uk
Figure Annex B. ‘Riverside Dene area December 2016’. Source: own source.

168
Annex C
Cruddas Park House Heating Installation (information provided by YHN)
Network-pipes’ routing:
Mild steel LTHW heating pipework in vertical risers (in ducts) in the main corridors
serves horizontal runs on the 6th 7th, 13th and 14th floors. These runs pass through
the ceiling voids in the corridors then through a flat to drop vertically within the
bedroom cupboard passing to the flats below. Branches tee off within the cupboard
for each individual flat. The heating to each flat connects via a two-port valve and
heat meter to a pipe coil within a forced-fan warm air unit with a ducted air stub
duct system serving the rooms. The two-port valve is controlled directly by a
electro-mechanical thermostat in the lounge. The other rooms with heating
(bedrooms and passage) have no controls. There is no heating to the kitchen,
bathroom and WC within the flats.
Considerable free (unmetered) heat is given off in the horizontal runs to the
bedrooms and the runs vertically within in the cupboard, which in turn are serving
the flats above and below. Some of the main corridors also suffer from overheating;
most likely the ones with the horizontal pipework and the corridors immediately
above.
These mains have a constant flow with a constant temperature operating 24/7 in
many cases with the insulation removed in the bedroom cupboard to make better
use of the free heat. In addition, the tower block has centralised hot-water storage
with the same distribution system for the hot-water flow and return pipework. The
flats have kitchens and bathrooms at opposite ends so require more than one riser.
This again adds to the free incidental heat within the block. The hot water is
metered at the bathroom and kitchen using by a volumetric meter. Again these
systems run 24/7.

169
The Hawthorns Heating Installation
Network-pipes’ routing:
Steel pre-insulated primary mains from the boiler house serve a heat station on the
ground floor. Plastic vertical risers carry LTHW from the plate heat exchangers up
through the building. Horizontal runs pass through each flat to the local bespoke
heat-exchange unit in a cupboard. This unit provides heating via a plate heat
exchanger and hot water indirectly via a coil running through a stored mass of hot
water. This reduces the on-demand hot-water load. The incoming mains to the
exchanger and thermal store are metered within the unit.
All the pipes are well insulated as is the hot-water store to current standards. The
heating is controlled by a programmable room thermostat acting on a 2-port valve
within the unit. Heating in the flats is a 2-pipe wet system using panel radiators.
The room thermostat is in an internal passage and is probably easily satisfied by the
ambient conditions in there. We have had to move one or two into the lounge. The
thermal hot water store is continuously topped up regardless of the heating demand
but the tanks are well insulated. Water leaving the coil within the store is
automatically blended down to 43°C. A further 2-port valve closes when both
heating and hot water are satisfied (it was originally a 3-port valve but the
recirculated heat caused unmetered overheating). Not all 3-port valves were
replaced but doing this caused a considerable reduction in free heat.
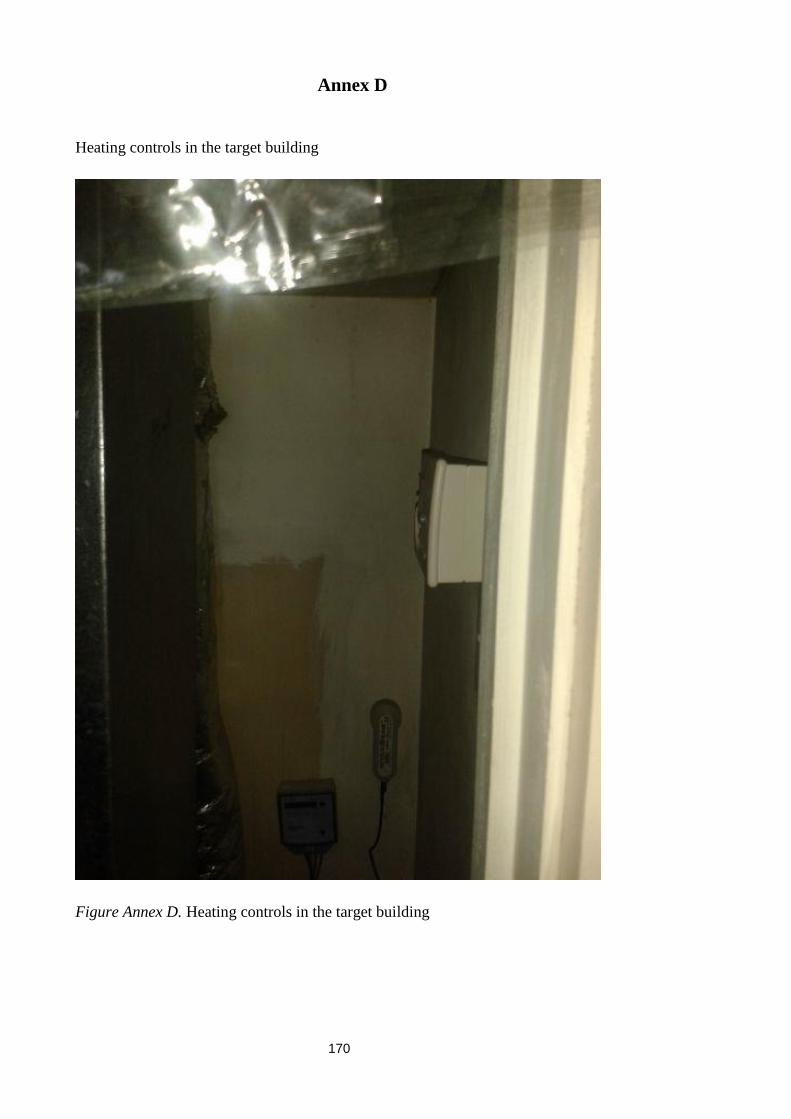
170
Annex D
Heating controls in the target building
Figure Annex D. Heating controls in the target building

171
Annex E
1. Cover letter

172

173
2. Postcard and Poster used to recruit participants.

174

175
3. Drop-in Session Leaflet

176
4. Consent form

177
5. Tenant participation form

178
11. Survey Brochure: Self-completion diary

179

180

181

182

183

184
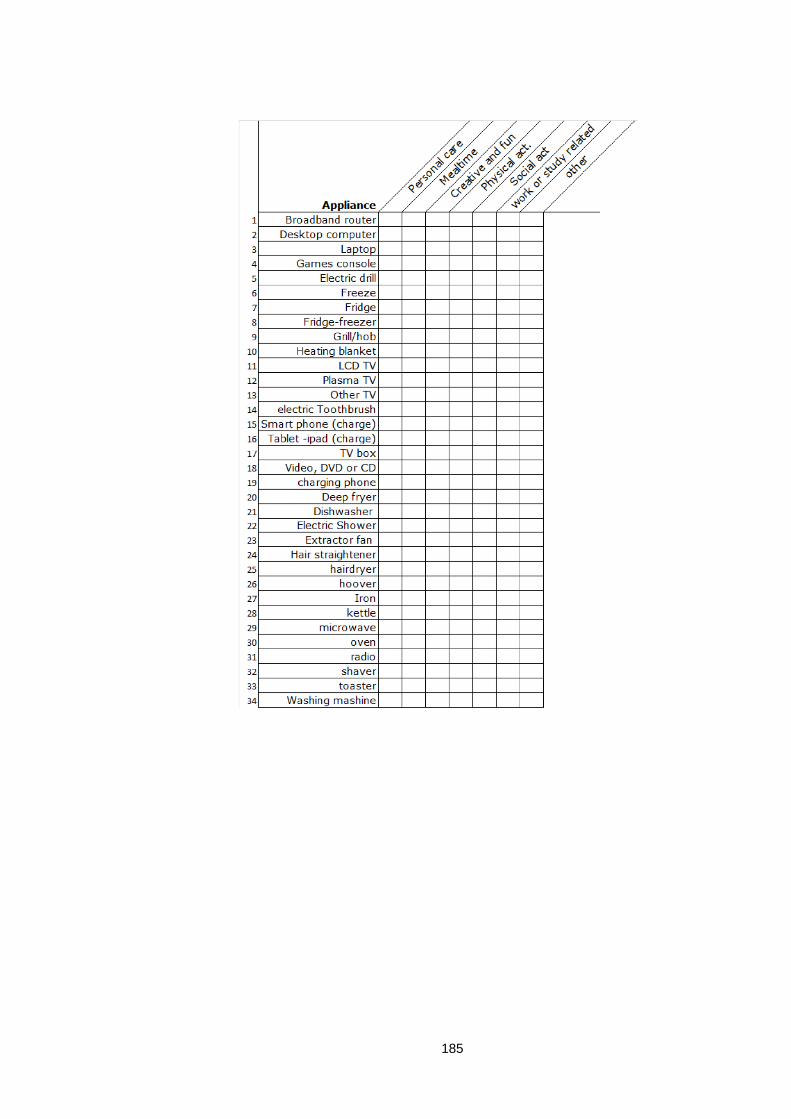
185

186

187
12. Heating diaries

188
13. Winter diary

189
14. Follow-up interview Guide
ID participant:
Interviewer’s Notes:
Before we start, I’d like to explain what we'll be doing during the interview,
which will take no longer than 20 minutes. Basically, I'll ask you questions
about your responses to the diary. This interview will be kept strictly
confidential and your identity will remain anonymous when I write-up the
results of the study. Any questions before we begin?
Questions: (15 minutes)
1. When you responded the diary, you indicated that you were doing X
[answer based on the diary response]. Can you explain a bit more about x
(with whom, where, why) you were doing X?
2. Do you think doing x is part of your normal routine? What did you do after
doing X? From the activities responded in the diary, do you think there is
something that is not part of your normal routine? When you responded
the diary, you indicated that you were going out at X. Do you normally go
out at this time?
3. If there are more people involved: When you responded the diary, you
indicated that you were doing x with x. How often have you doing x with
x to find out about situations similar to X in your normal routine?

190
Go to Closing: (5 min)
4. Probe: What do you think of this diary, do you think helps to understand
what do you do at home?
5. Is there anything you would like to add about what we’ve been discussing?
Closing:
Thank you very much for your time.

191
Survey brochure: Socio-demographic information (Structured questionnaire)
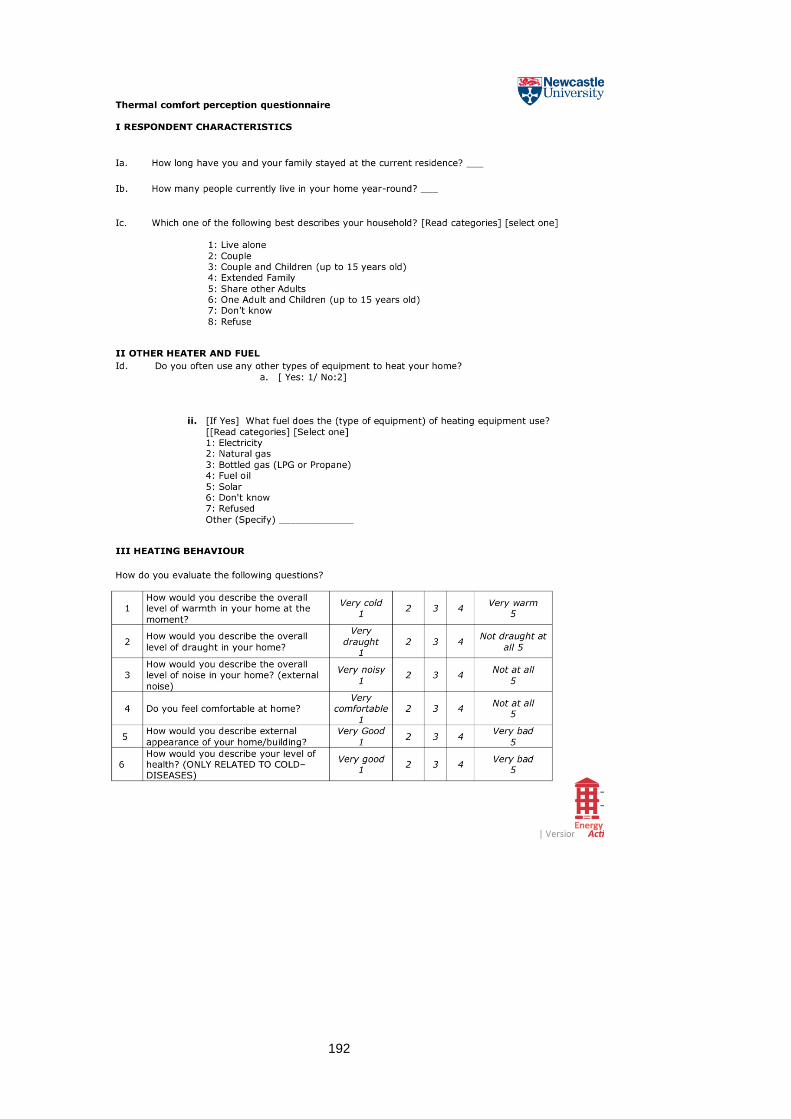
192

193

194
15. Semi-structured questionnaire
1. Relevant changes
Can you think of any changes in your home since the first survey (May
2014) that might affect the amount of energy that you pay for?
For example. Having more people living with you, getting a new job, sick.
2. Final interview:
Let’s talk about the building
What do you think about the retrofit insulation in terms of:
- Heating usage (Use of main heating and secondary heating;
- Thermal comfort perception (how warm or cold do you feel);
- Ventilation;
- Infiltration?
195
Annex F
Weather Forecast
1. May 2014

196
2. Feb 2015

197
3. April_2015

198
Annex G
Pilot Survey
A time-based diary with ‘fixed-time schedules’ was used (Bolger et al., 2003)
to capture hourly activities that are centred around the daily life and household
during one week, before and after the upgrade. The chosen activities are
described as follows:
A. Sleep;
B. Personal care: activities related to personal hygiene such as taking a shower,
bath, brushing teeth and activities related to personal care such as drying or
ironing hair or getting dressed;
C. Mealtime episodes: cooking or reheating food for breakfast, lunch or dinner;
D. Home duty: cleaning the house;
E. Creative and fun: playing games, listening to music, watching TV, reading,
surfing on the internet, chatting, talking by telephone;
F. Intellectual episodes: reading, surfing on the internet for study purposes;
G. Physical episodes: doing exercise at home, e.g. running on a running belt;
H. Social episodes: activities with relatives or/and friends in your house;
I. Spontaneous episodes: different activities every day;
J. Work-related: activities related to work at home;

199
K. Joint episodes: household member shared activities in-home such as having
family dinner (shared activities must be synchronized with other activities,
for example, "having family dinner" includes mealtime and joint activity);
L. Out-of-home activities.
The activity diaries were completed without problems, although the following gaps
were found, which are outlined in Table ‘Activity diary gaps’ below. In addition,
in order to collect heating period information, a heating schedule diary was added.
Given the evidence in Table ‘Activity diary gaps’, amendments to the structure of
the activity survey sheet were made to the self-completion diary, the final self-
completion diary is shown in Annex E.
Activities Comments Amendments
Sleep No comment on this question.
Personal care No comment on this question
Mealtime episodes Although respondents made little or
no comment on this question, the
meaning of the word ‘episodes’ was
not clear
The word
“episodes” was
eliminated.
Home duty Principally home duties such as
hoovering, laundry or ironing are
tasks that people usually do not do
every day (e.g. once per week or
twice per month), and then it cannot
be allocated in an average day.
This section
required further
attention and it was
added to a week-
task sheet.
This item was
replaced by
‘cleaning’.
Creative and fun No comment on this question
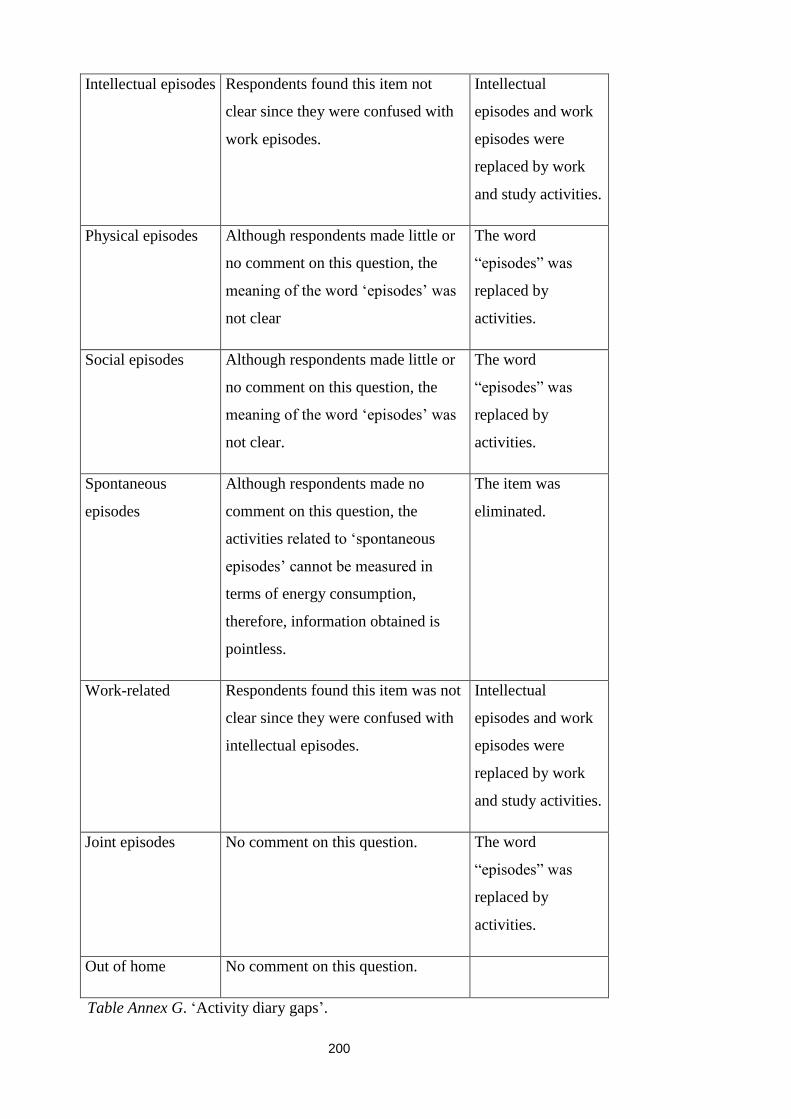
200
Intellectual episodes Respondents found this item not
clear since they were confused with
work episodes.
Intellectual
episodes and work
episodes were
replaced by work
and study activities.
Physical episodes Although respondents made little or
no comment on this question, the
meaning of the word ‘episodes’ was
not clear
The word
“episodes” was
replaced by
activities.
Social episodes Although respondents made little or
no comment on this question, the
meaning of the word ‘episodes’ was
not clear.
The word
“episodes” was
replaced by
activities.
Spontaneous
episodes
Although respondents made no
comment on this question, the
activities related to ‘spontaneous
episodes’ cannot be measured in
terms of energy consumption,
therefore, information obtained is
pointless.
The item was
eliminated.
Work-related Respondents found this item was not
clear since they were confused with
intellectual episodes.
Intellectual
episodes and work
episodes were
replaced by work
and study activities.
Joint episodes No comment on this question. The word
“episodes” was
replaced by
activities.
Out of home No comment on this question.
Table Annex G. ‘Activity diary gaps’.

201
Annex H
Method to group the sequence of activities
The steps to construct an activity profile are:
1. Sequence of activities: based on the information collected on the self-completion
diaries, the information was organised in a sequence of activities for each day and
dwelling, according to the Figure ‘Diagram of steps to obtain the activity profile’;
2. Activity profile: the sequence of activities is transformed in the activity profile
sequence by using the method position weight matrix. An overview of different
steps is shown in the Figure ‘Diagram of steps to obtain the activity profile’.
Figure ‘Diagram of steps to obtain the activity profile’.
Sequence of activities
The symbols (alphabet) used to represent the activity types in the sequence of
activities identify common daily activities that the occupants might perform at
home. The activities might be repeated in the sequence, in different time periods,
for example, cleaning at breakfast or dinner time. The activities were codified into
10 characters according to the Table ‘Activity types’.

202
Activity types Letter_act_program
Sleeping A
Personal care B
Mealtime C
Creative and fun D
Physical activities E
Social activities F
Work or study related G
Joint activities H
Cleaning I
Out of home J
Table ‘Activity types’. Activity types codified into 10 characters.
The length of a window on a sequence has been uniformly sampled in 19 periods
of 1 hour (represented in Table by ID times), from 06:00 to 01:00 (19 hours) (see
the Table ‘Time schedule’).
ID times Time Description Begin End
1 Time1 06:00:00 07:00:00
2 Time2 07:00:00 08:00:00
3 Time3 08:00:00 09:00:00
4 Time4 09:00:00 10:00:00
5 Time5 10:00:00 11:00:00
6 Time6 11:00:00 12:00:00
7 Time7 12:00:00 13:00:00
8 Time8 13:00:00 14:00:00
9 Time9 14:00:00 15:00:00
10 Time10 15:00:00 16:00:00
11 Time11 16:00:00 17:00:00
12 Time12 17:00:00 18:00:00
13 Time13 18:00:00 19:00:00
14 Time14 19:00:00 20:00:00
15 Time15 20:00:00 21:00:00

203
ID times Time Description Begin End
16 Time16 21:00:00 22:00:00
17 Time17 22:00:00 23:00:00
18 Time18 23:00:00 00:00:00
19 Time19 00:00:00 01:00:00
Table ‘Time schedule’
A basic exemplification of how self-completion diary data were codified into the
sequence of activities is shown in the Figure ‘Diary example’
1 2 3 4 5 6 7 8 9 10 11 12 13
Sleep -> A Personal care->B Out of home->J
14 15 16 17 18 19
Creative and fun->D Sleep->A
Figure ‘Diary example’. Example of how diaries (in-home schedules) were
codified into sequence of activities.
Activity profile
Identification of the activity profile is obtained by manipulating sequences of
activities. One of the simplest methods of obtaining the activity profile is that of
the use of a Position Weight Matrix (PWM) method. The PWM is a matrix M,
generated by A×w, where A is a sequence of symbols (A1, A2, A3, An) and w is
the length of a window on a sequence.
A position weight matrix can be obtained using different methods such as the direct
frequency method or the Markov chain. Using parsimonious criteria a direct
frequency method was chosen, whereby the matrix M for each pattern can be
defined as the relative frequency of x at position p by selecting the highest value
from each column in which each column represents a probability distribution (Dong
and Pei, 2007). Therefore, M(x,p) can be represented as follows:
𝑀(𝑥, 𝑝) = 𝑛 (𝑥, 𝑝)
𝑁

204
The suitability of the Position Weight Matrix (PWM) method was tested by using
data from the pilot survey (see Table ‘Position Weight Matrix’). Based on the test,
a “consensus sequence” or activity profile was obtained by including the most
frequent symbol whose frequency is above 0.4 for each position.
The consensus sequence for the pilot study was:
S’ = A[AB][BC]LLLLLLLLLLCCDEAA
ID 1 2 3 4 5 6 7 8 9 10 11 12 13 14 15 16 17 18 19
A 0.8 0.4 0 0 0 0 0 0 0 0 0 0 0 0 0 0 0 0.4 0.8
B 0.2 0.4 0.4 0 0 0 0 0 0 0 0 0 0 0 0 0 0 0 0
C 0 0.2 0.4 0.2 0 0 0 0 0.2 0 0 0 0.2 0.4 0.4 0 0 0 0
D 0 0 0 0 0.2 0 0 0 0 0 0 0 0 0 0 0.4 0 0 0
E 0 0 0 0 0 0 0 0 0 0 0 0.2 0 0 0.2 0.2 0.6 0.2 0
F 0 0 0 0 0 0 0 0 0 0 0.2 0 0.2 0.2 0.2 0 0 0 0.2
G 0 0 0 0 0 0 0 0 0 0 0 0 0 0 0 0 0 0 0
H 0 0 0 0 0 0 0 0 0 0.2 0 0 0 0 0 0.2 0.2 0.2 0
I 0 0 0 0 0 0 0 0.2 0 0 0 0.2 0 0 0 0.2 0 0.2 0
J 0 0 0 0 0 0 0 0 0 0 0 0 0 0 0 0 0 0 0
K 0 0 0 0 0 0 0 0 0 0 0 0 0 0 0 0 0 0 0
L 0 0 0.2 0.8 0.8 1 1 0.8 0.8 0.8 0.8 0.6 0.6 0.2 0 0 0 0 0
M 0 0 0 0 0 0 0 0 0 0 0 0 0 0 0.2 0 0 0 0
N 0 0 0 0 0 0 0 0 0 0 0 0 0 0 0 0 0.2 0 0
O 0 0 0 0 0 0 0 0 0 0 0 0 0 0.2 0 0 0 0 0
P 0 0 0 0 0 0 0 0 0 0 0 0 0 0.2 0 0 0 0 0
Table ‘Position Weight Matrix’. Position Weight Matrix obtained from the pilot
survey.

205
An activity profile for the study survey was obtained by including the most
frequent activities whose frequency is above 0.2 (20% of frequency of the
activity).

206
Annex I
Further calculation on the space heating consumption of the target building.
Methodology
A database of monthly space heating meter-point data for the years 2012–2013 was
also used to examine the consumption of previous years in the target building
(n=157). The annualised space heating data are derived from the difference between
two meter readings (January and December), taking into account all the records,
estimated and direct record (only negatives were not considered). See the Table
‘Annualised mean space heating consumption for the target building below.
Year
Annualised mean space heating consumption:
Target building (kWh) *
2012 1357
2013 1396
(*) n=157
Table ‘Annualised mean space heating consumption’ for the target building in
kWh.