
Luton Functional Economic Market Area Study
54
Luton Functional Economic Market Area Study Luton Functional Economic Market Area Study FOR INTERNAL USE ONLY Disclaimer This presentation is based on initial data analysis and information gathering, in accordance with the specification for the work and for the purposes of preparing a draft report. This analysis contains a number of outstanding matters that may be subject to clarification or confirmation. In addition, all outputs are subject to our internal review procedures and accordingly, we reserve the right to add, delete and/or amend the finding as appropriate. No party may place any reliance whatsoever upon these draft findings. Presentation of Emerging Findings 11 th February 2016
Transcript of Luton Functional Economic Market Area Study

Luton Functional Economic Market Area Study
Luton Functional Economic Market Area Study
FOR INTERNAL USE ONLY
DisclaimerThis presentation is based on initial data analysis and information gathering, in accordance with the specificationfor the work and for the purposes of preparing a draft report. This analysis contains a number of outstandingmatters that may be subject to clarification or confirmation. In addition, all outputs are subject to our internalreview procedures and accordingly, we reserve the right to add, delete and/or amend the finding as appropriate.No party may place any reliance whatsoever upon these draft findings.
Presentation of Emerging Findings
11th February 2016

Luton Functional Economic Market Area Study
Agenda
Introduction and Welcome (LBC) 10.00am
Presentation of Emerging Findings (NLP) 10.10am
Refreshment Break 11.00am
Group Discussion 11.10am
Group Discussion Feedback (NLP) 11.40am
Next Steps (NLP) 11.55am
Close 12.00pm

Luton Functional Economic Market Area Study
Purpose of Workshop
1. Introduce the approach and methodology to the Luton FEMA Study
2. Present the emerging findings
3. Identify job growth forecasts
4. Questions for discussion about the emerging findings
5. Next steps

Luton Functional Economic Market Area Study
1. Approach and Methodology

Luton Functional Economic Market Area Study
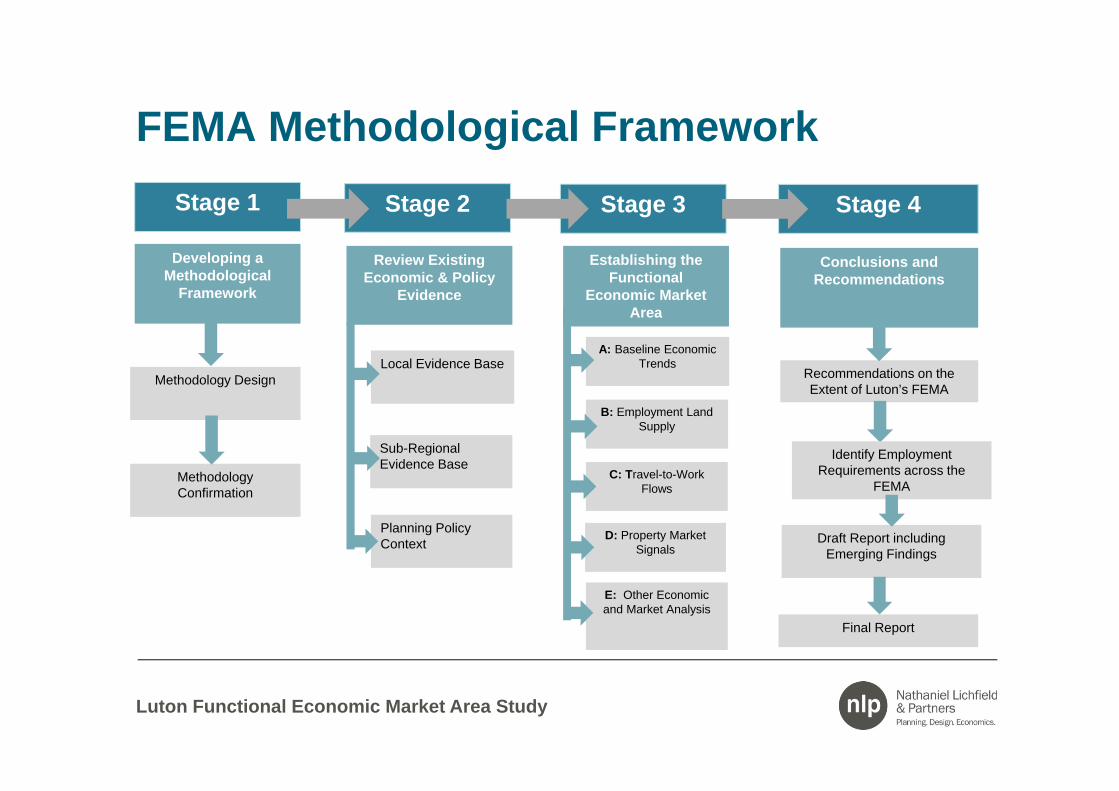
Approach
1. Developing a Methodological Framework
2. Defining Functional Economic Market Area
3. Evidence Review and Updated Forecasts
4. Identify Employment Floorspace Requirements across the FEMA
5. Consideration of Demand/ Supply Balance
6. Conclusions and Recommendations
Luton Functional Economic Market Area Study
FEMA Methodological FrameworkStage 1
Developing a Methodological
Framework
Methodology Design
Methodology Confirmation
Stage 2 Stage 4
Review Existing Economic & Policy
Evidence
Local Evidence Base
Sub-Regional Evidence Base
Planning Policy Context
Conclusions and Recommendations
A: Baseline Economic Trends
B: Employment Land Supply
C: Travel-to-Work Flows
D: Property Market Signals
E: Other Economic and Market Analysis
Recommendations on the Extent of Luton’s FEMA
Draft Report including Emerging Findings
Final Report
Stage 3
Establishing the Functional
Economic Market Area
Identify Employment Requirements across the
FEMA

Luton Functional Economic Market Area Study
2. Economic Context and Trends

Luton Functional Economic Market Area Study
Luton
BedfordCentral Bedfordshire
Dacorum
North Hertfordshire
St. Albans
Stevenage
Aylesbury Vale
Milton Keynes
5.00%
10.00%
15.00%
20.00%
25.00%
30.00%
35.00%
40.00%
45.00%
40000 60000 80000 100000 120000 140000 160000 180000 200000
% Cha
nge in Employmen
t Job
s 1997‐2016
Total Employment Jobs (2016)
Total Job growth by Local Authority, 1997‐2016
Luton’s workforce jobs have grown at a rate of 20% between 1997 and 2016, which is broadly comparable with the 21% average across the neighbouring authorities (excl Milton Keynes)
Source: EEFM, 2014
Luton Functional Economic Market Area Study
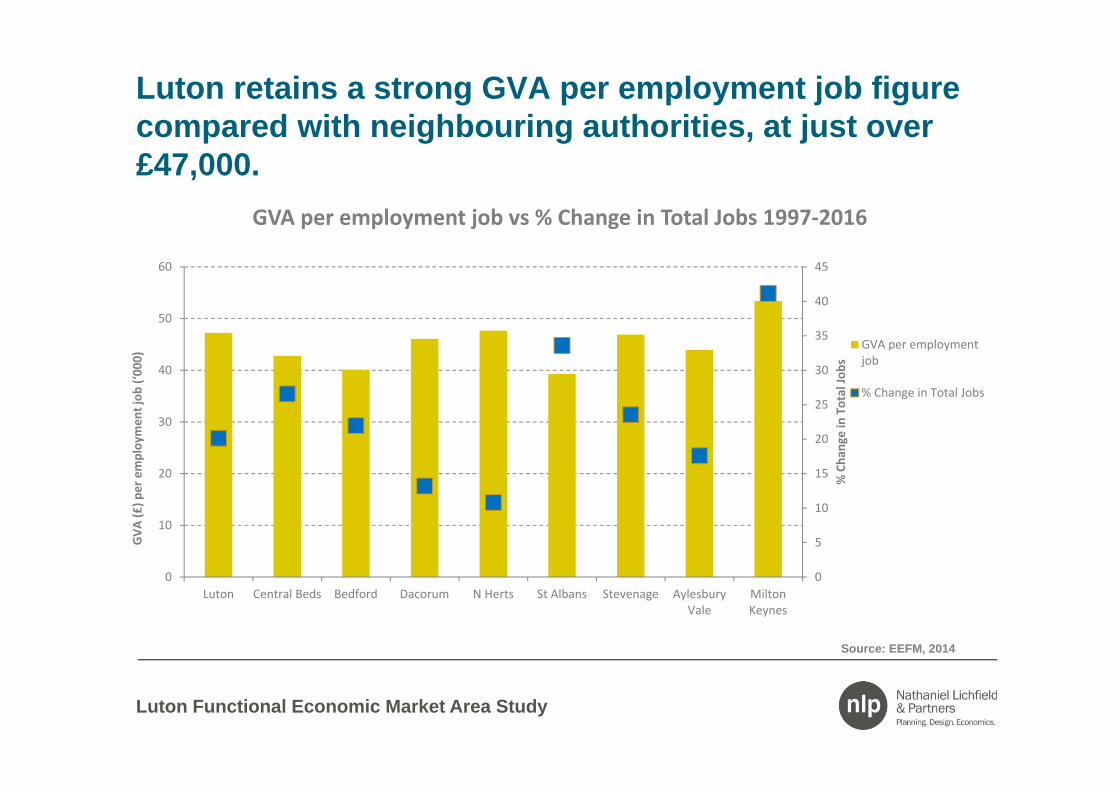
Luton retains a strong GVA per employment job figure compared with neighbouring authorities, at just over £47,000.
Source: EEFM, 2014
0
5
10
15
20
25
30
35
40
45
0
10
20
30
40
50
60
Luton Central Beds Bedford Dacorum N Herts St Albans Stevenage AylesburyVale
MiltonKeynes
% Cha
nge in Total Jo
bs
GVA
(£) p
er employ
men
t job
(‘00
0)
GVA per employment job vs % Change in Total Jobs 1997‐2016
GVA per employmentjob
% Change in Total Jobs

Luton Functional Economic Market Area Study
Employment data shows the marked decrease in manufacturing and subsequent increase in administrative and professional services.
10,530
23,990 29,2205,050
6,5907,310
3,740
11,71013,200
6,750
9,2309,170
2,330
2,9602,810
2,750
6,2406,630
2,040
1,0801,110
1,600
2,4402,620
4,720
5,0105,700
8,970
6,9607,200
13,890
13,81014,47020,060
9,140 6,660
1997 2016 2031
82,920 99,620 106,520
Job
Tota
l by
Sect
or
1997-2031
Current and Projected Job Change by Sector, 1997-2031
Manufacturing
Wholesale & Transport
Retail
Construction
Publishing, Telecoms &Computer ActivitiesFinance
Employment Activities
Public Administration
Education
Health & Care
Hospitality, Arts &EntertainmentAdministrative Supportand Professional Services
Source: EEFM, 2014

Luton Functional Economic Market Area Study
Key points
• Luton has seen average levels of job growth over the past two decades
• Luton’s local economy has experienced a significant shift in the structure of its economy resulting in a decrease in manufacturing, with simultaneous growth in administrative, support and professional services and the health sector
• Luton out-performs neighbouring authorities in terms of GVA per employment job reflecting the presence of high value activities

Luton Functional Economic Market Area Study
3. Labour Market Areas

Luton Functional Economic Market Area Study
The extent of the ONS Luton TTWA has remained broadly consistent between 2001 and 2011
ONS, Census 2001 ONS, Census 2011

Luton Functional Economic Market Area Study
Luton Aylesbury
Vale Bedford Central
Bedfordshire
Dacorum Milton Keynes North Herts. St Albans Stevenage
Total working residents 89,590 91,250 76,270 132,765 73,920 128,240 65,405 71,820 42,935 Total workplace workers 90,495 75,940 75,040 98,965 66,795 144,715 52,920 62,110 45,130
Live and work in the Local Authority
56,095 56,070 53,630 66,430 42,945 100,195 32,560 35,250 24,360
Self-containment rate 63% 61% 70% 50% 58% 78% 50% 49% 57% Out-commuting workers 33,495 35,180 22,640 66,335 39,905 28,040 32,845 36,570 18,575
Top out-commuting destinations
Central Beds, St Albans,
Dacorum, Welwyn Hatfield, Milton
Keynes
Milton Keynes,
Wycombe, Dacorum,
South Oxfordshire,
Cherwell
Central Beds, Milton
Keynes, Luton,
Huntingdonshire,
Westminster, City of London
Luton, Milton Keynes, Bedford,
North Herts, Westminster,
City of London
St Albans, Watford,
Westminster, City of
London, Three Rivers,
Aylesbury Vale
Central Bedfordshire,
Aylesbury Vale,
Westminster, City of
London, Bedford,
Northampton
Westminster,City of
London, Welwyn Hatfield,
Dacorum, Hertsmere,
Camden
Westminster,City of
London, Welwyn Hatfield,
Dacorum, Hertsmere,
Camden
North Herts, Welwyn
Hatfield, East Herts,
Westminster, City of
London, St Albans
In-commuting workers 34,400 19,870 21,410 32,535 23,852 44,520 20,360 26,860 20,770 Top in-commuting destinations
Central Beds, St Albans,
North Herts, Bedford,
Milton Keynes
Milton Keynes, Central Beds,
Wycombe, Dacorum,
South Oxfordshire
Central Beds,
Huntingdonshire, East
Northamptonshire, Milton
Keynes, Luton
Luton, Bedford, Milton
Keynes, North Herts, Aylesbury
Vale
Central Beds,
Aylesbury Vale, Luton, St Albans,
Three Rivers
Central Beds, South Northampton
shire, Aylesbury
Vale, Northampton
, Bedford
Central Beds,
Stevenage, South
Cambridge, Luton, East
Herts
Dacorum, Luton,
Welwyn Hatfield, Central
Bedfordshire, Hertsmere
North Herts, Central
Beds, East Herts,
Welwyn Hatfield,
Luton
Net flow of workers 905 (outflow)
15,310 (outflow)
1,230 (outflow)
33,800 (outflow)
16,055 (outflow)
4,070 (inflow)
12,485 (outflow)
9,710 (outflow)
2,195 (inflow)
The TTWA can be refined further using local commuting analysis…
Source: Census 2011, Origin-Destination

Luton Functional Economic Market Area Study
The strongest out-commuting flows are to Central Beds and North Herts with some flows to the key centres including Milton Keynes, Welwyn, Stevenage, Hemel and St. Albans.
DestinationProportion (%) of Luton’s Out Commuters
Hertfordshire 35%
Former Bedfordshire 29%
Buckinghamshire 8%
Northamptonshire 1%
Total out-flow 33,495
Source: Census 2011, Origin-Destination

Luton Functional Economic Market Area Study
In contrast to the ONS TTWA, in-commuting flows from the south are limited beyond St Albans
OriginProportion (%) of Luton’s In Commuters
Former Bedfordshire 42%
Hertfordshire 19%
Buckinghamshire 6%
Northamptonshire 2%
Total in-flow 34,400
Source: Census 2011, Origin-Destination

Luton Functional Economic Market Area Study
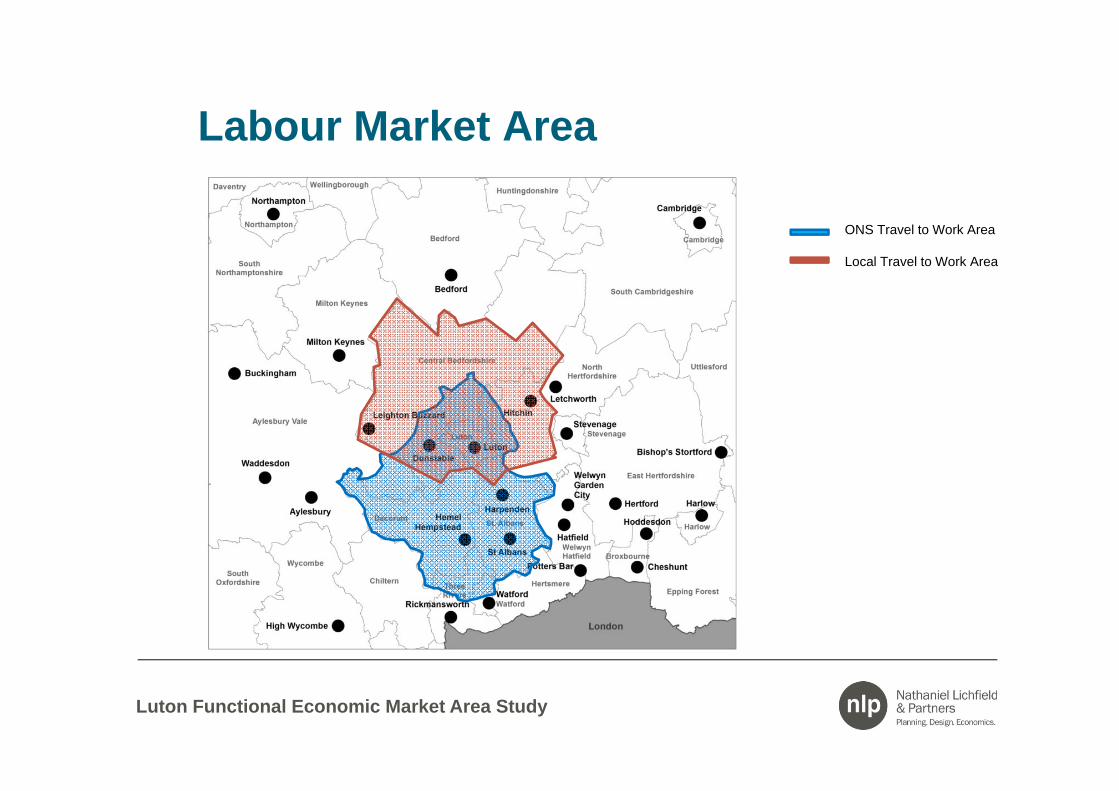
This results in a relatively more contained labour market area
Source: Census 2011, Origin-Destination

Luton Functional Economic Market Area Study
Despite having a net out-flow of workers overall, the occupational profile of commuters shows that Luton is a net importer of higher skilled workers…
Occupation In-commuters Out-commutersHigher Professional/ Managerial Occupations 55% 45%
Intermediate/ Small Employers/ Lower Supervisory Occupations 28% 31%
Semi-routine/ Routine Occupations 17% 24%
Source: Census 2001

Luton Functional Economic Market Area Study
Key points
• The spatial extent of the ONS Luton TTWA did not change significantly in the inter-Census period (2001-2011)
• Luton has a self-containment rate of 63%
• Luton’s has a relatively localised labour market area, with a strong functional relationship, in commuting terms, with Central Beds, St. Albans and North Herts in particular
• In-commuters tend to originate from areas to the north while out-commuting flows also extend south of Luton
• Luton is a net importer of higher skilled workers that hold top-tier occupations
• Local commuting analysis broadly substantiates the ONS Luton TTWA

Luton Functional Economic Market Area Study
4. Housing Market Areas
Luton Functional Economic Market Area Study
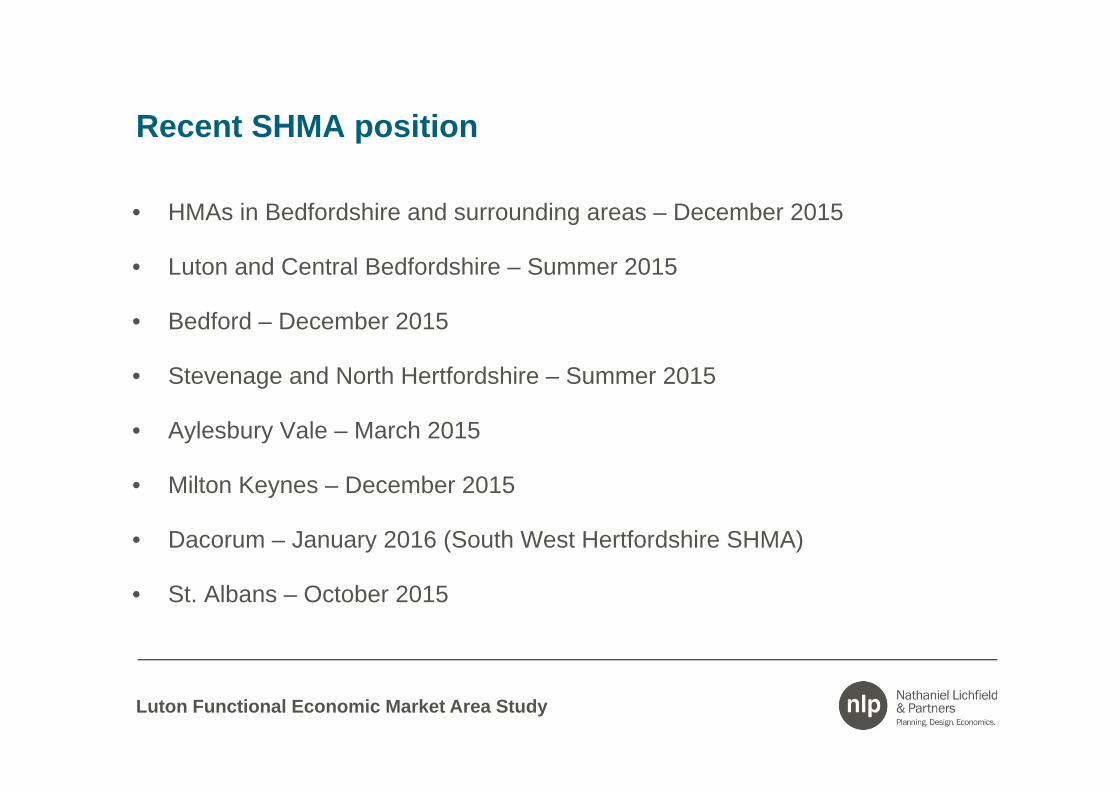
Recent SHMA position
• HMAs in Bedfordshire and surrounding areas – December 2015
• Luton and Central Bedfordshire – Summer 2015
• Bedford – December 2015
• Stevenage and North Hertfordshire – Summer 2015
• Aylesbury Vale – March 2015
• Milton Keynes – December 2015
• Dacorum – January 2016 (South West Hertfordshire SHMA)
• St. Albans – October 2015

Luton Functional Economic Market Area Study
The ‘HMA in Bedfordshire and surrounding areas Study’ (Nov 2015) confirms the spatial extent of the Luton HMA
Source: ORS, 2015
Housing Market Area Map
Milton Keynes HMA
Luton HMA
Bedford HMA
Central Buckinghamshire HMA
Stevenage HMA

Luton Functional Economic Market Area Study
Key Points
• Luton forms one of four main HMAs in Central Bedfordshire which also include Milton Keynes, Bedford and Stevenage HMAs
• Only 13% of the total land within the Luton HMA is located within the local authority boundary. Some 68% of the remaining land in the HMA falls within Central Bedfordshire administrative boundary, and 20% in other local authorities.
• Outside of Luton and Milton Keynes, the local authority boundaries and HMA areas are primarily aligned.

Luton Functional Economic Market Area Study24
5. Commercial Property Market Areas

Luton Functional Economic Market Area Study
Luton has a larger quantum of supply of employment space than most of the nearby authorities with the exception of Milton Keynes and Central Beds
3991,7
02
710
262
339
497
3031,0
32
474
45993
1493
35611
4
185
413
1,023
617
168
63919
3
152
209
307
13819
9
307
Aylesb
ury V
ale
Milton K
eynes
Bedfor
d
Stevena
ge
St Alba
ns
Dacoru
m
North H
erts
Centra
l Bed
s
Luton
1,0263,2721,3967706629898542,2541,398
Offices
Factories
Warehouses
Floorspace (000 m2)
• Luton has 1.4m sq.m of B
Class floorspace:
• 44% factory space
• 34% is warehousing
• 22% comprises offices
• Amounts to about 11% of
floorspace stock within the
area
Source: VOA, 2008
Employment Floorspace in Luton and Neighbouring Authorities

Luton Functional Economic Market Area Study
There are clusters of industrial floorspace in Luton, Milton Keynes, Stevenage and Bedford
• Luton accounts for 13% of the area’s manufacturing spaceand 8% of warehousing
• Manufacturing space is focused around the key centres
• Warehousing is typically located close to strategic transport networks (M1, A1 corridors)
Source: VOA, 2010

Luton Functional Economic Market Area Study
Office floorspace is clustered within the key centres of Milton Keynes, Luton and Dacorum accounting for the majority of space
• Luton accounts for 13% of the area’s office stock
• This is comparable with the quantum of office floorspace in Dacorum
• Milton Keynes is the only local authority in the area with a greater level of office floorspace providing 28% of the area total
Source: VOA, 2010

Luton Functional Economic Market Area Study
Luton’s industrial market has been traditionally strong though limited supply is impacting on take-up levels
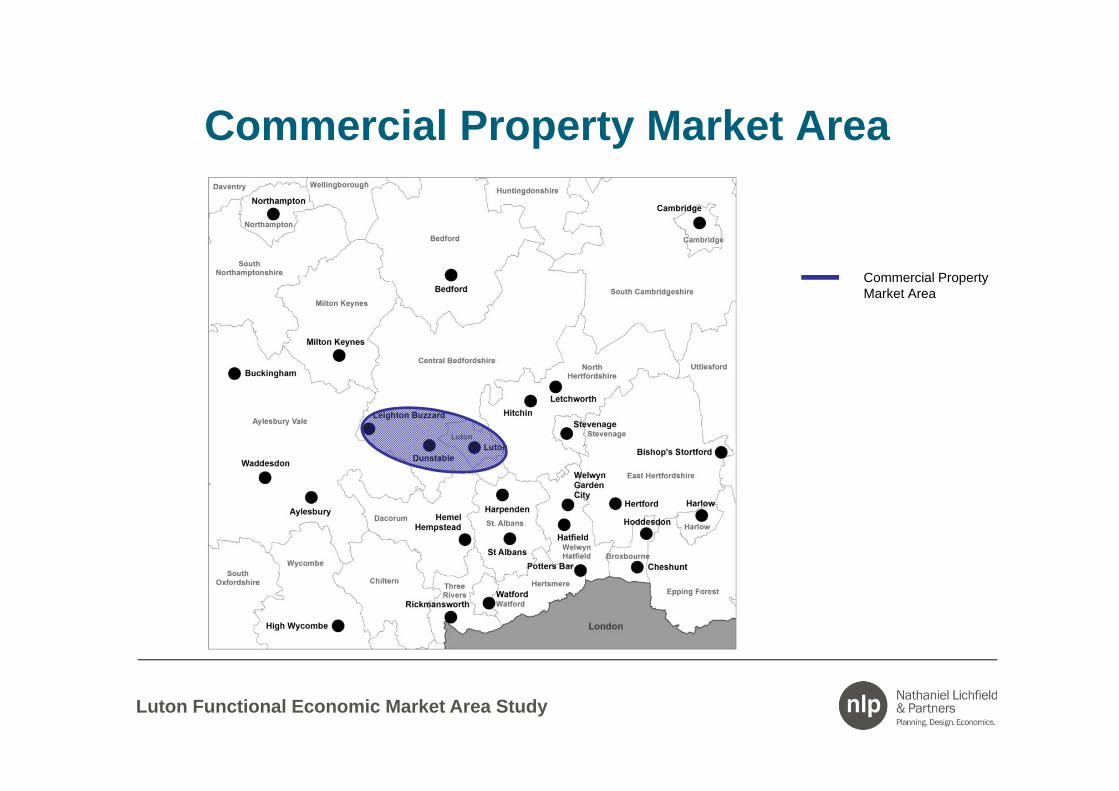
• Luton forms a single market with Dunstable and Houghton Regis in industrial property market terms
• Luton has seen good levels of take-up within the industrial and logistics market in recent years in part due to a shortage of availability in locations closer to London
• Luton provides a cost advantage over competing locations along the M1 corridor, though this is partly linked to the quality of the stock available
• Occupier demand is primarily driven by local businesses (seeking move-on space) though there has been an increase in the number of firms coming into the area from other constrained locations
• As a result available supply is at record low levels (c. 6 months of pipeline supply) with particular shortage of small floorplate units (<50,000sq.ft)
Luton Functional Economic Market Area Study
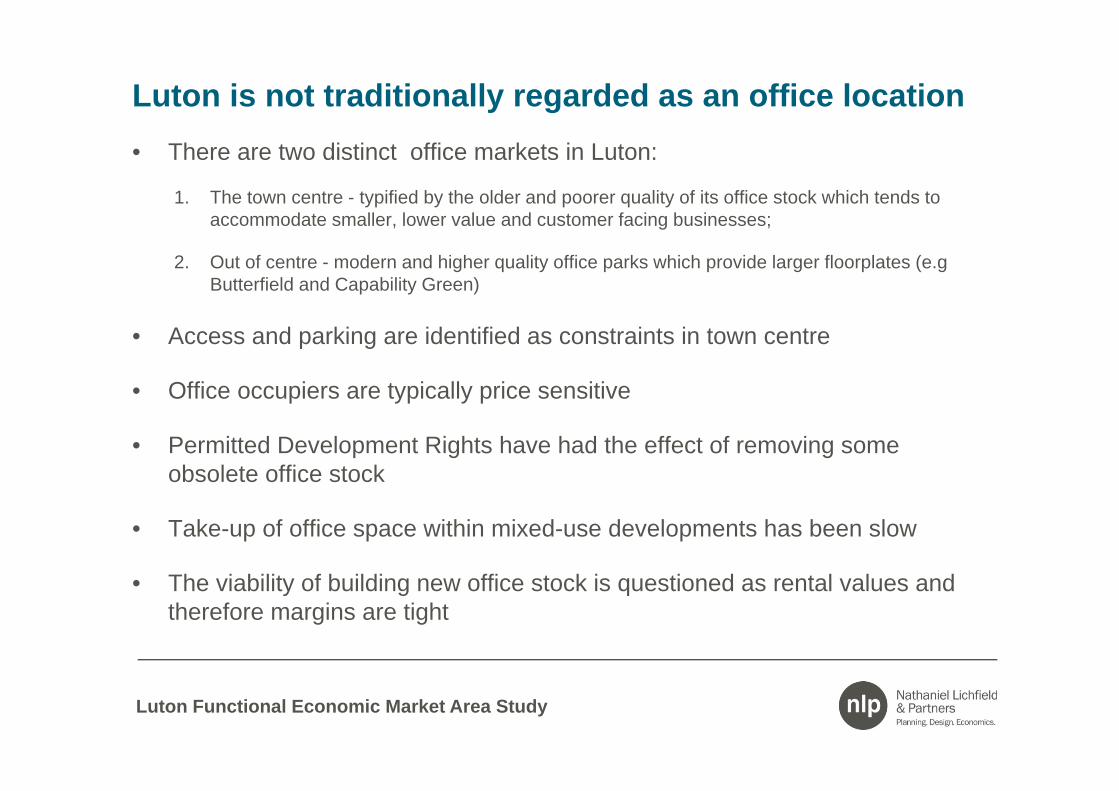
Luton is not traditionally regarded as an office location• There are two distinct office markets in Luton:
1. The town centre - typified by the older and poorer quality of its office stock which tends to accommodate smaller, lower value and customer facing businesses;
2. Out of centre - modern and higher quality office parks which provide larger floorplates (e.gButterfield and Capability Green)
• Access and parking are identified as constraints in town centre
• Office occupiers are typically price sensitive
• Permitted Development Rights have had the effect of removing some obsolete office stock
• Take-up of office space within mixed-use developments has been slow
• The viability of building new office stock is questioned as rental values and therefore margins are tight

Luton Functional Economic Market Area Study
Commercial property market evidence indicates that Luton has a relatively localised market, but also operates within the wider M1 corridor

Luton Functional Economic Market Area Study
Key points
• Luton has approximately 1.4sq.m of employment floorspace which is a larger stock than most of the neighbouring authorities
• 78% of the Borough’s stock comprises industrial space which reflects why Luton is not traditionally regarded as an office location
• Rental values make Luton an attractive industrial location which has resulted in good levels of take-up in recent years
• Occupier demand is driven by indigenous companies and firms relocated from other constrained locations
• There is approximately 6 months of pipeline supply with a particular shortage of smaller units
• Luton has a two tier office market; Permitted Development Rights have removed some obsolete stock but viability remains a barrier

Luton Functional Economic Market Area Study
6. Other Functional Economic Market Area Factors

Luton Functional Economic Market Area Study
Luton has a relatively localised retail catchment. Despite recording a relatively high retail ranking, Luton struggles to compete with Milton Keynes and Watford
Retail Centre Venuescore2013/14
VenuescoreRanking
Milton Keynes 293 24th
Watford 250 41st
Luton 187 80th
Bedford 161 119th
St. Albans 149 141st
Stevenage 143 149th
Hemel Hempstead
142 151st
Source: Luton Retail Study, 2015

Luton Functional Economic Market Area Study
The catchment areas show that Luton Airport has a particularly strong draw from North London and neighbouring areas though its catchment also stretches into the Midlands
Source: CAA 2009 Annual Passenger Survey
Luton Functional Economic Market Area Study
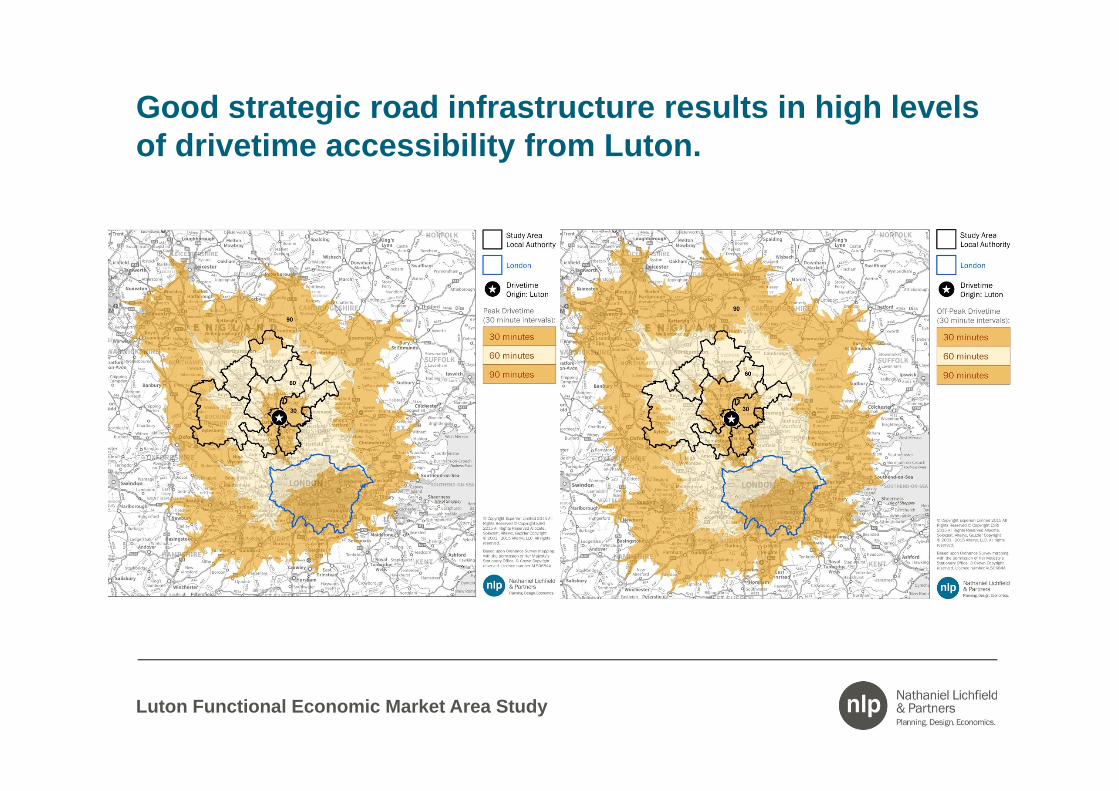
Good strategic road infrastructure results in high levels of drivetime accessibility from Luton.

Luton Functional Economic Market Area Study
Key points
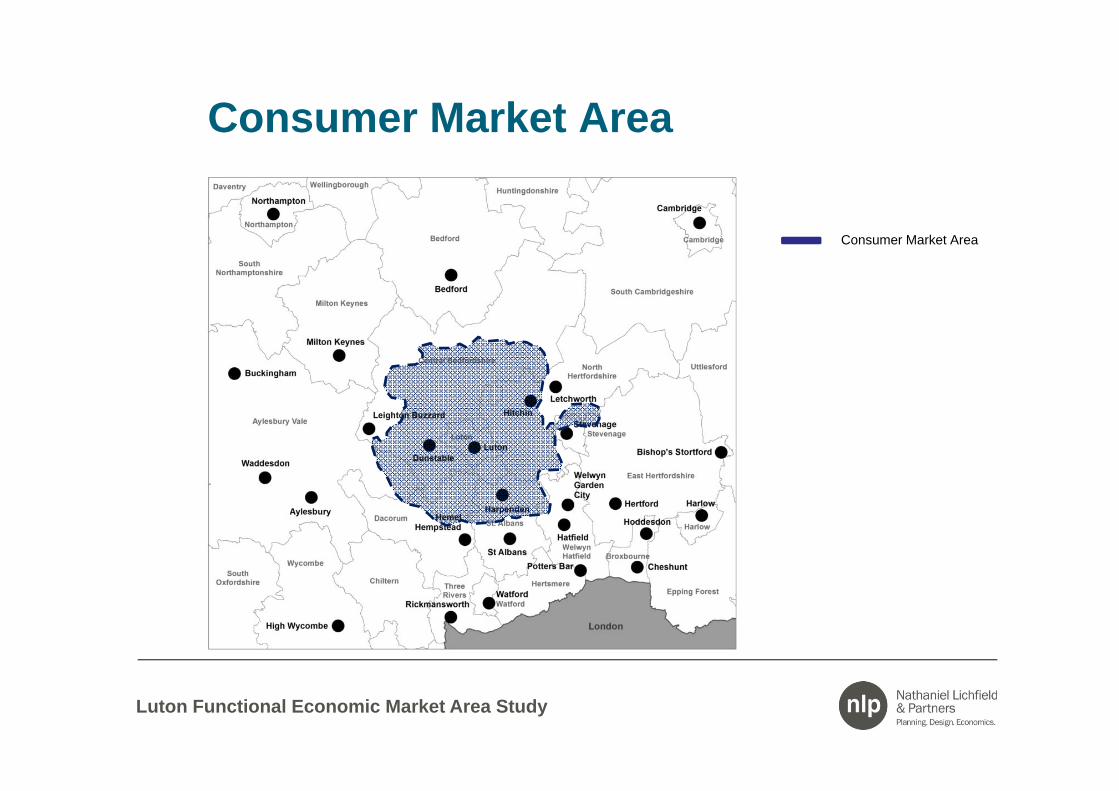
• The Luton retail catchment area is relatively localised reflecting the current scale and mix of retail provision within the town centre, and proximity of competing higher order centres such as Milton Keynes and Watford.
• Luton has good levels of transport accessibility by road, rail and air.
• Luton Airport draws in just over 1/3rd of passengers from the Greater London area, with its catchment area extending as far North as the Midlands.
• Peak and off-peak drivetimes include Greater London and large areas of the South East/south East Midlands
• Transport factors taken in isolation imply a much wider catchment area but unlikely to be practical when weighed against other factors for planning purposes.

Luton Functional Economic Market Area Study
7. Synthesis
Luton Functional Economic Market Area Study
Labour Market Area
ONS Travel to Work Area
Local Travel to Work Area

Luton Functional Economic Market Area Study
Housing Market Area
Housing Market Area
Luton Functional Economic Market Area Study
Commercial Property Market Area
Commercial Property Market Area
Luton Functional Economic Market Area Study
Consumer Market Area
Consumer Market Area

Luton Functional Economic Market Area Study
Core Functional Economic Market Area
Housing Market Area
Consumer Market Area
Commercial Property Market Area
ONS Travel to Work Area
Core Local Travel to Work Area
Core Functional Economic Market Area for Luton

Luton Functional Economic Market Area Study
8. Scale of Future Growth

Luton Functional Economic Market Area Study
Job growth in Luton is expected to exceed past trends over the Local Plan period to 2031, though a similar trend is expected in Central Bedfordshire
Luton Luton’s Share
Central Bedfordshire
Central Bedfordshire
Share
Total
1991 90,458 49% 92,822 51% 183,280
2011 95,200 48% 104,791 52% 199,991
Change1991-2011
4,742 28% 11,969 72% 16,711
% Change 1991-2011
5% ~ 13% ~ 9%
2031 106,522 45% 131,531 55% 238,053
Change 2011-2031
11,322 30% 26,740 70% 38,062
% Change 2011-2031
12% ~ 26% ~ 19%
Source: EEFM, 2014
• Luton is forecast to record a 12% increase in jobs between 2011 and 2031
• Together with Central Beds job growth is forecast to equate to 19%
• The proportion split of job growth forecast for the two local authorities corresponds with past-trends
Past-trend and Forecast Job Growth- EEFM 2014

Luton Functional Economic Market Area Study
Despite recording a decline in recent years, the number of B Class jobs is expected to increase by 15% by 2031
Luton Luton’s Share
Central Bedfordshire
Central Bedfordshire
Share
Total
1991 47,090 50% 47,984 50% 95,074
2011 43,052 47% 48,243 53% 91,295
Change1991-2011
-4,038 107% 259 -7% -3,779
% Change 1991-2011
-9% ~ 1% ~ -4%
2031 49,499 43% 64,715 57% 114,214
Change 2011-2031
6,447 28% 16,472 72% 22,919
% Change 2011-2031
15% ~ 34% ~ 25%
Past-trend and Forecast B Class Job Growth- EEFM 2014
Source: EEFM, 2014
• Luton is forecast to record a 15% increase in B Class jobs between 2011 and 2031
• Together with Central Beds. B Class job growth is forecast to equate to 25%
• The proportion split of B Class job growth forecast for the two local authorities significantly surpasses with past-trends

Luton Functional Economic Market Area Study
The 2012 EEFM forecasts imply a higher level of forecast job growth, partly due to a lower 2011 base figure
Luton Luton’s Share
Central Bedfordshire
Central Bedfordshire
Share
Total
1991 89,764 49% 93,320 51% 183,084
2011 96,214 46% 111,269 54% 207,483
Change1991-2011
6,450 26% 17,949 74% 24,399
% Change 1991-2011
7% ~ 19% ~ 13%
2031 113,825 47% 129,305 53% 243,130
Change 2011-2031
17,610 49% 18,036 51% 35,646
% Change 2011-2031
18% ~ 16% ~ 17%
Past-trend and Forecast Job Growth- EEFM 2012
Source: EEFM, 2012
• Luton was forecast to record a 18% increase in jobs between 2011 and 2031.
• 2012 forecasts suggest c.1,000 more jobs in base year compared with the 2014 forecasts
• In contrast, forecast job growth in Central Beds was lower(16%).
• Together with Central Beds job growth was forecast to equate to 17% which is slightly lower than 2014 forecasts (19%)

Luton Functional Economic Market Area Study
EEFM 2012 recorded a lower number of B Class jobs in 2011 by 2,440 jobs compared with EEFM 2014
Luton Luton’s Share
Central Bedfordshire
Central Bedfordshire
Share
Total
1991 44,097 48% 47,962 52% 92,059
2011 40,612 46% 46,962 54% 87,574
Change1991-2011
-3,485 78% -1,000 22% -4,485
% Change 1991-2011
-8% ~ -2% ~ -5%
2031 48,202 47% 55,095 53% 103,297
Change 2011-2031
7,591 48% 8,133 52% 15,724
% Change 2011-2031
19% ~ 17% ~ 15%
Past-trend and Forecast B Class Job Growth- EEFM 2012
Source: EEFM, 2012
• Luton was forecast to record a 19% increase in B Class jobs between 2011 and 2031
• Together with Central Beds. B Class job growth was forecast to equate to 15%
• The proportion split of B Class job growth forecast for the two local authorities more closely aligns with past-trends

Luton Functional Economic Market Area Study
Total job growth for Luton was revised downwards from 2011 onwards by the 2014 EEFM forecasts.
80.00
85.00
90.00
95.00
100.00
105.00
110.00
1997 1998 1999 2000 2001 2002 2003 2004 2005 2006 2007 2008 2009 2010 2011 2012 2013 2014 2015 2016
Total Employ
men
t Job
s (00
0s)
Total Job Growth 1997‐2016 in Luton
EEFM 2014
EEFM 2012
Source:EEFM 2012/2014
Luton Functional Economic Market Area Study
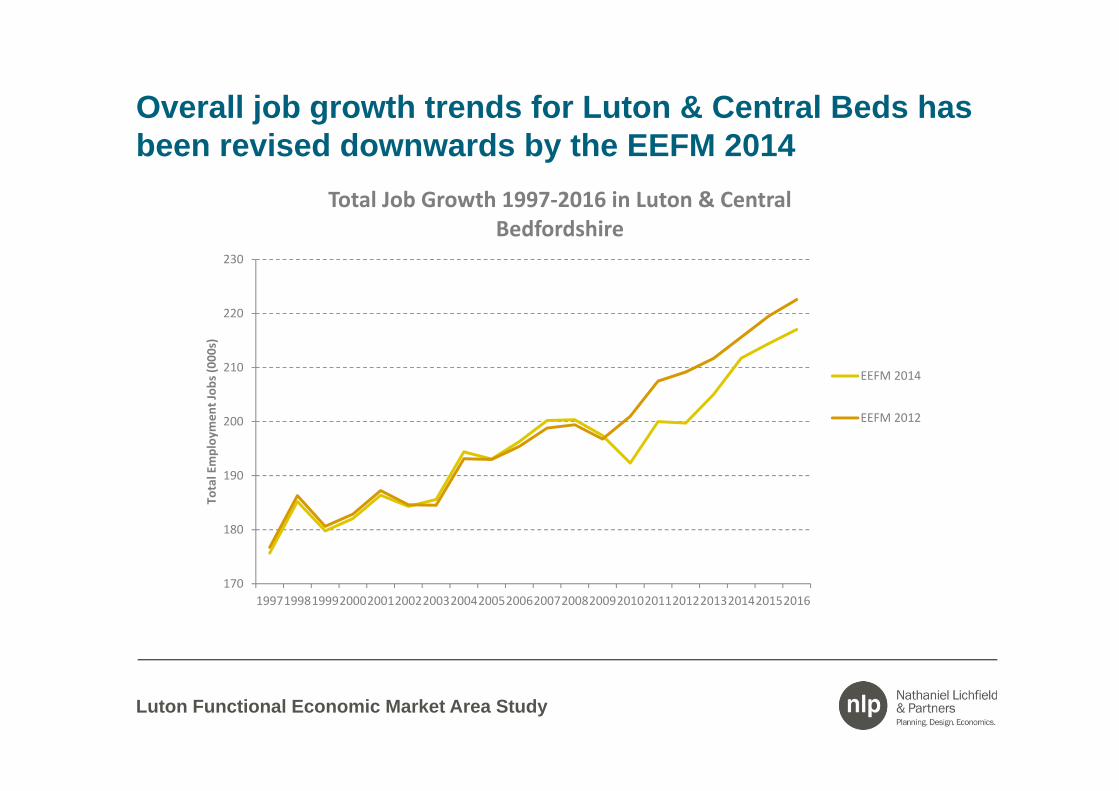
Overall job growth trends for Luton & Central Beds has been revised downwards by the EEFM 2014
170
180
190
200
210
220
230
19971998199920002001200220032004200520062007200820092010201120122013201420152016
Total Employ
men
t Job
s (00
0s)
Total Job Growth 1997‐2016 in Luton & Central Bedfordshire
EEFM 2014
EEFM 2012

Luton Functional Economic Market Area Study
9. Questions for Discussion

Luton Functional Economic Market Area Study
Questions for Discussion
1. What are Luton’s economic strengths, weaknesses, opportunities and threats?
2. Does the core area identified within the emerging findings reflect a realistic FEMA?
3. Are there further qualitative considerations that need to be taken into account?
4. Which forecasts could form the most appropriate basis for planning for future economic needs?
5. How might future job growth be distributed across the FEMA to best meet economic needs?
6. What options exist for accommodating future space needs?

Luton Functional Economic Market Area Study
10. Next Steps

Luton Functional Economic Market Area Study
Next steps
• Define future employment space and land requirements
• Consideration of the demand/supply balance
• On-going consultation
• Submit draft report

Luton Functional Economic Market Area Study


![Berkshire Functional Economic Market Area Study [9Mb]](https://static.fdocuments.in/doc/165x107/589edc811a28abb84a8c01d9/berkshire-functional-economic-market-area-study-9mb.jpg)