Looking at the hydrological results from the Asu catchment in a wider context Hodnett, M.G 1.,...
16
Looking at the hydrological results from the Asu catchment in a wider context Hodnett, M.G 1 ., Tomasella, J 2 ., Cuartas, L.A 2 ., Waterloo, M.W 1 ., Nobre, A.D 3 , Mota de Oliveira, S 3 . and Múnera, J.C 3 1 VU, Amsterdam, 2 CPTEC, INPE 3 INPA, Manaus
-
Upload
ralph-cameron -
Category
Documents
-
view
214 -
download
1
Transcript of Looking at the hydrological results from the Asu catchment in a wider context Hodnett, M.G 1.,...
Looking at the hydrological results from the Asu catchment in a wider
context
Hodnett, M.G1., Tomasella, J2., Cuartas, L.A2., Waterloo, M.W1.,
Nobre, A.D3, Mota de Oliveira, S3. and Múnera, J.C3
1 VU, Amsterdam, 2CPTEC, INPE 3INPA, Manaus
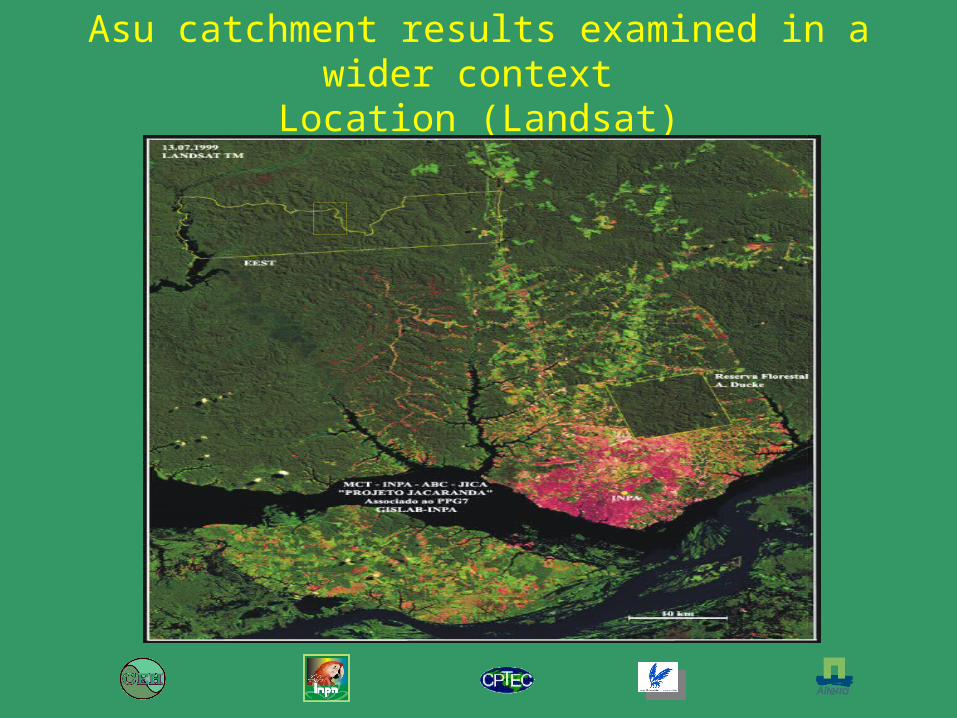
Asu catchment results examined in a wider context Location (Landsat)
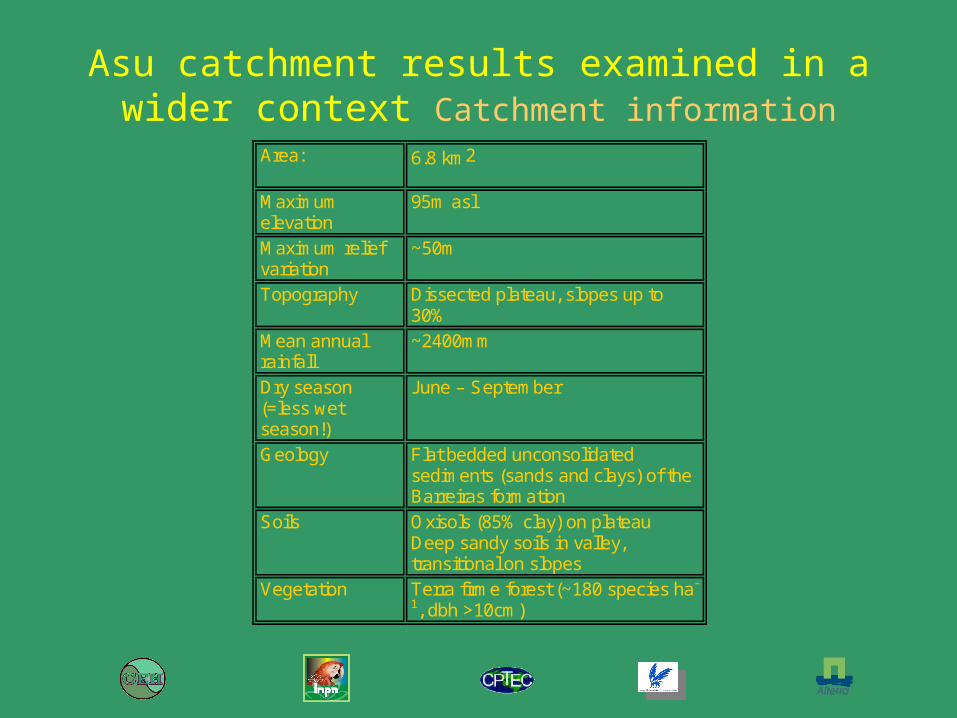
Area:
6.8 km2
Maximum elevation
95m asl
Maximum relief variation
~50m
Topography Dissected plateau, slopes up to 30%
Mean annual rainfall
~2400mm
Dry season (=less wet season!)
June – September
Geology Flat bedded unconsolidated sediments (sands and clays) of the Barreiras formation
Soils Oxisols (85% clay) on plateau Deep sandy soils in valley, transitional on slopes
Vegetation Terra firme forest (~180 species ha-
1, dbh >10cm)
Asu catchment results examined in a wider context Catchment information
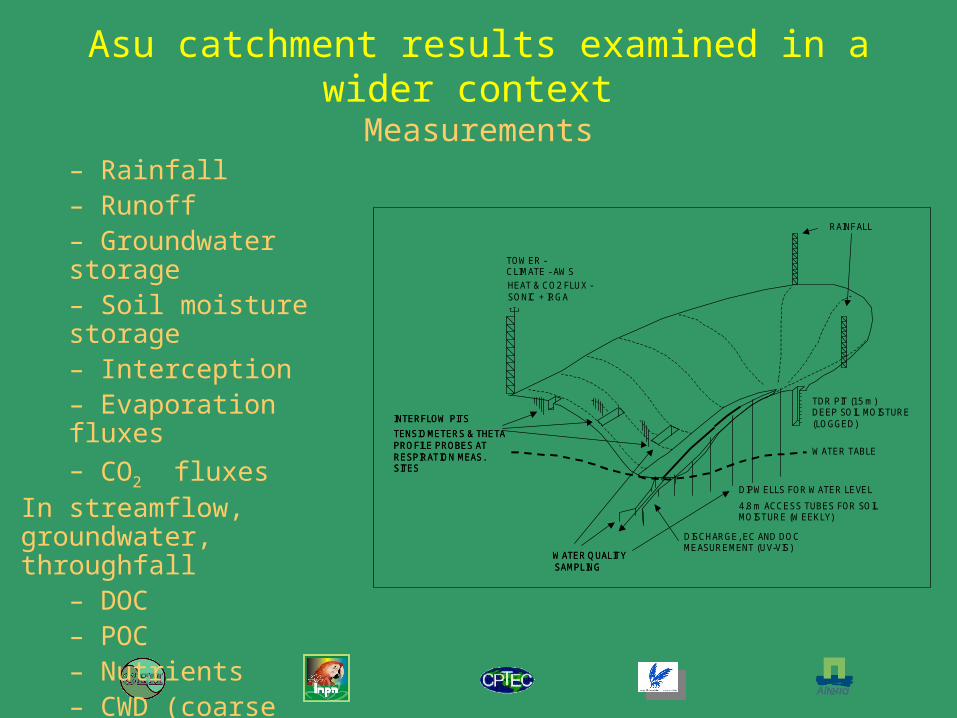
– Rainfall– Runoff– Groundwater storage – Soil moisture storage– Interception– Evaporation fluxes– CO2 fluxes
In streamflow, groundwater, throughfall
– DOC– POC – Nutrients– CWD (coarse woody debris)
WATER TABLE
TDR PIT (15 m)DEEP SOIL MOISTURE (LOGGED)
DIPWELLS FOR WATER LEVEL
4.8 m ACCESS TUBES FOR SOIL MOISTURE (WEEKLY)
DISCHARGE, EC AND DOC MEASUREMENT (UV-VIS)
INTERFLOW PITS
TENSIOMETERS & THETAPROFILE PROBES AT RESPIRATION MEAS. SITES
INTERFLOW PITS
TENSIOMETERS & THETAPROFILE PROBES AT RESPIRATION MEAS. SITES
TOWER -CLIMATE - AWS
HEAT & CO2 FLUX -SONIC + IRGA
WATER QUALITYSAMPLINGWATER QUALITYSAMPLING
RAINFALL
Asu catchment results examined in a wider context Measurements
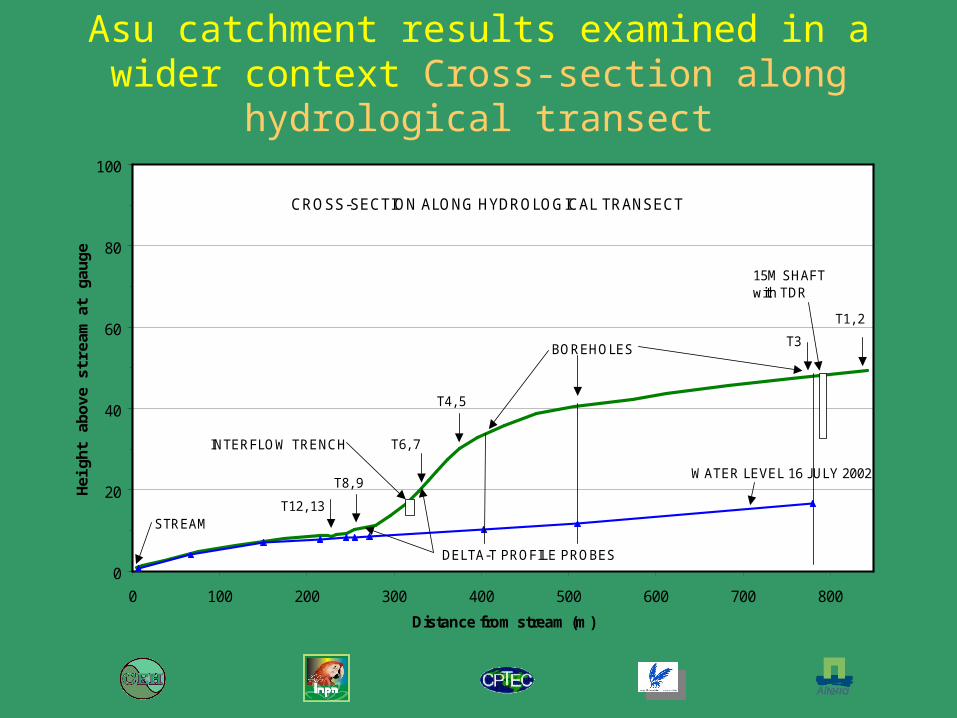
Asu catchment results examined in a wider context Cross-section along hydrological transect
0
20
40
60
80
100
0 100 200 300 400 500 600 700 800
Distance from stream (m)
Hei
gh
t ab
ove
str
eam
at
gau
ge
(m)
T12, 13
T8, 9
T6, 7
T4, 5
T3
T1, 2
STREAM
CROSS-SECTION ALONG HYDROLOGICAL TRANSECT
15M SHAFTwith TDR
DELTA-T PROFILE PROBES
INTERFLOW TRENCH
WATER LEVEL 16 JULY 2002
BOREHOLES
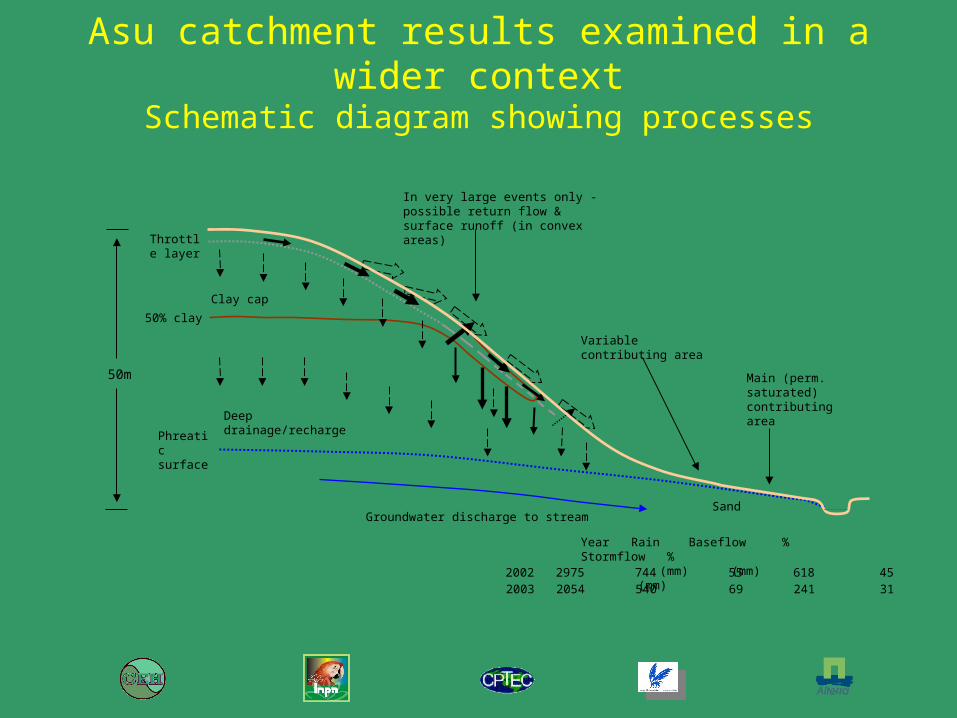
Asu catchment results examined in a wider contextSchematic diagram showing processes
Clay cap
50% clay
Throttle layer
Phreatic surface
In very large events only - possible return flow & surface runoff (in convex areas)
Groundwater discharge to stream
Variable contributing area
Main (perm. saturated) contributing area
Deep drainage/recharge
50m
Sand
Year Rain Baseflow % Stormflow % (mm) (mm) (mm)2002 2975 744 55 618 45
2003 2054 540 69 241 31
Asu catchment results examined in a wider contextKey features of Bacia Asu
• Deeply weathered and permeable catchment• Large storage in deep unsaturated zone (up to 36 m deep) • Large storage in saturated zone• Long time constant of drainage from this storage• Valley floor area ~35%
• kept near saturation by ground water discharge• main source of storm runoff (& DOC)
• Baseflow has very little DOC• Some evidence of contribution from slopes (in v. large
events)
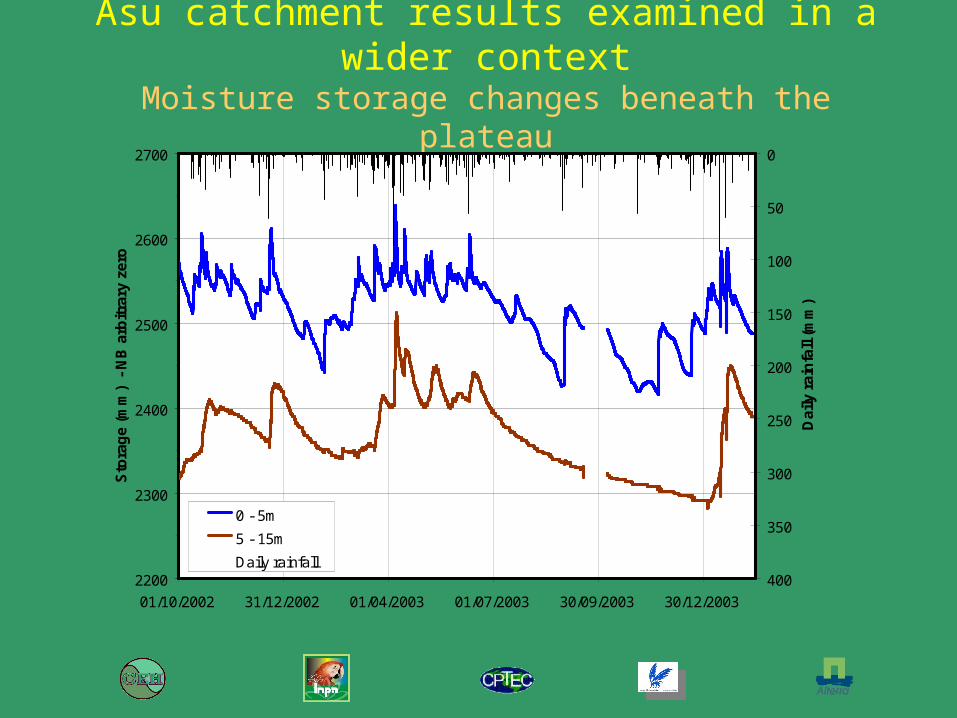
Asu catchment results examined in a wider contextMoisture storage changes beneath the plateau
2200
2300
2400
2500
2600
2700
01/10/2002 31/12/2002 01/04/2003 01/07/2003 30/09/2003 30/12/2003
Sto
rag
e (m
m)
- N
B a
rbit
rary
zer
o
0
50
100
150
200
250
300
350
400
Dai
ly r
ain
fall
(m
m)
0 - 5m
5 - 15m
Daily rainfall
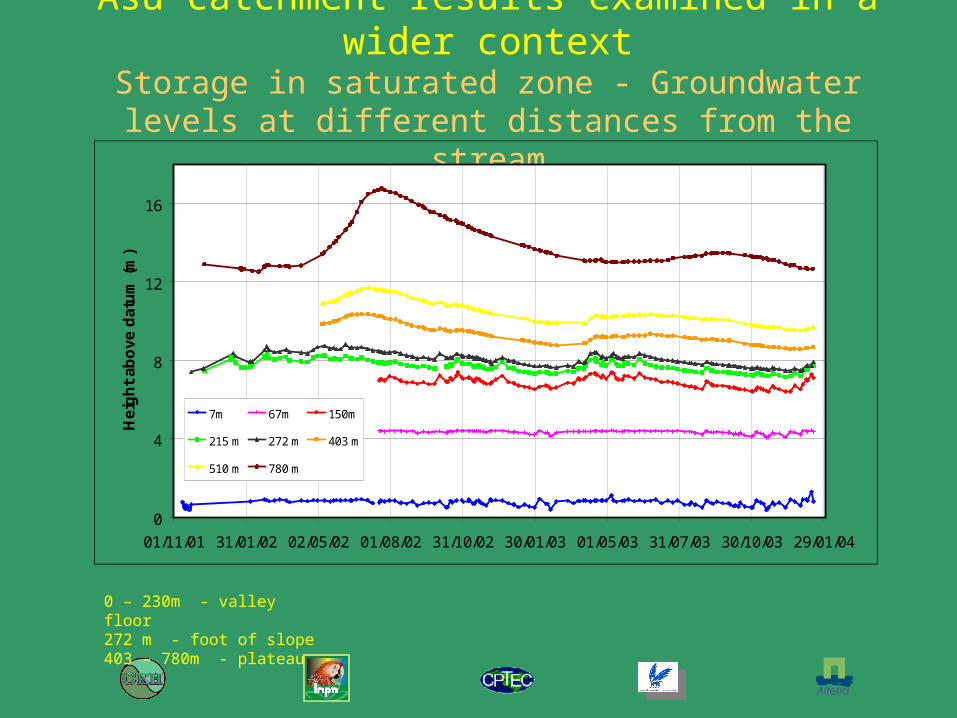
Asu catchment results examined in a wider contextStorage in saturated zone - Groundwater levels at different
distances from the stream
0
4
8
12
16
01/11/01 31/01/02 02/05/02 01/08/02 31/10/02 30/01/03 01/05/03 31/07/03 30/10/03 29/01/04
He
igh
t ab
ove
dat
um
(m
)
7m 67m 150m
215 m 272 m 403 m
510 m 780 m
0 – 230m - valley floor272 m - foot of slope403 – 780m - plateau
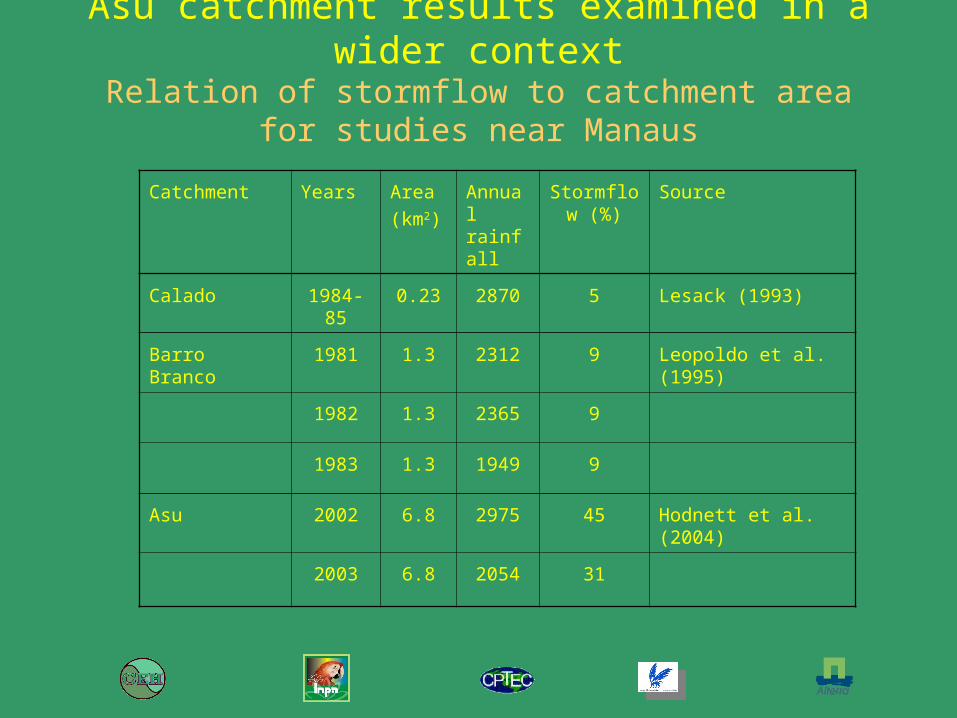
Asu catchment results examined in a wider contextRelation of stormflow to catchment area for studies near
Manaus
Catchment Years Area(km2)
Annual rainfall
Stormflow (%)
Source
Calado 1984-85
0.23 2870 5 Lesack (1993)
Barro Branco 1981 1.3 2312 9 Leopoldo et al.(1995)
1982 1.3 2365 9
1983 1.3 1949 9
Asu 2002 6.8 2975 45 Hodnett et al. (2004)
2003 6.8 2054 31
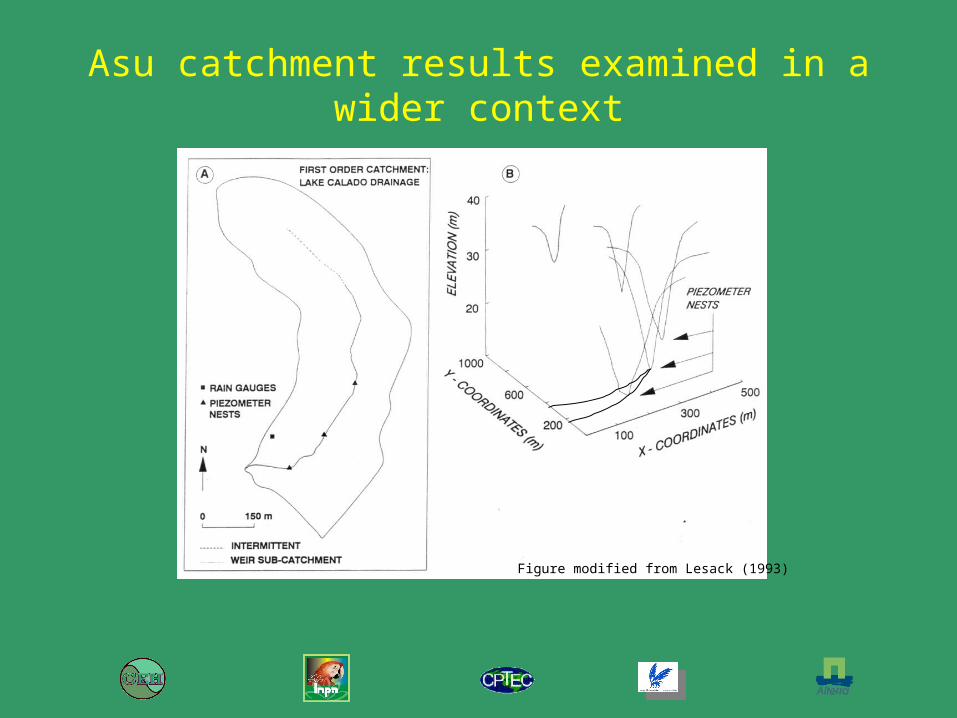
Asu catchment results examined in a wider context
Figure modified from Lesack (1993)
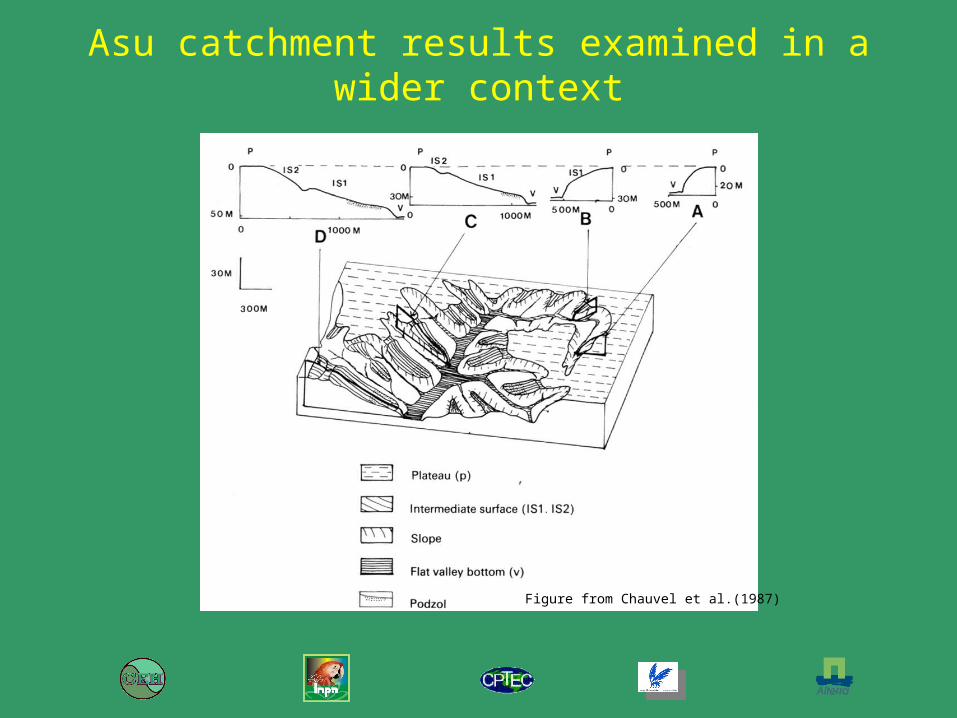
Asu catchment results examined in a wider context
Figure from Chauvel et al.(1987)
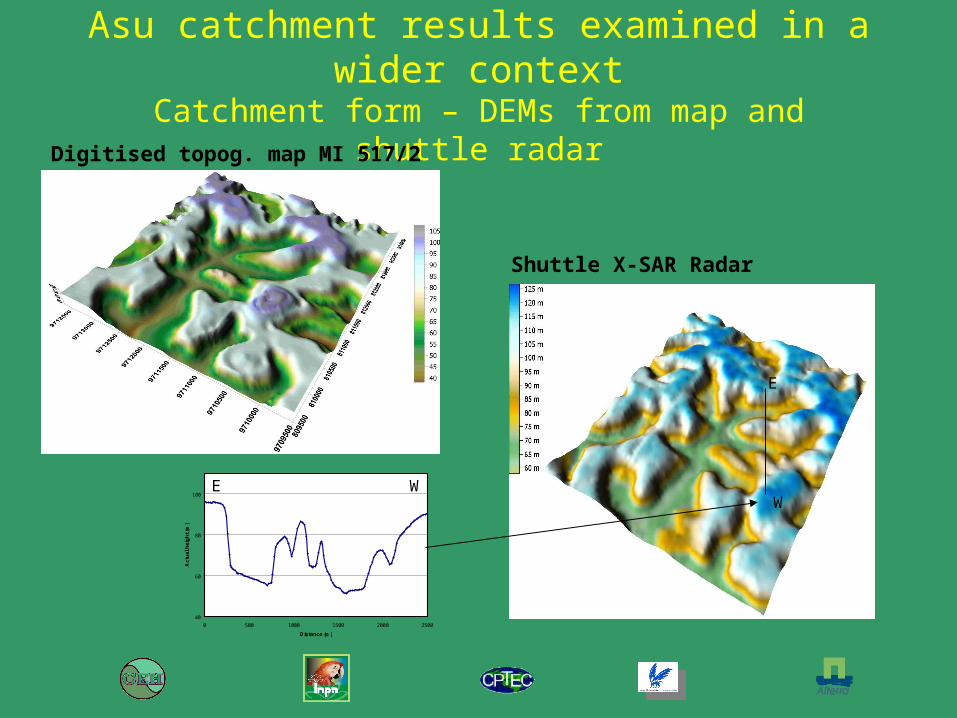
Asu catchment results examined in a wider contextCatchment form – DEMs from map and shuttle radar
Shuttle X-SAR Radar
Digitised topog. map MI 517/2
E
W
40
60
80
100
0 500 1000 1500 2000 2500
Distance (m)
Act
ual
hei
gh
t (m
)
E W
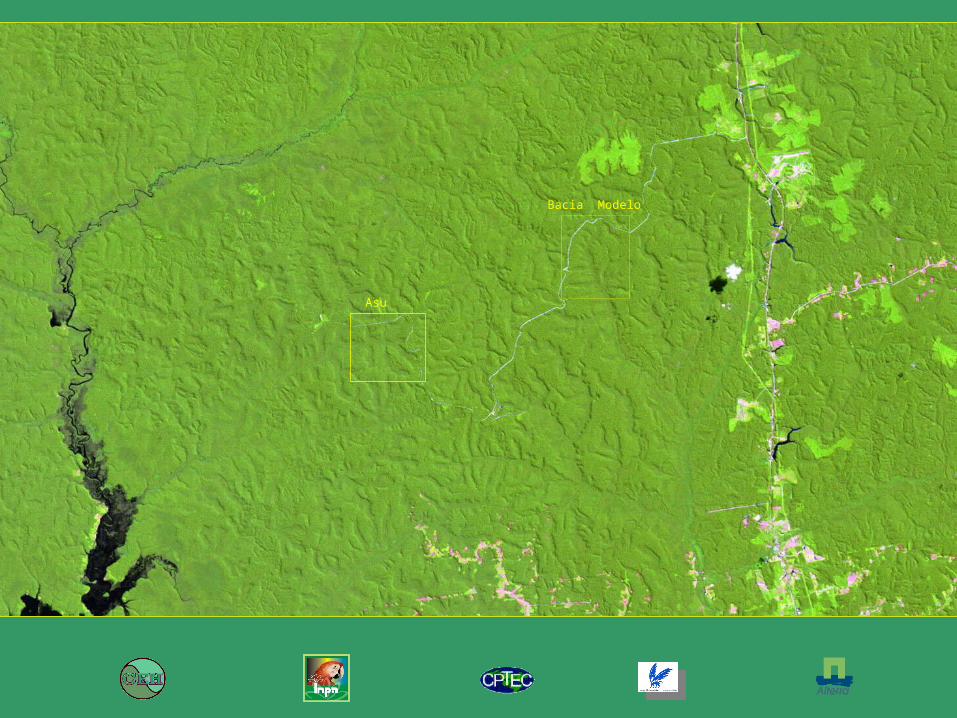
Asu
Bacia Modelo
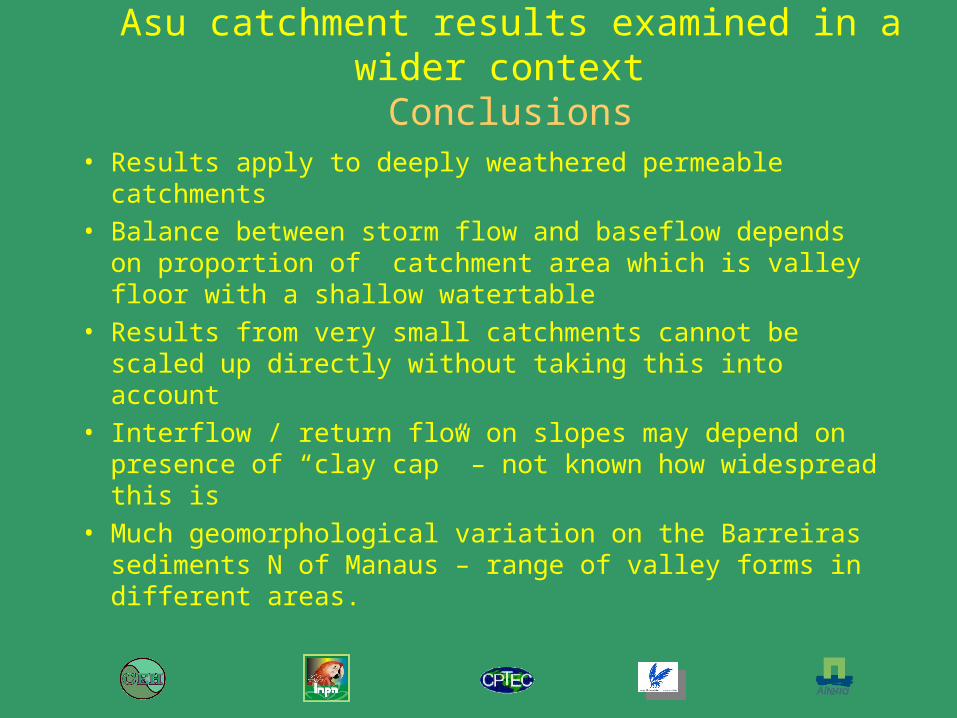
Asu catchment results examined in a wider context Conclusions
• Results apply to deeply weathered permeable catchments
• Balance between storm flow and baseflow depends on proportion of catchment area which is valley floor with a shallow watertable
• Results from very small catchments cannot be scaled up directly without taking this into account
• Interflow / return flow on slopes may depend on presence of “clay cap” – not known how widespread this is
• Much geomorphological variation on the Barreiras sediments N of Manaus – range of valley forms in different areas.
Asu catchment results examined in a wider contextResults continued
• In areas with a shallow depth of weathering:
– much less storage
– less baseflow (quantity and duration)
– soil / weathered zone may fill to the surface creating very large contributing areas