Long Range Financial Outlook Presentation
31
The Florida Legislature Office of Economic and Demographic Research 850.487.1402 http://edr.state.fl.us Presented by: Florida: Long-Range Financial Outlook September 12, 2012
Transcript of Long Range Financial Outlook Presentation

The Florida Legislature
Office of Economic and
Demographic Research
850.487.1402
http://edr.state.fl.us
Presented by:
Florida: Long-Range Financial Outlook
September 12, 2012

Economy Remained Positive in 2011
In 2011, Florida‘s economic growth remained in positive territory for the second year after declining two years in a row. State Gross Domestic Product (GDP) ranked us 37th in the nation in real growth with a gain of 0.5%. While the state‘s ranking improved, the growth slowed from a downwardly revised 0.9% for 2010.
1

FL Personal Income Grows in Q1:2012
Florida‘s personal income grew 0.7 percent in the first quarter of 2012, ranking the state 38th in the
country with respect to state growth. This was only slightly behind Texas which was ranked 36th. The
national average was 0.8 percent. Health Care and Social Assistance and Professional, Scientific and
Technical Services were the strongest industry contributors to the state‘s growth. Compared to the US
as a whole, Construction continues to be a drag.
2

Current Employment Conditions
July Nonfarm Jobs (YOY)
US 1.4%
FL 1.0%
YR: 69,900 jobs
Peak: -743,400 jobs
July Unemployment Rate
US 8.3%
FL 8.8%
(816,000 people) Eleven states had a higher
unemployment rate than Florida.
Highest Monthly Rate
January & February 2010
11.4%
20 of Florida‘s 67
counties had
double-digit
unemployment rates;
at the highest, this
number was 52
3

Labor Force Reduction Accounts for Most of Rate Drop
July 2012:
Labor Force: 9,269,459
Peaked December 2011: 9,303,297
Participation Rate: 60.0
Lowest Since February 1986: 59.9
25-Year Average: 62.5
4

Population Growth Recovering
Population growth is the state‘s primary engine of economic growth,
fueling both employment and income growth.
Population growth is forecast to continue strengthening, showing
increasing rates of growth over the next few years. In the near-term,
growth is expected to average 1.2% between 2012 and 2015 – and then
continue its recovery in the future, averaging 1.4% between 2020 and
2025. Most of Florida‘s population growth through 2030 will be from net
migration (85%). Nationally, average annual growth will be about 0.9%
between 2012 and 2030.
The future will be different than the past; Florida‘s long-term growth rate
between 1970 and 1995 was over 3%.
Florida is on track to break the 20 million mark during 2016, becoming
the third most populous state sometime before then – surpassing New
York.
5

Population Growth by Age Group
Between 2010 and 2030, Florida‘s population is forecast to grow by almost 4.8
million.
Florida‘s older population (age 60 and older) will account for most of Florida‘s population growth, representing 56.6 percent of the gains. Population aged 65 and over is forecast to represent 24.1 percent of the population in 2030.
Florida‘s younger population (age 0-17) will account for 14.8 percent of the gains.
April 1, 2010 to April 1, 2030
6

Florida Housing is Generally Improving
Building permit activity, an indicator of new construction, is back in positive territory,
showing strong year-over-year growth for the first six months of the calendar year.
7

Data from RealtyTrac
Foreclosure Filings Remain Daunting
―Optimists point to declining home inventories in relation to sales, but they are looking at an illusion. Those
supposed inventories do not include about 5m housing units with delinquent mortgages or those in
foreclosure, which will soon be added to the pile. Nor do they include approximately 3m housing units that
stand vacant – foreclosed upon but not yet listed for sale, or vacant homes that owners have pulled off the
market because they can‘t get a decent price for them.‖ Financial Times
Foreclosure Process (once begun)
• 861 Days – 2.5 yrs – in Florida
(3rd Longest Period in Nation)
• National Average – 378 days
• At the beginning of 2007, FL was at
169 days or less than 6 months.
July 2012, compared to US: • Florida foreclosure activity increased
20% from one year ago.
• 2nd Highest # of Filings
• 3rd Highest Foreclosure Rate
• Among US Metro Area rates:
Palm Bay-Melbourne-Titusville #5
Five other areas were in the top 20
8

Foreclosures & Shadow Inventory
Slightly less than half of all residential loans in Florida are for homes that are underwater. (LPS Data for April and May)
9

Credit Conditions Remain Tight
July 2012 Senior Loan Officer Opinion Survey on Bank Lending Practices (Federal Reserve Board)
Question to Senior Loan Officers:
Over the past three months, how have your bank's credit standards for approving applications
from individuals for prime residential mortgage loans to purchase homes changed?
All Respondents
July ‗12 % Apr ‘12 % Jan ‘12 % Oct ‗11 % July ‘11 % Apr ‘11 % Jan ‗11 % Oct ‗10 % July ‗10 %
Tightened
considerably 1.6% 0.0 0.0 0.0 0.0 0.0 0.0 0.0 0.0
Tightened somewhat 1.6% 5.6 0.0 4.2 5.7 3.8 3.7 13.0 3.6
Remained basically
unchanged 93.4 90.7 94.3 91.7 86.8 92.5 94.4 83.3 87.3
Eased somewhat 3.3 3.7 5.7 4.2 7.5 2.0 1.9 3.7 9.1
Eased considerably 0.0 0.0 0.0 0.0 0.0 0.0 0.0 0.0 0.0
Total 100.0 100.0 100.0 100.0 100.0 100.0 100.0 100.0 100.0
Banks reported that they were less likely than in 2006, to varying degrees, to originate mortgages to any
borrowers apart from those with the strongest credit profiles. Downpayments of 20% also a strong requirement.
10

Perceptions Recover After 8/2011 Dive
Consumer sentiment can be a leading indicator of recession, but not always: nationally, it had been improving, but fell in August 2011 to near the lowest level of the Great Recession and not far from the lowest level ever posted. The index reading is now back to the levels expected before the August dive (72.3 in July).
Florida‘s consumer confidence (July: 76) is roughly mirroring the national trend.
50
60
70
80
90
100
110
120 19
78-
01-
01
197
8-0
9-0
1 19
79-
05-
01
198
0-0
1-0
1 19
80-
09-
01
198
1-0
5-0
1 19
82-
01-
01
198
2-0
9-0
1 19
83-
05-
01
198
4-0
1-0
1 19
84-
09-
01
198
5-0
5-0
1 19
86-
01-
01
198
6-0
9-0
1 19
87-
05-
01
198
8-0
1-0
1 19
88-
09-
01
198
9-0
5-0
1 19
90-
01-
01
199
0-0
9-0
1 19
91-
05-
01
199
2-0
1-0
1 19
92-
09-
01
199
3-0
5-0
1 19
94-
01-
01
199
4-0
9-0
1 19
95-
05-
01
199
6-0
1-0
1 19
96-
09-
01
199
7-0
5-0
1 19
98-
01-
01
199
8-0
9-0
1 19
99-
05-
01
200
0-0
1-0
1 20
00-
09-
01
200
1-0
5-0
1 20
02-
01-
01
200
2-0
9-0
1 20
03-
05-
01
200
4-0
1-0
1 20
04-
09-
01
200
5-0
5-0
1 20
06-
01-
01
200
6-0
9-0
1 20
07-
05-
01
200
8-0
1-0
1 20
08-
09-
01
200
9-0
5-0
1 20
10-
01-
01
201
0-0
9-0
1 20
11-
05-
01
201
2-0
1-0
1
University of Michigan: Consumer Sentiment (UMSCENT)
11

Economy Slowly Recovering
Florida growth rates are gradually returning to more typical levels.
But, drags are more persistent than past events, and it will take a
few more years to climb completely out of the hole left by the
recession. Overall...
The national economy is still in recovery. While most areas of
commercial and consumer credit are strengthening – residential credit
still remains sluggish and difficult for consumers to access. So far, the
recovery has been roughly half as strong as the average gain of 9.8%
over the same period during the past seven recoveries.
The subsequent turnaround in Florida housing will be led by:
Low home prices that begin to attract buyers and clear the inventory.
Long-run sustainable demand caused by continued population growth
and household formation.
Florida‘s unique demographics and the aging of the baby-boom
generation (2011 marks the first wave of boomers hitting retirement).
12

The Problem for FY 2012-13 Closing the Budget Gap for 2012-13Comparing to 2011 Long-Range Financial Outlook (LRFO)NOTE: Component parts may not sum to the total due to rounding.
Pre-Session... REC N/R TOTAL
Funds Available - LRFO 2011 25271.5 1545.5 26817.0
2012-13 Base Budget + Annualizations 22784.3 0.0 22784.3
Critical Needs - LRFO 2011 1623.9 33.5 1657.4
Other High Priorities - LRFO 2011 625.1 261.8 886.9
Transfer to Budget Stabilization Fund 0.0 214.5 214.5
Planned Reserve (Unallocated General Revenue) 0.0 1000.0 1000.0
ORIGINAL BUDGET GAP - LRFO 2011 238.2 35.6 273.8
Changes to 2011-12 Revenue and Funds Available 0.0 -406.6 -406.6
Changes to 2011-12 Budget and Projected Deficits 0.0 63.0 63.0
Conference Adjustments to 2012-13 Revenue -964.2 9.4 -954.8
Conference Adjustments to 2012-13 Expenditures 45.3 0.0 45.3
ADJUSTED BUDGET GAP - OCTOBER 2011 -771.3 -424.6 -1195.9
Changes to 2011-12 Revenue and Funds Available 0.0 46.0 46.0
Changes to 2011-12 Budget and Projected Deficits 0.0 2.4 2.4
Conference Adjustments to 2012-13 Revenue -54.7 34.8 -19.9
Conference Adjustments to 2012-13 Expenditures -163.0 0.0 -163.0
FINAL BUDGET GAP - January 2012 -663.0 -346.1 -1009.1
J
a
n
2
0
1
2
O
c
t
2
0
1
1
(millions)
L
R
F
O
2
0
1
1
13

Deployed Strategies for FY 2012-13
Session 2012 Actions to Close Gap...
REC N/R TOTAL
Changes to 2011-12 Carry Forward (including deficits) 0.0 -212.4 -212.4
Final Measures Affecting Revenue -148.4 241.6 93.2
SB 1998 Transfer from STTF to GR 0.0 200.0 200.0
Transfers from Trust Funds 0.0 556.0 556.0
Adjustments to LFRO Funds Available -148.4 785.3 636.9
Improved General Revenue---Percent of Final Adjustments 63.1%
Final Effective Appropriations Plus Final Reserve 24560.5 1492.7 26053.2
Estimated Expenditures from LRFO Plus All Adjustments 24915.6 1509.8 26425.4
Adjustments to LRFO Estimated Expenditures & Reserve -355.1 -17.1 -372.2
Reduced Expenditures---Percent of Final Adjustments 36.9%
FINAL Adjustments 206.7 802.4 1009.1
NOTE: Final General Revenue Reserve Balance (millions) 1120.4
R
e
v
e
n
u
e
s
B
u
d
g
e
t
(millions)
14

GR Unallocated & Other Reserves
The final General Revenue reserve balance has since increased by $457.3 million, largely
from greater than expected 2011-12 revenue collections. The balance is now projected to
be $1,577.7 million for the fiscal year. Combined with the $708.1 million in the Budget
Stabilization Fund and approximately $426.1 million that is available in the Lawton Chiles
Endowment Fund, the total across all sources that are traditionally mentioned as reserves is
$2,711.9 million or 10.5 percent of General Revenue collections for Fiscal Year 2012-13.
15

Impact of Prior Year’s Actions...
Legislative actions during the 2011 and 2012 Sessions to
close the projected budget gap through recurring means
positively impacted the state‘s bottom line in subsequent
years.
In this regard, total estimated expenditures for future years
were constrained by the amount of recurring expenditure
reductions taken in Fiscal Year 2011-12 and 2012-13.
This has greatly improved the Long-Range Financial
Outlook‘s bottom line.
16

GR Outlook Balance for FY 2012-13
A projected remaining balance of $1.55 billion in nonrecurring
dollars is assumed to be available for use in FY 2013-14.
REVENUES REC N/R TOTAL
2012-13 Ending Balance on Post-Session Outlook -456.3 1576.7 1120.4
-PLUS- Revenue Surplus from 2011-12 0.0 397.8 397.8
-PLUS- Post-Session Adj & Forecast Changes 47.2 12.3 59.5
BALANCE ON CURRENT OFFICIAL OUTLOOK -409.1 1986.8 1577.7
ADJUSTMENTS
-MINUS- Reserve for Projected VPK Deficit 0.0 -1.9 -1.9
-MINUS- Reserve for Projected TANF Deficit 0.0 -16.5 -16.5
-MINUS- Reserve for Unfunded Match (TS Debby) 0.0 -9.1 -9.1
ADJUSTMENTS TOTAL 0.0 -27.5 -27.5
BALANCE FOR LONG-RANGE FINANCIAL OUTLOOK 1550.2
17

General Revenue Forecast
Fiscal Year
Post-Session
Forecast
August
Forecast
Difference
(Aug - PS)
Incremental
Growth Growth
2005-06 27074.8 8.4%
2006-07 26404.1 #REF! -670.7 -2.5%
2007-08 24112.1 #REF! -2292.0 -8.7%
2008-09 21025.6 21025.6 0.0 -3086.5 -12.8%
2009-10 21523.1 21523.1 #REF! 497.5 2.4%
2010-11 22551.6 22551.6 0.0 1028.5 4.8%
2011-12 23211.7 23618.8 407.1 1067.2 4.7%
2012-13 24600.1 24631.6 31.5 1012.8 4.3%
2013-14 25878.0 25872.7 (5.3) 1241.1 5.0%
2014-15 27328.2 27141.4 (186.8) 1268.7 4.9%
2015-16 28601.0 28394.0 (207.0) 1252.6 4.6%
*The Post-Session forecast simply updated the January 2012 forecast for M easures Affecting Revenue.
LR Growth:
Averages 6%
18

Debt Analysis
Total state debt outstanding at June 30, 2011 was $27.7 billion. Net tax-supported debt totaled $23.0 billion for
programs supported by State tax revenues or tax-like revenues. Based on existing borrowing plans, total State debt
outstanding is expected to continue to slowly decline as annual debt retirement increases and new debt issuance
decreases.
During the Outlook period, debt service payments will total about $2.1 billion per year.
Highest Level Credit Ratings: Fitch ―AAA‖ with negative outlook (unchanged); Moody‘s ―Aa1‖ with stable outlook
(unchanged); Standard and Poor‘s ―AAA‖ with stable outlook (unchanged).
7% Max Cap
6% Target
2.00%
3.00%
4.00%
5.00%
6.00%
7.00%
8.00%
2001 2002 2003 2004 2005 2006 2007 2008 2009 2010 2011 2012 2013 2014 2015 2016
Historical and Projected Benchmark Debt Ratio
January 2012 Update 6% Target 7% Cap
2011 Ratio of 7.46%
Fiscal Year 2012 2013 2014 2015 2016
Debt Service as % of Revenue 7.34% 7.06% 5.89% 5.91% 5.86%
Projected Benchmark Debt Ratio
19
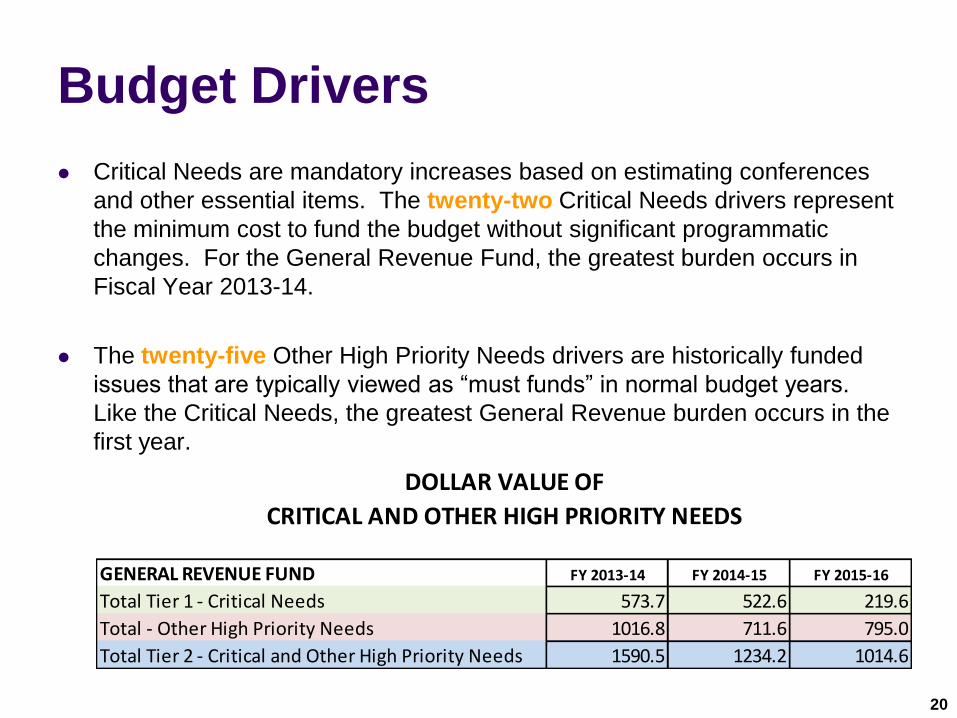
Budget Drivers
Critical Needs are mandatory increases based on estimating conferences
and other essential items. The twenty-two Critical Needs drivers represent
the minimum cost to fund the budget without significant programmatic
changes. For the General Revenue Fund, the greatest burden occurs in
Fiscal Year 2013-14.
The twenty-five Other High Priority Needs drivers are historically funded
issues that are typically viewed as ―must funds‖ in normal budget years.
Like the Critical Needs, the greatest General Revenue burden occurs in the
first year.
GENERAL REVENUE FUND FY 2013-14 FY 2014-15 FY 2015-16
Total Tier 1 - Critical Needs 573.7 522.6 219.6
Total - Other High Priority Needs 1016.8 711.6 795.0
Total Tier 2 - Critical and Other High Priority Needs 1590.5 1234.2 1014.6
DOLLAR VALUE OF
CRITICAL AND OTHER HIGH PRIORITY NEEDS
20

GR Drivers by Policy Area
POLICY AREAS FY 2013-14 FY 2014-15 FY 2015-16
Pre K-12 Education 158.2 79.5 4.2
Higher Education 45.9 117.0 97.8
Human Services 461.8 568.2 476.5
Criminal Justice 69.9 6.5 11.5
Judicial Branch 1.3 1.3 5.1
Transportation & Economic Development 157.1 144.5 142.7
Natural Resources 110.1 114.3 110.8
General Government 45.0 36.0 31.5
Administered Funds - Statewide Issues 541.2 166.9 134.5
Total New Issues 1,590.5 1,234.2 1,014.6
21

Three-Year Outlook Period
Another method of analyzing
the projected expenditures for
Critical and Other High Priority
Needs is to look at the
percentage of the total
represented by each policy
area. Like last year, only two
policy areas have double-digit
percentages of the total in all
three years of the Outlook: the
Human Services policy area
and the Administered Funds –
Statewide Issues area. These
areas are staying steady in
terms of their future need for
new driver dollars.
22

Most Significant Drivers
The Medicaid Program driver is the single largest Critical Needs driver
in all three years of the Outlook. Broadening the scope to look across
all drivers, it represents 18.0 percent, 29.3 percent and 26.5 percent of
total Critical and Other High Priority Needs, respectively. However,
when Other High Priority Needs drivers are included, the Unfunded
Actuarial Liability Driver becomes the single largest driver in Fiscal Year
2013-14—and the 2015-16 FEFP Workload and Enrollment driver in
Other High Priority Needs is virtually equal to the Medicaid Driver.
General Revenue Drivers (millions) FY 2013-14 FY 2014-15 FY 2015-16
Medicaid Program Driver (Tier 1) 287.0 362.2 269.2
Percentage of Total Needs 18.0% 29.3% 26.5%
Unfunded Actuarial Liability Driver (Tier 2) 447.7
FEFP Workload and Enrollment Driver (Tier 2) 271.7
23

Putting It Together for the First Year
Combined, recurring and nonrecurring General Revenue program needs – with
a minimum reserve of $1 billion – are less than the available General Revenue
dollars, meaning there is no budget gap for Fiscal Year 2013-14. Anticipated
expenditures (including the reserve) can be fully funded. The budget will be in
balance as constitutionally required.
RECURRING
NON-
RECURRING TOTAL
AVAIL GR $25,563.8 $1,953.9 $27,517.7
Base Budget $24,623.2 $0.0 $24,623.2
Transfer to Lawton Chiles Endowment Fund $0.0 $18.2 $18.2
Transfer to Budget Stabilization Fund $0.0 $214.5 $214.5
Critical Needs $484.6 $89.1 $573.7
High Priority $696.5 $320.3 $1,016.8
Reserve $0.0 $1,000.0 $1,000.0
TOTAL $25,804.3 $1,642.1 $27,446.4
BALANCE ($240.5) $311.8 $71.3
OUTLOOK PROJECTION – FISCAL YEAR 2013-14 (in millions)
24

The Bottom Line...
Fiscal Years 2013-14, 2014-15 and 2015-16 all show projected
budget needs within the available revenue for Critical and Other
High Priority Needs, including the set-aside of a $1 billion reserve
in each year.
No Fiscal Strategies are required for any year in the Outlook
period, since there is no budget gap during the period, the
anticipated reserve is fully funded, and the budget is growing more
slowly than available revenues.
For the second time since the adoption of the constitutional
amendment requiring the development of Long-Range Financial
Outlooks, sufficient funds exist to meet all Critical and Other
High Priority Needs identified for the three years contained in the
Outlook.
25

Provision
Existing Medicaid Program
Currently Eligible, But Not Enrolled Indeterminate; Federal Health Care Reform Section: Risk
Primary Care Practitioner Rate Increase
*Mandatory (CY 2013 and 2014) Critical Needs Driver #9
*Continue Rate Increase (CY 2015 and 2016) Other High Priority Needs Driver #31
Optional Medicaid Program (Expansion)
Medicaid Program with Kidcare Offset Federal Health Care Reform Section: Discussion
Primary Care Practitioner Rate Increase Federal Health Care Reform Section: Discussion
State Group Health Insurance Program
OPS and Opt-Out Inclusion; Fees Critical Needs Driver #22
Miscellaneous
Exchange Creation Federal Health Care Reform Section: Risk
Technology: Eligibility Determination System Federal Health Care Reform Section: Risk
Long-Range Financial Outlook Location
Critical Needs Driver #9
GR Trust
2013-14 0.0 849.7
2014-15 0.0 424.8
2015-16 0.0 0.0
Other High Priority Needs Driver #31
GR Trust
2013-14 0.0 0.0
2014-15 173.8 251.0
2015-16 171.4 504.5
Critical Needs Driver #22
GR Trust
2013-14 31.9 15.7
2014-15 48.8 28.2
2015-16 11.6 7.0
Supreme Court Decision
Impact on Medicaid
26

Risk
The positive budget outlook is heavily reliant on the projected balance forward levels being
available, the $1 billion reserve not being used, and future growth levels for General
Revenue being retained. A budget gap in Year 1 will occur if there is any change of more
than $71.3 million to the:
1. 2012-13 projected balance of $1,550.2 (from an emergency or a forecast reduction), or
2. Revenue forecast for 2013-14.
An unanticipated reduction in the forecast for General Revenue or emergency
expenditures related to a disaster could both produce this result. Similarly, if a reduction
occurred of more than $53.5 million in Fiscal Year 2014-15 or more than $594.0 million in
Fiscal Year 2015-16, budget gaps would develop which would also affect the subsequent
years.
27

Black Swans
―Black Swans‖ are low probability, high impact events:
Severe Natural Disasters
2004 and 2005 Hurricane Seasons
Budget Stabilization Fund balance is $274 million.
A complete financial collapse in the Eurozone, leading to a
further slowing of the US economy.
Congressional inability to reach an agreement that heads off the
―Fiscal Cliff,‖ triggering a new recession in the United States.
28

Eurozone Problems Still Persist The sovereign debt crisis in the Eurozone has led to banking instability with
spillover effects on the global credit market: threats of even greater problems have reignited. Spain, Portugal and Italy all still face major challenges and contracting economies.
Italy may soon be looking for a bailout. Moody‘s has cut Italy‘s bond rating by two notches to Baa2, leaving it just two grades above junk status, citing increased risks of higher borrowing costs in part due to contagion from Spain and a possible Greek exit from the euro. Moody‘s compares economic conditions in Greece to the Great Depression in the US during the 1930s.
Greece is now seeking a two-year extension of its latest austerity program in order to ease the severity of the required cuts—and Global Insight is still predicting a Greece exit from the Eurozone (65% probability) by the middle of next year.
Efforts to bailout Spain and to begin recapitalizing Spain‘s banks are underway with other Eurozone leaders, the International Monetary Fund, and the European Central Bank. These steps are being taken to head off a potential liquidity squeeze arising from recent credit downgrades.
The latest data shows that the Eurozone as a whole contracted by 0.2% during the second quarter of this calendar year, with the economies of Greece, Italy, Spain and Finland displaying the sharpest contractions. The latest data indicate that the Eurozone is at strong risk for another prolonged recession.
These conditions are negatively affecting the United States: Tighter credit conditions already exist, especially for businesses with foreign interests.
Reduced exports and corporate earnings already exist. The Greater Miami area is experiencing a significant reduction in exports to Spain (Florida exports to Spain fell nearly 30% last year).
29

“Fiscal Cliff” in January 2013 Given the strong public—and economic—reaction to the turmoil in August 2011, it
is unlikely that the looming US ―fiscal cliff‖ in January will pass unnoticed. Caused
by the intersection of three major deadlines and a potential debt showdown, the
brunt of the ―fiscal cliff‖ will remain largely unknown until after the November
elections. Both the Congressional Budget Office and the International Monetary
Fund project that, if left intact, the collective impact of these events would be to
throw the United States back into a recession.
Automatic Sequester provisions will kick in January 1, 2013—George Mason University estimated that Florida would lose 41,905 jobs and sustain $3.6 billion in economic losses from the defense cuts.
Key stimulus provisions will expire—This cluster (including the 2% cut in the employee‘s portion of payroll taxes, emergency unemployment insurance benefits, and the 50% bonus depreciation) expires at the end of the 2012 calendar year.
Bush-era tax cuts started in 2001 and 2003 will expire at the end of the 2012 calendar year—This cluster includes the estate and gift tax provisions (a return to the 2001 parameters of a $1 million exemption and a 55 percent top rate), changes to the child tax credit (cut in half and no longer refundable), and the end of the current schedule for marginal tax rates (elimination of the 10% tax bracket, plus the top rate will rise from 35 percent to 39.6 percent and other rates will rise in a similar manner).
Statutory debt ceiling reached—The debt ceiling, currently set at $16.4 trillion with the ability to create an additional $200 billion in capacity under the limit, will be hit and need to be raised sometime in January or February.
30