The Economic Implications of the Long-Term Federal Budget Outlook, January 3, 2011

CH A P T E R
CBO
2The Long-Term Outlook for
Major Federal Health Care Programs
A lthough spending for health care in the United States has grown more slowly in recent years than it did previously, high and rising amounts of such spending continue to pose a challenge not only for the federal gov-ernment but also for state and local governments, busi-nesses, and households. Total national spending on health care services and supplies—that is, by all people and entities in the United States, governmental and nongovernmental—increased from 4.6 percent of gross domestic product (GDP) in calendar year 1960 to 9.5 percent in 1985 and to 16.4 percent, about one-sixth of the economy, in 2013, the most recent year for which such data are available.1 Federal spending for Medicare (net of certain receipts, termed offsetting receipts, which mostly consist of premiums paid by beneficiaries) and Medicaid rose from 2.0 percent of GDP in 1985 to 4.7 percent in 2014.2
Underlying those trends is the fact that health care spend-ing per person has grown faster, on average, than the nation’s economic output per capita during the past few decades. The Congressional Budget Office estimates that growth in health care spending per person outpaced growth in potential (or maximum sustainable) GDP per capita by an average of 1.4 percent per year between cal-endar years 1985 and 2013.3 Key factors contributing to that faster growth were the emergence and increasing use
of new medical technologies, rising personal income, and the declining share of health care costs that people paid out of pocket. Those factors were partly offset by other influences, including the spread of managed care plans in the 1990s, the 2007–2009 recession, and various legislated changes in Medicare’s payment policies.
The future growth of health care spending by the federal government will depend on many factors, including demographic changes and the behavior of households, businesses, and state and local governments. (It will also depend on federal law, but CBO’s extended baseline pro-jections, which focus on the 25-year period ending in 2040, are generally based on the assumption that current law will not change.) CBO’s extended baseline projec-tions of federal health care spending match its 10-year baseline projections as adjusted to reflect recently enacted legislation for the next 10 years but employ a formulaic approach beyond that period, reflecting the considerable uncertainties about the evolution of the health care deliv-ery and financing systems in the long run.4 Specifically, CBO has projected federal spending after 2025 by
1. Centers for Medicare & Medicaid Services, National Health Expenditure Accounts, “NHE Tables” (accessed April 3, 2015), http://go.usa.gov/jmGY.
2. In this chapter, net federal spending for Medicare refers to gross spending for Medicare minus offsetting receipts, which are recorded in the budget as offsets to spending. When this chapter refers to net federal spending for all major federal health care programs, it means gross spending for all those programs minus offsetting receipts for Medicare.
3. As this chapter explains later, CBO derived that estimate after adjusting for demographic changes and giving greater weight to more recent years (in order to more closely reflect current trends in spending for health care).
4. The 10-year baseline referred to in this chapter is the one issued in March 2015, but adjusted to reflect legislation that was enacted after it was prepared. For the March baseline, see Congressional Budget Office, Updated Budget Projections: 2015 to 2025 (March 2015), www.cbo.gov/publication/49973. The most important adjustment to that baseline was the incorporation of the estimated effect of Public Law 114-10, the Medicare Access and CHIP Reauthorization Act of 2015, which became law on April 16, 2015. See Congressional Budget Office, cost estimate for H.R. 2, the Medicare Access and CHIP Reauthorization Act of 2015 (March 25, 2015), www.cbo.gov/publication/50053.

28 THE 2015 LONG-TERM BUDGET OUTLOOK JUNE 2015
CBO
combining estimates of the number of people who will receive benefits from government health care programs with fairly mechanical estimates of the growth of spending per beneficiary:
Under current law, the first of those factors—the number of people receiving benefits from government programs—is projected to increase during the next few decades. That increase can be attributed to two main causes. The first is the aging of the population—in particular, of the large baby-boom generation—which will increase the number of people receiving benefits from Medicare by about one-third over the next decade. The second is the projected increase over the next few years in the number of people who will enroll in Medicaid or receive federal subsidies for health insurance purchased through exchanges under the provisions of the Affordable Care Act (ACA).
The second factor in CBO’s projections of federal spending, the growth of spending per beneficiary in most of the major health care programs, is projected to move slowly from the average rate projected for the years 2023 through 2025 (with certain adjustments) to what CBO considers its underlying growth rate.5 Each program’s underlying growth rate is essentially its long-term growth rate, which begins with the rate of growth in health care spending in recent decades and is projected to decline gradually—as people try to limit their spending for health care in order to maintain their consumption of other goods and services, and as state governments, private insurers, and employers respond to the pressures of rising health care costs.
On the basis of that formula, CBO expects that federal spending on the government’s major health care programs will continue to rise substantially relative to GDP. The major health care programs are Medicare, Medicaid, the Children’s Health Insurance Program (CHIP), and the subsidies for health insurance purchased through the exchanges.6 In CBO’s extended baseline, net federal spending for those programs grows from an estimated 5.2 percent of GDP in 2015 to 8.0 percent in 2040—of which 5.1 percentage points would be devoted to net spending on Medicare and 2.9 percentage points to
spending on Medicaid, CHIP, and the exchange subsidies.
Those estimates are subject to considerable uncertainty (as Chapter 7 explains). A particular challenge currently is assessing how much of the recent slowdown in the growth of health care spending can be attributed to tem-porary factors, such as the recession, and how much reflects more enduring developments. Studies have gener-ally concluded that part of the slowdown cannot be linked directly to the weak economy, although they differ considerably in their assessment of other factors’ impor-tance. CBO’s own analysis found no direct link between the recession and slower growth in Medicare spending.7 Accordingly, over the past several years, CBO has sub-stantially reduced its 10-year and long-term projections of spending per person for Medicare, for Medicaid, and for the country as a whole. However, the growth rates for spending per person are expected to rebound somewhat from their recent very low levels without returning all the way to the high levels seen in the past.
Overview of Major Government Health Care ProgramsA combination of private and public sources finances health care in the United States, mostly through various forms of health insurance. Most nonelderly Americans—
5. CBO followed that procedure for three of the four major health care programs but a different one for the Children’s Health Insurance Program.
6. Federal spending on those programs is mandatory; that is, it results from budget authority provided in laws other than appropriation acts. Federal discretionary spending on health care—that is, spending that is subject to annual appropriations—is included not in the budget projections described here but rather in those for other noninterest spending (see Chapter 4 and Table 1-1 on page 20). Such discretionary spending includes spending for health research and for health care provided by the Veterans Health Administration. Some mandatory spending on health care (for example, spending for care for federal retirees) is also included in other noninterest spending; that mandatory spending represents a very small share of the federal budget. The spending for exchange subsidies that is analyzed in this chapter includes outlays for cost-sharing subsidies and for the refundable portion of subsidies for premiums; however, the reduction in taxes paid because of the premium subsidies—which is projected to be much smaller than the increase in outlays for the refundable portion of the subsidies—is included not here but in the revenue projections in Chapter 5.
7. Michael Levine and Melinda Buntin, Why Has Growth in Spending for Fee-for-Service Medicare Slowed? Working Paper 2013-06 (Congressional Budget Office, August 2013), www.cbo.gov/publication/44513.

CHAPTER TWO THE 2015 LONG-TERM BUDGET OUTLOOK 29
CBO
Figure 2-1.
Distribution of Spending for Health Care, 2013Total health care spending amounted to $2.8 trillion in calendar year 2013. That total does not include the cost to the federal government of the tax exclusion for employment-based health insurance, which amounted to roughly $250 billion in 2013.
Source: Congressional Budget Office based on data from the Centers for Medicare & Medicaid Services.
Note: CHIP = Children’s Health Insurance Program.
a. Gross spending for Medicare refers to all of the program’s spending not counting offsetting receipts (from premium payments made by beneficiaries to the government and amounts paid by states from savings on Medicaid’s prescription drug costs) that are credited to the program.
b. Includes federal and state spending.
about 153 million of them in 2015, CBO and the staff of the Joint Committee on Taxation (JCT) estimate—have private health insurance obtained through an employer as their primary source of coverage. Many other people obtain insurance through government programs. In 2015, average monthly enrollment will be an estimated 55 million people in Medicare and an estimated 66 mil-lion in Medicaid.8 In addition, CBO and JCT estimate that, over the course of this calendar year, an average of about 11 million nonelderly people will be covered by health insurance purchased through exchanges run by the federal government or state governments (though the total number enrolled at any particular time during the year might be higher), and most of those people will receive tax subsidies from the federal government to help pay for that insurance.9 Another roughly 6 million people will be
covered by a policy purchased directly from an insurer—that is, not through an exchange. At any given time during this calendar year, according to CBO and JCT’s projections, about 35 million nonelderly people will be uninsured. Over the next few years, the number of people without insurance coverage is projected to decline.
In 2013, the most recent calendar year for which data are available, total spending for health care in the United States amounted to about $2.8 trillion (see Figure 2-1).10 Of that amount, 53 percent was financed privately; specifically, 35 percent consisted of payments by private health insurers, 12 percent was consumers’ out-of-pocket spending, and 6 percent came from other sources of
21% 17% 9% 35% 12% 6%
Medicarea Medicaid andCHIP
OtherGovernment
Spending
Payments byPrivate Health
Insurers
Consumers'Out-of-Pocket
Spending
Other
Public Spending: $1.3 Trillion, or 47 Percent Private Spending: $1.5 Trillion, or 53 Percent
Total Health Care Spending: $2.8 Trillion
$586 Billion $463 Billion $234 Billion $962 Billion $339 Billion $171Billion
b
8. Congressional Budget Office, “Medicare—Baseline Projections” (March 2015), www.cbo.gov/publication/44205, and “Medicaid—Baseline Projections” (March 2015), www.cbo.gov/publication/44204. Both estimates given have been adjusted to reflect recently enacted legislation. Also, some people have coverage from more than one source at a time. Currently, about 8.3 million people with Medicaid coverage are also covered by Medicare, which is their primary source of coverage. For information about people eligible for benefits through both programs, see Congressional Budget Office, Dual-Eligible Beneficiaries of Medicare and Medicaid: Characteristics, Health Care Spending, and Evolving Policies (June 2013), www.cbo.gov/publication/44308.
9. Congressional Budget Office, “Effects of the Affordable Care Act on Health Insurance Coverage—Baseline Projections” (March 2015), www.cbo.gov/publication/43900. The estimates given have been adjusted to reflect recently enacted legislation.
10. This report defines total spending for health care as the health consumption expenditures in the national health expenditure accounts maintained by the Centers for Medicare & Medicaid Services. That definition excludes spending on medical research, structures, and equipment. Under a broader definition that includes those categories, total national spending for health care was 17.4 percent of GDP in calendar year 2013. For more information, see Micah Hartman and others, “National Health Spending in 2013: Growth Slows, Remains in Step With the Overall Economy,” Health Affairs, vol. 34, no. 1 (January 2015), pp. 150–160, http://dx.doi.org/10.1377/hlthaff.2014.1107.

30 THE 2015 LONG-TERM BUDGET OUTLOOK JUNE 2015
CBO
private funds, such as philanthropy.11 The remaining 47 percent of total spending on health care was public: gross federal spending for Medicare, which made up 21 percent of the total; federal and state spending for Medicaid and CHIP, which accounted for 17 percent; and spending on various other programs (including those run by state and local governments’ health departments, by the Department of Veterans Affairs, and by the Department of Defense), which accounted for 9 percent.
A significant share of private health care spending is sub-sidized through provisions in the tax code—primarily through the tax exclusion for employment-based health insurance, which is not reflected in the reported totals for health care spending. Under that provision, most pay-ments that employers and employees make for health insurance coverage are exempt from payroll and income taxes. CBO estimates that in 2013, the federal cost, or tax expenditure, associated with that exclusion was roughly $250 billion, or 1.5 percent of GDP—a sum that was equal to nearly one-quarter of all spending on private health insurance and roughly equal to federal spending on Medicaid in that year.12 It is projected to equal 1.6 percent of GDP over the 2016–2025 period.13
MedicareIn 2015, according to CBO’s projections, Medicare will provide health insurance to about 55 million people who are elderly, are disabled, or have end-stage renal disease. The elderly make up about 85 percent of the enrollees; in general, people become eligible for Medicare when they reach 65, and disabled people become eligible 24 months
after they qualify for benefits under Social Security’s Disability Insurance program.14
The Medicare program provides a specified set of bene-fits. Hospital Insurance (HI), or Medicare Part A, covers inpatient services provided by hospitals, care in skilled nursing facilities, home health care, and hospice care. Part B mainly covers services provided by physicians, other practitioners, and hospitals’ outpatient depart-ments. Part D provides a prescription drug benefit. Most enrollees in Medicare are in the traditional fee-for-service program, in which the federal government pays for cov-ered services directly; but about 30 percent have opted for Part C of the program, known as Medicare Advantage, in which they get coverage for Medicare benefits through a private health insurance plan. In 2014, gross spending for Medicare was $600 billion, and net spending (that is, gross spending minus offsetting receipts, which mostly consist of beneficiaries’ payments of premiums) was $506 billion.
Parts A, B, and D of the program are financed in different ways. Outlays for Part A are financed by dedicated sources of income credited to a fund called the Hospital Insurance Trust Fund. Of those dedicated sources, the primary one is a payroll tax (amounting to 2.9 percent of all earnings), and the others are a 0.9 percent tax on earn-ings over $200,000 (or $250,000 for married couples) and a portion of the federal income taxes paid on Social Security benefits.15 For Part B, premiums paid by benefi-ciaries cover just over one-quarter of outlays, and the government’s general fund covers the rest. Enrollees’ pre-miums under Part D are set to cover about one-quarter of the cost of the basic prescription drug benefit (although many low-income enrollees pay no premiums), and the general fund covers most of the rest. Federal payments to private insurance plans under Part C comprise a blend of funds drawn from Parts A, B, and D. Altogether, in cal-endar year 2013, about 43 percent of gross federal spend-ing on Medicare was financed by the HI trust fund’s
11. For the purposes of that analysis, out-of-pocket payments include payments made to satisfy cost-sharing requirements for services covered by insurance, as well as payments for services not covered by insurance. However, they do not include the premiums that people pay for health insurance—because premiums fund the payments that insurers provide, which have already been accounted for.
12. The estimated federal cost includes the effects on revenues from both payroll and income taxes. The income tax portion is based on Joint Committee on Taxation, Estimates of Federal Tax Expenditures for Fiscal Years 2012–2017, JCS-1-13 (February 1, 2013), http://go.usa.gov/3PkZA. For more information about the tax exclusion, see Congressional Budget Office, The Distribution of Major Tax Expenditures in the Individual Income Tax System (May 2013), www.cbo.gov/publication/43768.
13. Congressional Budget Office, The Budget and Economic Outlook: 2015 to 2025 (January 2015), p. 103, www.cbo.gov/publication/49892.
14. People with amyotrophic lateral sclerosis (also known as Lou Gehrig’s disease) are an exception: They are eligible for Medicare in the month when their Disability Insurance benefits start.
15. The thresholds for the 0.9 percent tax are not indexed for inflation. Certain people are subject to an additional 3.8 percent tax on unearned income that is officially labeled a Medicare tax even though the revenues are credited to the government’s general fund rather than to the HI trust fund.

CHAPTER TWO THE 2015 LONG-TERM BUDGET OUTLOOK 31
CBO
dedicated income, about 13 percent came from beneficia-ries’ premiums, and about 41 percent came from the gen-eral fund; money from other sources financed the rest.16
In the fee-for-service portion of Medicare, beneficiaries’ cost-sharing obligations (that is, what they are obliged to pay out of pocket) vary widely by type of service, and the program does not set an annual limit on the health care costs for which beneficiaries are responsible. However, the great majority of beneficiaries—about 90 percent of them in 2010, according to one recent study—have sup-plemental insurance that covers many or all of the pro-gram’s cost-sharing requirements.17 The most common sources of supplemental coverage are plans for retirees offered by former employers, Medicare Advantage plans, individually purchased policies (called medigap insur-ance), and Medicaid.
A number of provisions of law constrain Medicare’s pay-ments to providers of health care. Most recently, the Medicare Access and CHIP Reauthorization Act of 2015 set the schedule of increases in Medicare’s payment rates for physicians’ services. Those increases will vary depend-ing on the year and certain other factors, but they will range between zero and 0.75 percent per year.18 That legislation also modified updates to payment rates for certain other services in some years.
The ACA also contains numerous provisions that, on balance, limit the growth of Medicare spending. The
provisions that will have the greatest effect impose perma-nent reductions on the annual updates to payment rates for many providers (other than physicians) in the fee-for-service portion of the program. Under those provisions, the updates equal the estimated percentage change in the average prices of providers’ inputs, such as labor and equipment, minus the 10-year moving average of growth in productivity in the economy overall. As a result, the providers will face pressure to match other businesses in their ability to use fewer inputs to produce a given amount of output. Other provisions of the ACA subtract specified fractions of a percentage point from the updates to payment rates for various services through 2019.
In addition, the ACA established the Independent Pay-ment Advisory Board (IPAB), which is required to sub-mit a proposal to reduce Medicare spending in certain years if the rate of growth in spending per enrollee is pro-jected to exceed specified targets.19 The proposal—or an alternative proposal submitted by the Secretary of Health and Human Services if the board does not submit a qual-ifying proposal—must achieve a specified amount of sav-ings in the year it is implemented while not increasing spending in the succeeding nine years by more than the amount of those first-year savings. The proposal would go into effect automatically unless blocked or replaced by subsequent legislation. In CBO’s baseline projections, the rate of growth of Medicare spending per beneficiary is below the target rate for each year through 2024 but exceeds it in 2025. As a result, CBO projects that the IPAB mechanism will reduce spending in 2025 by about $1 billion.20
Finally, the Budget Control Act of 2011, as amended, spec-ifies automatic procedures known as sequestration (that is, the cancellation of funding) that will reduce most Medi-care payments through September 2024 still further. Sequestration will reduce payment rates for most services
16. Those calculations are based on data from Boards of Trustees, Federal Hospital Insurance and Federal Supplementary Medical Insurance Trust Funds, 2014 Annual Report of the Boards of Trustees of the Federal Hospital Insurance and Federal Supplementary Medical Insurance Trust Funds (July 2014), Table II.B1, http://go.usa.gov/bUZm. The measures of benefits and premium receipts in that table treat Part D premiums for basic benefits that beneficiaries pay directly to plans as if those premiums were paid to Medicare and then disbursed to the plans.
17. Medicare Payment Advisory Commission, A Data Book: Health Care Spending and the Medicare Program (June 2014), p. 27, http://go.usa.gov/3D3DQ (PDF, 1.7 MB).
18. From October 1998 through March 2015, payment rates for services covered by the fee schedule for physicians were governed by the sustainable growth rate (SGR) mechanism. In practice, however, the Congress almost always overrode the SGR mechanism when it was about to reduce payment rates. In April 2015, legislation was enacted that replaced that mechanism. For more details, see Congressional Budget Office, cost estimate for H.R. 2, the Medicare Access and CHIP Reauthorization Act of 2015 (March 2015), www.cbo.gov/publication/50053.
19. From 2015 through 2019, the target growth rate is the average of inflation in the economy generally and inflation for medical services in particular; in subsequent years, the target growth rate is the percentage increase in per capita GDP plus 1 percentage point. The ACA prohibits the IPAB from proposing certain actions, such as modifying Medicare’s eligibility rules or reducing benefits.
20. Congressional Budget Office, “Medicare—Baseline Projections” (March 2015), Note f, www.cbo.gov/publication/44205. The estimate has since been updated to reflect recently enacted legislation, but it still stands at about $1 billion in 2025.

32 THE 2015 LONG-TERM BUDGET OUTLOOK JUNE 2015
CBO
by 2.0 percent through the first half of fiscal year 2023, by 2.9 percent for the second half of 2023, by 1.1 percent for the first half of 2024, and by 4.0 percent for the second half of 2024, according to CBO’s estimates. All told, CBO projects that sequestration will cancel about $150 billion of Medicare payments to providers and health insurance plans over the 2016–2025 period.
MedicaidA joint federal-state program, Medicaid pays for health care services, mostly for low-income people. About 83 million people will be enrolled in Medicaid at some point during 2015, CBO estimates, and the average monthly enrollment will be about 66 million.21 Cur-rently, almost half of Medicaid’s enrollees are children in low-income families; almost one-third are adults under age 65 who are not disabled; and the remaining one-fifth or so are elderly or disabled adults. Expenses tend to be much higher for beneficiaries who are elderly or disabled, many of whom require long-term care, than for other beneficiaries. In 2014, about 30 percent of federal spend-ing for benefits was for long-term services and supports, a category that includes institutional care provided in nursing homes and certain other facilities, as well as care provided in a person’s home or in the community. In that year, the elderly or disabled accounted for more than half of federal spending for Medicaid benefits.22
States administer their Medicaid programs under federal guidelines that mandate a minimum set of services that must be provided to certain categories of low-income people. The required services include inpatient and out-patient hospital services, services provided by physicians and laboratories, comprehensive and preventive health care services for children, nursing home and home health care, and transportation. The required eligibility categories include families that would have met the finan-cial requirements of the Aid to Families With Dependent
Children program when it existed; elderly and disabled people who qualify for the Supplemental Security Income program; and children and pregnant women in families with income below 138 percent of the federal poverty guidelines (commonly referred to as the federal poverty level or FPL).23
Nevertheless, beyond the federal requirements, state gov-ernments have substantial flexibility to determine eligibil-ity, benefits, and payments to providers under Medicaid. States may choose to make additional groups of people eligible (such as elderly adults who have income above the usual eligibility thresholds but who have high medical expenses relative to their income) or to provide additional benefits (such as coverage for prescription drugs and den-tal services). Moreover, many states seek and receive fed-eral waivers that allow them to provide benefits and cover groups that would otherwise be excluded. Most recently, as a result of the ACA and a subsequent Supreme Court ruling, each state has the option to expand eligibility for Medicaid to most nonelderly adults with income below 138 percent of the FPL.24 Currently, 29 states and the District of Columbia, which together contain about half of the people who meet the new eligibility criteria, have expanded their programs. CBO anticipates that more states will expand coverage during the next few years and that, by 2020, about 80 percent of the people who meet the new eligibility criteria will be in states that have expanded coverage.
The federal government’s share of Medicaid’s spending for benefits varies by state and has historically averaged about 57 percent. However, for enrollees newly eligible under the ACA’s coverage expansion, the federal govern-ment will pay all costs through 2016, a slightly declining share of costs from 2017 to 2019, and 90 percent of costs in 2020 and beyond. According to CBO’s estimates, those changes will raise the federal share of Medicaid
21. Those two estimates differ from each other for two reasons. First, many people are enrolled in Medicaid for less than 12 months. Second, for most enrollees, the typical 12-month eligibility period straddles two consecutive years. That is, some enrollees leave Medicaid partway through the year, after their eligibility period ends; other enrollees begin a new eligibility period after the start of the year. As a result, the total number of people enrolled in Medicaid at some point in the year is significantly higher than the average number of people enrolled in a given month.
22. Congressional Budget Office, “Medicaid—Baseline Projections” (March 2015), www.cbo.gov/publication/44204.
23. The FPL is currently $24,250 for a family of four. See Department of Health and Human Services, Office of the Assistant Secretary for Planning and Evaluation, “2015 Poverty Guidelines” (January 2015), http://aspe.hhs.gov/poverty/15poverty.cfm.
24. In fact, the ACA expanded eligibility for Medicaid to include nonelderly residents with income of up to 133 percent of the FPL, but the act defined income in a way that effectively raised that threshold to 138 percent of the FPL. As a result of the Supreme Court decision, which was issued on June 28, 2012 (National Federation of Independent Business v. Sebelius, 132 S. Ct. 2566 (2012)), some states chose not to expand their programs.

CHAPTER TWO THE 2015 LONG-TERM BUDGET OUTLOOK 33
CBO
spending to between 62 percent and 64 percent in 2015 and later years.25
In 2014, federal spending for Medicaid amounted to $301 billion, of which $270 billion covered benefits for enrollees. (The rest included payments to hospitals that served a disproportionate share of Medicaid patients and low-income uninsured patients, costs for the Vaccines for Children program, and administrative expenses.) On the basis of data provided by the Centers for Medicare & Medicaid Services (CMS), CBO estimates that the states spent $195 billion on Medicaid in that year.26
Children’s Health Insurance ProgramCHIP, a much smaller joint federal-state program, pro-vides health insurance coverage for children in families whose income, though modest, is too high for them to qualify for Medicaid.27 States have discretion to deter-mine income eligibility, but it usually falls in the range between 100 percent and 300 percent of the FPL. Like Medicaid, CHIP is administered by the states within broad federal guidelines. Unlike Medicaid, however, CHIP has a fixed nationwide limit on federal spending.28
In 2014, federal spending on CHIP was $9.3 billion, and about 8 million people (almost all of them children) were enrolled in the program at some point during the year.29 The federal share of CHIP spending varies among the states but usually averages about 70 percent.30
Subsidies for Insurance Purchased Through ExchangesMany people can buy subsidized insurance through exchanges (also called marketplaces) operated by the fed-eral government, by state governments, or through a part-nership between federal and state governments. There are two kinds of subsidy: refundable tax credits to help pay for premiums; and cost-sharing subsidies to reduce out-of-pocket expenses, such as deductibles and copayments. To qualify for the premium tax credits, a person generally must have household income between 100 percent and 400 percent of the FPL and must not have access to certain other sources of health insurance coverage. (The most common examples are coverage through an employer that meets the law’s definition of being afford-able and coverage from a government program, such as Medicare or Medicaid.) To qualify for the cost-sharing subsidies, a person must meet the requirements for the premium tax credits, enroll in what the ACA calls a silver plan (which covers about 70 percent of the cost of cov-ered benefits), and have household income below 250 percent of the FPL.
The size of a person’s premium tax credit is the difference between the cost of the second-lowest-cost silver plan available to that person and a specified percentage of his or her household income. For example, in calendar year 2014, the tax credit was set so that people with income between 100 percent and 133 percent of the FPL would pay about 2 percent of their income to enroll in the second-lowest-cost silver plan, while people with higher income would pay a larger share of their income, up to about 9.5 percent for those with income between 300 percent and 400 percent of the FPL. (Therefore, if a person’s premium for such a plan would be less than the applicable percentage of income, that person would receive no tax credit.) The amounts that enrollees must pay are indexed so that the subsidies cover roughly the same shares of the premiums over time. After calendar year 2017, however, an additional indexing factor may apply; if so, the shares of the premiums that enrollees pay
25. Congressional Budget Office, “Medicaid—Baseline Projections” (March 2015), Note a, www.cbo.gov/publication/44204.
26. CBO’s calculations rely on unpublished data from states’ filings of the CMS-64 Quarterly Expense Report for fiscal year 2014. States use that form to report their spending for Medicaid-covered benefits and administrative activities.
27. Under certain conditions, pregnant women and parents of children enrolled in CHIP are also eligible for the program, but they constitute a very small percentage of the program’s enrollment. See Congressional Budget Office, “Children’s Health Insurance Program—Baseline Projections” (March 2015), www.cbo.gov/publication/44189.
28. CHIP also differs from Medicaid in that its funding expires after September 2017, under current law.
29. Congressional Budget Office, “Children’s Health Insurance Program—Baseline Projections” (March 2015), www.cbo.gov/publication/44189.
30. The ACA provided for a 23 percentage-point increase in the federal share of each state’s CHIP spending from 2016 through 2019. CBO estimates that the average federal share will consequently rise from 70 percent to 93 percent during those four years before reverting to 70 percent in 2020. See Centers for Medicare & Medicaid Services, “Children’s Health Insurance Program Financing” (accessed April 6, 2015), http://tinyurl.com/kqjfj3s.

34 THE 2015 LONG-TERM BUDGET OUTLOOK JUNE 2015
CBO
will increase, and the shares of the premiums that the subsidies cover will decline.31
CBO and JCT estimate that, over the course of calendar year 2015, an average of about 11 million people will be covered by insurance purchased through the exchanges, of whom about 8 million will receive subsidies and 3 mil-lion will not. Over time, coverage through the exchanges will increase substantially, CBO and JCT expect, as peo-ple respond to the subsidies and to rising penalties for failing to obtain coverage. According to CBO and JCT’s projections, an average of about 21 million people will have such coverage in 2016, and between 22 million and 24 million will have it in each year between 2017 and 2025. Roughly three-quarters of those enrollees are expected to receive subsidies. In fiscal year 2015, outlays for those subsidies and related spending will be about $41 billion, CBO and JCT estimate.32
The Historical Growth of Health Care SpendingTotal spending for health care in the United States—that is, private and public spending combined—has risen sig-nificantly as a share of GDP over the past several decades. Such spending has grown relative to GDP in most years, except for the periods between calendar years 1993 and 2000 and again between 2009 and 2013 (the most recent year for which data are available). During both of those periods, spending for health care remained roughly stable as a share of the economy.
Some analysts have attributed the lull in growth from 1993 to 2000 to a substantial rise in the number of peo-ple enrolled in managed care plans and to excess capacity among providers of some types, which increased the
leverage that health plans had in negotiating payments to providers; also, economic growth was relatively rapid in that period, making it easier for rising spending to remain stable as a share of the economy.33 In examining the more recent slowdown in health care spending—from 2009 to 2013—analysts have reached different conclusions about the relative contributions of the weak economy and of changes in the delivery and financing of health care. Some analysts believe that an expansion of high-deductible health plans, increasing efforts by states to control Medicaid spending, and a slackening in the diffusion of new technologies are the key factors in the most recent slowdown.34 Others believe that the weakened economy has been the primary factor.35 How long the slowdown may persist is highly uncertain. In fact, one recent study estimated that total spending for health care in the United States increased as a share of GDP in calendar year 2014 and would continue to do so through 2023 (the last year included in the analysis).36
Spending for Medicare and Medicaid has also grown quickly in the past few decades, partly because of rising enrollment and partly because of rising costs per enrollee. Between 1985 and 2014, net federal spending for Medicare rose from 1.5 percent of GDP to 2.9 percent, and federal spending for Medicaid rose from 0.5 percent of GDP to 1.7 percent. (Total spending for Medicaid, including spending by the states, rose from 0.9 percent of GDP to 2.9 percent.) During the last few years of that period, however, net federal spending for Medicare grew
31. The additional indexing factor will apply in any year after calendar year 2017 in which the total costs of the exchange subsidies exceed a specified percentage of GDP. CBO expects that the indexing factor will apply in some years, although the uncertainty of projections of both the exchange subsidies and GDP make the timing unclear. For an explanation of the indexing factor, see Congressional Budget Office, Additional Information About CBO’s Baseline Projections of Federal Subsidies for Health Insurance Provided Through Exchanges (May 2011), www.cbo.gov/publication/41464.
32. Congressional Budget Office, “Effects of the Affordable Care Act on Health Insurance Coverage—Baseline Projections” (March 2015), Table 3, www.cbo.gov/publication/43900. Related spending includes grants to states and payments by the federal government to insurers under several provisions of the ACA.
33. See Katharine Levit and others, “National Health Expenditures in 1997: More Slow Growth,” Health Affairs, vol. 17, no. 6 (November/December 1998), pp. 99–110, http://dx.doi.org/10.1377/hlthaff.17.6.99.
34. See, for example, Amitabh Chandra, Jonathan Holmes, and Jonathan Skinner, “Is This Time Different? The Slowdown in Health Care Spending,” Brookings Papers on Economic Activity (Fall 2013), pp. 261–323, http://tinyurl.com/pyrjret (PDF, 752 KB).
35. See, for example, Larry Levitt and others, Assessing the Effects of the Economy on the Recent Slowdown in Health Spending (Kaiser Family Foundation, April 2013), http://tinyurl.com/m78guc9; and David Dranove and others, “Health Spending Slowdown Is Mostly Due to Economic Factors, Not Structural Change in the Health Care Sector,” Health Affairs, vol. 33, no. 8 (August 2014), pp. 1399–1406, http://dx.doi.org/10.1377/hlthaff.2013.1416.
36. Andrea M. Sisko and others, “National Health Expenditure Projections, 2013–23: Faster Growth Expected With Expanded Coverage and Improving Economy,” Health Affairs, vol. 33, no. 10 (October 2014), pp. 1841–1850, http://dx.doi.org/10.1377/hlthaff.2014.0560.

CHAPTER TWO THE 2015 LONG-TERM BUDGET OUTLOOK 35
CBO
only about as quickly as the overall economy did. Federal spending for Medicaid also grew at about that rate in recent years—until 2014, when spending for Medicaid increased rapidly because of the expansion of Medicaid coverage under the ACA. Between 2013 and 2014, net Medicare spending grew by only 2.8 percent, whereas federal Medicaid spending grew by 13.6 percent.37
Factors Affecting the Growth of Health Care SpendingA crucial factor underlying the rise in per capita spending for health care during the past few decades has been the emergence, adoption, and widespread diffusion of new medical technologies and services.38 Major advances in medical science allow providers to diagnose and treat illnesses in ways that previously were impossible. Many of those innovations rely on costly new drugs, equipment, and skills.39 Other innovations are relatively inexpensive, but their costs add up quickly as growing numbers of providers and patients make use of them. Although technological advances can sometimes reduce costs, they have generally increased total health care spending.
Other factors that have contributed to the growth of per capita spending on health care in recent decades include increases in personal income and changes in insurance coverage—in particular, declines in the share of health care costs that people with coverage pay out of pocket. Demand for medical care tends to rise as real (that is, inflation-adjusted) family income increases. Peo-ple also use more care if they pay a smaller portion of the cost—and between 1970 and 2000, the share of total health care spending paid out of pocket declined rapidly, from 37 percent to 16 percent.40 (More recently, the rate of decline has slowed, leaving the share of health care spending paid out of pocket at about 12 percent in 2013;
reasons for that slowing include an increase in the share of insured people who have an annual deductible and an increase in the share enrolled in high-deductible health plans.)
In general, disentangling the effects of technology, income, and insurance coverage on the growth of health care spending is difficult, because rising income and expanding insurance coverage have themselves increased the demand for new technologies. One study estimated that new medical technologies and rising income were the most important factors behind the growth of health care spending between 1960 and 2007, and that the two accounted for roughly equal shares of that growth—but also that the effect of increasing insurance coverage dur-ing that period was highly uncertain.41 Another study concluded that after Medicare was introduced, the result-ing expansion of insurance coverage increased health care spending not just for the elderly patients who gained cov-erage but for younger patients as well. Part of the reason, according to the study, was that the increased insurance coverage spurred a more rapid and widespread adoption of existing treatment methods, such as those provided by cardiac intensive care units, for the elderly and nonelderly alike—though the study concluded that questions remained about the magnitude of those effects.42
Spending on health care per person would also be expected to grow if people were developing more health problems or becoming more likely to contract diseases, but the evidence about the importance of those factors is mixed. In particular, researchers have reached different
37. Congressional Budget Office, The Budget and Economic Outlook: 2015 to 2025 (January 2015), p. 11, www.cbo.gov/publication/49892.
38. Congressional Budget Office, Technological Change and the Growth of Health Care Spending (January 2008), www.cbo.gov/publication/41665.
39. See, for example, Jay H. Hoofnagle and Averell H. Sherker, “Therapy for Hepatitis C—The Costs of Success,” The New England Journal of Medicine, vol. 370, no. 16 (April 17, 2014), pp. 1552–1553, http://tinyurl.com/p7z4tyu.
40. Centers for Medicare & Medicaid Services, National Health Expenditure Accounts, “NHE Tables” (accessed April 3, 2015), http://go.usa.gov/jmGY.
41. Sheila Smith, Joseph P. Newhouse, and Mark S. Freeland, “Income, Insurance, and Technology: Why Does Health Spending Outpace Economic Growth?” Health Affairs, vol. 28, no. 5 (September/October 2009), pp. 1276–1284, http://dx.doi.org/10.1377/hlthaff.28.5.1276.
42. Amy Finkelstein, “The Aggregate Effects of Health Insurance: Evidence From the Introduction of Medicare,” The Quarterly Journal of Economics, vol. 122, no. 1 (February 2007), pp. 1–37, http://tinyurl.com/oqlrvjq. One factor that may have contributed to that study’s findings was the relatively generous payment system that Medicare adopted. Following the common practice of private insurers at the time, Medicare initially paid hospitals on the basis of their incurred costs—an approach that gave hospitals little incentive to control those costs—rather than according to fee schedules, as it does today. The increase in hospital spending that resulted from Medicare’s creation might have been smaller under a less generous payment system.
36 THE 2015 LONG-TERM BUDGET OUTLOOK JUNE 2015
CBO
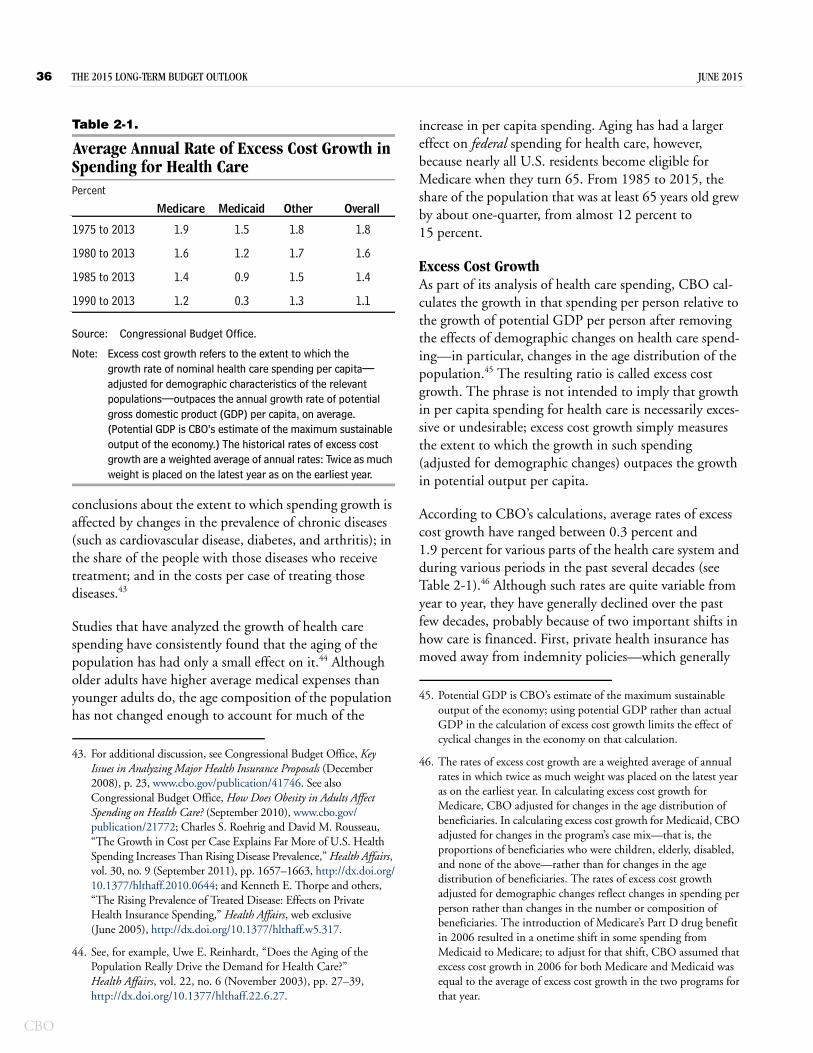
Table 2-1.
Average Annual Rate of Excess Cost Growth in Spending for Health CarePercent
Source: Congressional Budget Office.
Note: Excess cost growth refers to the extent to which the growth rate of nominal health care spending per capita—adjusted for demographic characteristics of the relevant populations—outpaces the annual growth rate of potential gross domestic product (GDP) per capita, on average. (Potential GDP is CBO’s estimate of the maximum sustainable output of the economy.) The historical rates of excess cost growth are a weighted average of annual rates: Twice as much weight is placed on the latest year as on the earliest year.
conclusions about the extent to which spending growth is affected by changes in the prevalence of chronic diseases (such as cardiovascular disease, diabetes, and arthritis); in the share of the people with those diseases who receive treatment; and in the costs per case of treating those diseases.43
Studies that have analyzed the growth of health care spending have consistently found that the aging of the population has had only a small effect on it.44 Although older adults have higher average medical expenses than younger adults do, the age composition of the population has not changed enough to account for much of the
increase in per capita spending. Aging has had a larger effect on federal spending for health care, however, because nearly all U.S. residents become eligible for Medicare when they turn 65. From 1985 to 2015, the share of the population that was at least 65 years old grew by about one-quarter, from almost 12 percent to 15 percent.
Excess Cost GrowthAs part of its analysis of health care spending, CBO cal-culates the growth in that spending per person relative to the growth of potential GDP per person after removing the effects of demographic changes on health care spend-ing—in particular, changes in the age distribution of the population.45 The resulting ratio is called excess cost growth. The phrase is not intended to imply that growth in per capita spending for health care is necessarily exces-sive or undesirable; excess cost growth simply measures the extent to which the growth in such spending (adjusted for demographic changes) outpaces the growth in potential output per capita.
According to CBO’s calculations, average rates of excess cost growth have ranged between 0.3 percent and 1.9 percent for various parts of the health care system and during various periods in the past several decades (see Table 2-1).46 Although such rates are quite variable from year to year, they have generally declined over the past few decades, probably because of two important shifts in how care is financed. First, private health insurance has moved away from indemnity policies—which generally
43. For additional discussion, see Congressional Budget Office, Key Issues in Analyzing Major Health Insurance Proposals (December 2008), p. 23, www.cbo.gov/publication/41746. See also Congressional Budget Office, How Does Obesity in Adults Affect Spending on Health Care? (September 2010), www.cbo.gov/publication/21772; Charles S. Roehrig and David M. Rousseau, “The Growth in Cost per Case Explains Far More of U.S. Health Spending Increases Than Rising Disease Prevalence,” Health Affairs, vol. 30, no. 9 (September 2011), pp. 1657–1663, http://dx.doi.org/10.1377/hlthaff.2010.0644; and Kenneth E. Thorpe and others, “The Rising Prevalence of Treated Disease: Effects on Private Health Insurance Spending,” Health Affairs, web exclusive (June 2005), http://dx.doi.org/10.1377/hlthaff.w5.317.
44. See, for example, Uwe E. Reinhardt, “Does the Aging of the Population Really Drive the Demand for Health Care?” Health Affairs, vol. 22, no. 6 (November 2003), pp. 27–39, http://dx.doi.org/10.1377/hlthaff.22.6.27.
1975 to 2013 1.9 1.5 1.8 1.8
1980 to 2013 1.6 1.2 1.7 1.6
1985 to 2013 1.4 0.9 1.5 1.4
1990 to 2013 1.2 0.3 1.3 1.1
Medicare Medicaid Other Overall
45. Potential GDP is CBO’s estimate of the maximum sustainable output of the economy; using potential GDP rather than actual GDP in the calculation of excess cost growth limits the effect of cyclical changes in the economy on that calculation.
46. The rates of excess cost growth are a weighted average of annual rates in which twice as much weight was placed on the latest year as on the earliest year. In calculating excess cost growth for Medicare, CBO adjusted for changes in the age distribution of beneficiaries. In calculating excess cost growth for Medicaid, CBO adjusted for changes in the program’s case mix—that is, the proportions of beneficiaries who were children, elderly, disabled, and none of the above—rather than for changes in the age distribution of beneficiaries. The rates of excess cost growth adjusted for demographic changes reflect changes in spending per person rather than changes in the number or composition of beneficiaries. The introduction of Medicare’s Part D drug benefit in 2006 resulted in a onetime shift in some spending from Medicaid to Medicare; to adjust for that shift, CBO assumed that excess cost growth in 2006 for both Medicare and Medicaid was equal to the average of excess cost growth in the two programs for that year.

CHAPTER TWO THE 2015 LONG-TERM BUDGET OUTLOOK 37
CBO
reimburse enrollees for their incurred medical costs and which predominated before the 1990s—and toward greater management of care. Second, beginning in the 1980s, Medicare shifted from payments that were based on the costs that providers incurred or the charges that they submitted to fee schedules that constrained price increases.
Excess cost growth has been especially low, on average, during two periods—in most of the 1990s and during the past few years. In the mid- to late 1990s, managed care was spreading rapidly, and some of the low excess cost growth probably represented a series of onetime down-ward shifts in health care costs, spread out over several years, rather than a permanent change in the underlying growth rate of health care spending. During the past few years, some of the low excess cost growth has probably reflected the economic downturn and may be reversed once the economy recovers further. Even the part of the currently low excess cost growth that reflects structural changes in how care is delivered or how it is financed may largely represent another onetime downward shift in costs, rather than a permanent reduction in the growth rate of spending.
For those reasons, even though growth rates are currently below the historical average, CBO judges that the rate of excess cost growth in overall spending on health care since 1985 is the rate that best reflects features of the health care delivery and financing systems that are likely to endure for a number of years—which is important because the agency uses its estimate of historical excess cost growth to inform its projections of future spending. Within that period, the later years provide a more useful guide to the future than the earlier years do. Therefore, CBO calculated a weighted average of the annual excess cost growth rates between 1985 and 2013 (the latest year for which data are available), placing twice as much weight on the latest year as on the earliest year and setting the weights for intermediate years by following a linear progression between the two. After making that adjust-ment, CBO arrived at its estimate of the historical rate of excess cost growth to be used as a basis for its long-term projections: 1.4 percent per year.47
Long-Term Responses to Rising Health Care CostsHealth care spending cannot rise more quickly than GDP forever. When that spending increases as a share of
GDP, it absorbs a growing share of people’s income, restraining the consumption of other goods and services and building pressure to slow its growth, both in the private sector and in government programs. Those responses will occur even if, as CBO assumes in making its projections, current federal law does not change.
Responses in the Private Sector, Health Insurance Exchanges, and MedicaidCBO expects that the private sector will respond to rising health care costs by pursuing various ways to restrain spending. Many employers will intensify their efforts to reduce the costs of the insurance plans that they offer—for example, by working with insurers and providers to make the delivery of health care more efficient, by limiting the amount of insurance coverage that they offer, or by offer-ing a fixed contribution that employees can use to purchase health insurance. Some employees will move to plans with more tightly managed benefits, narrower networks of pro-viders, or higher cost-sharing requirements—moves that would lower premiums by shifting costs to the employees, but that also could reduce total spending on health care. Such changes are already under way; for example, the share of covered workers with an annual deductible increased from 55 percent in 2006 to 80 percent in 2014.48
When it goes into effect in 2018, an excise tax on certain health insurance plans with high premiums will also encourage some employers and individuals to choose plans with lower premiums. In some cases, employers are already reducing the benefits that their insurance plans cover or increasing workers’ deductibles and copayments to avoid having to pay the tax in the future.49 Although the excise tax will not apply to health insurance plans offered through exchanges, people buying coverage through exchanges are also likely to seek ways to avoid
47. The same method applied to data through 2007 yields an estimate of 1.6 percent per year. That is, the slow growth of health care spending experienced during the past several years, all else being equal, has reduced the average rate of excess cost growth by about 0.2 percentage points.
48. Gary Claxton and others, Employer Health Benefits: 2014 Annual Survey (Kaiser Family Foundation and Health Research and Educational Trust, September 2014), p. 120, http://tinyurl.com/q7h4osw.
49. Julie Piotrowski, “Excise Tax on ‘Cadillac’ Plans,” Health Policy Briefs, Health Affairs (September 12, 2013), http://tinyurl.com/my4kfd7.

38 THE 2015 LONG-TERM BUDGET OUTLOOK JUNE 2015
CBO
higher premiums, which will tend to slow the growth of federal spending for the exchange subsidies.50
Many state governments will respond to growing costs for Medicaid by restraining payment rates to providers and managed care plans, limiting the services that they choose to cover, or tightening eligibility for the program so that it serves fewer beneficiaries than it would have otherwise. Because federal spending for Medicaid depends on state spending, such actions by the states will tend to slow the growth of federal spending for the program as well.
Over the long term, those responses by businesses, indi-viduals, and state governments will sharply slow the growth of health care spending, resulting in a reduction of the rate of excess cost growth in the health care system, CBO projects. That slowdown could occur in different ways. Improvements in the efficiency of the health care sector, for example, could lower the rate of excess cost growth. Many experts believe that a substantial share of current health care spending is of low value, meaning that the services provided yield little health benefit relative to their costs. If the use of such services fell, the rate of excess cost growth could also decline for an extended period without imposing direct costs on patients. How-ever, reducing the use of low-value care without affecting high-value care is very challenging, so the degree to which such a reduction might occur is highly uncertain.51
The responses to high and rising health care costs could have other effects as well. They could lead to significant changes in the amount that people paid directly for care, their access to care, or the quality of care—at least, rela-tive to what would have occurred without a slowdown in spending. In the private sector, people might face increased cost-sharing requirements and narrower net-works of providers; new and potentially useful health technologies might be introduced more slowly or used
less frequently than they would have been otherwise; and more treatments and interventions might not be covered by insurance. Those outcomes might affect people with employment-based health insurance and people purchas-ing health insurance through the exchanges. In Medicaid, some beneficiaries might lose their eligibility or have to pay more out of pocket if states narrowed their eligibility criteria or dropped coverage of optional services. Medic-aid beneficiaries might also end up with more tightly managed care. In addition, private insurers and Medicaid programs might constrain payments to providers in ways that limited access to care, the quality of care, or both.
Responses in MedicareMany features of the Medicare program cannot be altered without changes in federal law. Still, a reduction in spending growth elsewhere in the health care sector would probably affect Medicare, which is integrated to a significant degree with the other parts of the health care system. In particular, spending on Medicare will slow to the extent that actions by businesses, individuals, and states result in lower-cost patterns of practice by phy-sicians, slower development and diffusion of new medical technologies, and cost-limiting changes to the structure of the overall health care system.
In addition, current law includes a number of incentives and mechanisms that could reduce spending growth in Medicare. For one thing, the program’s premiums and cost sharing will consume a growing share of beneficia-ries’ income—because the growth of health care spending in general is projected to outpace the growth of income—and that will constrain demand for some Medicare ser-vices. Changes being made in the structure of Medicare’s payments to providers, such as financial incentives to reduce hospital-acquired infections and readmissions, may also help hold down federal spending.52 Further, the Center for Medicare & Medicaid Innovation, an arm of CMS, is testing promising ways to modify rules and pay-ment methods that could reduce costs without impairing 50. A recent analysis of insurance plans available through exchanges
found that many consumers continued enrolling in cheaper plans with narrower networks of providers even though they reported low satisfaction with those plans. See McKinsey Center for U.S. Health System Reform, Hospital Networks: Evolution of the Configurations on the 2015 Exchanges (April 2015), http://tinyurl.com/pnyv563 (PDF, 881 KB).
51. See Katherine Baicker, Sendhil Mullainathan, and Joshua Schwartzstein, Behavioral Hazard in Health Insurance, Working Paper 18468 (National Bureau of Economic Research, October 2012), www.nber.org/papers/w18468.
52. Sarah L. Krein and others, “Preventing Hospital-Acquired Infections: A National Survey of Practices Reported by U.S. Hospitals in 2005 and 2009,” Journal of General Internal Medicine, vol. 27, no. 7 (July 2012), pp. 773–779, www.ncbi.nlm.nih.gov/pmc/articles/PMC3378739/. For a description of the program to reduce hospital readmissions, see Centers for Medicare & Medicaid Services, “Readmissions Reduction Program” (accessed April 6, 2015), http://go.usa.gov/DxKC.

CHAPTER TWO THE 2015 LONG-TERM BUDGET OUTLOOK 39
CBO
the quality of health care; the changes that prove effective may be expanded by the Secretary of Health and Human Services.53 Several such demonstrations are currently under way, but which, if any, will prove successful in slowing spending growth for Medicare as a whole is uncertain.
Growth in Medicare spending will also be constrained by the rules governing the annual updates that are made to Medicare’s payment rates for health care services. The scheduled updates will generally be smaller than the increases in the prices of inputs (namely, labor and sup-plies) used to deliver care. But it is unclear whether provid-ers’ responses to that constraint will lead to offsetting increases or to further reductions in spending for Medicare and other health care programs. The answer depends on whether or to what extent the providers can restrain the growth of their costs, either by increasing their productiv-ity over time—that is, producing the same quantity and quality of output (treatments and procedures) with fewer or less costly inputs—or by other means.
There is considerable uncertainty, partly because of data limitations, about the degree of productivity growth in the health care sector and how it compares with produc-tivity growth in the economy as a whole. Some evidence suggests that productivity growth in the hospital industry is substantial. For example, one recent study found such evidence for selected medical conditions, after adjusting for trends in the severity of illness and improvements in patients’ outcomes.54 Also, a recent analysis by CMS indi-cates that Medicare’s payment updates for services by pro-viders other than physicians were, on average, roughly in line with general price inflation (which reflects growth in productivity in the economy as a whole) over the 1991–2011 period.55 Furthermore, an analysis by the American Hospital Association indicates that private-sector pay-ment rates grew at about the same pace as Medicare’s payment rates over that period, on average, and that
aggregate profit margins for hospitals in 2012 were higher than those in the early 1990s.56 Taken together, those findings suggest that, on average, hospitals have improved their productivity roughly in line with economywide pro-ductivity growth.57 Earlier evidence, however, suggests that productivity growth in the hospital industry is very low.58 Evidence about productivity growth for physicians is harder to interpret, partly because of the challenges involved in measuring the quality of the care that they provide.59
If providers cannot increase their productivity enough over time to keep the growth of their costs in line with the updates to Medicare’s payment rates, they might respond in other ways, such as reducing the quality of care, reducing Medicare beneficiaries’ access to care (which might reduce spending), or trying to increase rev-enues by other means (which might increase spending). Providers that are not able to adjust to the constraint imposed by the payment updates might merge with more profitable providers or close.
If access to providers under the traditional fee-for-service program declined, more enrollees might shift into Medicare Advantage plans, which are not bound by the updates to payment rates that apply to traditional Medicare. Medicare Advantage plans might be able to offer better access to care than the fee-for-service program if they increased the rates that they paid providers, but that would probably require enrollees in such plans to pay higher premiums. Because federal payments to those plans are based largely on costs in the fee-for-service
53. A list of the center’s ongoing projects is available at Centers for Medicare & Medicaid Services, “Innovation Models” (accessed April 6, 2015), http://go.usa.gov/3Dc2Q.
54. John A. Romley, Dana P. Goldman, and Neeraj Sood, “U.S. Hospitals Experienced Substantial Productivity Growth During 2002–11,” Health Affairs, vol. 34, no. 3 (March 2015), pp. 511–518, http://dx.doi.org/10.1377/hlthaff.2014.0587.
55. Centers for Medicare & Medicaid Services, Review of Assumptions and Methods of the Medicare Trustees’ Financial Projections (December 2012), p. 60, http://go.usa.gov/Xn7Q.
56. American Hospital Association, “Trends in Hospital Financing,” in Trends Affecting Hospitals and Health Systems (accessed April 6, 2015), http://tinyurl.com/m4by9zd.
57. Less information is readily available about the influence of changes in Medicare’s payment rates and methods over the past two decades on the growth of costs for other providers.
58. Jonathan D. Cylus and Bridget A. Dickensheets, “Hospital Multifactor Productivity: A Presentation and Analysis of Two Methodologies,” Health Care Financing Review, vol. 29, no. 2 (Winter 2007–2008), pp. 49–64, http://go.usa.gov/XrHC; and Michael J. Harper and others, “Nonmanufacturing Industry Contributions to Multifactor Productivity, 1987–2006,” Monthly Labor Review, vol. 133, no. 6 (June 2010), pp. 16–31, www.bls.gov/opub/mlr/2010/06/art2full.pdf (1 MB).
59. See Joseph P. Newhouse and Anna D. Sinaiko, “Estimates of Physician Productivity: An Evaluation,” Health Care Financing Review, vol. 29, no. 2 (Winter 2007–2008), pp. 33–39, www.ncbi.nlm.nih.gov/pmc/articles/PMC4195017/.

40 THE 2015 LONG-TERM BUDGET OUTLOOK JUNE 2015
CBO
program, it is unclear whether such a shift—if it were to occur—would substantially alter the trajectory of Medi-care spending.
Because of the uncertainty about the responses of Medi-care providers to the payment updates, CBO has not adjusted its projections of spending in the long term to take such responses into account.
CBO’s Method for Making Long-Term Projections of Federal Health Care SpendingCBO’s extended baseline projections of federal spending on the major health care programs, like the rest of the agency’s extended baseline projections, generally reflect the provisions of current law. The projections in the extended baseline for the next 10 years match the agency’s 10-year baseline projections as adjusted to reflect recently enacted legislation, which are based on detailed analysis of the major health care programs. Beyond the coming decade, however, projecting federal health care spending becomes increasingly difficult because of the considerable uncertainties involved. A wide range of changes could occur—in people’s health, in the sources and extent of their insurance coverage, and in the delivery of medical care—that are almost impossible to predict but that could have a significant effect on federal health care spending.
Therefore, for the projections beyond 2025, CBO has adopted a formulaic approach—one that combines esti-mates of the number of beneficiaries of government health care programs with fairly mechanical projections of spending growth per beneficiary. CBO has estimated spending growth per beneficiary by combining projected growth in potential GDP per capita and projected excess cost growth for the program in question (with adjust-ments for demographic changes in the beneficiaries of that program).
The long-term projections of excess cost growth depend on CBO’s assessment of the underlying rates of excess cost growth. The underlying growth rates begin in 2014 with the historical average rate of excess cost growth described above—1.4 percent per year—and are projected to decline gradually, at different rates for different programs, in response to the pressures created by rising costs. Pro-jected excess cost growth for each program depends on the rate of excess cost growth for that program implied by
the baseline projections for the next decade; on CBO’s assessment of the underlying rate of excess cost growth for the program a quarter century from now and beyond; and on a blend of those factors for the intervening period (the 11th through the 24th years of the projection).
Excess Cost Growth Over the Next DecadeFor 2016 through 2025, the projected rates of excess cost growth used in CBO’s extended baseline are derived from CBO’s 10-year baseline:
For Medicare, CBO’s baseline projections imply an average annual rate of excess cost growth over that decade of about 0.4 percent; that is, spending per beneficiary for Medicare (adjusted for demographic changes) is projected to grow slightly faster than potential GDP per capita. That slow projected growth rate stems partly from slow projected growth in the use of Medicare services, which is consistent with recent experience. In addition, some of the limitations on payments under current law will be phased in. Consequently, excess cost growth in Medicare is projected to be negative during the next few years and then to rise to about 0.8 percent per year by the end of the decade.
For federal Medicaid spending, CBO’s baseline projections imply an average annual rate of excess cost growth of 0.5 percent (after the effects of the changing federal share of Medicaid spending are removed). The expansion of benefits in some states to people with income of up to 138 percent of the FPL will increase total Medicaid spending; it will also probably change the average cost per enrollee over the next several years, because average spending on the new enrollees (mostly adults who are not disabled) will tend to differ from average spending on previously eligible enrollees. However, excess cost growth incorporates an adjustment for demographic changes, so it is not significantly affected by the expansion.
For the exchange subsidies, CBO’s baseline projections of spending per enrollee depend on its projections of private health insurance premiums. The agency’s baseline projections imply an average annual rate of excess cost growth of about 2 percent for those premiums. The agency’s projections of spending per enrollee on the exchange subsidies also account for the likelihood that federal subsidies will cover a declining share of the premiums over time as a result of the additional indexing factor mentioned above.

CHAPTER TWO THE 2015 LONG-TERM BUDGET OUTLOOK 41
CBO
Underlying Rates of Excess Cost GrowthCBO’s projections of the underlying rates of excess cost growth are calculated as follows:
For all parts of the health care system, the underlying rate of excess cost growth in 2014 equals the weighted average rate of excess cost growth observed in the overall health care system between 1985 and 2013, which is 1.4 percent.
The underlying rates of excess cost growth gradually decline, over 75 years, to zero for Medicaid and private insurance premiums and to 1.0 percent for Medicare. CBO built in that difference because, in the absence of changes in federal law, state governments and the private sector have more flexibility to respond to the pressures of rising health care spending than the federal government does. Such a difference in growth rates could occur if, for instance, actions taken to reduce spending growth in the private sector weakened the incentives to develop and disseminate new medical technologies for nonelderly people but had a smaller effect on new technologies for diseases that principally affected the elderly.
The underlying rate of excess cost growth in each sector declines in linear fashion—that is, by the same fraction of a percentage point each year. That linear decline, which CBO calls the underlying path of excess cost growth, reflects the agency’s assessment that, over time, the steps needed to keep reducing growth rates will become increasingly onerous, but the pressure to take them will also intensify because of increasingly high health care spending.
Formulating Long-Term ProjectionsIn CBO’s extended baseline, projected federal spending for the major federal health care programs for the 2016–2025 period matches the projected spending in CBO’s 10-year baseline. For 2026 and later years, the projection of federal spending is constructed as follows:
For Medicare, excess cost growth in 2026 equals 0.9 percent, the average rate projected from 2023 through 2025 with certain adjustments.60 It then increases by the same fraction of a percentage point each year for 14 years, so that in 2040 it matches the rate in the underlying path for that year, 1.3 percent. Altogether, by CBO’s projections, excess cost growth for Medicare would average 0.8 percent per year
during the 2016–2040 period. To generate estimates of total spending in the long term, CBO combined those projections of excess cost growth with estimates of the future number of Medicare beneficiaries. CBO estimates that the number of beneficiaries would grow with the size of the population age 65 and over and with the number of recipients of Social Security’s Disability Insurance program.61
For Medicaid, excess cost growth in 2026 equals 0.7 percent, the average rate projected from 2023 through 2025. It then increases by the same fraction of a percentage point each year for 14 years, so that in 2040 it matches the rate in the underlying path, 0.9 percent. According to the agency’s projections, excess cost growth for the program would average 0.7 percent per year during the 2016–2040 period. To generate projections for Medicaid spending in the long term, CBO combined its projections of excess cost growth with estimates of the future number of Medicaid beneficiaries. States’ future decisions about Medicaid eligibility and covered benefits are quite uncertain even over the next 10 years, and that uncertainty grows with time; accordingly, CBO adopted a formulaic approach to generating the number of Medicaid beneficiaries after the next decade. That approach takes into account population growth, increasing earnings, and prospective actions by states (see Appendix A).
For private health insurance premiums, excess cost growth in 2026 is about 2 percent, the average rate projected from 2023 through 2025. It then decreases
60. Spending amounts were adjusted for the fact that, because of the quirks of the calendar, Medicare is scheduled to make 11, rather than the normal 12, capitation payments in Parts C and D of the program in 2024. In addition, the effect of sequestration was removed because that cancellation of funding will not affect spending after 2024. After those adjustments were made, the average projected rate of excess cost growth rate from 2023 through 2025 came to 0.8 percent. Under current law, payment rates for physicians’ services in Medicare will remain at the 2019 level from 2020 through 2025, and they will increase annually starting in 2026. Those changes in the scheduled payment updates boost the projected excess cost growth rate in 2026 from 0.8 percent to 0.9 percent.
61. For more information about how CBO projects the number of beneficiaries of Social Security’s Disability Insurance program, see Congressional Budget Office, CBO’s Long-Term Model: An Overview (June 2009), www.cbo.gov/publication/20807, and Appendix A of this report.

42 THE 2015 LONG-TERM BUDGET OUTLOOK JUNE 2015
CBO
by the same fraction of a percentage point each year for 14 years, so that in 2040 it matches the rate in the underlying path for that year, 0.9 percent. CBO projected the amounts of the exchange subsidies on the basis of excess cost growth for private health insurance premiums, the effects of the additional indexing factor described above, and growth in income (which reduces the share of the population that is eligible for subsidies).
Under current law, funding for CHIP expires after September 2017. Following statutory guidelines, CBO assumes in its baseline spending projections that annual funding for the program from 2018 through 2025 will amount to $5.7 billion.62 For 2026 and beyond, CBO assumes that spending on the program will equal the same share of GDP as the share in 2025.
All long-term economic and demographic developments are uncertain, but excess cost growth in health care may be particularly so. Pharmaceuticals, medical procedures and technology, and the delivery of care all continue to evolve rapidly, potentially making spending for any of the federal health care programs much higher or lower than CBO projects. Compounding the uncertainty imposed by those factors are the uncertain responses of beneficia-ries and providers. For example, enrollees may be willing to accept more restrictions on their use of new services in return for lower premiums and cost-sharing requirements in Medicare Advantage plans. And if some insurers encourage or discourage the use of certain new drugs and technologies, the result may be changes in providers’ behavior that affect the services received by people cov-ered by other insurers. The number of beneficiaries in Medicaid and the exchanges is also very uncertain, because changes in the distribution of income and the steps that states may take regarding eligibility are unclear. Chapter 7 shows how CBO’s projections would differ if the growth of costs per beneficiary in Medicare and Medicaid proved significantly higher or lower than the agency projects in the extended baseline.
Long-Term Projections of Spending for the Major Health Care ProgramsIn CBO’s extended baseline projections, which generally reflect current law, federal spending on the major health care programs increases significantly as a percentage of the economy in the coming decades.
Projected SpendingIn 2015, federal spending for Medicare (net of offsetting receipts), Medicaid, CHIP, and the exchange subsidies will amount to 5.2 percent of GDP, CBO expects; net Medicare spending will equal 3.0 percent and federal spending on Medicaid, CHIP, and the exchange subsidies will equal 2.2 percent. In CBO’s extended baseline, fed-eral spending for those programs rises to 8.0 percent of GDP in 2040; net Medicare spending accounts for 5.1 percent and spending on Medicaid, CHIP, and the exchange subsidies for 2.9 percent (see Figure 2-2).63 Gross Medicare spending is projected to increase from 3.5 percent of GDP in 2015 to 6.3 percent in 2040.
The projected rise in federal spending for the major health care programs relative to GDP results from the continued aging of the population, the expectation that health care costs per beneficiary will continue to grow somewhat faster than potential GDP per capita, and the continued increase in spending for federal subsidies for health care through Medicaid and the insurance exchanges over the next few years. In CBO’s extended baseline, aging accounts for 43 percent of the programs’ spending growth relative to GDP over the next 25 years, excess cost growth accounts for 45 percent, and an increased number of recipients of exchange subsidies and Medicaid benefits attributable to the ACA accounts for 12 percent (see Box 1-1 on page 24).
The factors that underlie the projected rise in total federal spending for the major health care programs also affect the amounts of spending that would subsidize care for different types of beneficiary. Although the ACA has
62. See Congressional Budget Office, cost estimate for H.R. 2, the Medicare Access and CHIP Reauthorization Act of 2015 (March 2015), www.cbo.gov/publication/50053.
63. The projections in this chapter include the effects of the exchange subsidies on outlays; the smaller effects on revenues are included in the projections presented in Chapter 5. In all of the projections, the outlays for the exchange subsidies are presented in combination with outlays for Medicaid and CHIP; they all constitute federal subsidies for health insurance for low- and moderate-income households. Spending for the exchange subsidies includes related spending for risk adjustment.

CHAPTER TWO THE 2015 LONG-TERM BUDGET OUTLOOK 43
CBO
Figure 2-2.
Federal Spending on the Major Health Care Programs, by CategoryPercentage of Gross Domestic Product
Source: Congressional Budget Office.
Notes: The extended baseline generally reflects current law, following CBO’s 10-year baseline budget projections through 2025 and then extending the baseline concept for the rest of the long-term projection period.
CHIP = Children’s Health Insurance Program.
a. Net spending for Medicare refers to gross spending for Medicare net of offsetting receipts (from premium payments made by beneficiaries to the government and amounts paid by states from savings on Medicaid’s prescription drug costs).
expanded federal support for health care regardless of people’s health status, only about one-fifth of federal spending for the major health care programs in 2025 would finance care for able-bodied, nonelderly people, CBO projects in the extended baseline; about three-fifths would go toward care for people who are at least 65 years old, and about one-fifth toward care for blind and dis-abled people. After 2025, according to CBO’s estimates in the extended baseline, the share of federal spending for the major health care programs that finances care for peo-ple who are at least 65 would rise slowly because of the continued aging of the population.
Among people who are at least 65, the fraction who will be significantly older than 65 will increase over the next 25 years (see Figure 2-3). That shift affects CBO’s long-term projections because Medicare spending has tra-ditionally been higher, on average, for the older people within the over-65 group. For example, in Parts A and B of the fee-for-service portion of Medicare in calendar year 2012, spending averaged about $5,000 for 66-year-olds, $8,500 for 75-year-olds, and $12,500 for 85-year-olds.64 CBO expects that pattern to persist. One consequence of the pattern is that elderly beneficiaries over any given age
receive a disproportionate share of the program’s spend-ing. For example, people who will be at least 75 years old in 2040 will represent about 56 percent of the elderly people enrolled in Medicare but will account for about 70 percent of the program’s spending for elderly people, according to CBO’s projections.
Although this chapter focuses on federal spending for health care, CBO also projected total national spending on health care (see Box 2-1). The agency combined its projections of federal spending on the major health care programs with rough projections of other health care spending. According to that analysis, which involves sub-stantial uncertainty, national spending on health care as a share of GDP would continue to rise—from about
2000 2005 2010 2015 2020 2025 2030 2035 20400
1
2
3
4
5
6
7
8
Medicarea
Medicaid, CHIP, and Exchange Subsidies
Actual Extended Baseline ProjectionThe projected rise in federalspending for the major health careprograms relative to GDP resultsfrom the continued aging of thepopulation; the expectation thathealth care costs per person willcontinue to grow at a faster ratethan potential GDP per capita;and, to a lesser extent, anincreased number of recipients ofexchange subsidies and Medicaidbenefits attributable to theAffordable Care Act.
64. Calculating average spending for 65-year-old beneficiaries is not helpful for this comparison because most of them are enrolled in Medicare for only part of the calendar year in which they turn 65. The amounts reported here include spending under Parts A and B of Medicare averaged among all beneficiaries of each age enrolled in Part A, Part B, or both, within the traditional fee-for-service program. The fraction of beneficiaries enrolled in both Parts A and B increases as beneficiaries age.

44 THE 2015 LONG-TERM BUDGET OUTLOOK JUNE 2015
CBO
17 percent of GDP now to about 25 percent by 2040—if current laws remained in place.
Projected FinancingSpending on the government’s major health care pro-grams is financed in various ways. For Medicaid and CHIP, states and the federal government share in the
financing. The federal share of spending on those pro-grams is funded entirely from the government’s general fund, as are the outlays for subsidies provided through the health insurance exchanges.
In contrast, Medicare is funded mostly through a combi-nation of dedicated taxes, beneficiaries’ premiums, and
Box 2-1.
National Spending on Health Care
National spending on health care increased from 9.5 percent of gross domestic product (GDP) in 1985 to 16.4 percent of GDP in 2013. In the Con-gressional Budget Office’s extended baseline, which generally reflects current law, national spending for health care increases to about 25 percent of GDP by 2040.
CBO has only a limited ability to project national spending on health care, because the agency does not track all of the components of that spending as closely as it analyzes the components that are directly relevant to the federal budget. Therefore, to generate projections of national spending for health care, the agency combined its own projections for some cate-gories of spending with projections for other catego-ries developed by the Office of the Actuary in the Centers for Medicare & Medicaid Services (CMS).1 The resulting projections were rough and involved substantial uncertainty—especially as they moved farther into the future—and therefore should be viewed with caution.
To project national spending for health care for the 2016–2025 period, CBO started with its projections of federal spending on the government’s major health care programs. Other spending for health care includes payments by private health insurers,
out-of-pocket payments by consumers, and other public spending. CBO estimated such spending by means of its own projections of payments by private health insurers and the Office of the Actuary’s projec-tions of out-of-pocket payments by consumers and of other public spending. Because the projections from CMS are available only through 2023, CBO used a historical rate of excess cost growth to extend them for the following two years.2
To project national spending for health care after 2025, CBO again started with its projections of fed-eral spending on the government’s major health care programs. It estimated other spending for health care by combining its projections of demographic and economic conditions with assumptions about excess cost growth for such spending. The starting point for projected excess cost growth in other health care spending was the weighted average rate of excess cost growth observed in the overall health care system between 1985 and 2013. CBO assumed that the rate of excess cost growth for other health care spending would slow from that historical rate—1.4 percent—in 2014 to zero over 75 years, in reaction to the pres-sures developing from rising health care spending. The slowdown was assumed to occur in linear fashion—that is, the rate of excess cost growth was assumed to decline by the same number of fractional percentage points each year.
1. This report defines total spending for health care as the health consumption expenditures in the national health expenditure accounts maintained by CMS. That definition excludes spending on medical research, structures, and equipment, and it includes out-of-pocket spending, payments made by public and private health insurance plans, spending on public health, and payments made by other third-party payers, such as workers’ compensation.
2. Andrea M. Sisko and others, “National Health Expenditure Projections, 2013–23: Faster Growth Expected With Expanded Coverage and Improving Economy,” Health Affairs, vol. 33, no. 10 (October 2014), pp. 1841–1850, http://dx.doi.org/10.1377/hlthaff.2014.0560.

CHAPTER TWO THE 2015 LONG-TERM BUDGET OUTLOOK 45
CBO
Figure 2-3.
Number of People Age 65 or Older, by Age GroupMillions of People
Source: Congressional Budget Office.
money from the government’s general fund. The relative magnitudes of those sources of funding have changed sig-nificantly over time. Dedicated taxes have declined from 67 percent of gross federal spending for Medicare in 2000 to an estimated 40 percent in 2015 (see Figure 2-4). Dur-ing the same period, the share of gross spending financed by offsetting receipts (mostly premiums paid by benefi-ciaries) has grown from 10 percent to an estimated 13 percent, and the share financed by the general fund and the remaining sources of funding for the program has increased from 23 percent to 47 percent. The increase in the share of spending covered by sources other than dedi-cated taxes is largely the result of an increase in the share of benefits provided by the parts of the program that are financed mainly by a combination of premiums and money from the general fund—Part B and, since 2006, Part D.65 In CBO’s extended baseline, receipts from dedicated Medicare taxes equal only 22 percent of gross federal spending for Medicare in 2040, and beneficiaries’ premiums and other offsetting receipts account for
17 percent—leaving 61 percent financed by general funds and the remaining sources.
Benefits under Part A of Medicare are paid from the Hospital Insurance Trust Fund, which is credited with receipts largely from payroll taxes and from other revenues. A commonly used measure of the sustainability of Part A of Medicare is the timing of the projected exhaustion of the HI trust fund. According to CBO’s baseline projections, under current law, the balance of the HI trust fund would increase from $202 billion at the end of fiscal year 2014 to $245 billion at the end of fiscal year 2020. Starting in 2021, CBO expects expenditures to outstrip income. By 2025, the fund’s balance would be down to $156 billion.66 CBO projects that the trust fund would be exhausted early in the 10-year period after 2025.67
Once the HI trust fund was exhausted, total payments to health plans and providers for services covered under Part A of Medicare would apparently be limited to the
2000 2005 2010 2015 2020 2025 2030 2035 20400
10
20
30
40
50
60
70
80
90
65 to 74
75 to 84
85 to 94
95 or OlderActual Projected
Per-person spending for Parts A andB of Medicare climbs with age: Theprogram's average spending for an85-year-old is more than twice thatfor a 66-year-old. Thus, averageMedicare costs will rise as thenumber of people who aresignificantly older than 65 increases.
65. In 2000, Part B accounted for 41 percent of gross Medicare spending; in 2015, Parts B and D will account for 56 percent of gross Medicare spending, CBO estimates. In 2015, the percentage of benefits covered by premiums and other offsetting receipts would be higher than shown here if the two-thirds of Part D premiums paid directly by beneficiaries to Part D plans and the resulting benefit payments were included; however, they are not recorded in the federal budget.
66. Congressional Budget Office, “Medicare—Baseline Projections” (March 2015), www.cbo.gov/publication/44205. The estimate given is an updated one that reflects recently enacted legislation.
67. In contrast, the Supplementary Medical Insurance Trust Fund, which pays for benefits covered under Parts B and D of Medicare, cannot be exhausted, because it is financed mainly through premiums and money from the general fund. The amounts of contributions from those sources are set to cover the costs of those benefits.

46 THE 2015 LONG-TERM BUDGET OUTLOOK JUNE 2015
CBO
Figure 2-4.
Medicare’s Dedicated Taxes and Offsetting Receipts as a Share of Medicare SpendingPercent
Sources: Office of Management and Budget (actual shares up to 2014); Congressional Budget Office (projected shares).
Note: The extended baseline generally reflects current law, following CBO’s 10-year baseline budget projections through 2025 and then extending the baseline concept for the rest of the long-term projection period.
a. Mostly premium payments made by beneficiaries to the government; also includes amounts paid by states from savings on Medicaid’s prescription drug costs.
b. Payroll taxes and a portion of the federal income taxes paid on Social Security benefits.
amount of revenues subsequently credited to the trust fund. If that occurred, beneficiaries’ access to health care services covered under Part A would almost certainly be reduced. However, for the purposes of these projections, CBO assumes that Medicare will pay benefits as sched-uled under current law regardless of the status of the HI trust fund—an assumption that is consistent with a statu-tory requirement that CBO, in its 10-year baseline pro-jections, assume that funding for an entitlement program is adequate to make all payments required by law for that program.68
Medicare Benefits and Payroll Taxes for People in Different Birth CohortsOver the course of their lifetimes, members of different generations will pay different amounts of Medicare pay-roll taxes and receive different amounts of Medicare ben-efits. Benefits will be a larger share of lifetime earnings for members of later generations, primarily because of the growth of health care spending per person but also
because of increases in life expectancy, which will allow those people to receive benefits for longer periods, on average. Payroll taxes will be higher for later cohorts, because real earnings generally grow over time. Lifetime payroll taxes, however, will be about the same share of lifetime earnings, because payroll taxes are a fixed share of earnings.
CBO estimated real lifetime benefits and payroll taxes for various birth cohorts as the present value, discounted to the year in which a beneficiary turns 65, of all benefits that a person receives from Medicare (net of premiums paid for those benefits) and all payroll taxes paid to the program (see Figure 2-5).69 CBO estimates that, under the assumption that all scheduled benefits are paid, real
2000 2005 2010 2015 2020 2025 2030 2035 20400
10
20
30
40
50
60
70
80
OffsettingReceiptsa
Dedicated Taxesb
Actual Extended Baseline Projection
Over the past several years, theshare of Medicare spending funded bytaxes and premiums has dropped.The share funded by the government'sgeneral fund has consequently grown.
68. See section 257(b)(1) of the Balanced Budget and Emergency Deficit Control Act of 1985; 2 U.S.C. §907(b)(1).
69. For this analysis, benefits are those scheduled to be paid under current law, regardless of the balances projected for the HI trust fund. The present value of a flow of revenues or outlays over time is a single number that expresses that flow in terms of an equivalent sum received or paid at a specific time. The present value depends on a rate of interest (known as the discount rate) that is used to translate past and future cash flows into current dollars.
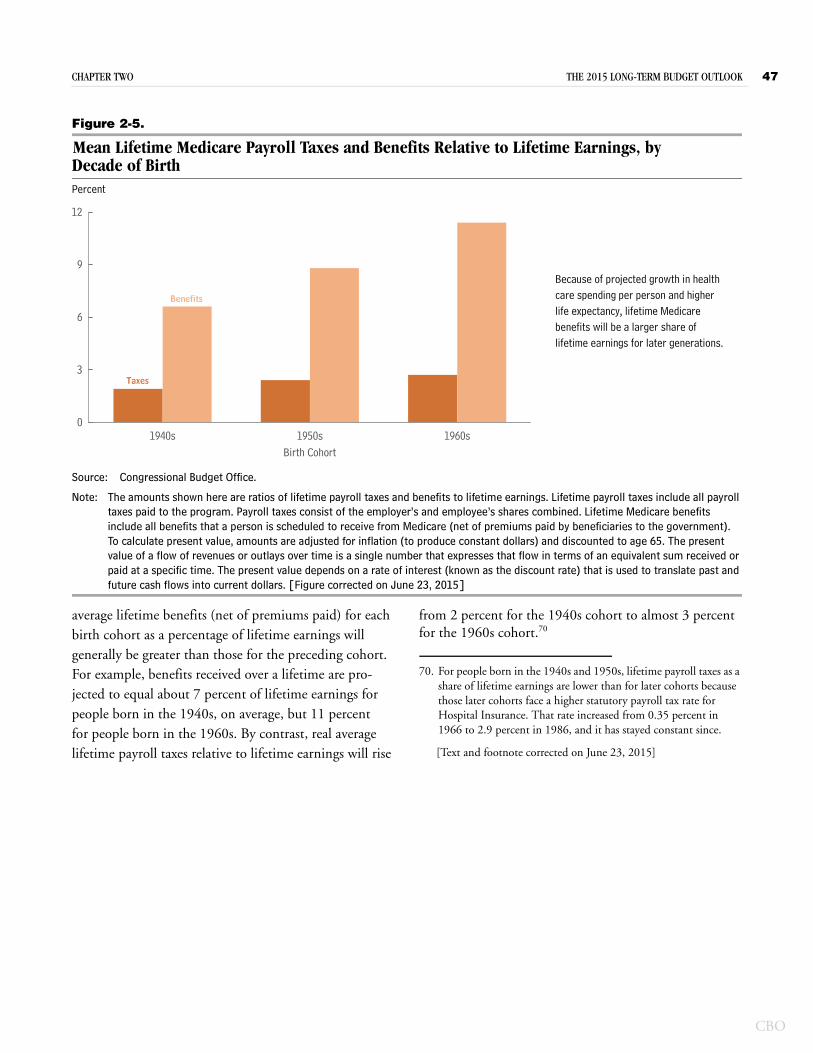
CHAPTER TWO THE 2015 LONG-TERM BUDGET OUTLOOK 47
CBO
Figure 2-5.
Mean Lifetime Medicare Payroll Taxes and Benefits Relative to Lifetime Earnings, by Decade of BirthPercent
Source: Congressional Budget Office.
Note: The amounts shown here are ratios of lifetime payroll taxes and benefits to lifetime earnings. Lifetime payroll taxes include all payroll taxes paid to the program. Payroll taxes consist of the employer’s and employee’s shares combined. Lifetime Medicare benefits include all benefits that a person is scheduled to receive from Medicare (net of premiums paid by beneficiaries to the government). To calculate present value, amounts are adjusted for inflation (to produce constant dollars) and discounted to age 65. The present value of a flow of revenues or outlays over time is a single number that expresses that flow in terms of an equivalent sum received or paid at a specific time. The present value depends on a rate of interest (known as the discount rate) that is used to translate past and future cash flows into current dollars. [Figure corrected on June 23, 2015]
average lifetime benefits (net of premiums paid) for each birth cohort as a percentage of lifetime earnings will generally be greater than those for the preceding cohort. For example, benefits received over a lifetime are pro-jected to equal about 7 percent of lifetime earnings for people born in the 1940s, on average, but 11 percent for people born in the 1960s. By contrast, real average lifetime payroll taxes relative to lifetime earnings will rise
from 2 percent for the 1940s cohort to almost 3 percent for the 1960s cohort.70
1940s 1950s 1960s0
3
6
9
12
Birth Cohort
Benefits
Taxes
Because of projected growth in healthcare spending per person and higherlife expectancy, lifetime Medicarebenefits will be a larger share oflifetime earnings for later generations.
70. For people born in the 1940s and 1950s, lifetime payroll taxes as a share of lifetime earnings are lower than for later cohorts because those later cohorts face a higher statutory payroll tax rate for Hospital Insurance. That rate increased from 0.35 percent in 1966 to 2.9 percent in 1986, and it has stayed constant since.
[Text and footnote corrected on June 23, 2015]