Localizing IDTs for Poverty Reduction in Viet Nam ... · PDF fileLocalizing IDTs for Poverty...
34
Poverty Task Force Localizing IDTs for Poverty Reduction in Viet Nam: ENSURING ENVIRONMENTTAL SUSTAINABILITY Consultation Draft - November 2001 Strategies Achieving the Viet Nam Developing Targets FOREWORD BY THE POVERTY TASK FORCE This series of papers on the Vietnam Development Targets reflects a collective effort by the Poverty Task Force to propose a set of goals and outcome targets for poverty reduction in Vietnam. They have been prepared as the Government of Viet Nam drafts a Comprehensive Poverty Reduction and Growth Strategy (CPRGS) which will articulate medium term priorities and which it hopes to complete by April 2002. As part of the process of preparing the CPRGS the Government of Vietnam is currently looking across its Ten Year Socio-Economic Development Strategy and its sectoral strategies to select a small number of goals which will reflect the strong strategic emphasis on economic growth, poverty reduction and social equity and will guide policy measures and public actions to achieve poverty and social outcomes over the coming decade. Through this work, the Government hopes to establish a clear monitoring firm network for their CPRGS and other Government strategies. While policymakers in Vietnam have been setting national strategic targets, international commitment to achieving important poverty and social outcomes across the globe have intensified. This effort is expressed in the International Development Targets (IDTs) and Millennium Development Goals (MDGs). The latter is a set of goals embodied in the Millennium Declaration which has been adopted by 180 countries, including Vietnam. The goals and targets presented and discussed in the series of papers have been selected to resent the core developmental vision of Vietnam as well as their efforts to meet international targets. These papers contribute to thinking on target-setting and monitoring in eight thematic areas: Eradicating poverty and hunger; Reducing vulnerability and providing social protection; Providing quality basic education for all; Improving health status and reducing inequalities; Ensuring environmental sustainability; Promoting ethnic minority development; Enhancing access to basic infrastructure; and, Ensuring good governance for poverty reduction. This work is still very much in progress. Earlier versions of these draft papers were discussed at a 3-day workshop held in September 2001 attended by nearly 100 policymakers and practitioner. Government agencies, NGOs and donors have all participated in the working groups established to oversee the production of these documents. In some areas there is agreement that a goal is needed, but more work and discussion is necessary to assess what is realistic and attainable. Further consultations on these drafts will take place with sectoral ministries and agencies over the coming months. It is hoped that by early 2002 it will be possible to release final versions of these reports which present consensus views of core development goals and targets Page 1 of 34
-
Upload
duonghuong -
Category
Documents
-
view
218 -
download
2
Transcript of Localizing IDTs for Poverty Reduction in Viet Nam ... · PDF fileLocalizing IDTs for Poverty...

Poverty Task Force
Localizing IDTs for Poverty Reduction in Viet Nam:
ENSURING ENVIRONMENTTAL SUSTAINABILITY
Consultation Draft - November 2001
Strategies Achieving the Viet Nam Developing Target s
FOREWORD BY THE POVERTY TASK FORCE
This series of papers on the Vietnam Development Targets reflects a collective effort by the Poverty Task Force to propose a set of goals and outcome targets for poverty reduction in Vietnam. They have been prepared as the Government of Viet Nam drafts a Comprehensive Poverty Reduction and Growth Strategy (CPRGS) which will articulate medium term priorities and which it hopes to complete by April 2002. As part of the process of preparing the CPRGS the Government of Vietnam is currently looking across its Ten Year Socio-Economic Development Strategy and its sectoral strategies to select a small number of goals which will reflect the strong strategic emphasis on economic growth, poverty reduction and social equity and will guide policy measures and public actions to achieve poverty and social outcomes over the coming decade. Through this work, the Government hopes to establish a clear monitoring firm network for their CPRGS and other Government strategies.
While policymakers in Vietnam have been setting national strategic targets, international commitment to achieving important poverty and social outcomes across the globe have intensified. This effort is expressed in the International Development Targets (IDTs) and Millennium Development Goals (MDGs). The latter is a set of goals embodied in the Millennium Declaration which has been adopted by 180 countries, including Vietnam. The goals and targets presented and discussed in the series of papers have been selected to resent the core developmental vision of Vietnam as well as their efforts to meet international targets. These papers contribute to thinking on target-setting and monitoring in eight thematic areas:
� Eradicating poverty and hunger; � Reducing vulnerability and providing social protection; � Providing quality basic education for all; � Improving health status and reducing inequalities; � Ensuring environmental sustainability; � Promoting ethnic minority development; � Enhancing access to basic infrastructure; and, � Ensuring good governance for poverty reduction.
This work is still very much in progress. Earlier versions of these draft papers were discussed at a 3-day workshop held in September 2001 attended by nearly 100 policymakers and practitioner. Government agencies, NGOs and donors have all participated in the working groups established to oversee the production of these documents. In some areas there is agreement that a goal is needed, but more work and discussion is necessary to assess what is realistic and attainable. Further consultations on these drafts will take place with sectoral ministries and agencies over the coming months. It is hoped that by early 2002 it will be possible to release final versions of these reports which present consensus views of core development goals and targets
Page 1 of 34

for Vietnam.
*The (Government-donor-NGO Poverty Task Force has been working collaboratively on poverty analysis (World Bank et al, 1999) and strategic planning since 1999. While the CPRSG is being drafted, the PTF comprises 14 Government ministries, 6 donors, 4 international NGOs and 4 local NGOs.
CONTENTS
Abbreviations and Acronyms iv
Summary v
1. Background 1
1.1 What are the International Development Targets? 1
1.2 One of Many 1
1.3 Poverty and the Environment 2
1.4 Definitions 3
2. Indicators 5
2.1 Is the Environment IDT Appropriate for Viet Nam? 5
2.2 Where Does Viet Nam Stand Today vis-à-vis the Environment IDT? 5
2.3 Proposed Intermediate Indicators 6
3. Percentage of the Population that has Long-Term Acc ess to Safe Water 8
3.1 Relevance of Indicator 8
3.2 Baseline and Trends 8
3.3 Key Factors to Achieving the Goals and Related Policies 9
3.4 Resource Allocation Implications 10
3.5 Monitoring 10
4. Forest Cover as a Percentage of Total Country Area 13
4.1 Relevance of Indicator 13
4.2 Baseline and Trends 14
4.3 Key Factors to Achieving the Goals and Related Policies 16
4.4 Resource Allocation Implications 18
4.5 Monitoring 18
5. Percentage of Water and Air-Quality Monitoring Stat ions Showing Improvements over the Baseline
20
5.1 Relevance of Indicator 20
5.2 Baseline and Trends 20
5.3 Key Factors to Achieving the Goals and Related Policies 21
5.4 Resource Allocation Implications 21
5.5 Monitoring 22
Annex 1: Terms of Reference for Localising the Environment IDT 23
Annex 2: Outline of Viet Nam Development Target Papers 26
Annex3: Working Group Ranking of Potential Indicators 27
Page 2 of 34

ABBREVIATION AND ACRONYMS
SUMMARY
5MHRP 5 Million Hectares Reforestation Programme
BOT Build-Operate-Transfer
CEMMA Committee on Ethnic Minorities and Mountainous Areas
CERWASS Centre for Rural Water Supply and Environment Sanitation (under MARD)
DARD Department of Agriculture and Rural Development (provincial authorities under MARD)
DFD Department of Forest Development (under MARD)
DfID Department for International Development (UK)
FIPI Forest Inventory and Planning Institute (under MARD)
FPD Forest Protection Department (under MARD)
GDP Gross Domestic Product
HCMC Ho Chi Minh City
HMS Hydrometeorological Services
IDT International Development Target
IUCN World Conservation Union
JICA Japan International Co-operation Agency
MARD Ministry of Agriculture and Rural Development
MDG Millennium Development Goal (combines IDTs and MGs)
MG Millennium Goal
MOC Ministry of Construction
MOSTE Ministry of Science, Technology and the Environment
MPI Ministry of Planning and Investment
NEA National Environment Agency (under MOSTE)
NGO Non-Governmental Organisation
OECD Organisation for Economic Cooperation and Development
PTF Poverty Task Force (government, donor, NGO)
UNCED United Nations Conference on Environment and Development
UNDP United Nations Development Programme
UNEP United Nations Environment Programme
UNICEF United Nations Children's Fund
UNIDO United Nations Industrial Development Organisation
VND Vietnamese Dong
VNS Viet Nam News Service
WWF World Wide Fund for Nature, Indochina Programme
Page 3 of 34

Poverty and the Environment Linkages. Though Viet Nam has made tremendous progress in reducing poverty, there has been a general decline in environmental resources. The poor suffer more than, the non-poor from this down turn. There are several reasons for this. The first is that the poor are generally more dependent upon natural resources than the better-off. Most of Viet Nam's poor still depend upon subsistence agriculture for survival, and as water and soil quality degrade, so too do their livelihoods. The poor are also less able to protect themselves from environmental pollution or afford to treat the health problems pollution causes. Furthermore, poor households suffer more from natural disasters because they have fewer resources to help rebuild their lives subsequently.
Fortunately, the environment-poverty linkage goes both ways, and improvements in the environment can help reduce poverty. Improving water supplies, for instance, can improve health and reduce the amount of time spent collecting water, allowing time for other tasks. Reducing the impact of natural disaster on the poor can make livelihoods and food supplies more secure. Improvements in natural resource management can help the poor who are dependent upon natural resources improve their wellbeing. Thus, general environmental improvements are likely to benefit the poor.
What is the International Development Target (IDT) for the environment? The implementation of national strategies for sustainable development in all countries by 2005, so as to ensure That current trends in the loss of environmental resources are effectively reversed at both global and national levels by 2015.
Is the Environment IDT Appropriate for Viet Nam? In short, yes. The IDT mirrors the government objective of implementing a national strategy for sustainable development and fits well with the government's commitment to reversing the loss of environmental resources.
Where Does Viet Nam Stand Today vis-à-vis the Envir onment IDT? Viet Nam has already achieved the first part of the IDT (implementing a national strategy for sustainable development by 2005), but like most countries, has some way to go on the second.
No single indicator will show when the loss of environmental resources has been reversed because this is a summary target that reflects a number of changes on the ground. Thus, to track progress towards the IDT, intermediate indicators are needed, and these indicators have to be appropriate to Viet Nam's development context—they have to be localised. Four intermediate indicators were chosen by the government-donor environment IDT working group on 10 August 2001.
Percentage of the population that has long-term acc ess to safe water. This indicator measures the number of people with long-term access to safe water as a percentage of the total number of people. This is a widely used indicator nationally and internationally because it is cross-cutting and simultaneously gives information on the environment, health and infrastructure.
Summary of Intermediate Indicators
There is no official Vietnamese definition for "access to safe water". There are definitions for "clean water" for surface and ground water (TCVN 5942-1995 and TCVN 5944 -1995 respectively), and Decision No. 505 by the Ministry of Health references safe water but does not give a definition1. In practice, the proxy indicator of "improved water" sources is used to collect data in Viet Nam.
This indicator has been increasing steadily for more than a decade at about 0.8 percent a year. It is now at 52
Indicator 1990 1995 Latest Value
Current Targets Source of Verification
2005 2010 2015
Percentage of the population that has long-term access to safe water
56% (2000)
69% 85% 93% MARD and MOC data
Forest cover as a percentage of total country area
29% 28% 33% (1999)
38% 43% FPD Forest Cover Report
Percentage of water and air-quality monitoring stations showing improvements over the baseline
base - line
58% (1999)
NEA State of Environment Report
Page 4 of 34
percent. Viet Nam has made significant progress on improving access to safe water but remains below most other countries regionally and globally. Given the rate of increase needed to reach the government target of 60 percent overall coverage by 2005, attaining this goal by 2005 is unlikely. This would require an increase of 4.8 percent per year, more than nine time the current rate. A more realistic goal is 80 percent coverage by 2015. This would still require a doubling of the current rate of increase in access to safe water.
There are several low-cost interventions that would improve the data collection system for this indicator. The first is to standardise the definition of "access to safe water". For Viet Nam, using the proxy indicator of "improved water sources" would help to standardise the data collection but not add many additional costs, The second is to focus more on preventing water pollution than on treating the water after the fact-it is more cost effective to prevent pollution than clean it up. Third, provide training for data collection people. This can be done by doing training-of-trainers at the central level and using these trainers to reach the province, district and commune levels.
Forest cover as a percentage of total country area. This indicator measures the amount of forested area as a percentage of the total country area. Forest cover is one of the most widely used national and international indicators for the environment. Internationally and regionally, Viet Nam compares favourably in forest cover. Unlike most of its neighbours, Viet Nam has in all probability stopped the decline in its forest cover. Given the current trends and the level of financial support, the government's target of increasing forest cover to 43 percent of the country area by 2010 is attainable.
Data collection on forest cover could be improved by first agreeing on an official definition of what constitutes forest cover. Second, have only one Vietnamese agency collect forest cover data rather than three (GSO, GDLA and FPD). Third, develop a scientific yet simple system of forest and forest land classification. Fourth, address the lack of up-to-date aerial photos of forest cover, lack of skilled photo interpreters, and lack of botany and Geology training for young professionals.
Policy Points for the Indicator
To ensure long-term Access, more emphasis is, needed on protecting watersheds. Increasing forests that protect watersheds is one area that would significantly long-term access to safe water. The evidence suggests that while the government already protects forests under its forestry laws, deforestation in watershed is still a problem.
To ensure safe water, more emphasis is needed on eliminating pollution points. The National Environment Agency is tasked with regulating environmental pollution but is a relatively new agency with a limited budget. Improvements in monitoring and enforcement of existing water regulations—particularly Article 18 of the Water Resources Law2—would have a significant impact on surface water quality.
Policy Points for this Indicator
While the programmes' quantity objectives are likely to be achieved, the quality of the resulting forest cover Non-native tree species have been widely planted in Viet Nam, and many of these trees are crowding out native species. Directive No. 19/1999CT-TTG and Decision No.175/1998/QD/BNN/KHCN both promote cropping native tree species but neither one goes so far as to support interspersed cropping of natives species in tree plantations. This would encourage more biological diversity in tree plantations.
Another policy issues is that there is domestic a large demand for lumber that is currently being met with imports from Lao PDR and Cambodia. Eventually, Viet Nam should be self-sufficient in lumber production. To meet long-term demand, Viet Nam will need policies that encourage production fast-growing softwood species and discourage the use of slow-growing hardwoods. Policy options for increasing private-sector participation in production forests should be explored, particularly, in conjunction with certified timber operations.
From NEA's State of Environment Report 2000:
� develop policies for cleaner production technologies with preferential tax
Page 5 of 34
Percentage of water and air-quality monitoring stat ions showing improvements over the baseline. This proposed indicator measures the percentage of the National Environment Agency's (NEA) air and water environmental monitoring stations that report improvements in readings over the 1995 baseline year (the oldest year for data). This indicator is based on data from NEA's annual State of the Environment report and tracks four common parameters in water and air pollution The indicator shows trends in the pollution levels of five major rivers in Viet Nam and six air pollution monitoring areas in industrial and urban areas. The data collection points are located in the north, central and south of the country in areas that are likely to be among the most polluted. While the majority of water and air-quality monitoring stations under NEA are reporting improvement over 1995 pollution levels, the trend for the four parameters measured is negative; each year, fewer stations are reporting better levels than the baseline year.
Data collection for this indicator could be improved by expanding the number of monitoring station, increasing the frequency of data collection, and adding several other pollution parameters to the aggregate indicator.
What Next? To better track the changes in the environment, Viet Nam needs intermediate indicators that monitor the trends in the green, blue and brown areas of the environment. Forest cover is a widely used and clear indicator of the "green" area of the environment. Access to safe water covers the poverty and people side of the "blue" area of the environment. For the "brown" area, water and air-quality monitoring give an indication of what are the trends in pollution levels. Overall, the three environmental indicators give a representative picture of trends in the environment and can help policy makers to determine progress towards sustainable development.
1. BACKGROUND
1.1 What are the International Development Targets?
In the 1990s there was a series of United Nations conferences to discuss key development issues, including the United Nation Conference on Environment and Development (UNCED) held in Rio de Janeiro in June 1992—the "Earth Summit". The results of the Rio conference and other UN conferences3 were brought together in a 1996 document produced by the Development Assistance Committee of the Organisation for Economic Cooperation and Development (OECD)4. This document contained the first draft of the seven International Development Targets (IDTs)5. The environment IDT was derived from the Rio conference outputs—mainly "Agenda 21" which sets a global blueprint for sustainable development in the 21st century.
Over the past five years, support for the IDTs has grown. They have now been endorsed by several UN agencies, the World Bank, the International Monetary Fund, the European Union, the OECD, 77 countries as part of the Cotonou agreement, and more recently 191 nations at the September 2000 UN Millennium Summit. The Millennium Summit's Declaration went further still and used the IDTs as a starting point for developing 11 "Millennium Goals" (MGs)6. The MGs added a number of new objectives and dropped two IDTS: those on reproductive health services and environmental sustainability. To better reconcile the differences between the IDTs and MGs, a third group of indicators is under development (as of August 2001). The UN agencies, the World Bank, the International Monetary Fund, and the OECD have drafted the "Millennium Development Goals" (MDGs). These are 8 general goals with 16 specific targets. The MDG for the environment is very similar to the environment IDT but two items have been added: "halve, between 1990 and 2015, the proportion of people without sustainable access to safe drinking water; and by 2020, have achieved a significant improvement in the lives of at least 100 million slum dwellers."
policies for enterprises that import and apply cleaner production technologies; � promulgate economic instruments supporting the "polluter pays principle" and
"users of the water should pay for the water"; � improve data collection quality; and � continue strengthening public awareness of water protection and management. � implement environmental impact assessment for all socio-economic
development projects; � develop use of liquid natural gas and light oil instead of coal and heavy oil,
which have a high-sulfur content; � encourage biogas in rural areas; and � develop clean energy from solar, wind and geothermal sources.
Page 6 of 34

Given the lack of an environment goal in the MGs and the draft nature of the MDGs, this report focuses on localising only the environment IDT. Access to safe drinking water is, however, included in the localized environmental IDT.
1.2 One of Many
This report is one of eight thematic reports drafted by separate working groups on localising the International Development Targets. The working group for this report was organised by the United Nations Development Programme and consisted of Ministry of Planning and Investment (MPI); Ministry of Agriculture and Rural Development (MARD); Ministry of Science, Technology and Environment (MOSTE); Committee on Ethnic Minorities and Mountainous Areas (CEMMA); Viet Nam Cleaner Production Centre; Japan International Co-operation Agency (JICA); United Nations Children's Fund (UNICEF); the United Nations industrial Development Organisation (UNIDO); United Nations Development Programme (UNDP); and the World Wide Fund for Nature (WWF).
WWF was asked to lead the formulation of this IDT report under Terms of Reference agreed by the working group (Annex 1). WWF has worked in the environment sector of Viet Nam since the mid-1980s and has more than 55 staff country-wide focusing on conserving the nation's environment and on sustainable development.
As one of the drafters of the seminal World Conservation Strategy in 1980 that gave currency to the term "sustainable development", WWF has long believed that conservation is not the opposite of development. "Humanity has no future unless nature and natural resources are conserved, and conservation won't happen without development to alleviate the poverty and misery of hundreds of millions of people", notes a recent WWF publication9. As an Organisation, WWF believes poverty and the environment are linked, and that it is possible to both improve the livelihoods of the poor and conserve the environment.
1.3 Poverty and the Environment
While Viet Nam has made tremendous progress in cutting poverty, with the average per capita income more than doubling in the 1990s, poverty is still widespread. Viet Nam is one of the most densely populated agricultural countries in the world,10 with a population that will double every 40 years at the current growth rate. The country has not yet found a comprehensive solution for its poverty and fast-rising population. One of the consequences is a general decline in environmental resources. This is a product of the vicious circle whereby poverty leads to the unsustainable use of natural resources and the unsustainable use of natural resources leads to greater poverty. The result is that the poor suffer more than the non poor. This is because environmental problems tend to affect the poor disproportionately. There are a number of reasons for this. The first is that the poor are generally more dependent upon natural resources than the better-off. Most of Viet Nam's poor still depend upon subsistence agriculture for survival, and as water and soil quality degrade, so too do their livelihoods. Second, the poor are less able to protect themselves from environmental pollution or afford to treat the health problems the pollution causes. The poor, for example, are less able to buy potable water if local sources are contaminated or to protect their homes from the dust and noise of polluting industries. Third, poor households suffer more from natural disasters because they have fewer resources to help rebuild their lives subsequently.
International Development Targets 8
1. A reduction by one-half in the proportion of people living in extreme poverty by 2015.
2. Universal primary education in all countries by 2015 3. Demonstrated progress towards gender equality and the empowerment of
women by eliminating gender disparity in primary and second education by 2005.
4. A reduction by two-thirds in the mortality rates for infants and children under age 5 by 2015.
5. A reduction by three-fourths in maternal mortality by 2015. 6. Access through the primary healthcare system reproductive health services for
all individuals of appropriate ages as soon as possible and no later than the year 2015.
7. The implementation of national strategies for sustainable development in all countries by 2005, so as to ensure that current trends in the loss environmental resources are effectively reversed at both global and national levels by 2015.
Page 7 of 34
On the positive side, improvements in the environment can help reduce poverty. Improving water supplies, for instance, can improve health and reduce the amount of time spent collecting water, allowing time for other tasks. Reducing the impact of natural disaster on the poor can make livelihoods and food supplies more secure. Improvements in natural resource management can help the poor who are dependent upon natural resources improve their wellbeing.
Fortunately, many of Viet Nam's environmental problems can be influenced by government policies. Deforestation, air, water and noise pollution, threats to endangered species, and natural disaster mitigation can all be affected by changes in government policy. Indeed, government policy is a key variable in reversing the decline in environmental resources.
From this, two major conclusions can be drawn:11
� general environmental improvements are likely to benefit the poor; � policies which address those environmental problems that disproportionately affect the poor will have a
strong pro-poor impact.
While the linkage between poverty and the environment is clear, there is also a linkage among poverty, the environment and gender. In Viet Nam, the poorest of thepoorareoftenfemate-headedhouseholds.12 Female headed households commonly have less access to resources, such as credit, education and land13, and are thus among the most vulnerable to environmental degradation and natural disasters.
Moreover, many women in Viet Nam determine where and when family members collect natural resources (e.g., firewood, drinking water, animal dung, edible plants, etc.).
Older women in particular often act as the leaders of a household's attitudes, knowledge and practices regarding the environment. The women in a community are a key leverage point for changing environmental awareness and practices as well as for alleviating poverty.
1.4 Definitions
Who Causes Environmental Degradation? A Common Misc onception
Many people, world-wide, believe that environmental degradation is caused by poor people. Yet there is growing international evidence that while poor people cause some environmental degradation, they are not the primary cause. Poor people generally have limited means of impacting their environment—a hand saw for cutting trees, a small fishing boat, or a household industry. In Viet Nam, as in other countries, it is the economically better-off (often from outside an area) who have the capital to finance tools that impact the environment in a much bigger way—chain saws and saw mills, dynamite and cyanide supplies for fishing, and large-scale industry. While the cumulative impact of a lot of poor people making smaller impacts on the environment can add up to significant degradation, it is the medium to large environmental exploiters who in many countries impact the environment the most. Fortunately, medium to large exploiters are generally more easily controlled by governments given their need for access to larger markets.
The Seventh Generation
The 18th century Iroqouis confederation of Native American tribes in the north-eastern U.S. used a unique approach to sustainable development. When the Iroquois held a council meeting to decide an issue, one member first spoke this invocation: "In our every deliberation we must consider the impact of our decision on the next seven generations." A member of the council was then appointed as a representative who spoke specifically for those who would live a hundred and fifty years in the future. The Iroquois were practising key sustainable development concepts more than 250 years ago and in fact were also practising an early form of environmental and social impact assessments.
Page 8 of 34

It is difficult to know when a country reaches a target such as the IDTs unless one first defines key terms. The IDT for the environment is:
The implementation of national strategies for sustainable development in all countries by 2005, so as to ensure that current trends in the loss of environmental resources are effectively reversed at both global and national levels by 2015.
The three key terms above are "national strategies", "sustainable development", and "loss of environmental resources".
National Strategies. The Development Assistance Committee of OECD defines a national strategy as "a strategic and participatory process of analysis, debate, capacity strengthening, planning and action towards sustainable development".14 This report follows the OECD definition with its emphasis on a process rather than a document.
Sustainable Development. Defining sustainable development is more problematic. The Ministry of Planning and Investment's Viet Nam Capacity 21 Project15 defines it as "development that aims to meet the needs of Viet Nam today, while conserving its ecosystems on which life depends for the benefit of future generations".16
In 1987, the Brundtland Commission defined it as "development which meets the needs of the present without compromising our ability to meet those of the future".17 The Rio Declaration refined the Brundtland definition as "development that meets the needs of the present without compromising the ability of future generations to meet their own needs."18 While the Rio Declaration contains perhaps the best definition, all of the explication fails to say what sustainable development is.
Sustainable development can be characterised as having three "pillars": economic, social and environmental development, Thus, for development to be sustainable, there has to be: (a) sustainable economic growth;19 (b) sustainable social development; and (c) sustainable use of natural resources. For long-term sustainability, the three have to develop in unison.
The focus of this report is on the environment. Thus, this report looks at only the environment "pillar" of sustainable development. The other two pillars are covered by separate IDT thematic groups ("access to economic opportunities" and "social protection")." Yet only by combining economic, social and environmental indicators can one measure progress towards sustainable development. So this report can only be a partial contribution to developing sustainable development indicators.
Loss of Environmental Resources. This means the physical loss or degradation of natural resources. It is the sum of the decline in natural forests, the loss of wildlife, the over-fishing of near-shore areas, industrial pollution, the decline in water quality, the rise in air pollution—all those things that degrade the environment.
2. INDICATORS
2.1 Is the Environment IDT Appropriate for Viet Nam ?
In short, yes. The IDT mirrors the government objective of implementing a national strategy for sustainable development and fits well with the government's commitment to reversing the loss of environmental resources.
2.2 Where Does Viet Nam Stand Today vis-à-vis the E nvironment IDT?
There are two parts to the environment IDT: (a) implementing a national strategy for sustainable development by 2005; and (b) reversing the loss of environmental resources by 2015.
Viet Nam has already achieved the first part but has some way to go on the second. Those who are more interested in the proposed indicators can skip the section below examining where Viet Nam is today and go directly to the indicators.
National Strategy for Sustainable Development. By the definition given earlier, Viet Nam has had a sustainable development strategy for more than a decade. In 1988, the government approved the National Conservation Strategy. This document formed the basis for the first National Strategy on Environment and Sustainable Development, 1991-2000, presented by the Viet Nam delegation at the Rio conference in 1992.
Page 9 of 34

While it technically met the definition of a national strategy for sustainable development by following a "strategic and participatory process", the process itself was weak. The budget and staff to implement the strategy were less than what was needed. A government agency specifically tasked with protecting the environment was not created until 1994, and environmental resources have often been sacrificed for economic gains.21
By the mid-1990s, the environmental trends were becoming worrisome, particularly in forestry. The 327 Programme ("Regreening the Barren Hills") began in 199222 and provided direct payments to households in exchange for protecting specific tracts of forest. The State Forest Enterprises were also paid to plant areas of forests. In 1997, the government "closed the forests", effectively cutting state timber production by 80 percent.
By the late 1990s, the government's interest in and ability to address environmental problems were much stronger. The 327 Programme had been followed by the much more ambitious 661 Programme ("5 Million Hectares Reforestation Programme"). Moreover, the number of protected areas was significantly expanded, pollution controls were put in place for some industrial zones, pilot environmental funds began operating in several parts of the country, new laws on environmental protection and water resources management were promulgated, and a host of other advances were achieved-all making the country's environment more sustainable.
In 1998, the National Environment Agency began the process of drafting a second-generation national sustainable development strategy. The process was highly participatory was collected from all 61 provinces, 35 government agencies, and more than 200 international development partners. A lot of analysis, debate and planning went into the new strategy. The final version of the National Strategy for Environmental Protection, 2001-2010, was submitted to the Prime Ministeris office in July 2000. (The implementation of this strategy is detailed in the government's National Environmental Action Plan, 2001-2005, finalised in December 2000.)
The National Strategy for Environmental Protection, 2001-2010, uses sustainable development as a fundamental starting place. "The overall goal of the National Strategy for Environmental Protection is to: protect and improve the environment to enhance the quality of life and health of the people and to ensure sustainable development of the country".23
The strategy's authors also recognised that the National Strategy has to be part of the overall socioeconomic development strategy or it will fail. "The National Strategy for Environmental Protection should be an integral part of the socioeconomic development strategy and not separate from it."24 Fortunately, this is the case.
Viet Nam's Socio-Economic Development Strategy, 2001-2010, is the macro strategy that provides the road map and the directions for Viet Nam during the next 10 years. The document was drafted by the Party's Central Committee with substantial input from line ministries and provincial governments and incorporates sustainable development throughout. It echoes the three pillars of sustainable development in its chapter on "Strategic Goals and Development Approach" where it states that the development approach is "rapid and sustainable development by ensuring economic growth, accompanied by social equality and progress, and environmental protection".25 Thus, Viet Nam clearly has a national sustainable development strategy, and the strategy is a process and not just a document.
Reversing the Loss of Environmental Resources . Meeting this part of the IDT is where Viet Nam, like most countries, faces the toughest challenges. The loss of environmental resources in Viet Nam has been precipitous (see box below). Making it more difficult yet, the government and donors agreed that all the Viet Nam IDTs will be synchronised with government strategies that run from 2001-2010. This means that Viet Nam will now strive to reverse the loss of environmental resources by 2010 rather than 2015.
Directive No. 36/CP-TW
In 1998, the Politburo issued Directive No. 36/CP-TW. This directive is one of the most important on the environment because it sets the basic policy direction. The directive specifically mentions sustainable development. "Environment protection is the work of the whole Party, People and Army as an inseparable part of socio-economic development at all levels and sectors; and as the basis for ensuring sustainable development and successful implementation of the industrialisation and modernisation of the nation".
Page 10 of 34

There is no single indicator that will show when the loss of environmental resources has been reversed because this is a summary indicator that reflects a number of changes on the ground. Thus, to track progress towards the IDT, intermediate indicators are needed, and these indicators have to be appropriate to Viet Nam's development context—they have to be localised.
2.3 Proposed Intermediate Indicators
The proposed intermediate indicators are:
A. Percentage of the population that has long-term access to safe water.
B. Forest cover as a percentage of total country area (with two sub-indicators).
C. Percentage of water and air-quality monitoring stations showing improvements over the baseline.
The initial indicators were chosen by the government-donor environment IDT working group on 10 August 2001. The indicators were revised after the Hai Phong workshop (17-19 September 2001) and a subsequent meeting of the government-donor environment IDT working group on 27 September 2001. The current intermediate indicators reflect the outcome of 27 September meeting, attended by MPI, MARD, NEA, the Viet Nam Cleaner Production Centre, UNDP and WWF.
The intermediate indicators were chosen based on the following criteria: (a) results based, measures outputs rather than inputs; (b) poverty and sustainable development linkages; (c) feasible, easy to monitor, and data are already collected.
3. PERCENTAGE OF THE POPULATION THAT LONG-TERM ACCE SS TO SAFE WATER
3.1 Relevance of Indicator
This indicator measures the number of people with long-term access to safe water as a percentage of the total number of people. This is a widely used indicator because it is cross-cutting and simultaneously gives
Year National Environmental Strategy or Action Plan Started 26
Malaysia 1991
Vietnam 1992
Indonesia 1992
China 1994
Lao PDR 1995
Cambodia 1999
Thailand more
Viet Nam's Environmental Plight
� The country's biodiversity is in peril with over 700 species listed in the Red Data Book of Viet Nam, and the survival of third of Viet Nam's mammal species threatened.
� Forest cover is roughly two-thirds of what it was 50 years ago. � Groundwater is decreasing in both quality and quantity � Near-shore fish catches have declined sharply, and the number of fishing
boasts has grown rapidly. � Urban air pollution is increasing as the number of vehicles and traffic jams
increases. � Pesticide and fertiliser use are growing exponentially.
Page 11 of 34
information on the environment, health and infrastructure.
To measure this indicator accurately takes nation-wide monitoring of water quality, quantity and access-this is expensive, particularly for a poor country. Thus, several proxy indicators have been developed. The World Bank-compiled World Development Indicators use "Unproved water sources" as a proxy for access to safe water.27 The World Health Organisation, ironically, focuses not on the "safe" portion of the indicator but on "access". It uses a proxy indicator of "the existence of a water outlet within a reasonable distance."28
The National Clean Water Supply and Sanitation Strategy tip to Year 2020 notes that the definition of "safe water" is the same as "clean water". This strategy defines "clean water" as water that meets the 51 parameters in Ministry of Health Standard 505. Other relevant standards include TCVN 5942-1995 for clean surface water, TCVN 5944-1995 for clean groundwater, and TCXD 233-1999 on selecting surface and groundwater for a water supply system.
Because of the difficulty of checking if water meets all the government standards, the de facto indicator of access to safe water (or "clean water") used in most areas of Viet Nam is "access to improved water sources", meaning water from an inside or outside private tap, a public standpipe, a drilled well with pump, a hand-dug well, spring water with filter system, or rain water.29 This is a legitimate indicator. "Access to improved water sources" is the most widely used indicator internationally and is the proposed indicator under the Millennium Development Goals.
UNICEF works extensively with the government to improve access to safe water and has proposed a working definition of access to safe water with three parameters: (a) quantity (20 litres/person/day); (b) quality (transparent, colourless, tasteless and odourless); and (c) access (a distance of 200 to 500 meters to safe water).30 This definition is more comprehensive than most international definitions and would require a more rigorous data collection process but would return higher quality data.
Policy Link 31. Government policy has a moderately strong link to safe water access. In most areas of Viet Nam, the government provides the primary resources to help communities build long-term safe water sources. Given, however, how important safe water is to community wellbeing, even without policy support this indicator is likely to improve as living standards improve.
Equity Impact 32. This indicator has a strong pro-poor impact. The poor are those least able to afford to buy safe water when it is not readily available. The poor are also the ones who are least able to afford medical treatment for illnesses caused by bad water.
3.2 Baseline and Trends
The population of Viet Nam in 2000 was about 78 million, 52.5 percent of whom had access to safe water (41 million).33 This is an increase from 39.0 percent in 1998. The government's goal is 85 percent overall coverage by 2010 and 100 percent coverage by 2020.34
Establishing a baseline is difficult. While data exist for access to safe water for years prior to 1998, the was no standardized methodology or agreed institutions in charge of collecting the data. In 1997, a Danish-funded project unified the various data collection and monitoring systems. Data before 1998 varies widely.35 The critical difference in the data was the multiplier used to determine how many people could be served by one well. (The Monitoring section below has more on this.) Thus, 1998 is the oldest year for which agreed information exists.
Baseline: 39% in 1998
Viet Nam is on the lower end regionally and globally for access to safe water.
3.3 Key Factors to Achieving the Goals and Related Policies
"Clean water" is the government's third highest priority overall after irrigation and education.36 Thus, the institutional, financial and policy environments for this indicator are largely in place. The Water Resources Law (No. 8/1998/20/May 1998) put the policies in place to manage water resources at the watershed level and clearly indicates the government's commitment to improving water supply in rural and urban areas.
Page 12 of 34

From 1998 to 2000, Viet Nam increased overall access to safe water by 13 percent—an average of 4.6 percent per annum. This is one of the fastest growth rates in the world. Sri Lanka, Nepal and Paraguay were the countries with the greatest increases in access to safe water during the last decade according to UNICEF data, yet these countries averaged only about 1.7 percent growth in coverage annually.38 To meet the government's goal of 85 percent overall safe water coverage by 2010 and 100 percent coverage by 2020, Viet Nam needs an average growth rate of 3.3 percent per year from 2000 to 2010 and an average annual growth of 1.5 percent from 2010 to 2020. Achieving these goals are possible provided the government maintains access to safe water as a funding priority for the next 20 years.
A primary bottleneck for increasing access to safe water in Viet Nam is that around.35 percent of the rural population gets their water from untreated surface sources.39 It is more difficult to protect the quality of surface water sources. As in many countries, Viet Nam uses surface water for irrigation and disposal of wastes as well as for people. Once polluted, it is generally difficult to treat surface waters. Boiling water to kill microbial contaminates is the most common form of surface water treatment. This does not, however, eliminate many of the environmental pollutants such as fertilizers, which are an increasing problem.
Policy Points. 40 To ensure long-term access to water resources, more emphasis is needed on protecting watersheds. Increasing forests that protect watersheds is one area that would significantly improve long-term access to safe water. The evidence suggests that while the government already protects watershed forests under its forestry laws, deforestation in watershed is still a problem.
To ensure safe water, more emphasis is needed on eliminating pollution points. The National Environment Agency is tasked with regulating environmental pollution but is a relatively new agency with a limited budget.
Dublin Statement on Water and Sustainable Developme nt37
Viet Nam has adopted the four guiding principles agreed at the 1992 Dublin International Conference on Water and the Environment for its National Rural Clean Water Supply and Sanitation Strategy:
� Freshwater is a finite and vulnerable resource, essential to sustain life, development and the environment
� Water development and management should be based on a participatory approach, involving users, planners and policy-maker at all levels.
� Women play a central part in the provision, management and safeguarding of water
� Water has an economic value in all its competing uses and should be recognized as an economic good.
Page 13 of 34
Improvements in monitoring an enforcement of existing water regulations—particularly Article 18 of the Water Resources Law41—Would have a significant impact on surface water quality.
3.4 Resource Allocation Implications
The Ministry of Planning and Investment estimates that given current water consumption levels and population projections, from 1999 to 2020 about USD150 million (VND2.2 trillion) in investment capital will be required annually42.
Historically, much of the financing for new water infrastructure has come via loans or grants from UNICEF, Finland, Denmark, Australia, the Netherlands UK, Japan, the World Bank and the ADB. The 1998 Water Resources Law encourages private sector investment in the water sector, but the majority of the needs are in rural areas where few economies of scale exist, and there is little potential for private-sector water profits. Urban areas have been more successful in attracting private sector water investments. At least one private sector Build-Operate-Transfer (BOT) urban water supply project is now operational (Binh An Water Treatment Plant for HCMC).
3.5 Monitoring
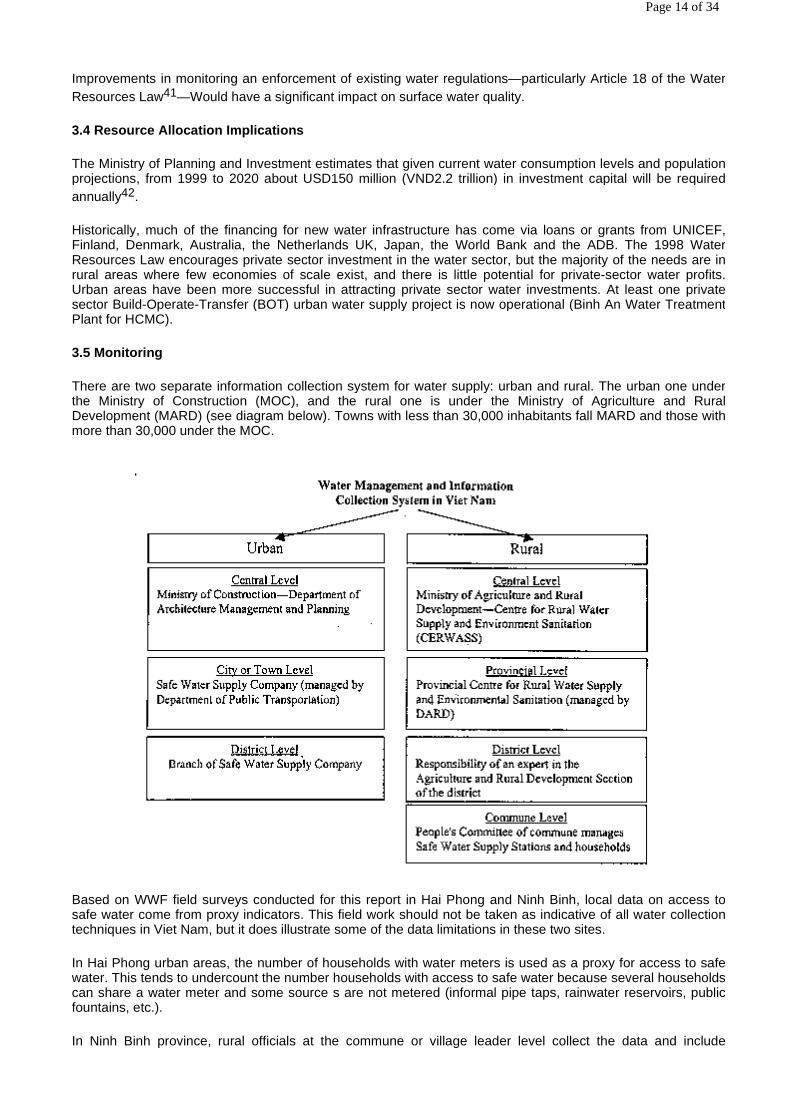
There are two separate information collection system for water supply: urban and rural. The urban one under the Ministry of Construction (MOC), and the rural one is under the Ministry of Agriculture and Rural Development (MARD) (see diagram below). Towns with less than 30,000 inhabitants fall MARD and those with more than 30,000 under the MOC.
Based on WWF field surveys conducted for this report in Hai Phong and Ninh Binh, local data on access to safe water come from proxy indicators. This field work should not be taken as indicative of all water collection techniques in Viet Nam, but it does illustrate some of the data limitations in these two sites.
In Hai Phong urban areas, the number of households with water meters is used as a proxy for access to safe water. This tends to undercount the number households with access to safe water because several households can share a water meter and some source s are not metered (informal pipe taps, rainwater reservoirs, public fountains, etc.).
In Ninh Binh province, rural officials at the commune or village leader level collect the data and include
Page 14 of 34

households that have water Meters, wells, piped water supply, or rainwater storage Facilities. (At least in theory. "In many cases, the number [percentage given in reports] is 'developed' based on political will", noted a Ninh Binh provincial official.43)
Both of these data collection criteria fall under the "improved water sources" definition got only used internationally. While the data do not directly address access or water quality, they are easy to compile and give a relative indication of improvements to water supply.
There is a national water quality monitoring system that cover 46 provinces and urban areas, but the field work found that there are no regular water quality monitoring systems in place in the two jurisdictions visited. Water samples were collected ad hoc and checked by the local branches of Ministry of Health for a cost of about VND500,000-400,000 (USD34-27) each. Other institutions, such as the University of Mining and Geology and the National University of Natural Science, also check water quality, although they do not have the legal power to certify the quality.
The field data on water sources show that in the rural areas outside Hai Phong city, the most frequent sources of "safe water" were: rainwater storage (51 percent); haild-dug wells (28 percent); and "UNICEF" wells— the local term for a drilled well (21 percent).
There are two critical assumptions underlying the data on access to safe water: the equivalent ratio and the multiplier 'norm'. The General Statistic Office calculates an "equivalent ratio" for the number of people who have access to safe water. If there are, for example, ten wells in one commune but only eight can be used (due to quantity, quality or access problems for instance), the equivalent ratio is 0.8. This number is then multiplied with a 'norm' such as "one well can serve 100 people" and the total number of people with "access to safe water" is thereby determined.
In developing a more comprehensive safe water monitoring system, one has to weigh the costs and benefits of changing data collection. An indicator that includes water quality, quantity and access would be more robust but also expensive to do in a country with 78 million, mostly rural, people. In the interim, there are several low-cost interventions that would improve the data collection system. The first is to standardise the definition of "access to safe (or clean) water". For Viet Nam, using the proxy indicator of "improved water sources" would help make the de facto system official and more consistent. The second is to focus more on preventing water pollution than on treating the water after the fact—it is more cost effective to prevent pollution than to clean it up. Third, provide training for data collection people. This can be done by doing training-of-trainers at the central level and using these trainers to reach the province, district and commune levels.
4. FOREST COVER AS A PERCENTAGE OF TOTAL COUNTRY AR EA
4.1 Relevance of Indicator
This indicator measures the amount of forested area as a percentage of the total country area. Forest cover is one of the most widely used international indicators for the environment. It is easily understood, and the economic, social and environmental significance of forests are supported by voluminous scientific work.44
Changes in Viet Nam's forest cover have been tracked for more than 50 years; and this indicator is noted in the National Strategy for Environmental Protection, 2001 - 2010, as one of the strategy's key "Performance Indicators".45
For a mountainous, irrigated-agriculture country such as Viet Nam, forest cover has a strong impact on sustainable development. As forest cover declines, the trees' tempering effect is lost and peak weather events become more severe (floods, droughts, typhoons, mudslides, saltwater intrusion). The largest floods in the Mekong delta for more than 70 years during 2000, the large-scale flooding of the central -provinces in 1999, and the regional droughts in 1998 and 1997 are recent examples of climatic events that were made worse by watershed deforestation.
Such extreme weather events have a disproportionately higher impact on the poor because they have few resources to help them recover. Forest degradation also has a higher impact on the rural poor because they often rely on forest resources to supplement livelihoods.
Forest Cover, Poverty and Ethnic Minorities
Page 15 of 34
An increase in forest cover, on the other hand, helps limit soil erosion, provides a better catchment for rainwater, supplies fuel and building material for local communities, increases job opportunities in forestry, makes timber exports-more sustainable, and nurtures a number of non-timber forest products (e.g., honey, rattan, commercially valuable flowers, medicinal plants).
Moreover, for many of the poorest people in Viet Nam—particularly ethnic minorities—nearby forests are a form of insurance. In times of food shortage, a common coping strategy of the poor is to collect edible forest plants and animals as well as forest items that they can potentially sell. Thus an increase in forest cover may also help reduce malnutrition when food is scarce in poor, rural communities.
Given forest cover's linkage to poverty and sustainable development, Viet Nam, like many countries, is actively working to reverse the loss of forest cover. The 5 Million Hectares Reforestation Programme and the government-donor Forest Sector Support Programme are two key initiatives to increase forest cover.
Policy Link. Changes in the country's forest cover are quite sensitive to policy changes, as evidenced by the growth in forest cover after the curtailing of state timber operations in 1997 and the impact of the 327 and 661 forestry programmes.
Equity Impact. The equity impact of increases in this indicator is likely to be pro-poor—particularly rural poor—because of the livelihood benefits from more trees (i.e., more resources for poor households and less vulnerability to extreme weather events) .47
Forestry sub-indicators
Looking at forest cover alone gives an incomplete picture of forests as they relate to biodiversity, poverty alleviation, and sustainable development. Several sub-indicators can help provide a fuller picture of forests in Viet Nam: (a) the percentage of Country area that is within a "special-use forest" (protected area); and (b) representation of species diversity in the special-use forest system.
A. Percentage of country area that is within a spec ial-use forest. Terrestrial protected areas in Viet Nam comprise "special-use forests" (national parks, nature reserves, and cultural and historic sites) but do not include Marine Protected Areas.48 This sub-indicator measures the area within special-use forest as a percentage of total country area. The percentage of country area within protected areas is internationally a widely used indicator.49
This indicator is relevant given that protected areas have a long-term relationship to sustainable development. They act as the country's reservoir of biodiversity—genetic diversity, species diversity, and ecosystem diversity. Viet Nam's biodiversity has a potentially high economic value.50 Globally, fewer than 1 percent of tropic forest, species have been examined for their chemical compounds.51 Yet even from this tiny percentage, more than 120 prescription drugs have originated from tropical plants (e.g., quinine, steroids, muscle relaxants, anticancer drugs), and Viet Nam's plants alone constitute a potential wealth of new treatments for illness.
Moreover, protected areas in Viet Nam also act as the country's water filters, catchment areas, and places of natural beauty. They provide homes to some of the world's rarest mammals including the Javan Rhino, the Cat Ba Langur, the Tonkin Snub-Nosed Monkey, and the Sao La—all of which are critically endangered. Viet Nam is a recognised centre of origin and diversity52 for a number of economically important plant species such as green tea, litchi, longan, jute, mung bean, taro root several species of rice, and a type of orange.53
While protected areas generally do not have a large scale poverty impact, those poor who live around protected areas often benefit because the protected area helps make local development more sustainable and
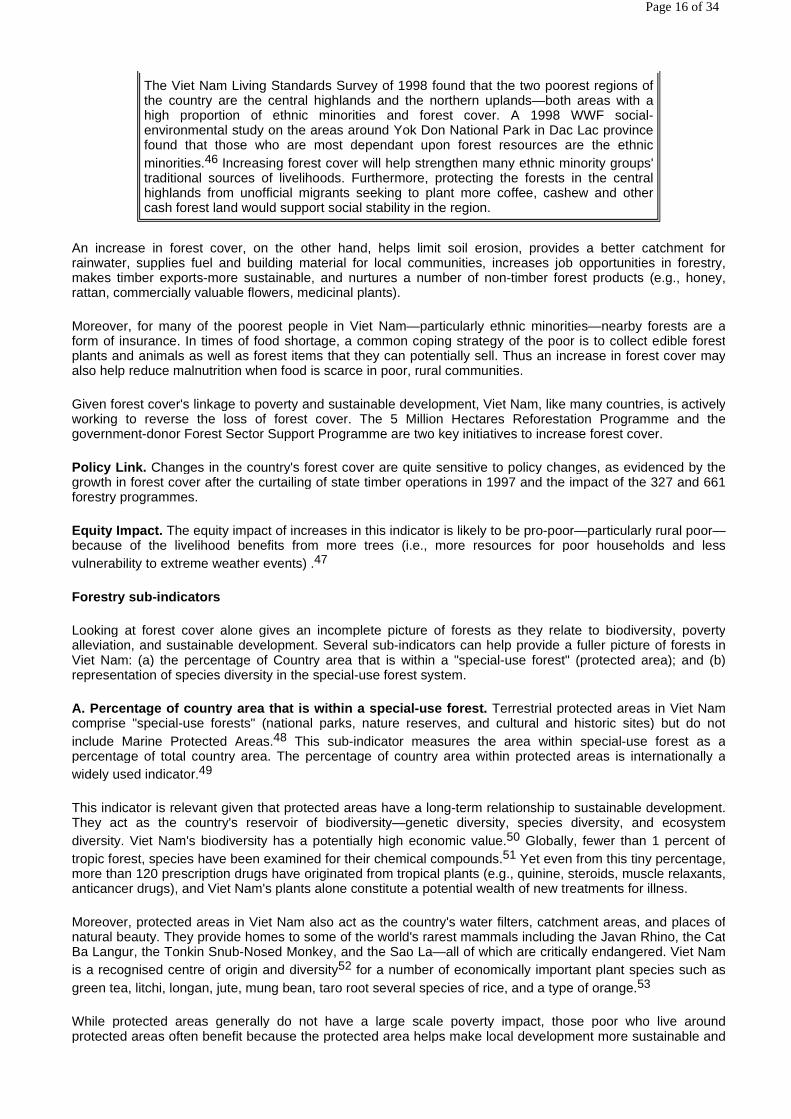
The Viet Nam Living Standards Survey of 1998 found that the two poorest regions of the country are the central highlands and the northern uplands—both areas with a high proportion of ethnic minorities and forest cover. A 1998 WWF social-environmental study on the areas around Yok Don National Park in Dac Lac province found that those who are most dependant upon forest resources are the ethnic minorities.46 Increasing forest cover will help strengthen many ethnic minority groups' traditional sources of livelihoods. Furthermore, protecting the forests in the central highlands from unofficial migrants seeking to plant more coffee, cashew and other cash forest land would support social stability in the region.
Page 16 of 34

provides new opportunities for income.
B. Representation of species diversity in the speci al-use forest system. Viet Nam's plants and animals all live in specific ecosystems. If all of these ecosystems are included within the protected area system, a representative sample of the country's plant! and animals will also be included. This sub-indicator measures the number of ecosystems that are underrepresented or missing in the country's special-use forest system. Thus, this sub-indicator of underrepresented or missing ecosystems in the special-use forest system is a proxy for species diversity within the special-use forests.
4.2 Baseline and Trends
Viet Nam's area is 33 million hectares. In 1999, forest covered 10.9 million hectares (33.2 percent) according to Mr Le Sau, Director of the Forest Inventory and Planning Institute.54 (The Monitoring section below gives a detailed analysis of the quality of the data underlying this indicator.)
Baseline: 29% in 1990
Internationally and regionally, Viet Nam compares favourably in forest cover. Unlike most of its neighbours, Viet Nam has in all probability stopped the decline in its forest cover. The country's total forest coverage also compares favourably with that of almost any other country. The average national forest cover world-wide according to the 2001 World Development Indicators, is 29.7 percent.
Forestry sub-indicators
Percentage of country area that is within a special -use forest. Viet Nam has committed itself under the Convention on Biological Diversity (signed in November 1994) to increase the coverage of the protected areas system. To meet this obligation and its own environmental priorities, the government has been expanding the special-use forests coverage, with a plan to double the amount of special-use forests from the current 1 million hectares to 2 million hectares (an increase from 3 to 6 percent of the country's area).
Baseline: 2,7 % in 1990
Internationally and regionally, Viet Nam falls short of many other countries in protected area coverage. World-wide, the average country has 6.5 percent of its total land area within protected areas.
Representation of species diversity in special-use forests. Based on a joint Forest Inventory and Planning Institute and BirdLife International study in 1999,55 the current system of decreed special-use forests in Viet Nam has a number of gaps in coverage. Under the Government forest types, evergreen forest, which accounts for 64% of the remaining natural forest in Viet Nam, is seriously underrepresented within the current system, particularly at elevations between 300 and 1,200m, Semi-deciduous forest is also underrepresented within the current system, particularly at elevations above 300 m, where less than 2% of the remaining forest is included within the current system.
Page 17 of 34

Growth of Viet Nam's Special-Use Forest Coverage
Year Total Area (ha) Government Decree
1962 1 25,000 72/TTg (Cuc Phuong)
1977 11 69,310 41/TTg (Ba Be, Ba Mun, Ba Vi, Bac Son, Ban Dao Son Tra, Den Hung, Pac Bo, Rung Thong Da Lat, Tam Dao, Tan Trao)
1978 12 104,310 360/TTg (Nam Cat Tien)
1982 13 114,310 65/HDBT (Mom Ray)
1984 14 120,310 85/CT (Con Dao)
1986 86 889,822 79/CT (Cat Ba) and 194/CT (73 sites, of which two were later combined to form Pu Mat; one later became Yok Don)
1991 86 908,022 352/CT (Yok Don)
1993 87 916,531 unknown (U Minh Thuong)
1994 90 943,631 47/TTg (Tram Chim), 4893/KGVX (Xuan Thuy) and 4895/KGVX (Tien Hai)
Page 18 of 34

Sources: BirdLife International and the Forest Inventory and Planning Institute (2001). Note: area refers to area stated on decree.
Under the ecoregions defined by Wikramanayake et al.56 (1997), there are 13 ecoregions in Viet Nam with more than 5,000 ha of natural forest. Within these ecoregions, there are six that are underrepresented: Red River Freshwater Swamp Forests; Northern Viet Nam Coastal Moist Forests; Eastern Indochina Moist Forests; the Northern Indochina Subtropical Forests; Kon Turn Montane Forests; and Da Lat Montane Forests. Significantly, the last three ecoregions support a large proportion of the plant and animal species endemic to Viet Nam.
Perhaps the biggest gap in the current system is the under-representation of wetland habitats. Within the current system, there are a few wetland sites in the Mekong and Red River Deltas, such as Xuan Thuy Nature Reserve and Tram Chim National Park, but they are insufficient to represent the full range of biodiversity and biological processes in these areas, The wetlands of central Viet Nam are completely unrepresented within the current system.
A number of species found only in Viet Nam (endemic species) are not represented within the current system at all or are represented in only one protected area57. At least three provinces with forested areas have special-use forest under their jurisdiction.
Baseline: 2 forest types and 6 ecoregions are under represented in the special-use forest system, 1991 58
4.3 Key Factors to Achieving the Goals and Related Policies
For the forest cover indicator, the institutional, finance and policy environments are reasonably strong. Compared to other areas of the environment, the forestry sector is one of the few that is likely in the short term have a positive impact on sustainable development.
Achieving the goal of an increase in forest cove largely a matter of planting more trees (obviously) natural regeneration. Given the current trends and level of financial support, the government's target of increasing forest cover to 43 percent of the country area by 2010 is attainable.
The 43 percent target was chosen because this was the forest cover at independence in 1945. The question remains, however, why 43 percent? Perhaps 35 percent or 25 percent of well-managed forests would be sufficient to meet the country's needs. There has been no analysis of what level of forest cover is optimal for sustainable development, and given Viet Nam's increasing population pressure, a balance will have to be found between forest cover and farm land.
Regardless of what the target is for forest coverage, many of the basic policies and programmes for improving this indicator are already in place. The ongoing 5 Million Hectares Reforestation Programme (5MHRP) enjoys a large amount of support from government and donors alike. This is the primary programme increasing forest cover in Viet Nam. The 5MHRP activities are still being refined, but a recent analysis suggests that for the programme to be sustainable (and hence forest cover to be sustainable), several issues should be addressed:59
� the classification of forest land should follow standard criteria under a single agency; � the forest land allocation process needs to be improved so that more people have a long term interest in
1996 92 997,566 970/TTg (Ke Go) and 791/TTg (Ta Kou)
1998 93 1,002,076 1026/TTg (Thanh Phu)
The 5MHRP and Sustainable Development
The objectives of the 5 Million Hectares Reforestation Programme mirror the sustainable development pillars of economic, social and environmental developments. The 5 Million Hectares Reforestation Programme takes a sustainable forestry management approach that specifically includes these three interconnected aspects of sustainable development.
Page 19 of 34
conserving the forest; � land-use planning needs to be better, particularly regarding the balance of agricultural uses with forestry
uses in a densely populated country with rapid population growth; � private-sector participation in forestry should be increased so Viet Nam can tap new sources of
plantation forestry financing and technology; � capacity building in forestry training, research and education have to be strengthened; and � a monitoring and evaluation system for the 5MHRP needs to be designed and implemented.
To meet the above needs, the government and donors have agree upon a long-term Forestry Sector Support Programme Partnership that will address the macro environment within which the 5MHRP is being implemented.
Policy Points. While the programmes' quantity objectives are likely to be achieved, the quality of the resulting forest cover is less certain. Non-native tree species have been widely planted in Viet Nam,60 and many of these trees are invasive, crowding out native species. Directive No. 19/1999/CT-TTG and Decision No. 175/1998/QD/BNN/KHCN both promote planting native tree species but neither one goes so far as to support interspersed cropping of natives species in tree plantations. This would encourage more biological diversity in tree plantations.
Another policy issues is that there is a large domestic demand for lumber that is currently being met with imports from Lao PDR and Cambodia. Eventually, Viet Nam should be self-sufficient in lumber production. To meet long-term demand, Viet Nam will need policies that encourage production forests of fast-growing softwood species and discourage the use of slow-growing hardwoods. Policy options for increasing private-sector participation in production forests should be explored, particularly in conjunction with certified timber operations.
Forestry sub-indicators
A. Percentage of country area that is within a spec ial-use forest. Of the 93 special-use forests that have been decreed by the government, 65 have management boards (70 percent). Management boards have also been established for a further 22 special-use forests which have been approved at the ministerial provincial or district level but have not been decreed by the government. Increasing the number of official management boards for special-use forests would reduce the number of "paper parks".
B. Representation of species diversity in special-u se forests. For all natural forest in Viet Nam, the biggest gap in the coverage of the current system is the elevation zone between 300 in and 700 in. Increasing the coverage of the special-use forests system at lower elevations such as these poses greater challenges than increasing the coverage at higher elevations, because of the greater fragmentation of natural forest, higher human population density, and greater opportunity cost of zoning such forests for conservation. This means that increases of many underrepresented forest types and ecoregions will be difficult.
4.4 Resource Allocation Implications
The costs of reforesting 5 million hectares are substantial. An estimate of the cost of the 5MHRP is USD2.9 billion (VND42.0 trillion) over 12 years (1998-2010). This would be about USD242 million (VND3.5 trillion) annually. Of this amount, approximately 41 percent would fund production forest, 40 percent would fund perennial tree crops, 17 percent would fund protection area establishment and protection, and 2 percent would fund "additional natural regeneration."61 This cost estimate is, however, still an "estimate". The government's current allocation for the 5MHRP is about USD23 million (VND344 billion) per year.
Much of the money to finance the 5MHRP is expected to be provided as loans from multilateral and bilateral sources. Donors have pledged about USD70 million (VND1.0 trillion) per year in support of the forestry sector. This still leaves a large funding gap between the cost estimate and the actual amounts.
Cost norms for reforesting range from USD 6.90/ hectare (VND100,000) for assisting natural regeneration to USD1.1 million/hectare (VND15.9 million)forproductioneinnarnontrees.62
Strengthening the forest sector to make the gains in forest cover sustainable will add to these costs considerably. There are no agreed cost estimates yet for the planned Forest Sector Support Programme.
Forestry Sub-indicators
Page 20 of 34

Expanding the protected area network by 2 million hectares, as planned under the 5MHRP, is estimated to cost from USD172,400 to USD275,900 (VND2.5 million to VND4 million) a hectare, plus project management fees, infrastructure costs, nursery costs, land allocation, research, and extension training, as well as the cost of the overall public forestry administration, including research, training and education institutes.63 Funding for this portion of the 5MHRP is expected to come primarily from government sources supplemented by grants from bilateral and multilateral sources.
4.5 Monitoring
Prime Ministerial Decision No 245/1998/QD-TT, dated 21 December 1998, assigned the responsibility for monitoring and inventory of forest resources to the Ministry of Agriculture and Rural Development (MARD). In Decree No 32/2000/CT-BNN-KL, dated 27 March 2000, MARD assigned its Forest Protection Department to carry out forest resources monitoring and inventory. MARD's Forest Inventory and Planning Institute assists the Forest Protection Department with technical advice and data analysis.
Government Decree No 286/TTg dated 2 May 1997 details the forest resources inventory programme for the country. The first round of outputs under this programme has been approved by Government Decision No
03/2001/QD-TTg, dated 5 January 2001, and has been published in the beginning of 2001 in Results Forest Inventory of Viet Nam, 1999.
The way the forest inventory programme works is forest cover data are aggregated at the provincial level by the Forest Protection Department of the provincial Department of Agriculture and Rural Development (DARD) on a 1:25,000-scale map. Data sources include information on the three general forest land types ("forested, barren and other") and forest area as determined by aerial photographs and old forest cover data in most cases (with a ±5 percent re-check on the old data). Where photos or old data do not exist, opposite hillside and parallel transect methods are used.
Once the provincial forest cover maps are complete, the data are cross-checked with old forest cover maps to note the difference, and field checks are made on any wide variations. Forest cover area is then cross-checked with known commune areas to see if there are errors in the forested area calculation for each commune. There cannot be more forested area in a commune than land. At the smallest scale of "commune blocks", the error rate must be no more than 1/50.64
The quality of the forest cover data are largely dependent upon the quality of local data collection, the age of the aerial photos, and the skills of the aerial photo interpreters.
There was a large jump in forest cover, according to government statistics, from 1997 to 1999 (28 to 33 percent or a net gain of 1,716,000 ha in two years). This might be explained by the use of new forest inventory methodologies and the results of government reforestation programmes.
There are several areas where forest data collection could be improved. First, there is no agreed definition of what constitutes forest cover or forested land. Second, FPD is not the only agency that collects forest cover data. The General Department of Land Administration and the Government Statistics Office both collect forestry data. Each agency uses a different method of data collection with the result that there are differing numbers for forest cover. The FPD methodology appears to be the most robust and reliable. Third, the forest type classification system lacks detailed criteria, so it is difficult, for example, to distinguish between deciduous forest and semi-evergreen forest types with the current system. Fourth, there is a lack of up-to-date aerial photos of forest cover, a lack of skilled photo interpreters, and a lack of botany and zoology training for young professionals.
There are several recommendations on how this indicator could be improved.65
� establish an official definition for forest cover and forested land; � develop a scientific yet simple system of forest classification; � improve inventory of high-quality aerial photos and GIS equipment; and � train young professionals in forest resources inventory methods.
Page 21 of 34

Forestry Sub-indicators
A. Percentage of country area that is within a spec ial-use forest. This indicator is monitored by the Forest Protection Department within MARD. There are problems, however, with the quality of the data. The decreed areas of many special-use forests are inaccurate when compared to digitised maps of aerial photos. For some protected areas, the variations in area are more than 10 percent. A standardised methodology for estimating special-use forest area needs to be devised and updated estimates developed.
B. Representation of species diversity in special-u se forests. No single Organisation has the mandate for monitoring this sub-indicator. It would perhaps fit best in the Forest Protection Department. Before a monitoring system is developed, this sub-indicator should be simplified into either ecoregions or government forest types. Ecoregions would give a more comprehensive picture and includes more than just forest. Government forest types, on the other hand, are a known quantity to lower-level officials and could more easily be monitored within the existing system.
5. PERCENTAGE OF WATER AND AIR-QUALITY MONITORING S TATIONS SHOWING IMPROVEMENTS OVER THE BASELINE
5.1 Relevance of Indicator
This proposed indicator measures the percentage of the National Environment Agency's (NEA) air and water environmental monitoring stations that report Improvements in readings over the 1995 baseline year (the oldest year for data). This indicator is relevant because it monitors pollution levels and thus the general health of the environment as well as pollutants with negative health impacts. The causal relationships between air and water pollution and negative health consequences are fairly well known, and there is no need to restate them here.
This is an aggregate indicator that combines two common pollution parameters for water, Biological Oxygen Demand (BOD) and nitrogen compounds (N-NH4), and two common pollution parameters for air, Sulfur dioxide (SO2) and dust. While there are many other water and air-quality parameters, these four are the primary ones chosen by NEA for monitoring water and air quality in Viet Nam. These parameters are relevant because BOD is a main indicator for water contaminated by sewage, N-NH4 is a primary indicator of water contaminated by fertilizer, SO2 is a main contributor to acid rain, and dust is one of the primary causes of respiratory ailments.
This indicator includes water-quality measurements in five major rivers of Viet Nam: the Red River (Hanoi), the Cam River (Hai Phong), the Han River (Da Nang) the Huong River (Hue), and the Saigon River (Ho Chi Minh City). In many countries, major rivers serve a waste removal systems for industry and households Thus,
Page 22 of 34

measuring pollution levels in major rivers serves as a proxy for measuring harmful effluent discharge by industries and urban areas.
This indicator also includes air-quality measurements in six areas of Viet Nam: the Thuong Dinh industrial zone in Hanoi, the Tan Binh industrial complex in Ho Chi Minh City, the cement plant area in Hai Phong, the rolled-steel plant area in Da Nang, the Bien Hoa I industrial zone in Bien Hoa, and Ly Quoc Su street it Hanoi. This is a representative sample of likely air polluted areas in the north, central and south of the country.
Policy Link. There is a policy link between changes in air and water pollution and government policy, though ii is difficult to improve air and water pollution directly through simple policy changes. Policies can create the incentive structure and regulatory environment necessary for decreasing pollution outputs, but there is not a single policy 'pressure point' because pollution sources come from many different sectors (agriculture, industry, transportation) and the number of individual behaviour changes needed is large in a country such as Viet Nam.
Equity Impact. This indicator has a strong pro-poor impact. The poor suffer most from air and water pollution. They are the one who often live in the marginal area where pollution levels are highest, and they are the ones who can least afford medical care for pollution-relate ailments or the loss of a livelihood due to illness caused by pollution.
5.2 Baseline and Trends
Data for this indicator comes from NEA's annual State of the Environment Report 2000. Using the same methodology since 1995, NEA collects air and water quality information through designated monitoring stations for air and water quality in the north, central and south the country.
Base line: 1995 data
While the majority of water and air-quality monitoring stations under NEA are reporting improvement over 1995 pollution levels, the trend for the four parameters measured is negative; each year, fewer stations are reporting better levels than the baseline year. The trend is not surprising given Viet Nam's rapid growth in pollution-causing activities in industry, agriculture and transport. If the negative trend continues, the gains made in reducing pollution from 1995 to date are in danger of being lost.
Government standards exist for the four pollution parameters, and with the exception of dust, the data are on average below permissible limits.
A feasible goal for the government would be to keep the pollution levels at or below 1995 levels, and in the case of dust, to reduce the levels to less than the national standard of 0.2 mg/m3.
5.3 Key Factors to Achieving the Goals and Related Policies
Page 23 of 34

For the water and air pollution indicator, the institutional, financial and policy environments are not strong. One problems is that there are other government agencies that also track water and air quality. Hydrometrological Services' Water and Air Quality Centre monitors surface water quality in rivers and lakes as well as urban air quality. There are also municipal air-quality monitoring systems in several major cities, including Ho Chi Minh City and Hanoi. NEA has the mandate for monitoring pollution, but there is little cooperation among the parallel water and air monitoring systems. Additional problems are that the regulation for protecting water and air quality are insufficient, enforcement of existing regulations is weak, and the incentive structure for curtailing polluting activates is minimal.
The government has made progress, however, in improving urban air quality. Prime Minister decision No./ 24/2000/CT-TTg, dated 23 November 2000, eliminated lead in petrol for nonmilitary vehicles starting 1 July 2001.
Policy Points. The State of the Environment Report 2000 notes several "appropriate policies and strategies for sustainable water management":67
� develop policies for cleaner production technologies with preferential tax policies for enterprises that import and apply cleaner production technologies,
� promulgate economic instruments supporting the "polluter pays principle" and "users of the water should pay for the water";
� improve data collection quality; and � continue strengthening public awareness of water protection and management.
For air pollution, the same report notes a need to: develop cleaner production technologies for air-polluting enterprises;
� implement environmental impact assessment for all socioeconomic development projects; � develop use of liquid natural gas and light oil instead of coal and heavy oil, which have a high-sulfur
content; � encourage biogas in rural areas; and � develop clean energy from solar, wind and geothermal sources.
5.4 Resource Allocation Implications
Water Pollution. Cost estimates for improving this indicator are difficult because of the multi-sectoral nature of the pollution sources. Improving surface water quality will require improvements in urban sewage collection and treatment,68 improvements in waste water treatment by industry,69 and a reduction of fertilizer and pesticide runoff.
Air Pollution. NEA is preparing a national and local Clean Air Act which will cost about US$50,000 (VND 725,000,000). Between 2001 and 2005, NEA plans to establish ten automatic air monitoring stations, two mobile air monitoring stations, and two analytical laboratories. The cost of these improvements will be about US$4 million (VND58 billion).
5.5 Monitoring
This indicator is new to Viet Nam, and it has both strengths and weaknesses. The indicator is useful because it gives an overall view of the trends in water and air quality, but the indicator does not show relative changes (changes in magnitude) year-to-year. It is also useful in that when new monitoring stations are added or data from one station are not available, the indicator will not be affected because it measures a percent of the total data. The number of data points supporting the indicator, however, is limited. There are only five river water-quality monitoring stations and only six air-quality monitoring stations. The indicator also suffers from measuring only two parameters each for water and air. There are a number of important parameters that are not included in the proposed indicators, such as chemical oxygen demand, mercury, chromium, phosphates, and pH for water and lead, ozone, and carbon monoxide for air. Data for these parameters are not yet
Sources of Water and Pollution 66
The primary sources of water pollution are (in rough order): industries, urban households, and agriculture. For air pollution the primary sources are: industries, vehicles, and power generation.
Page 24 of 34

collected systematically. Additionally, the air-quality data are only daily averages from four days a year. Thus, if a major pollution source is not emitting on the measurement day, the average for the year will be up to 25 percent less. Daily sampling of air and water quality would give a more robust data set.
The frequency of the water sampling in the five rivers is unknown. What is clear from the data, however, is that in those years with less rainfall, such as 1997, water pollution concentrations increase. Thus, wet and dry years can cause the data to vary significantly.
The use of 1995 as the baseline is only because that is the first year for which data are available. In that year, there could have an aberration in any one of the four parameters due to weather patterns or data collection techniques.
The proposed indicator's main strengths are that the data are collected regularly and systematically, the data are published annually in the State of the Environment report, and the indicator shows the trends in water and air pollution from sites in the north, central and south of Viet Nam.
ANNEX
Annex 1: Terms of Reference for Localising the Envi ronment IDT
Revised after first meeting on 12/7/200170
Background
The International Development Targets come from the agreements and resolutions of the various world conferences organised by the United Nations in the first half of the 1990s.These conferences provided an opportunity for the international community to agree on steps needed to reduce poverty and achieve sustainable development. Each of the seven goals addresses an aspect of poverty. They should be viewed together because they are mutually reinforcing. Higher school enrolments, especially for girls, reduce poverty and mortality. Better basic health care increases enrolment and reduces poverty. Many poor people earn their living from the environment. So progress is needed on each of the seven goals.
Goals cannot be imposed—they must be embraced. Each country must identify its own particular goals, its own path to development, and make its own commitment through dialogue with its citizens. Vietnam, like many other countries, has committed itself to working towards the seven International Development Targets (IDTs). Vietnam signed the Millennium Declaration at the Earth Summit in September 2000 together with 180 other Countries. An initial report was prepared with the assistance by UNDP early 2001, covering in brief presentations the current status vis-à-vis the seven IDTs for Vietnam. The report shows that on average Vietnam is doing well on these targets. In fact, it is likely to surpass several targets before the time limit is reached. It is also agreed that if Vietnam's progress on human development indicators would be disaggregated by for example geographical region and ethnicity the data could show that average progress hides local stagnation. Furthermore it is recognised that these IDTs do not express Vietnam's own ambitions.
This has led the Poverty Task Force of Vietnam to take the initiative and support the localisation of the IDTs by developing papers for eight selected sectors71, which are Education, Health, Infrastructure, Economic Opportunity, Social Protection, Environment Ethnic Minorities and Governance. The development process of each of the papers will be coordinated and facilitated b members of the Poverty Task Force. The individual papers have to be presented by the end of August 2001. The reports are then discussed and synthesised in order to present them mid-November 2001 at the Consultative Group Meeting in Tokyo.
UNDP has taken over the responsibility to facilitate the work for the IDT on Environment. The Earth Summit held in Rio de Janeiro in 1992 spawned the IDT for the environment, which states:
Implement national strategies for sustainable development by 2005 so as to reverse the loss of environmental resources by 2015.
At present the Vietnamese Government has developed the National Environmental Strategy 2001 - 2010 and the Environmental Action Plan for the next five years. The documents identified three strategic objectives
Page 25 of 34

including: (1) to prevent and control pollution (2) to protect, conserve and sustainably use natural and biodiversity resources (3) to improve environmental quality in urban, industrial and rural areas. The documents also identified 13 specific goals and 8 cross-cutting objectives. Concrete targets are also set up under each of the objectives.
The IDTs are long-term and general. Thus, more specific, intermediate indicators are needed to measure progress towards the target.
Within Vietnam, the government-donor Poverty Task Force had drafted overall Terms of Reference (TOR) on how to localise the IDTs by, among other things, defining intermediate indicators.
As per the overall TOR, each IDT will have a working group to guide the process of drafting a report on localising an IDT. The crux of this report will be recommended indicators for Vietnam to track the progress towards the IDT.
To make the IDTs more relevant to the Vietnamese context, the IDTs have been grouped into themes or sectors. For the environment IDT, the theme, sector and IDT are the same.
Each theme or sector has been assigned a lead agency to organise the drafting of an IDT report. UNDP is the lead agency for the environment theme/sector/IDT.
This TOR follows the main points of the Poverty Task Force's IDT TOR.
Objective
To use a participatory process to recommend intermediate indicators that are appropriate to Vietnam for the environment IDT, review process indicators, and discuss key actions needed to improve the indicators.
Outputs
1. Formation of an Environment IDT stakeholders Working group .
2. A draft report (of about 20 pages) that will include, inter alia:
� Answers to the outline given by the Poverty Task Force (see Annex 1) and guiding questions in Annex 2 � Overview of the main targets of the Government that are specific to environment and presentation of the
main policy, investment and institutional development challenges for achievement of these targets � Progress towards these targets, what the trends are and how these trends compare internationally. � Three to five suitable intermediate indicators for the Environment IDT that are consistent with the
government's Socio-Economic Strategy and National Environmental Strategy (see Annex 4 for a list of potential indicators)
� A review of the process indicators (action plans, studies, laws) for the national Environmental Strategy. � A discussion of key public actions needed to improve the intermediate indicators, � Proposals for improving monitoring of indicators and data collection, including responsibilities and
potential funding sources
3. A revised draft report based on input from the working group and other interested parties to be submitted to the Poverty Task Force by 31.8.2001.
4. Contribution to a workshop in the second half of September on all the IDT indicators.
Tasks and drafting process
1. Determine the members of the environment IDT working group based on expressed interest government agencies, donors and NGOs. (see Annex 3 for the proposed list)
2. Draft work plan. (See timetable below) 3. Convene first meeting of working group and review: (a) how the environment IDT fits with government
strategies; (b) possible indicators for the IDT; (c) what key indicators are already tracked; (d) other stakeholders that should be consulted; and (e) the proposed work plan.
4. Revise work plan and budget as needed. 5. Draft the report following the guidance provided in the Poverty Task Force's Localising IDTs for Vietnam
TOR (see Annex 1 for the detailed outline) the 8 May 2001 Minutes of the Poverty Task Force Meeting,
Page 26 of 34

the 6 June 2001 Suggestion from NGOs, the above mentioned National Environmental Strategy, 2001-2010, The National Environmental Action Plan, 2001-2005, and the Socio-Economic Development Strategy, 2001-2010.
6. Submit the draft report to the working group members and other interested parties for comment 7. Revise the draft report as needed. 8. Contribute to a workshop, as requested by UNDP, on all the IDT reports.
Timetable and preliminary work plan
� Draft report to be completed by 17 August 2001. � Revised report to be completed by 31 August 2001.
The following table describes the steps and time frame for the development of the report:
[NB: this time table was delayed because the indicator were not chosen by the working group until 10 August 2001.]
Annex 2: Outline of Vietnam Development Target Pape rs
I. INDICATOR(S)
More than one indicator can be selected and the discussion which will take place in September will help narrow down among the options. Indicators should be based on an analysis of:
� International Development Targets or "International Best Practices" if IDTs are not available (e.g. in governance, infrastructure)
� Viet Nam's Sector Strategies, with a focus on those targets and goals which are more closely related to poverty reduction
II. BASELINE AND TRENDS
Activity Time frame
June July Aug Sept
UNDP and WWF to convene working group (Dagmar, Craig and Martin to organize)
ASAP
Field check of data collection methods. Send team of two consultants to one province in the central highlands and one province in the north to check on how local authorities collect information on forest cover and water quality. (Craig to draft TORs, Thao to draft contracts and supervise)
Second half
Subcontract for technical experts. (Craig to draft TOR, Thao to draft contract, Craig to supervise)
Second half
Collect data from government and development agencies. (Thao) Second half
Collect other information as needed (Thao and Martin) All first half
Write up draft report (Craig) All first half
Circulate to working group and other interested parties (Thao) 17h
Comments on draft report collected (Thao and Craig) 17-26
Revise draft report (Craig) 31st
Provide input to workshop on IDTs as requested by UNDP (Craig, Martin and Thao)
2nd half
Finalise report (Craig) last week
Page 27 of 34

Trends should be projected based on current policies. The projections can then be compared to the targets to indicate if they are likely to be achieved. Projections should:
� Provide data for the following dates: � 1990s (it may be 1990 or 1995, or it may be 1993 and 1998 if VLSS data need to be used) � 2000,2005,2010 � Give some international comparisons (Asian countries comparable by situation or income level, e.g.
Indonesia, China, India) � Disaggregate wherever possible by: � Urban/rural � Seven regions � Income or expenditure quintiles � Gender � Ethnicity
III. KEY FACTORS TO ACHIEVE THE GOALS AND RELATED P OLICIES
Highlight what will be required to achieve the targets, and especially what changes in approach may be needed if there is a gap between trends and targets
� Factors that will be needed to achieve the goals (e.g. clean water and immunisations to reduce child mortality; school facilities and teachers to universalise lower secondary education)
� Main policies required to ensure that those factors are in place (including changes needed to reach unserved groups)
IV. RESOURCE ALLOCATION IMPLICATIONS
The objective is to give a first indication of the implications of achieving the targets in terms of public budget allocations (capital and current), role of the private and public sector, use of external assistance
� Cost of the required policies (rough order magnitude) � Sources of funding best suited to meet these costs � Compatibility of the budget implications with existing budget � Expenditures (are shifts needed? Of what nature � Revenues (are additional or different revenue sources needed?)
V. MONITORING
� A few intermediate indicators linked to above policies (e.g. teacher/student ratios for quality education) � Existing data sources and gaps, Recommendation on how gaps could be filled
Annex 3: Working Group Ranking of Potential Indicat ors
The environmental IDT Working Group meeting of 10 August 2001 ranked all potential indicators into three groups and then votes on the highest priority indicators to be-included as the proposed environment IDT intermediate indicators.
Those present at this meeting were:
1. Ms Dagmar Schumacher, UNDP 2. Mr Chander Badloe, Chief of Water and Environment Sanitation Section, UNICEF 3. Pham Minh Thoa, Department for Forestry Development. MARD 4. Mr Tran Quoc Bao, Head of Conservation Division, FPD 5. Nguyen Van Truong, Eco-Eco Institute
Papers should not exceed 30 pages in length including tables and figures. They can also be considerably shorter if so decided by the respective working group. Attempts should be made to cover (in a qualitative way, if quantification is impossible) all sections. This will be easier for some papers than for others.)
Page 28 of 34

6. Mr Le Minh Duc, Deputy Director, Dept. for Science, Technology, Environment & Education, MPI 7. Ms Bui Thi Thu Hang, UNIDO 8. Mr Nguyen Binh Thin, Director, Science and Technology Department, MARD 9. Mr Tran Duy Binh, Director, Hydrometeorological Services
10. Mr Le Kim Khoi, Deputy Director, General Department, CEMMA 11. Mr Klause Greifenstein, UNDP 12. Mr Kuniaki Amatsu, JICA 13. Mr Tran Van Nhan, Viet Nam Cleaner Production Centre 14. Martin Geiger, WWF Indochina 15. Cao Chi Hung, WWF Indochina
Medium relevance for the IDT Environment
1. Population growth rate 2. Change of population density/quality of population 3. Air quality 4. Percentage of urban population using mass transit 5. Pesticide and fertiliser use per kilo of produce or per hectare of farm land 6. Percentage of Industry meeting international quality standards - ISO 14000 - (received one vote even
though it was agreed just to vote from the list of the highly relevant indicators) 7. Number of chemical or oil spills 8. Percentage of marine area which are effectively protected 9. Area covered by concrete in urban zones
Low relevance for the IDT Environment
There were no potential indicators considered as being of low relevance.
Millennium Development Goals (MDGs)
Goals and Targets Indicators
Goal 1: Eradicate extreme poverty and hunger
Target 1: Halve, between 1990 and 2015, the proportion of people whose income is less than one dollar a day
1. Proportion of population below $1 per day
2. Poverty gap ratio [incidence x depth of poverty]
3. Share of poorest quintile in national consumption
Target 2: Halve, between 1990 and 2015, the proportion of people who suffer from hunger
4. Prevalence of underweight children (under-five years of age)
5. Proportion of population below minimum level-of dietary energy consumption
Goal 2: Achieve universal prima education
Target 3: Ensure that, by 2015, children everywhere, boys and girls alike, will be able to complete a full course of primary schooling
6. Net enrolment ratio in primary education
7. Proportion of pupils starting grade 1 who reach grade 5
8. Literacy rate of 15-24 year olds
Goal 3: Promote gender equality and empower women
Target 4: Eliminate gender disparity in primary and secondary education preferably by 2005 and to all levels of education no later than 2015
9. Ratio of girls to boys in primary, secondary and tertiary education
10. Ratio of literate females to males of 15-24 year olds
11. Share of women in wage employment in the non-agricultural sector
Page 29 of 34

Notes
1The National Strategy on Sanitation and Safe Water for Rural Areas to 2010 gives 30 indicators for "clean water".
12. Proportion of seats held by women in national parliament
Goal 4: Reduce child mortality
Target 5: Reduce by two-thirds, between 1990 and 2015, the under-five mortality rate
13. Under-five mortality rate
14. Infant mortality rate
15. Proportion of I year old children immunised against measles
Goal 5: Improve maternal health
Target 6: Reduce by three-quarters, between 1990 and 2015, the maternal mortality ratio
16. Maternal mortality ratio
17. Proportion of births attended by skilled health personnel
Goal 6: Combat HIV/AIDS, malaria and other diseases
Target 7: Have halted by 2015, and begun to reverse, the spread of HIV/AIDS
18. HIV prevalence among 15-24 year old pregnant women
19. Contraceptive prevalence rate
20. Number of children orphaned by HIV/AIDS
Target 8: Have halted by 2015, and begun to reverse, the incidence of malaria and other major diseases
21. Prevalence and death rates associated with malaria
22. Proportion of population in malaria risk areas using effective malaria prevention and treatment measures
23. Prevalence and death rates associated with tuberculosis
24. Proportion of TB cases detected and cured under DOTS (Directly Observed Treatment Short Course)
Goal 7: Ensure environmental sustainability*
Target 9: Integrate the principles of sustainable development into country policies and programmes and reverse the loss of environmental resources
25. Proportion of land area covered by forest
26. Land area protected to maintain biological diversity
27. GDP per unit of energy use (as proxy for energy efficiency)
28. Carbon dioxide emissions (per capita) [Plus two figures of global atmospheric pollution: ozone depletion and the accumulation of global warming gases]
Target 10: Halve, by 2015, the proportion of people without sustainable access to safe drinking water
29. Proportion of population with sustainable access to an improved water source
Target 11: By 2020, to have achieved a significant improvement in the lives of at least 100 million slum dwellers
30. Proportion of people with access to improved sanitation
31. Proportion of people with access to secure tenure (Urban/rural disaggregation of several of the above indicators may be relevant for monitoring improvement in the lives of slum dwellers]
Page 30 of 34

2This details the requirements for waste water discharge.
3Other UN conferences that contributed to the IDTs were: the Fourth World Conference on Women (Beijing, September 1995); the World Summit for Social Development (Copenhagen, March 1995); and the International Conference on Population and Development (Cairo, September 1994).
4Shaping the 21st Century: The Contribution of Development Cooperation, OECD, 1996.
5The IDTs are also known as the International Development Goals.
6Sections 19 and 20 of the UN Millenium Declaration, 8th Plenary Meeting, September 2000.
7Tracking the Millenium Development Goals at the Country Level. UN Development Group, 7 August 2001 draft.
8As per http://www.dfid.gov.uk/public/what/strategy_papers/target_strategy.html, 17 July 2001.
9WWF Celebrates 40 Years of Innovating Conservation. Elizabeth A. Foley, WWF International, August 2001.
10Viet Nam is fifth after India, Bangladesh, Rwanda and Burundi. (2001 World Development Indicators for population per hectare and countries that derive more than 30 percent of GDP from agriculture.)
11Achieving Sustainability: Poverty Elimination and the Environment. DflD, October 2000.
12Section 2.3, Attacking Poverty, Poverty Working Group (Government of Viet Nam, Donors and NGOs), November 1999.
13Situation Analysis and Policy Recommendations to Promote the Advancement of Women and Gender Equality in Viet Nam. The National Committee for the Advancement of Women. Draft November 2000.
14Assisting Developing Countries with the Formulation and Implementation of National Strategies for Sustainable Development: The Need to Clarify DAC Targets and Strategies. PCD/DAC (99), 11 March 1999.
15VIE/97/007, funded by UNDP and the Swiss Agency for Development and Co-operation.
16Assessing Progress in Sustainable Development in Viet Nam: Discussion Paper. Viet Nam Capacity 21 Project, MPI and UNDP, February 1999.
17Our Common Future. World Commission on Environment and Development, Oxford, 1987, p.43.
18Rio Declaration on Environment and Development. UN, 1992.
19The "deep green" movement disagrees with this emphasis on perpetual economic growth in a finite world and instead advocates a focus on economic sustainability without growth.
20The UN Commission on Sustainable Development adds a fourth pillar: institutional development. This too is covered by a separate IDT thematic group: "good governance".
21Several examples of this are the coal industry in Quang Ninh Province which increased production at the expense of air, water and soil quality, the cutting of hardwood forests by State-Forest Enterprises in important watersheds that led to increased flooding in downstream areas, and the government subsidies for near-shore fishing that precipitated a collapse of coastal fish stocks.
22Government Decision No. 327-CP dated 15 September 1992.
23Section 3.2 on "Goal", National Strategy for Environmental Protection, 2001-2010, June 2000 draft.
Page 31 of 34

24Section 3.1 on "Guiding Principles", National Strategy for Environmental Protection, 2001-2010, June 2000 draft.
25Chapter II, Section 2.1, Socio-Economic Development Strategy, 2001-2010, July 2000 draft.
26Table 3.14, "Government Commitment", 2001 World Development Indicators.
27E.g., World Development Indicators.
28A "reasonable distance" is defined in urban areas as being no more than 200 in away and in rural areas as follows: that members of the household do not have to spend "a disproportionate part of the day fetching water". www.oecd.org/dae/indicators/htm, 18 July 2001.
29Table 2, from Basic Data on Water Supply and Sanitation, General Statistics Office, May 1992 and Table 8.1 "Population with Access to Safe Drinking Water by Urban/Rural Area and Region", General Statistics Office, September 2000.
30Chander Badloe, Chief Water and Environmental Sanitation Section, UNICEF Viet Nam, per. comm.
31For each of the proposed intermediate indicators, the "policy link" is examined to determine the extent this indicator can be changed by policy. If changes in policy have little impact on an indicator (such as "number of natural disasters"), there is little point in having it as a development indicator.
32"Equity Impact" is examined for each of the proposed intermediate indicators because growing inequality between and poor as well as rural and urban people hampers sustains development and causes social distortions such as social unrest and unofficial migration.
33"Immediate Objective, by the Year 2020", National Clean Water Supply and Sanitation Strategy up to Year 2020, page 10, Ministry of Construction and Ministry of Agriculture and Rural Development, August 2000.
34Ibid.
35UNICEF gives a figure of 48 percent overall safe water coverage in 1990 (www.unicef.org/statis.html 20 August 2001) while the General Statistics Office states 25 percent overall coverage for 1991 (GSO, Basic Data on Water Supply and Sanitation in 1991, Hanoi, May 1992).
36Dr. Cao Viet Sinh, Deputy Director, General Economic Department, Ministry of Planning and Investment, plenary statement at Hai Phong IDT workshop, 18 September 2001.
37From the International Conference on Water and the Environment, Dublin, Ireland, 26-31 January 1992.
38To ensure safe water quality, more emphasis is needed on eliminating pollution points. The National Environment Agency is tasked with regulating environmental pollution but is a relatively new agency www.oecd.org/dac/indicators 21 August 2001.
39"Existing Situation of Clean Water Supply", National Rural Clean Water Supply and Sanitation Strategy up to Year 2020, page 4, MARD and MOC, August 2000.
40"Policy Points" are included for each of the proposed intermediate indicators to help inform the debate on key policy changes that would improve the indicator.
41This details the requirements for waste water discharge.
42http://www.tradeport.org/ts/countries/vietnam/isa/isar0007.html
43Director of Rural Water Supply and Environmental Sanitation Centre of Ninh Binh province, Mr. Hoang Van Suong, per. comm., 23 August 2001.
Page 32 of 34

44There are myriad publications on forest cover as it relates to climate change, habitat for globally threatened species, watershed management, local livelihoods, cultural practices, etc.
45Section 4.10 on "Specific Objective 10", National Strategy for Environmental Protection, 2001-2010, June 2000 draft.
46Human Migration and Resource Utilisation: Yok Don National Park and the Surrounding Region, WWF, Hanoi, August 1998.
47This is provided increases in forest cover are not used as a justification for renewed state logging in natural forests.
48Con Dao and Cat Ba National Parks include marine areas but are classified as "special-use forests". Viet Nam has proposed 24 Marine Protected Areas and one (Hon Mon Marine Protected Area near Nha Trang) has been established.
49 www.oecd.org/dac/indicators/htm, 18 July 2001.
50Viet Nam is where two biological realms overlap (paleoanic and Indo-Malayan) and consequently a number of unique species have developed. The country has more than 12,000 plant species with a wide diversity of ecosystems. Viet Nam is also home to domestic strains of rice, taro root, and mung bean that could serve as important geoplasm sources for developing strains ideally suited to Vietnamese conditions.
51The Primary Source: Tropical Forests and Our Future, Norman Myers, New York, 1992.
52Viet Nam is one of Nikolai Vavilov's "Centres of Origin".
53GEF Agrobiodiversity Project, Institute of agricultural Genetics, Hanoi, December 2000.
54"Forested Areas in Viet Nam Increase to 33.2% of Country", Associated Press, 8 January 2001. The same numbers are also given in Decision 03/2001/QD-TTG of 5 January 2001.
55Wege, D. C., Long, A. J., Mai Ky Vinh, Vu Van Dung and Eames, J.C. (1999) Expanding the Protected Areas Network in Viet Nam for the 21st Century. An Analysis of the Current System with Recommendations for Equitable Expansion. Ha Noi, Vietnam: BirdLife International Vietnam Programme and the Forest Inventory and Planning Institute.
56Wikramanayake, E., Dinerstein, E., Hedao, P. and Olson, D. (1997) A Conservation Assessment of Terrestrial Ecoregions of the Indo-Pacific-Region. Washington D.C.: WWF-US Conservation Science Program.
57Examples of these include Western Black Gibbon Nomascus concolor concolor, Tonkin snub-nosed monkey Rhniopithecus avunculus, and Hatinh Langur Trachypithecus laotum hatinhensis.
58This is the only year for which data are available.
59From the Five Million Hectares Reforestation Programme Partnership, Synthesis Report. MARD and the SMHRP Partnership Secretariat, February 2001.
60The two primary non-native tree species are eucalyptus and acacia, both native to Australia.
61Section 3.4.3.1. "Resource mobilisation", Five Million Hectares Reforestation Programme Partnership, Synthesis Report. MARD and the 5MIiRP Partnership Secretariat, February 2001.
62Ibid.
63Ibid.
Page 33 of 34

64Forest cover report for WWF by Mr. Vu Van Dung, Vice Director emeritus of Forest Resources and Environment Centre within August 2001.
65Ibid.
66Derived from Chapters 4 and 5 of the State of the Environment Report 2000, NEA, draft of October 2001.
67Section 4.1, Chapter 4, State of the Environment Report 2000, NEA, draft of October 2001.
68Less than half of Viet Nam's urban households are connected to a centralized sewage collection system, according to the GSO.
69It costs about USD2,000 (VND29 million) to treat a cubic meter of waste at a water-treatment facility, based on the capital investment costs of two recently purchased industrial zone waste-water treatment plants.
70Participants were Maurice Dewulf, Nguyen Ngoc Ly, Tran Thi Thanh Van (UNDP), Martin Geiger, Hoang Phuong Thao (WWF Indochina Programme), Dau Quoc Anh (ECO-ECO), Mr Kohonen (UNIDO), Amatsu Kuniaki (JICA)
71In the meeting of the Poverty Task Force on June 5, 2001 the participants added the theme on Ethnic Minorities.
Page 34 of 34