LIS Working Paper Series - · PDF fileLIS Working Paper Series Luxembourg Income Study (LIS),...
28
LIS Working Paper Series Luxembourg Income Study (LIS), asbl No. 580 I The Middle Classes in Europe: Evidence from the LIS Data Régis Bigot, Patricia Croutte, Jörg Muller and Guillaume Osier September 2012
Transcript of LIS Working Paper Series - · PDF fileLIS Working Paper Series Luxembourg Income Study (LIS),...
LIS Working Paper Series
Luxembourg Income Study (LIS), asbl
No. 580 I
The Middle Classes in Europe: Evidence from the LIS Data
Régis Bigot, Patricia Croutte, Jörg Muller and Guillaume Osier
September 2012
The Middle Classes in Europe: evidence from the LIS data
Régis Bigot, Patricia Croutte and Jörg Muller (Crédoc) Guillaume Osier (STATEC and Luxembourg Income Study)
1. The middle class in a historical perspective: a role model for social cohesion? The French middle-class: a factor of republican integration and social unity Since the French Revolution in 1789 the notion of “middle classes” became more and more important. From the beginning on, links between this new social group and politics were very tight insofar as French middle class was a key role player during the revolutionary period. Republican values, such as equality and individual freedoms are intimately associated to the notion of “middle classes”. Moreover, the new terminology of “class” was preferred by the new political power to older denominations dividing society in social “orders” or “castes”1. In that perspective, the French middle class was situated in the very heart of the new social stratification and played the main role in the process of political modernization. The social perception of middle classes was slightly enlarged during the 18th and early 19th century when they have been seen as the incarnation of the social modernization of the country, the stabilisation of the economic system and the development of a patriotic feeling2. At the fall of the 19th century middle classes were seen as the mediator between the republican nation and the civil society creating in substance what sociology will call later on “social cohesion”. This early socio-political representation of French middle classes is based on two fundamental ideas that can still be found in more contemporary conceptualizations. Firstly, modernization, economic development and social wealth stimulate the production of middle classes who will stabilize the society as a whole by its specific capacities of mediation and pacification of social conflicts. Secondly, because of their socio-political importance middle classes are increasingly in the center of political discourse and more specifically of public policies. The alleged main goal is to avoid any kind of economic or social threaten to this very specific social group. Indeed, since the 19th century middle classes are – according to the political discourse - permanently threatened by socio-economical pauperization. Some authors even ironically say that “victimization” and “suffering” are two key notions that characterize the French perception of middle classes3. However, middle classes are not only exposed to the risk of social relegation but, since the Interwar period, also jeopardized by political dangers.
In the 1930s, sociologists and politicians were concerned about the evolution of the German middle and the repercussions of this evolution on French society. As a matter of fact, the German middle class was very strongly supporting the national socialist party and more precisely the idea of revolutionary social and political
1 Jean Ruhlman, Ni bourgeois, ni prolétaire : La défense des classes moyennes en France au XXe siècle, Paris, Le Seuil, 2001. 2 Edouard Alletz, De la démocratie nouvelle ou des Mœurs et de la puissance des classes moyennes, Paris, F. Lequien, 1837. 3 Klaus Peter Sick, “Le concept de classes moyennes: Notion ou slogan politique”, in Vingtième Siècle: Revue d’histoire, n° 37, janvier-mars 1993, p. 13-34.

change4. As far as in Germany middle class was no longer a factor of stability but of systemic instability challenging the foundations of the Weimar Republic, French sociologists and politicians were concerned about the destiny of the domestic middle class in France. Researchers such as Edmond Vermeil5 or Raymond Aron6 took notice of the German evolution and tried to quantify and to qualify the revolutionary risk of the French middle class. In return trade unions and political parties from the left and the right turned more and more to the middle class by developing specific policies. However, conducting policies in favor of a specific group was seen as problematic at that time. Claiming universal republican equality and conducting specific policies for an even more specific group was quite incompatible. It was at the end of the 1930, during the period of the Popular Front government that a solution was found to this contradiction7. The Popular Front presented the middle class as closely related to the popular or lower classes. In a way, the middle class was presented as an idealistic social achievement of what the lower classes should aspire for. The notion of the “social elevator” which describes the idea that a member of the lower class can climb up the social ladder and become a member of the middle class appeared at that time. Thus the middle class was renewing with its image as a role model of social integration.
The 1950s finally brought the debate to the methodological approach of best defining the middle class. This debate is of interest for our purpose as far as the question of social cohesion is central in it. Defining the middle classes through socio-professional categories was problematic because it was seen as an attempt to increase social cleavages by revealing cultural and socio-economical specificities of different groups8. Over 20 years this kind of scientific debate strongly influenced the political discourse on middle classes. A second approach, which is intensely used since the 1970s, defines the middle class with regard to the income level. The main advantages of this definition is that, firstly, international data can be more easily compared and, secondly, that socio-economic criteria such as poverty, taxation, budget expenditures have become more important factors to explain social cohesion than cultural and social specificities9. Since the 1980, a third type of public discourse on the middle class appeared. Periodically, the scientific community and public authorities intensely discuss the question whether the middle class is declining socially or not. Again the idea of social deterioration is linked to the concept of
4 Henry Laufenburger, “Classes moyennes et national-socialisme en Allemagne”, in Revue politique et parlementaire, 10 avril 1933, p. 46-60. 5 Edmond Vermeil, “Essai sur les origines sociales”, in Année politique française et étrangère, 10, 1935, p. 41-78. 6 Raymond Aron, “Le concept de classe”, in Itinéraires III, Paris, 1939, p. 25 sq. 7 Serge Berstein, “Les classes moyennes contre la gauche”, in Histoire, n° 71, 1984, p. 6-21. 8 Luc Boltanski, “Taxinomies sociales et luttes de classes: La mobilisation des classes moyennes et l’invention des cadres”, in Actes de la recherche en sciences sociales, n° 29, 1979, p. 85-105. 9 For a revue of recent approaches please refer to Régis Bigot, Simon Langlois, “Consommation et privation au sein des classes moyennes au Canada et en France”, in L’année sociologique, volume 61, n° 1, April 2011, p. 21-46.

pauperization of wide layers of the middle class which would lead – according to the authors defending this position10 – inevitably to the destabilization and erosion of the whole society. One can state here the reappearance of a well-known equation since the 19th century: Middle class = social and political stability
The German middle class: Consumption as a vector of social integration The concept of German Mittelstand/Mittelschicht was developed in the 19th century. The middle class was primarily seen as a product of industrialization and more generally the modernization of the German society. From the beginning the sociological approach was focusing on specific criteria enabling to describe the particularities of this new social group. The notions of “consumption”, “aspiration” and “attitudes” were central to this definition11. Basically, the middle class was identified according to its habits of consumption. In this early stage the typical member of the middle class was seen as educated, employed or in a liberal profession and constructing its social identity through very specific way of buying and consuming goods. Siegfried Kracauer wrote in his book on employees that the Mittelschicht (middle class) would have been the first social group developing a cultural identity through its ways of living12. In this perspective the German middle class was seen less as a factor of social integration than as a vector of cultural integration offering new types of identification to a large part of the service society.
Another topic in the research on the German middle class is the role it played during the takeover of the Nazi regime. As far as the middle class was representing the new dynamic part of the German society who was living as well in industrialized rural regions in the South and industrial or commercial centers in the North it was a main target for the electoral policy of the national socialist party as far as the middle class did not dispose of a traditional and old-established political culture13. However, the political exploitation of the German middle class by the Nazi regime did not moderate popularity of the concept for public policy after World War II. Again the German middle class played a political key role during the reconstruction period of the 1950s and 1960s. In this time of democratic unity the notion of social cohesion appeared in a context where “political normalization” was the main goal of national politics. In this perspective, “social cohesion”, “political normalization” and the “German middle class” were nearly synonymous. Its political importance through the 1960s may explain why the German middle class is not only seen as tightly linked to socio-economic advancement, modernity and the advent of the society of consumption but also as the main pillar of social peace and “bourgeois normality”.
10 Louis Chauvel, Les classes moyennes à la dérive, Paris, 2006 ; Camille Peugny, Le déclassement, Paris, 2009. 11 Otto Suhr, Die Lebenshaltung der Angestellten, Berlin, 1928. 12 Siegfried Kracauer, Die Angestellten, Frankfurt, 1971. 13 David Schoenbaum, La révolution brune : La société allemande sous le IIIe Reich, Paris, 2000.

Nevertheless, the internal cohesion of the German middle class seems to be less evident nowadays. Sociologists as Ulrich Beck14 or Franz Schultheis15 emphasize that the middle class is eroding from inside. Namely the new social paradigm of individualism is dividing the middle class by multiplying the offer of cultural identifications which are accessible to the individual independently from group identifications. The trend towards an internal fragmentation makes it more and more difficult to grasp and to define middle class as a whole.
The Belgian middle classes: integration by institutional representation The notion of middle classes is strongly used in the Belgian socio-political discourse and therefore an integrated part of the socio-political language since almost two centuries. Moreover, since the 19th century the use of the term is quite synonymous with “petite bourgeoisie”, which was mainly composed by retailers, shopkeepers, small industry owners, liberal professions, etc. A noticeable specificity of Belgian middle classes is that they are politically well organized and represented through a large variety of institutions reaching from federal governmental institutions to trade unions, corporations, interest groups, or simply associations of the civil society. Since 1899, there is for example a federal ministry of the middle class; the Supreme Council of middle classes was founded in 1909 and the Economic and Social Institute for middle classes or the National Federation of middle class trade unions a few years later16. As a matter of fact, since over 100 years middle classes can rely on a strong institutional representation in Belgium. Compared to other social classes, the Belgian middle class is undeniably overrepresented in federal, national, regional and even local institutions17. From this point of view the middle class is benefitting of a privileged position within the political system and therefore seems to be rather a vector of division than of social integration and pacification. Indeed its strong degree of representation implies a privileged position in terms of access to resources, information and social advantages.
A brief look into history may explain this specificity and give a hint on the question why the middle class was so important to the Belgian state. The notion of “middle classes” was initially used by public authorities to describe a heterogeneous social group that was organized as a strong political movement claiming its interests18. The catholic party, who was largely and over a long period dominating the political landscape, had two options: recognize the movement by concealing a part of its
14 Ulrich Beck, Risikogesellschaft – Auf dem Weg in eine andere Moderne, Frankfurt, 1986 15 Louis Chauvel, Franz Schultheis, “Le sens d’une dénégation – l’oubli des classes sociales en Allemagne et en France”, in Mouvements, n° 26, 2003/2, p. 17-26. 16 Ginette Kurgan-van Hentenryk, Serge Jaumain (ed.), Aux frontières des classes moyennes – La petite bourgeoisie belge avant 1914, Brussels, 1992. 17 Bernard Lachaise, “Un regard d’outre-quievrain sur les classes moyennes en Belgique”, in Pierre Guillaume (ed.), Histoire et historiographie des classes moyennes dans les sociétés dévéloppées, Talence, 1998, p. 35-48. 18 Paul H. Claeyes, Groupes de pression en Belgique – Patronat, syndicats, consommateurs, indépendants, agriculteurs, Brussels, 1973.

political power and by according an institutional representation or not to recognize it by keeping political power but increasing the risk of a social conflict. It’s not surprisingly that the first option was chosen. The middle class was given more social visibility, political power and privileges which culminated all together in an institutional representation19. Two reasons for this: firstly, the middle class was part of the traditional electorate of the catholic party and, secondly, the middle class was, therefore, seen as a natural ally against the socialist party and the labor movement. As there was very little alternation to the power in Belgium (the catholic democrats and the liberals were dominating general elections during almost the whole period of the 19th and 20th century) the alliance between middle classes and political powers ended up to be a sustainable partnership making the middle class to a key player in the political landscape. In sum, the institutional representation of Belgian middle classes was a clear commitment for institutional and political stability but not of social cohesion or social peace as far as the privileged position of the middle class in the political role-play was nourishing social division.
The British middle class: an association of free individuals In Great Britain the notion of middle class is tightly linked to the idea of economic and political modernization of the country. The influence of political liberalism on the way of conceiving the middle class is undeniable. Moral values such as individual freedom and the rule of law can be found in the very core of what is defined as the middle class. In this perspective, middle class is less an incarnation of republican equality as in France than of the idea of legal protection of individual freedoms (freedom of property and integrity of the individual)20.
With regard to this definition, some specificities of the British approach can be emphasized. British sociologists rarely used a definition based on socio-professional categories. Describing the middle class means measuring the income level of an individual. This approach allows taking into account very heterogeneous social and cultural realities in order to integrate them into a common definition of the middle class. Moreover, the income level approach makes the middle class to be considered as an intermediate class between the upper class and the lower class but not as an independent socio-political actor having its own culture, organizations, interests or even political agenda (as in Belgium). Thus, the middle class is largely seen as an economic and statistical reality and is very little used as a category by public powers when conceiving policies of social cohesion. Within the socio political discourse the middle class is reduced to its intermediate function as a go-between two separate socio-economic worlds (the upper class and the lower class). In other words, the idea of the social function of the middle class for systemic stability and economic prosperity is less developed in the British liberal and individualist conception than in continental European conceptions of the welfare state where middle class often plays a key role for social cohesion and/ or political stability.
19 Sarah Timperman, Le mouvement socialiste et les classes moyennes en Belgique (1945-1965) – De la Libération à la création de la Confédération nationale, Brussels, 1996. 20 Jürgen Kocka, “The Middle Classes in Europe”, in Journal of Modern History, n° 67, 1995, p. 784 sq.

The linkage between the British middle class and the “social question” seems to be very specific. Historians emphasize the idea that the social commitment of the middle class was never claiming the instauration of a welfare state but was basically confined at an individual level and inspired by religious convictions and private ethics21. Thus social commitment was not seen as a public affair but as a private moral obligation. The slogan was: “Welfare without the State”. Indeed, in order to promote social development and integration the British middle class was very involved – during the 19th and the beginning 20th century – in private social associations – the so called “voluntary societies” – seeking to assure social welfare at a local level22. Despite of the effectiveness of these local initiatives the main problem was their heterogeneity and therefore the difficulty to translate them into a unified national legislation. This may explain the plurality of local legislation on social issues in Great Britain as well as the density of the associative network. 2. Defining the Middle Class The conceptual review made in the previous chapter shows that the bounds of what is called the “Middle Class” vary over time and across countries. There is actually no consensus on what stands behind the group, and probably there won't be any as the way to define the middle class depends in fact on the context and what we focus on (Atkinson and Brandolini, 2011; Bigot et al., 2011). Besides, one's position on the social ladder depends on a multitude of characteristics: financial resources, education, occupation, social capital, economic, social or political responsibilities... (Bigot et al., 2011). According to the definition used, the limits of the middle class vary and so do the size of the category. Some of the images and conceptions usually connected to the middle classes may be misleading. For instance, all the persons who feel that way could be seen as middle class. The assumption is that middle class people share common identity in terms of goals, beliefs, and social customs, like wanting better living conditions for their children, a spiritual faith of some sort or the willingness to abide by the country’s laws. Though intuitive, a major problem with this approach is that most people think of themselves as middle class (Pressman, 2006). Similarly, analyzing the results of a survey in which individuals are asked to which social class they consider themselves to belong to, Bigot (2008) observed that only 15% of the 20% of the population with the highest income (the top quintile) viewed themselves as upper class, while the rest of the population viewed themselves either as middle or lower class, thus acting as if they had been embarrassed to claim they belong to the upper class.
21 Geoffrey Crossick, “Les classes moyennes dans la société britannique au XIXe siècle”, in Pierre Guillaume (ed.), Histoire et historiographie des classes moyennes dans les sociétés développées, Talence, 1998, p. 109-128. 22 Harold Perkin, The Rise of the Professional Society: England since 1880, London, Routledge, 1989.
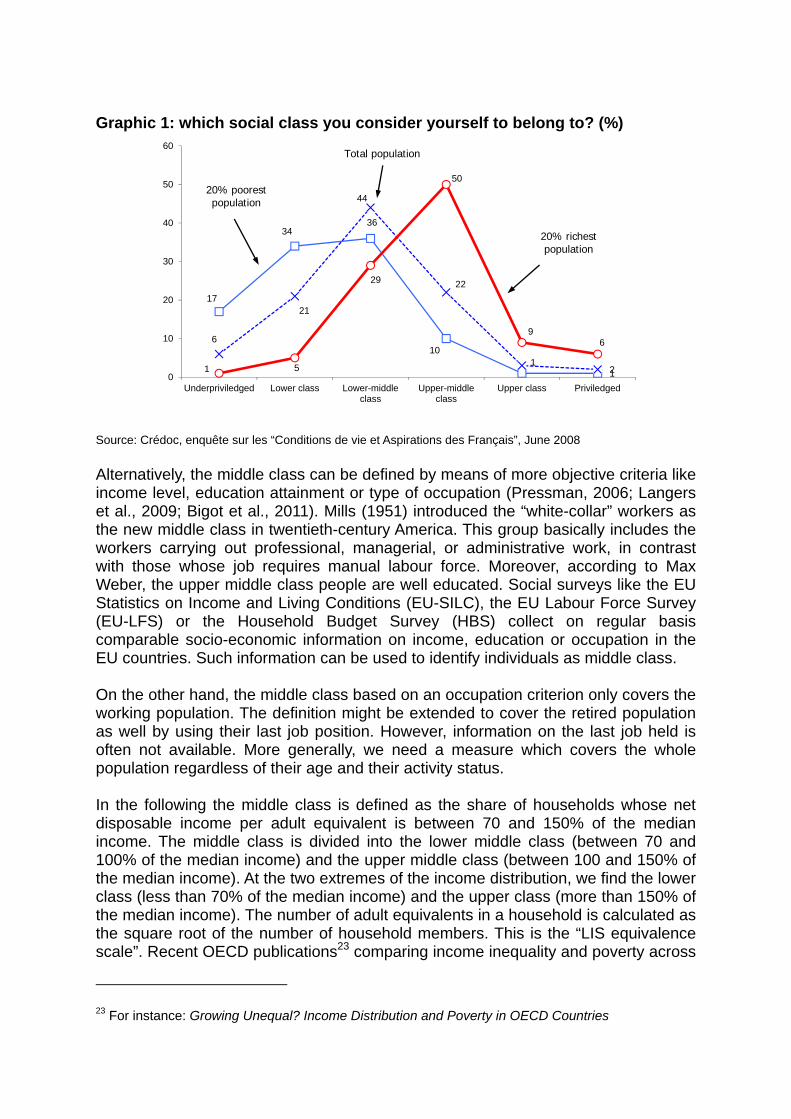
Graphic 1: which social class you consider yourself to belong to? (%)
Source: Crédoc, enquête sur les “Conditions de vie et Aspirations des Français”, June 2008 Alternatively, the middle class can be defined by means of more objective criteria like income level, education attainment or type of occupation (Pressman, 2006; Langers et al., 2009; Bigot et al., 2011). Mills (1951) introduced the “white-collar” workers as the new middle class in twentieth-century America. This group basically includes the workers carrying out professional, managerial, or administrative work, in contrast with those whose job requires manual labour force. Moreover, according to Max Weber, the upper middle class people are well educated. Social surveys like the EU Statistics on Income and Living Conditions (EU-SILC), the EU Labour Force Survey (EU-LFS) or the Household Budget Survey (HBS) collect on regular basis comparable socio-economic information on income, education or occupation in the EU countries. Such information can be used to identify individuals as middle class. On the other hand, the middle class based on an occupation criterion only covers the working population. The definition might be extended to cover the retired population as well by using their last job position. However, information on the last job held is often not available. More generally, we need a measure which covers the whole population regardless of their age and their activity status. In the following the middle class is defined as the share of households whose net disposable income per adult equivalent is between 70 and 150% of the median income. The middle class is divided into the lower middle class (between 70 and 100% of the median income) and the upper middle class (between 100 and 150% of the median income). At the two extremes of the income distribution, we find the lower class (less than 70% of the median income) and the upper class (more than 150% of the median income). The number of adult equivalents in a household is calculated as the square root of the number of household members. This is the “LIS equivalence scale”. Recent OECD publications23 comparing income inequality and poverty across
23 For instance: Growing Unequal? Income Distribution and Poverty in OECD Countries
17
3436
101
1
6
21
44
22
21 5
29
50
96
0
10
20
30
40
50
60
Underpriviledged Lower class Lower-middleclass
Upper-middleclass
Upper class Priviledged
20% richest population
Total population
20% poorest population

countries use this scale. However, alternative scales are also possible. For example, the "OECD-modified scale" assigns a value of 1 to the household head, 0.5 to each additional adult member and 0.3 to each child. Equivalence scales allow valid income comparisons between households of different sizes and composition. For instance, the LIS equivalence scale implies that a household of four persons has needs twice as large as one composed of a single person. Much of the recent literature on the middle classes relies on income-based definitions (Pressman, 2006, 2010). The approach offers several advantages:
• The level of income is often strongly correlated with socio-economic characteristics like education attainment or type of occupation (Langers et al., 2009)
• Greater harmonization of income concepts at international level has been achieved. For instance, the Canberra Group on household income statistics24 has developed and recommended international guidelines and standards. As a result, comparable cross-country data on income are now available from several sources. For instance, the European Union Statistics on Income and Living Conditions (EU-SILC) collect timely and comparable cross-sectional and longitudinal multidimensional micro-data on income, poverty, social exclusion and living conditions. As of now, all the EU-27 countries, Croatia, Iceland, Norway, Switzerland and Turkey have joined the collection25.
Another cross-national experience to collect comparable income data is the Luxembourg Income Study (LIS)26. The LIS project aims to create the largest available database of harmonized income micro-data collected from multiple countries over a period of decades. The datasets contain variables on market income, public transfers and taxes, household- and person-level characteristics, labor market outcomes, and, in some datasets, expenditures. A wide range of countries is covered, including not only European countries, but also American and Asiatic countries like India, China, Russia, Brazil, Peru or Chile. In addition, for some countries, time series go back to the seventies, which is particularly suitable for analysis over time. That’s why the LIS data were used to assess the evolution of the middle classes in Europe over a longer period of time. Since the time series did not go beyond 2004, they were complemented by using more recent EU-SILC data. 3. Size of the middle-class population – average income Under the income-based definition, the size of the middle class (in % of the household population) ranges from 35.4% in Latvia to 63.4% in Hungary. The proportion is greater than 60% in Denmark, Norway, the Netherlands, Slovakia, Czech Republic and Hungary, while the middle class account for less than half of the population in Ireland, Portugal, United Kingdom, Spain, Romania, Estonia, Bulgaria,
http://www.oecd.org/document/4/0,3343,en_2649_33933_41460917_1_1_1_1,00.html 24 http://www.lisproject.org/links/canberra/finalreport.pdf 25 For further information, see Eurostat’s website 26 http://www.lisdatacenter.org/

Lithuania and Latvia. Needless to say, the importance of the middle class varies from one country to another. Graphic 2: % of households whose net disposable income per adult equivalent is between 70 and 150% of the median income, by country, 2009
Source: EU Statistics on Income and Living Conditions (EU-SILC) The average net disposable income per adult equivalent of a middle-class household varies greatly across countries, ranging from 2500 EUR in Lithuania to more than 36000 EUR in Luxembourg, so a ratio of 1 to 15. This is mainly due to the income gap between the European countries. It is noteworthy that the countries with a large middle class (e.g., Luxembourg, Norway, and Denmark) are also those where the average income of the middle class households is highest. On the other hand, in the countries where the average income of the middle class is lowest, the size of the group is either small (e.g., in Romania and Bulgaria) or large (e.g., in Hungary). Thus, the level of income alone cannot determine the importance of the middle-class in a country.
63.463.1
61.761.561.160.8
59.158.758.357.457.456.9
55.155
5351.451.150.850.650.24948.348.247.5
45.643.242.241.4
35.4
0 10 20 30 40 50 60 70
Hungary
Slovakia
Norway
Slovenia
Austria
Iceland
Belgium
Germany
Poland
Italy
Ireland
United Kingdom
Romania
Bulgaria
Latvia
%
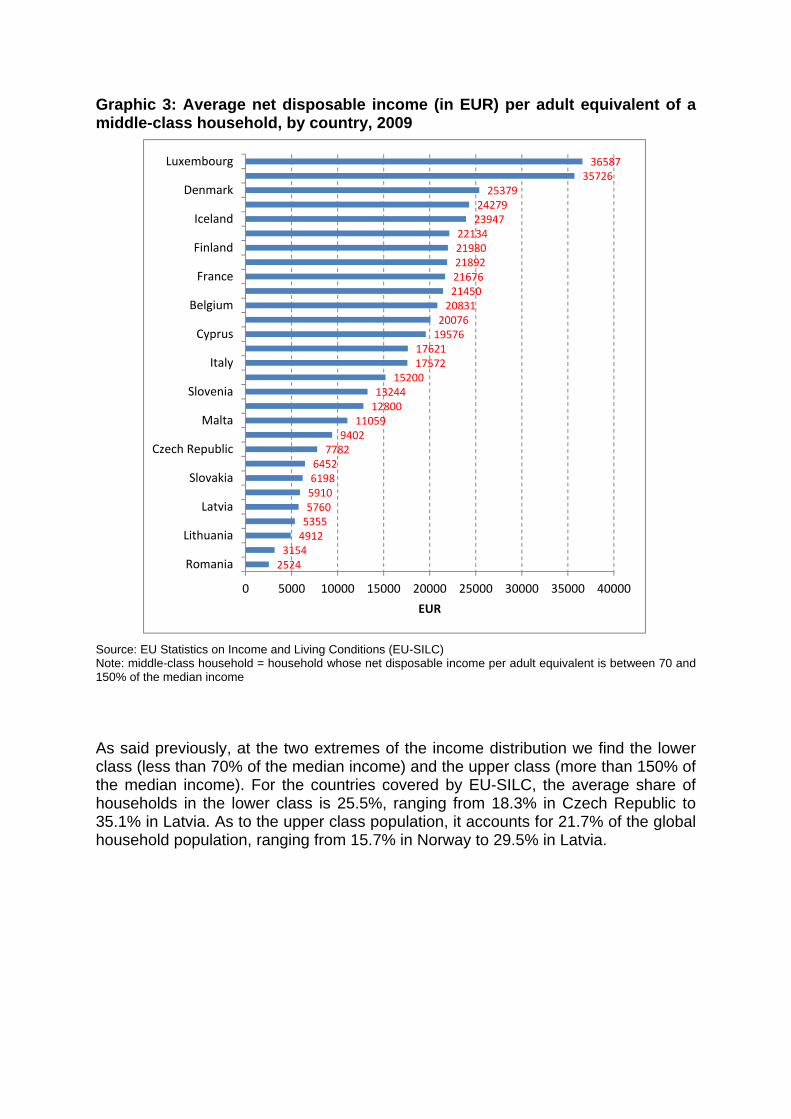
Graphic 3: Average net disposable income (in EUR) per adult equivalent of a middle-class household, by country, 2009
Source: EU Statistics on Income and Living Conditions (EU-SILC) Note: middle-class household = household whose net disposable income per adult equivalent is between 70 and 150% of the median income As said previously, at the two extremes of the income distribution we find the lower class (less than 70% of the median income) and the upper class (more than 150% of the median income). For the countries covered by EU-SILC, the average share of households in the lower class is 25.5%, ranging from 18.3% in Czech Republic to 35.1% in Latvia. As to the upper class population, it accounts for 21.7% of the global household population, ranging from 15.7% in Norway to 29.5% in Latvia.
25243154
491253555760591061986452
77829402
110591280013244
152001757217621
1957620076208312145021676218922198022134
239472427925379
3572636587
0 5000 10000 15000 20000 25000 30000 35000 40000
Romania
Lithuania
Latvia
Slovakia
Czech Republic
Malta
Slovenia
Italy
Cyprus
Belgium
France
Finland
Iceland
Denmark
Luxembourg
EUR

Graphic 4: % of households whose net disposable income per adult equivalent is lower than 70% of the median income (lower class), by country, 2009
Source: EU Statistics on Income and Living Conditions (EU-SILC) Graphic 5: % of households whose net disposable income per adult equivalent is greater than 150% of the median income (upper class), by country, 2009
Source: EU Statistics on Income and Living Conditions (EU-SILC)
18.318.619.719.9
21.722.522.622.623.223.423.8
25.325.826.126.126.226.526.626.827.127.327.42828.529.529.930.6
32.035.1
0 5 10 15 20 25 30 35 40
Czech RepublicHungaryFranceAustriaNorway
LuxembourgSwedenPolandFinland
ItalyUnited Kingdom
CyprusRomaniaEstoniaLatvia
EUR
15.716.716.816.917.5
18.618.618.719.119.319.519.619.72020.620.9
22.622.622.823.6242424.324.624.925.826.2
28.629.5
0 5 10 15 20 25 30 35
NorwaySwedenSloveniaFinlandAustriaBelgiumSlovakiaCyprusMaltaPolandSpain
PortugalRomaniaEstoniaLatvia
EUR

4. Are The quin the feedbahousehsourcedata di Over thgroups
1.
Graph
e the Eur
uestion of wEuropean
ack on thishold income suitable fdn’t go bey
he 25 couns: For twelveunder studpoints, Gefour counSlovakia, and SwedEurope, thAustralia (
ic 6: Shar
L
ropean m
whether orn countriess issue, w
me. Some for analysiyond 2004
ntries for w
e countriesdy: Luxemermany (- 7ntries of t-7pts in C
den (-14ptshe middle (-4pts), Ca
re (%) of th
Luxembour
Germany
middle cl
r not the ms, especiawe used tLIS time sis over lon
4, they wer
which data
s, the sharebourg, wh
7pts) and Bhe formerzech Repus), the decclass has nada (-1pt
he Middle
rg
asses de
iddle classlly in the the Luxemseries go ng time pere substitut
are availa
e of the mhere the mBelgium (-r Soviet Bublic and -crease is lost groun
t) and Taiw
Classes b
eclining?
ses are decontext o
mbourg Incback to theriods. As ted with EU
ble, we ca
iddle classmiddle class
10pts). ThBloc: -12p-2pts in Poalso quite
nd to both wan (-8pts)
by country
?
clining is af economicome Studhe 1960s,
said earliU-SILC for
n distingui
s decreases was redue decrease
pts in Romoland. As t importantlower and
y
Finland
Belgium
a recurring ic crisis. Tdy (LIS) dwhich maer, since t2007 and
ish betwee
es over theuced by ae is also stmania, -1to Finlandt. Finally, upper cla
m
debate To give data on kes the the LIS 2009.
en three
e period lmost 5 trong in 1pts in (-9pts) outside
asses in

C
Swede
Czech Repu
Australia
n
ublic
a
Roman
Polan
Slova
nia
nd
akia

Source: complete
2.
Graph
Luxembourg ed between Se
For nine cafter fluctuof the periSpain, Swrelative stashare of tchange in2004, EU-fiscal incothe share
ic 7: Shar
Income Studeptember and
countries, tuating arouiod under
witzerland ability. Thethe middle data sour-SILC for 2mes (enquof the midd
re (%) of th
Taiwan
France
dy (LIS) DataDecember 20
the share ound the trestudy as aand the N
e observede class in rce for 2002007 and 2uête sur lesdle class in
he Middle
e
abase, http://w011); EU-SILC
of the middnd, the va
at the begiNetherlandd increase France be07 and 202009). As s revenu fin France b
Classes b
www.lisdataceC from 2005 on
dle class rlue reachenning. Fra
ds are par(more tha
etween 20009 (Luxema matter oiscaux) doebetween 20
by country
nter.org until nwards
remains staes the samance, Uniterticularly con 1 percen05 and 20
mbourg Incf fact, the es not exh005 and 20
y
Cana
Austria
2004 (analy
able over tme level at ted Kingdomoncerned
ntage point007 is duecome StudFrench suibit any ch
007.
ada
a
ysis of micro-
time or, the end m, Italy, by this t) in the
e to the dy up to rvey on ange in
data

U
U
Netherla
United King
United Stat
nds
gdom
tes
Norw
Spain
Switzer
way
n
rland

Source: complete
3.
Graph
Source: complete
Luxembourg ed between Se
The shareIreland (+5 ic 8: Shar
Luxembourg ed between Se
Ital
Income Studeptember and
e of the m5pts), Gree
re (%) of th
Income Studeptember and
y
Denmark
Hungary
Italy
dy (LIS) DataDecember 20
iddle classece (+6pts
he Middle
dy (LIS) DataDecember 20
abase, http://w011); EU-SILC
s increases) and Hung
Classes b
abase, http://w011); EU-SILC
www.lisdataceC from 2005 on
s in four cgary (+8pt
by country
www.lisdataceC from 2005 on
nter.org until nwards
countries: Ds)
y
nter.org until nwards
Irelan
Greece
2004 (analy
Denmark (
2004 (analy
nd
e
ysis of micro-
(+5pts),
ysis of micro-
data
data

Thus, in 12 of the 25 countries under study, the middle class is shrinking, though it remains the most important group in the population. In Germany, Belgium, Sweden, Romania and Taiwan, the decrease of the middle class made the weight of the lower income class increase more than that of the lower class. On the contrary, in Czech Republic, Finland, Australia, Slovakia, Luxembourg, Poland and Canada, the decrease of the middle class was more profitable to the upper class. Table 1: Change (in % points) of the weights of the lower and upper classes
Lower Class Upper Class Germany (1981-2009) + 4.3 + 2.9 Belgium (1985-2009) + 5.8 + 3.7 Sweden (1981-2009) + 9.2 + 4.5 Romania (1995-2009) + 6.2 + 5.8 Taiwan (1981-2005) + 5.1 + 3.1
Czech Republic (1992-2009) + 2.4 + 4.8
Finland (1987-2009) + 3.9 + 5.2 Australia (1981-2003) + 0.9 +3.4 Slovakia (1992-2009) + 3.0 + 8.5
Luxembourg (1985-2009) + 2.0 + 2.4 Poland (1986-2009) - 0.1 + 2.4 Canada (1981-2004) - 0.2 + 1.8
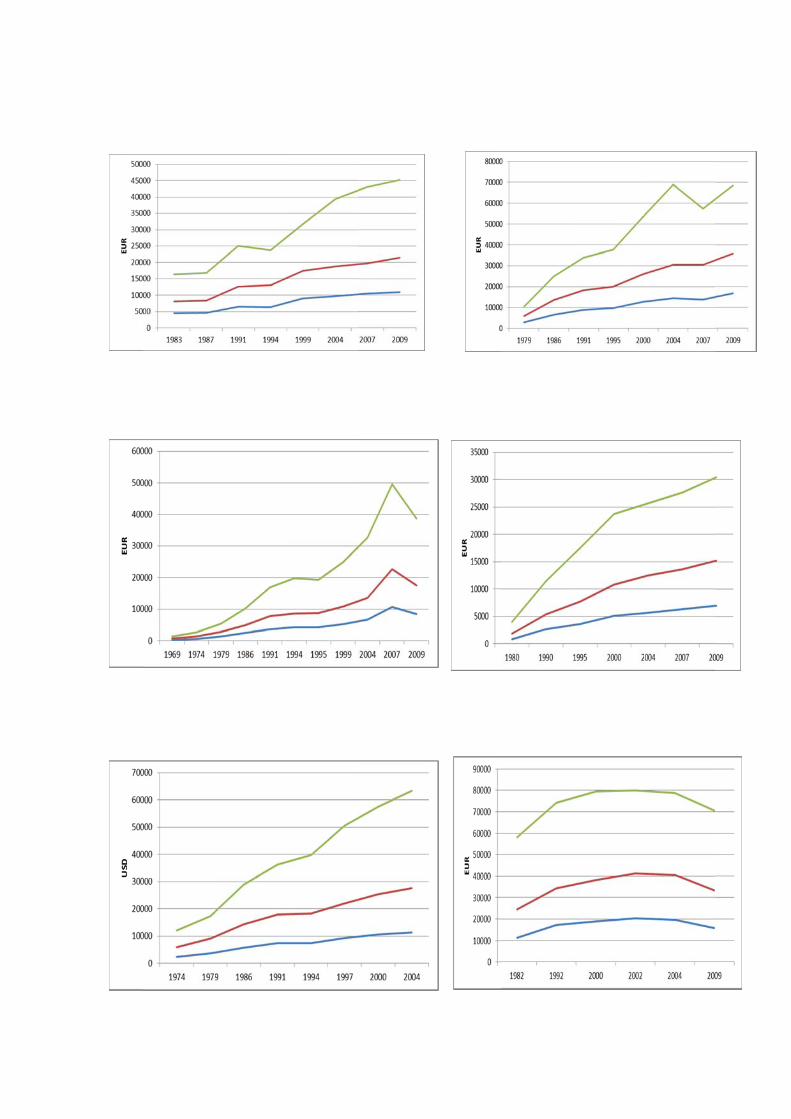
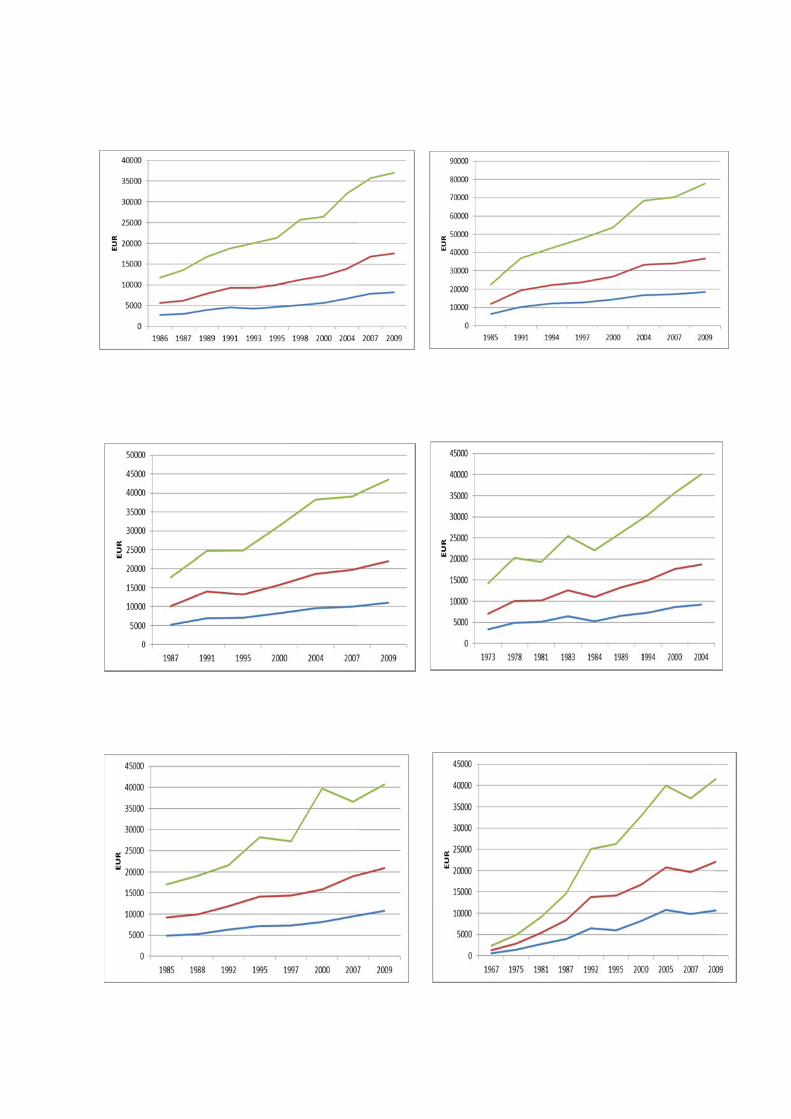
Source: Luxembourg Income Study (LIS) Database, http://www.lisdatacenter.org until 2004 (analysis of micro-data completed between September and December 2011); EU-SILC for 2007 and 2009 5. Are the European middle classes getting poorer? Another central question in the political debate concerns whether the middle classes are getting poorer, as some evidence might suggest. For instance, according to the 2011 Crédoc Survey on the “Conditions de Vie et Aspirations des Français” 27 half of the middle class population in France feel they have been getting poorer for the last ten years. In fact, this pessimism is shared by all the French population except the upper income class. The LIS data show that household income has steadily increased in all countries (see Annex), which contradicts the idea that middle classes are getting poorer (in absolute terms). However, in 17 out of the 25 countries under study upper-class incomes have increased faster than middle-class incomes. Thus, in a majority of countries, the middles classes are losing ground to upper classes. This confirms the results which had been published by OECD (2011)
27 http://www.credoc.fr/departements/aspi.ph1.8p

Table 2: Annual income change (%) by country and income class
Reference Period
Annual income change (%)
Lower incomes
Middle-class
incomes
Upper incomes
Total population
France 1979-2009 1.3 1.1 1.4 1.3Australia 1981-2003 2.4 2.2 2.6 2.5Finland 1987-2009 2.1 2.1 2.7 2.4United States 1974-2004 2.7 2.7 3.1 3.0
Czech Republic 1992-2009 2.3 2.7 3.2 3.0
Luxembourg 1985-2009 3.3 3.6 4.1 3.8Sweden 1975-2009 1.5 1.6 1.9 1.8Norway 1979-2009 2.5 2.7 2.9 2.8Belgium 1985-2009 1.5 1.8 2.1 1.9Poland 1992-2009 4.1 4.5 4.9 4.6
Slovakia 1992-2009 1.2 1.8 2.3 2.2Austria 1987-2009 1.8 1.8 2.3 2.1
The Netherlands 1983-2009 1.8 2.4 2.6 2.2
Italy 1986-2009 1.1 1.5 1.5 1.4United
Kingdom 1974-2009 1.6 1.7 2.0 2.0
Germany 1973-2009 1.8 2.0 2.0 2.0Denmark 1987-2009 0.2 1.4 1.4 1.4
Spain 1980-2009 2.0 2.4 2.1 2.2Estonia 2000-2009 8.1 8.7 7.1 7.4Hungary 1994-2009 3.5 3.2 1.8 2.4Ireland 1987-2009 4.9 4.8 4.5 4.6
Switzerland 1982-2004 1.3 1.1 0.2 0.8Greece 1995-2009 3.3 3.0 3.1 3.0Canada 1971-2004 3.2 2.8 3.0 3.0Slovenia 1997-2009 3.4 3.3 3.2 3.4
Source: Luxembourg Income Study (LIS) Database, http://www.lisdatacenter.org until 2004 (analysis of micro-data completed between September and December 2011), INSEE (National Accounts) and OECD 6. The importance of social transfers The structure of household income, as provided by the Luxembourg Income Study (LIS) data, shows significant differences between the social classes as regards their main sources of income. While in nearly all the countries under study the income of upper-class and upper middle-class households come mostly from work, the income of lower-class households relies more on social transfers, particularly in the European countries. For instance, the share of social transfers in household income ranges from 42% in Luxembourg to more than 80% in Belgium, while they only account for 11% of the income of the lower-class households in South Korea. However, private transfers seem more important in the Asiatic countries.
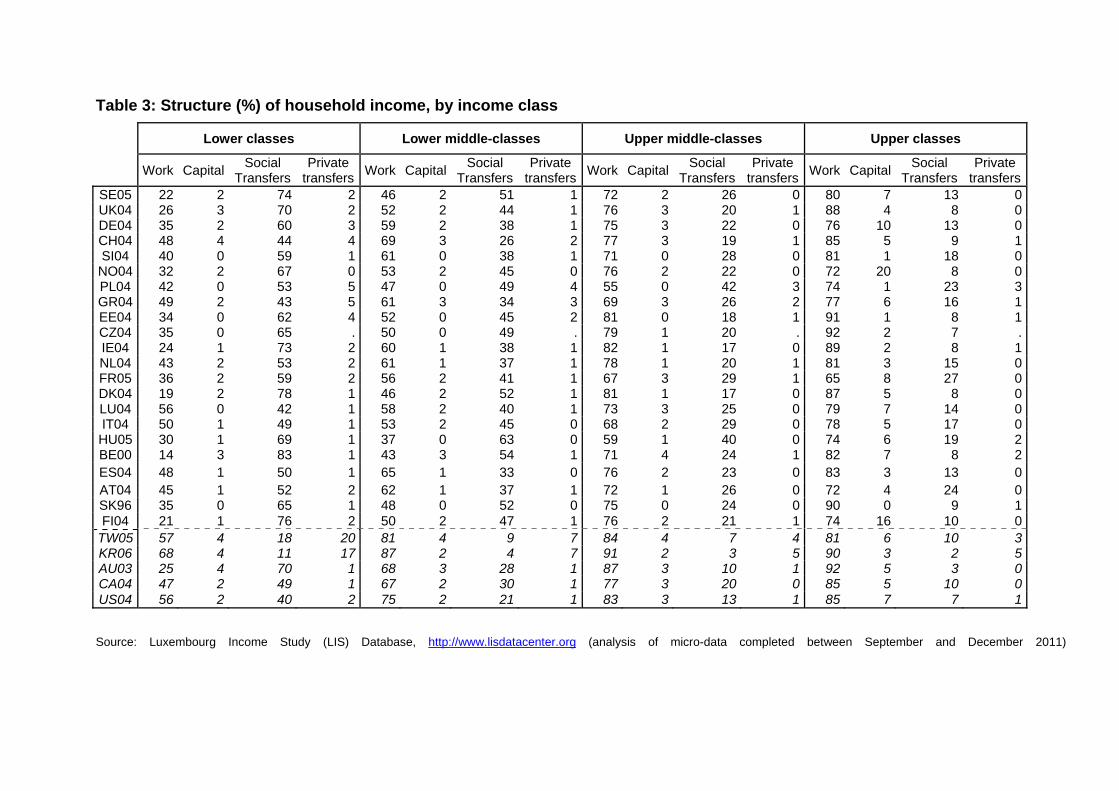
Table 3: Structure (%) of household income, by income class
Lower classes Lower middle-classes Upper middle-classes Upper classes
Work Capital Social Transfers
Private transfers Work Capital Social
TransfersPrivate
transfers Work Capital Social Transfers
Private transfers Work Capital Social
TransfersPrivate
transfers SE05 22 2 74 2 46 2 51 1 72 2 26 0 80 7 13 0 UK04 26 3 70 2 52 2 44 1 76 3 20 1 88 4 8 0 DE04 35 2 60 3 59 2 38 1 75 3 22 0 76 10 13 0 CH04 48 4 44 4 69 3 26 2 77 3 19 1 85 5 9 1 SI04 40 0 59 1 61 0 38 1 71 0 28 0 81 1 18 0 NO04 32 2 67 0 53 2 45 0 76 2 22 0 72 20 8 0 PL04 42 0 53 5 47 0 49 4 55 0 42 3 74 1 23 3 GR04 49 2 43 5 61 3 34 3 69 3 26 2 77 6 16 1 EE04 34 0 62 4 52 0 45 2 81 0 18 1 91 1 8 1 CZ04 35 0 65 . 50 0 49 . 79 1 20 . 92 2 7 . IE04 24 1 73 2 60 1 38 1 82 1 17 0 89 2 8 1 NL04 43 2 53 2 61 1 37 1 78 1 20 1 81 3 15 0 FR05 36 2 59 2 56 2 41 1 67 3 29 1 65 8 27 0 DK04 19 2 78 1 46 2 52 1 81 1 17 0 87 5 8 0 LU04 56 0 42 1 58 2 40 1 73 3 25 0 79 7 14 0 IT04 50 1 49 1 53 2 45 0 68 2 29 0 78 5 17 0 HU05 30 1 69 1 37 0 63 0 59 1 40 0 74 6 19 2 BE00 14 3 83 1 43 3 54 1 71 4 24 1 82 7 8 2 ES04 48 1 50 1 65 1 33 0 76 2 23 0 83 3 13 0 AT04 45 1 52 2 62 1 37 1 72 1 26 0 72 4 24 0 SK96 35 0 65 1 48 0 52 0 75 0 24 0 90 0 9 1 FI04 21 1 76 2 50 2 47 1 76 2 21 1 74 16 10 0
TW05 57 4 18 20 81 4 9 7 84 4 7 4 81 6 10 3 KR06 68 4 11 17 87 2 4 7 91 2 3 5 90 3 2 5 AU03 25 4 70 1 68 3 28 1 87 3 10 1 92 5 3 0 CA04 47 2 49 1 67 2 30 1 77 3 20 0 85 5 10 0 US04 56 2 40 2 75 2 21 1 83 3 13 1 85 7 7 1 Source: Luxembourg Income Study (LIS) Database, http://www.lisdatacenter.org (analysis of micro-data completed between September and December 2011)
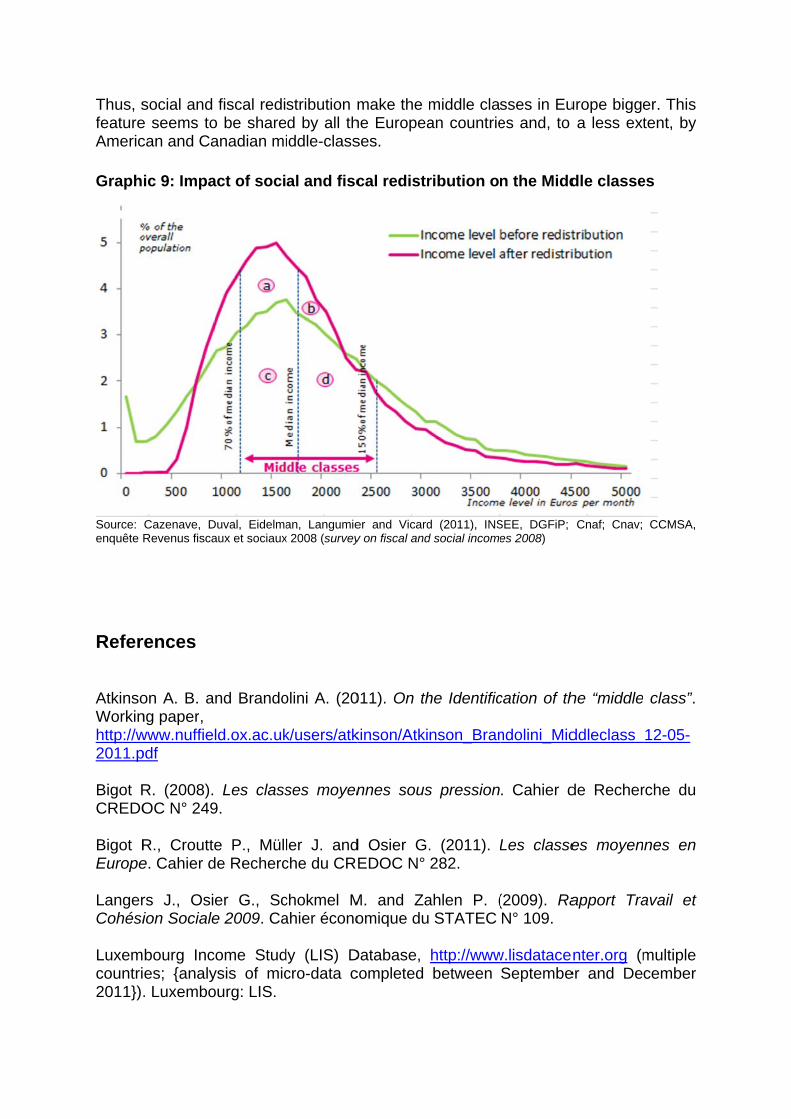
Thus, sfeatureAmeric Graph
Source: enquête
Refer AtkinsoWorkinhttp://w2011.p Bigot RCREDO Bigot REurope LangerCohési Luxemcountri2011})
social and e seems tocan and Ca
ic 9: Impa
Cazenave, DRevenus fisca
rences
on A. B. ang paper, www.nuffiepdf
R. (2008). OC N° 249
R., Crouttee. Cahier d
rs J., Osiion Sociale
bourg Inces; {analy. Luxembo
fiscal redio be shareanadian mi
act of soci
Duval, Eidelmaaux et sociaux
nd Brando
ld.ox.ac.uk
Les class9.
e P., Müllde Recherc
er G., Sce 2009. Ca
come Studysis of micourg: LIS.
stribution med by all thiddle-class
al and fisc
an, Langumiex 2008 (survey
olini A. (20
k/users/atk
ses moyen
ler J. andche du CR
chokmel Mahier écono
dy (LIS) Dcro-data c
make the mhe Europeases.
cal redistr
er and Vicardy on fiscal and
011). On th
kinson/Atki
nnes sous
d Osier G.EDOC N°
M. and Zaomique du
Database, completed
middle claan countrie
ribution o
d (2011), INSd social income
he Identific
nson_Bran
s pression
. (2011). L282.
ahlen P. ( STATEC
http://wwwbetween
sses in Eues and, to
n the Midd
SEE, DGFiP; es 2008)
cation of th
ndolini_Mid
. Cahier d
Les classe
(2009). RaN° 109.
w.lisdataceSeptembe
urope biggea less ext
dle classe
Cnaf; Cnav;
he “middle
ddleclass_
de Recher
es moyen
apport Tra
nter.org (mer and De
er. This tent, by
es
CCMSA,
class”.
_12-05-
rche du
nes en
avail et
multiple cember

Mills C. W. (1951). White collar: the American middle classes. New York: Oxford University Press. OECD (2011). Divided We Stand: Why Inequality Keeps Rising. Directorate for Employment, Labour and Social Affairs Pressman S. (2006). The Decline of the Middle Class: An International Perspective. LIS working paper series N° 280. Pressman S. (2010). The Middle Class in Less Developed American Nations. LIS working paper series N° 557.

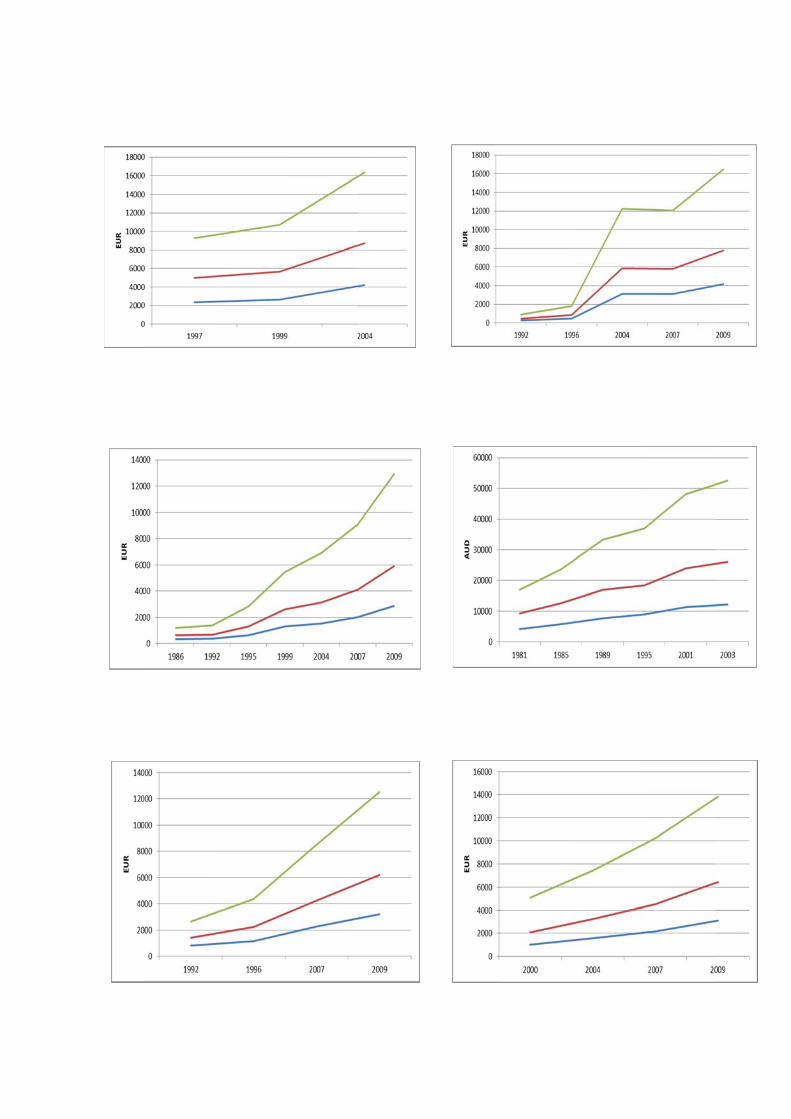
Annexcount
- - -
x: Averatry and in
Green = URed = MidBlue = Low
age net ncome c
Upper Clasddle Class wer Class
Denma
Hung
Fran
disposaclass
s
ark
gary
nce
able incoome perr adult e
G
A
equivalen
Ireland
Greece
Austria
nt, by
U
Netherla
United King
United S
ands
gdom
States Sw
Norway
Spain
witzerland
Italy
Finland
Belgium
d
m
Luxem
Ge
Swe
mbourg
ermany
weden
Slovak
Poland
Sloven
kia
d
ia Czecch Republ
Estonia
Australia
ic

Source: complete
Luxembourg ed between Se
Income Studeptember and
Cana
dy (LIS) DataDecember 20
da
abase, http://w011); EU-SILC
www.lisdataceC from 2005 on
nter.org until nwards
2004 (analyysis of micro-data