Liquid Phase Diffusion Growth of SiGe Single Crystals ... · PDF fileLiquid Phase Diffusion...
12
Liquid Phase Diffusion Growth of SiGe Single Crystals under Magnetic Fields N. Armour, M. Yildiz, E. Yildiz, S. Dost * Crystal Growth Laboratory, University of Victoria, Victoria, BC Canada V8W 3P6 * E-mail: [email protected] The manuscript presents the results of a combined experimental and modeling study on the Liquid Phase Diffusion (LPD) growth of single crystal Si x Ge 1-x on Germanium with and with the application of magnetic fields. Although the LPD process is mainly diffusion driven through out the growth period, strong natural thermosolutal convection occurs in the first five hours of growth, and the growth interface is concave to the melt. Applied rotating and static magnetic fields were considered to examine the growth and silicon dissolution processes in the LPD system. Results show that the application of a combined applied magnetic is beneficial. Introduction Si x Ge 1-x single crystals for device applications have generally been grown on silicon as thin films by Molecular Beam Epitaxy (MBE)(1), Rapid Thermal Chemical Vapor Deposition (RTCVD) (2), Chemical Vapor Deposition (CVD) (3), and Ultra High Vacuum Chemical Vapor Deposition (UHV/CVD) (4). However, when a Si x Ge 1-x alloy is epitaxially deposited on a silicon substrate, the deposited alloy layer is compressively strained. When the strained layer reaches a critical thickness, misfit and threading dislocations develop. Such dislocations reduce the mobility and electronic quality of the material (5). The critical layer thickness decreases significantly with the increasing germanium content. However, most of the applications require a much thicker Si x Ge 1-x layer with high germanium content. Due to such difficulties, high quality and compositionally uniform Si x Ge 1-x substrates are desirable. In order to grow such crystals, a variety of melt growth techniques, such as Czochralski (Cz) (6-9), floating zone (FZ) (10), Bridgman (11-12), multi component zone melting (13), and liquid encapsulated zone melting (14), have been utilized. It is, however, very difficult to grow single crystals of uniform compositions and low defect densities since Si x Ge 1-x has a large miscibility gap and the physical properties of Si and Ge, such as density, melting temperature, and lattice parameter, are very different. Because of the large miscibility gap, any small changes in the solidification rate lead to significant compositional variations and growth striations (6-7, 10-12). In the direction of producing crystals with uniform compositions, the multicomponent zone melting (MCZM) technique was developed for the growth of Si x Ge 1-x (13) and further utilized for Si x Ge 1-x and other alloys (14,16-20). In the MCZM technique, crystal composition will vary during growth if the system is kept stationary. In order to grow crystals with uniform compositions, the liquid zone (melt or solution) has be to moved at a very precise rate to match the actual mass transport rate of the system. However, the crystal composition may fluctuate due to the movement of the system since it is very difficult to achieve a perfect match between the natural mass transport rate of the system and the translation rate. ECS Transactions, 16 (10) 135-146 (2008) 10.1149/1.2986760 © The Electrochemical Society 135 Downloaded 31 Oct 2008 to 193.255.135.1. Redistribution subject to ECS license or copyright; see http://www.ecsdl.org/terms_use.jsp
Transcript of Liquid Phase Diffusion Growth of SiGe Single Crystals ... · PDF fileLiquid Phase Diffusion...

Liquid Phase Diffusion Growth of SiGe Single Crystals under Magnetic Fields
N. Armour, M. Yildiz, E. Yildiz, S. Dost*
Crystal Growth Laboratory, University of Victoria, Victoria, BC Canada V8W 3P6 *E-mail: [email protected]
The manuscript presents the results of a combined experimental and modeling study on the Liquid Phase Diffusion (LPD) growth of single crystal SixGe1-x on Germanium with and with the application of magnetic fields. Although the LPD process is mainly diffusion driven through out the growth period, strong natural thermosolutal convection occurs in the first five hours of growth, and the growth interface is concave to the melt. Applied rotating and static magnetic fields were considered to examine the growth and silicon dissolution processes in the LPD system. Results show that the application of a combined applied magnetic is beneficial.
Introduction SixGe1-x single crystals for device applications have generally been grown on silicon
as thin films by Molecular Beam Epitaxy (MBE)(1), Rapid Thermal Chemical Vapor Deposition (RTCVD) (2), Chemical Vapor Deposition (CVD) (3), and Ultra High Vacuum Chemical Vapor Deposition (UHV/CVD) (4). However, when a SixGe1-x alloy is epitaxially deposited on a silicon substrate, the deposited alloy layer is compressively strained. When the strained layer reaches a critical thickness, misfit and threading dislocations develop. Such dislocations reduce the mobility and electronic quality of the material (5). The critical layer thickness decreases significantly with the increasing germanium content. However, most of the applications require a much thicker SixGe1-x layer with high germanium content.
Due to such difficulties, high quality and compositionally uniform SixGe1-x substrates are desirable. In order to grow such crystals, a variety of melt growth techniques, such as Czochralski (Cz) (6-9), floating zone (FZ) (10), Bridgman (11-12), multi component zone melting (13), and liquid encapsulated zone melting (14), have been utilized. It is, however, very difficult to grow single crystals of uniform compositions and low defect densities since SixGe1-x has a large miscibility gap and the physical properties of Si and Ge, such as density, melting temperature, and lattice parameter, are very different. Because of the large miscibility gap, any small changes in the solidification rate lead to significant compositional variations and growth striations (6-7, 10-12).
In the direction of producing crystals with uniform compositions, the multicomponent zone melting (MCZM) technique was developed for the growth of SixGe1-x (13) and further utilized for SixGe1-x and other alloys (14,16-20). In the MCZM technique, crystal composition will vary during growth if the system is kept stationary. In order to grow crystals with uniform compositions, the liquid zone (melt or solution) has be to moved at a very precise rate to match the actual mass transport rate of the system. However, the crystal composition may fluctuate due to the movement of the system since it is very difficult to achieve a perfect match between the natural mass transport rate of the system and the translation rate.
ECS Transactions, 16 (10) 135-146 (2008)10.1149/1.2986760 © The Electrochemical Society
135Downloaded 31 Oct 2008 to 193.255.135.1. Redistribution subject to ECS license or copyright; see http://www.ecsdl.org/terms_use.jsp

The solution growth techniques of Liquid Phase Electroepitaxy (LPEE) and the Travelling Heater Method (THM) offer, in principle, a better controllability of crystal composition compared with the melt techniques (see (21) for details). However, LPEE and THM need single crystal seeds of the same composition of the crystal to be grown.
(a) (b)
Figure 1. (a) LPD growth system and the applied temperature profile, and (b) a representative diagram for the growth mechanism of LPD.
In order to address this issue, the MCZM technique was utilized for the growth of SixGe1-x crystals and the growth technique was called “Liquid Phase Diffusion” (LPD) (22-27). These studies have been carried out with two objectives in mind. The first was the growth of bulk SixGe1-x single crystals with varying compositions, from which the seed substrates with required compositions can be extracted. The second objective was the development of the first stage of a hybrid growth technique that would combine LPD with LPEE (or THM) in a single process for the growth of single crystals with desired uniform compositions. Such a single process would eliminate the adverse affects of growing crystals in two stages.
The driving force for growth in LPD is the dissolution of silicon from the silicon source into the germanium melt. Dissolution rate determines the growth rate and its structure affect the growth interface shape (28-29). In order to understand the dissolution mechanism in LPD we have conducted a series of pure dissolution experiments with and without the application of magnetic fields. Results show that the applied magnetic field alters the flow structure in the melt and consequently affects the interface shape and the dissolution heights. Results also show the feasibility of obtaining more favorable (flatter) interface under applied magnetic fields.
Liquid Phase Diffusion The LPD system used for the growth of Ge-rich SixGe1-x bulk single crystals with
axially varying silicon composition is shown schematically in Figure 1a. Details of the experimental procedure can be found in Ref. (22).
A sketch of the LPD growth cell is presented in Figure 1b, along with the germanium rich section of the representative binary phase diagram of SixGe1-x. The transportation of silicon species (solute) towards the growth interface enhances the solute concentration in
ECS Transactions, 16 (10) 135-146 (2008)
136Downloaded 31 Oct 2008 to 193.255.135.1. Redistribution subject to ECS license or copyright; see http://www.ecsdl.org/terms_use.jsp
the vicinity of the growth interface, thereby forming a supersaturated solution ahead of the interface at a temperature T1
L . Since the supersaturated solution is constitutionally
cooled, it solidifies at the silicon composition of x1S . The growth interface then moves
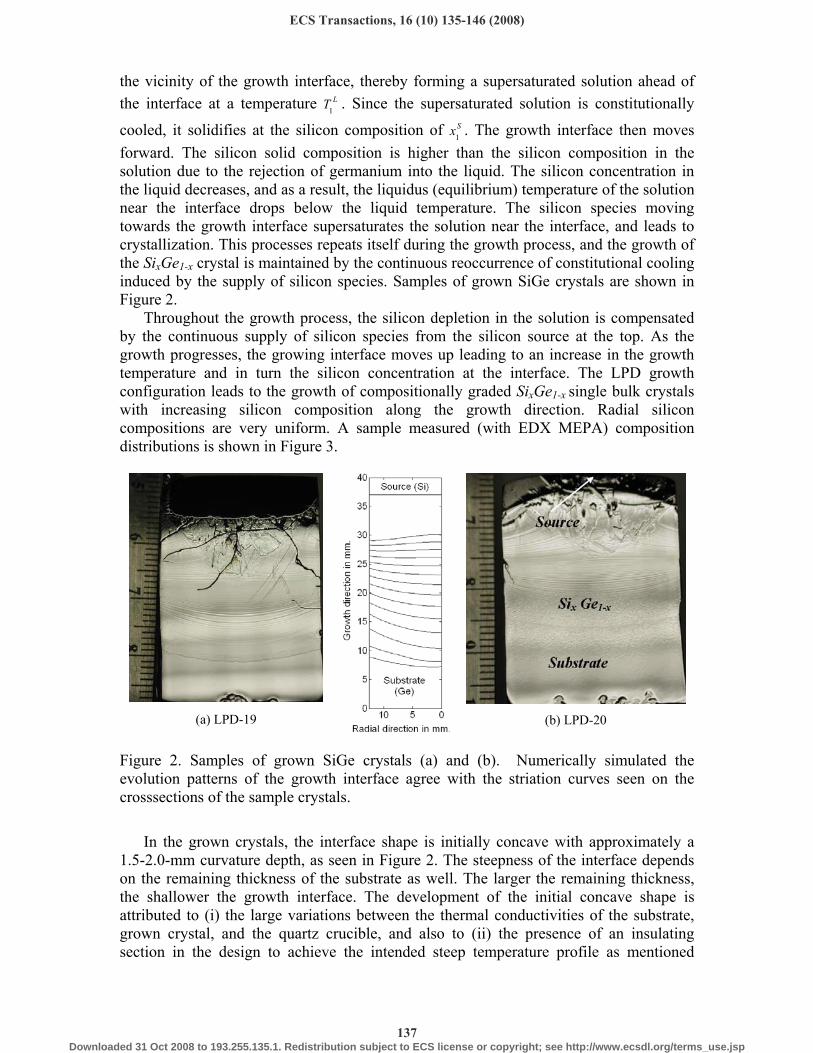
forward. The silicon solid composition is higher than the silicon composition in the solution due to the rejection of germanium into the liquid. The silicon concentration in the liquid decreases, and as a result, the liquidus (equilibrium) temperature of the solution near the interface drops below the liquid temperature. The silicon species moving towards the growth interface supersaturates the solution near the interface, and leads to crystallization. This processes repeats itself during the growth process, and the growth of the SixGe1-x crystal is maintained by the continuous reoccurrence of constitutional cooling induced by the supply of silicon species. Samples of grown SiGe crystals are shown in Figure 2.
Throughout the growth process, the silicon depletion in the solution is compensated by the continuous supply of silicon species from the silicon source at the top. As the growth progresses, the growing interface moves up leading to an increase in the growth temperature and in turn the silicon concentration at the interface. The LPD growth configuration leads to the growth of compositionally graded SixGe1-x single bulk crystals with increasing silicon composition along the growth direction. Radial silicon compositions are very uniform. A sample measured (with EDX MEPA) composition distributions is shown in Figure 3.
(a) LPD-19
(b) LPD-20
Figure 2. Samples of grown SiGe crystals (a) and (b). Numerically simulated the evolution patterns of the growth interface agree with the striation curves seen on the crosssections of the sample crystals.
In the grown crystals, the interface shape is initially concave with approximately a
1.5-2.0-mm curvature depth, as seen in Figure 2. The steepness of the interface depends on the remaining thickness of the substrate as well. The larger the remaining thickness, the shallower the growth interface. The development of the initial concave shape is attributed to (i) the large variations between the thermal conductivities of the substrate, grown crystal, and the quartz crucible, and also to (ii) the presence of an insulating section in the design to achieve the intended steep temperature profile as mentioned
ECS Transactions, 16 (10) 135-146 (2008)
137Downloaded 31 Oct 2008 to 193.255.135.1. Redistribution subject to ECS license or copyright; see http://www.ecsdl.org/terms_use.jsp

earlier. The concave interface shape implies that heat loss from the periphery of the crucible is larger than that from the bottom.
Qa
(a) (b)
Figure 3. Silicon concentration distribution in LPD-5: a) in the radial direction (at 2 mm vertical steps), and b) in the axial direction.
Liquid Phase Diffusion under Magnetic Fields
In order to suppress this strong convection during the initial periods of the LPD
growth process, and obtain more favorable growth interface shapes, we have carried out a numerical simulation study to examine the feasibility of using applied static and rotating magnetic fields in the LPD growth of SiGe crystals. The 3-D simulation model employed makes the following assumptions. The liquid phase which represents the Ge-rich Ge-Si solution is modeled as a binary mixture of Si and Ge, and it is assumed to be a heat and electric conducting, non-magnetizable, nonpolarizable, incompressible Newtonian fluid. The solid phase, which represents the single crystal Ge-substrate, the polycrystalline Si-source, and the quartz crucible, is considered as a heat conducting rigid material. The interface between the substrate and solution is the growth interface, and the interface between the solution and the source is the dissolution interface. The melt flow is laminar. The effects of interface curvature (Gibbs-Thompson effect) is small, and the Boussinesq approximation holds in the liquid phase. Derivation of the related governing equations and the magnetic body force terms, and the associated boundary and interface conditions can be found in Ref. (26). The governing equations were solved numerically using the finite volume based CFX software package of AEA Technology. Effect of a vertical static magnetic field
Figure 4a presents the computed velocity profiles (with no magnetic field) at t = 1 h
of growth in the vertical plane of the computational domain. The flow field is given in terms of the magnitude (strength) of the velocity vector. As seen from the figure, the flow field has two main convection cells in the vicinity of the growth interface. In the rest of the liquid zone, convection is very weak and not noticeable numerically in the figure.
ECS Transactions, 16 (10) 135-146 (2008)
138Downloaded 31 Oct 2008 to 193.255.135.1. Redistribution subject to ECS license or copyright; see http://www.ecsdl.org/terms_use.jsp
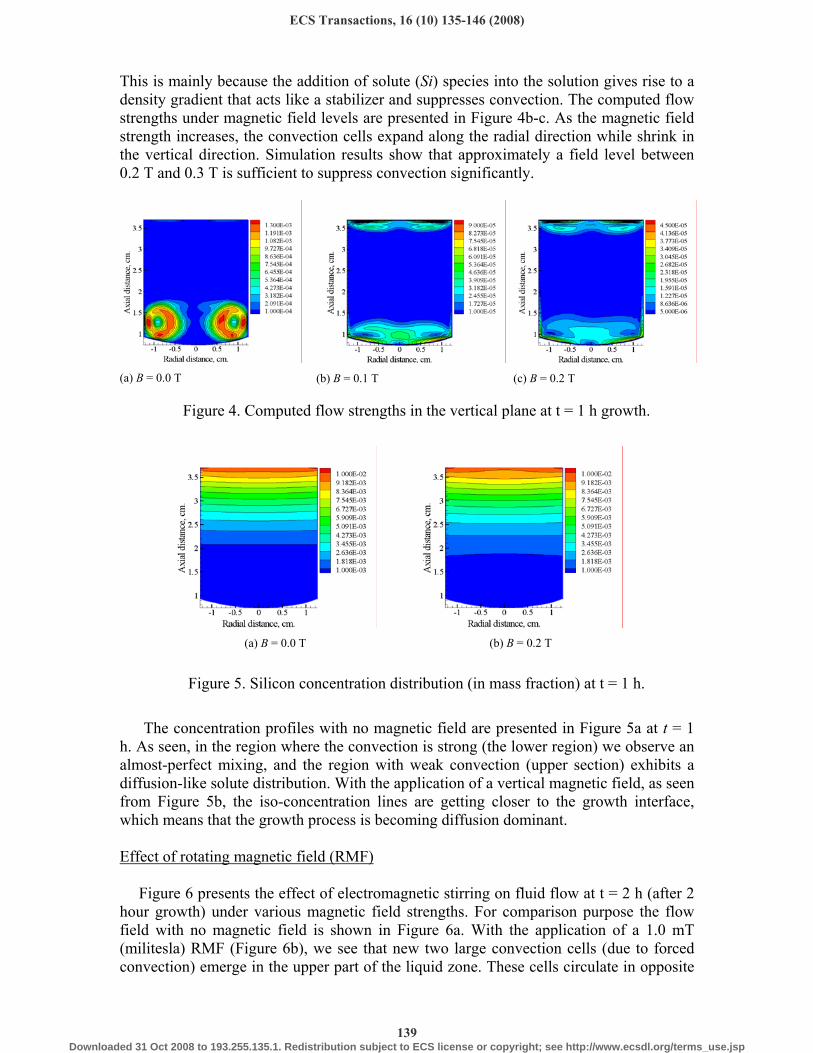
This is mainly because the addition of solute (Si) species into the solution gives rise to a density gradient that acts like a stabilizer and suppresses convection. The computed flow strengths under magnetic field levels are presented in Figure 4b-c. As the magnetic field strength increases, the convection cells expand along the radial direction while shrink in the vertical direction. Simulation results show that approximately a field level between 0.2 T and 0.3 T is sufficient to suppress convection significantly.
(a) B = 0.0 T (b) B = 0.1 T (c) B = 0.2 T
Figure 4. Computed flow strengths in the vertical plane at t = 1 h growth.
(a) B = 0.0 T (b) B = 0.2 T
Figure 5. Silicon concentration distribution (in mass fraction) at t = 1 h.
The concentration profiles with no magnetic field are presented in Figure 5a at t = 1
h. As seen, in the region where the convection is strong (the lower region) we observe an almost-perfect mixing, and the region with weak convection (upper section) exhibits a diffusion-like solute distribution. With the application of a vertical magnetic field, as seen from Figure 5b, the iso-concentration lines are getting closer to the growth interface, which means that the growth process is becoming diffusion dominant. Effect of rotating magnetic field (RMF)
Figure 6 presents the effect of electromagnetic stirring on fluid flow at t = 2 h (after 2
hour growth) under various magnetic field strengths. For comparison purpose the flow field with no magnetic field is shown in Figure 6a. With the application of a 1.0 mT (militesla) RMF (Figure 6b), we see that new two large convection cells (due to forced convection) emerge in the upper part of the liquid zone. These cells circulate in opposite
ECS Transactions, 16 (10) 135-146 (2008)
139Downloaded 31 Oct 2008 to 193.255.135.1. Redistribution subject to ECS license or copyright; see http://www.ecsdl.org/terms_use.jsp
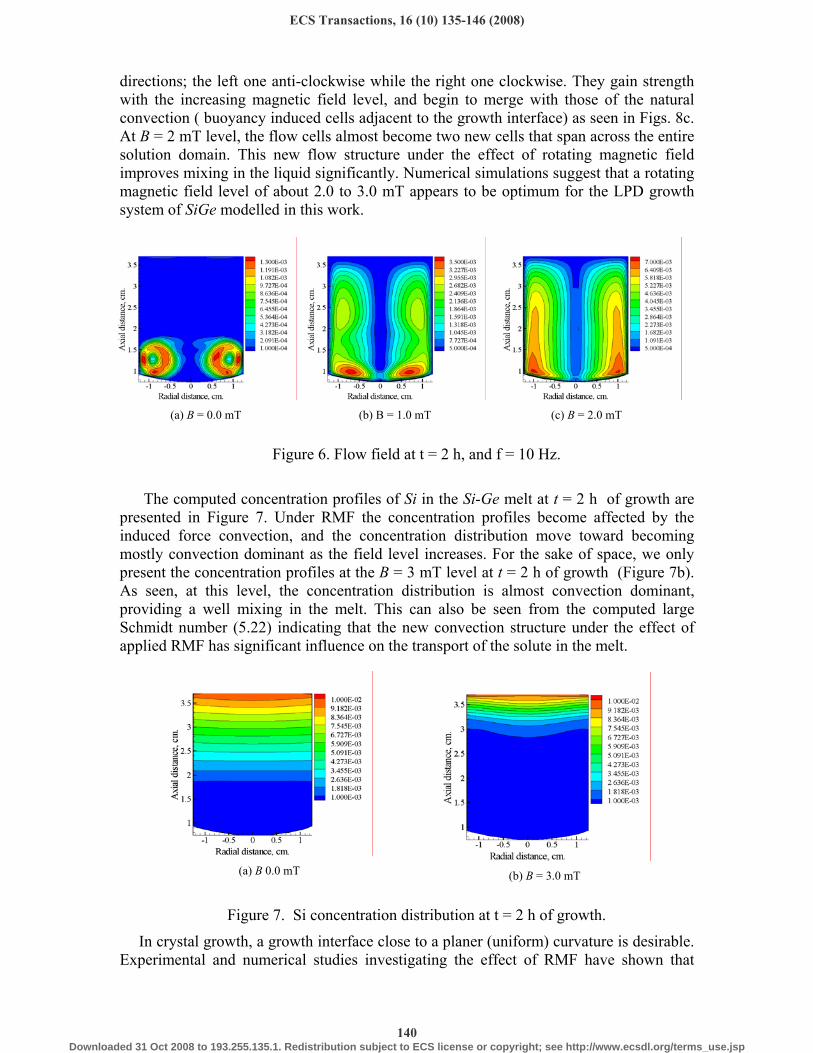
directions; the left one anti-clockwise while the right one clockwise. They gain strength with the increasing magnetic field level, and begin to merge with those of the natural convection ( buoyancy induced cells adjacent to the growth interface) as seen in Figs. 8c. At B = 2 mT level, the flow cells almost become two new cells that span across the entire solution domain. This new flow structure under the effect of rotating magnetic field improves mixing in the liquid significantly. Numerical simulations suggest that a rotating magnetic field level of about 2.0 to 3.0 mT appears to be optimum for the LPD growth system of SiGe modelled in this work.
(a) B = 0.0 mT (b) B = 1.0 mT (c) B = 2.0 mT
Figure 6. Flow field at t = 2 h, and f = 10 Hz.
The computed concentration profiles of Si in the Si-Ge melt at t = 2 h of growth are
presented in Figure 7. Under RMF the concentration profiles become affected by the induced force convection, and the concentration distribution move toward becoming mostly convection dominant as the field level increases. For the sake of space, we only present the concentration profiles at the B = 3 mT level at t = 2 h of growth (Figure 7b). As seen, at this level, the concentration distribution is almost convection dominant, providing a well mixing in the melt. This can also be seen from the computed large Schmidt number (5.22) indicating that the new convection structure under the effect of applied RMF has significant influence on the transport of the solute in the melt.
(a) B 0.0 mT (b) B = 3.0 mT
Figure 7. Si concentration distribution at t = 2 h of growth.
In crystal growth, a growth interface close to a planer (uniform) curvature is desirable. Experimental and numerical studies investigating the effect of RMF have shown that
ECS Transactions, 16 (10) 135-146 (2008)
140Downloaded 31 Oct 2008 to 193.255.135.1. Redistribution subject to ECS license or copyright; see http://www.ecsdl.org/terms_use.jsp
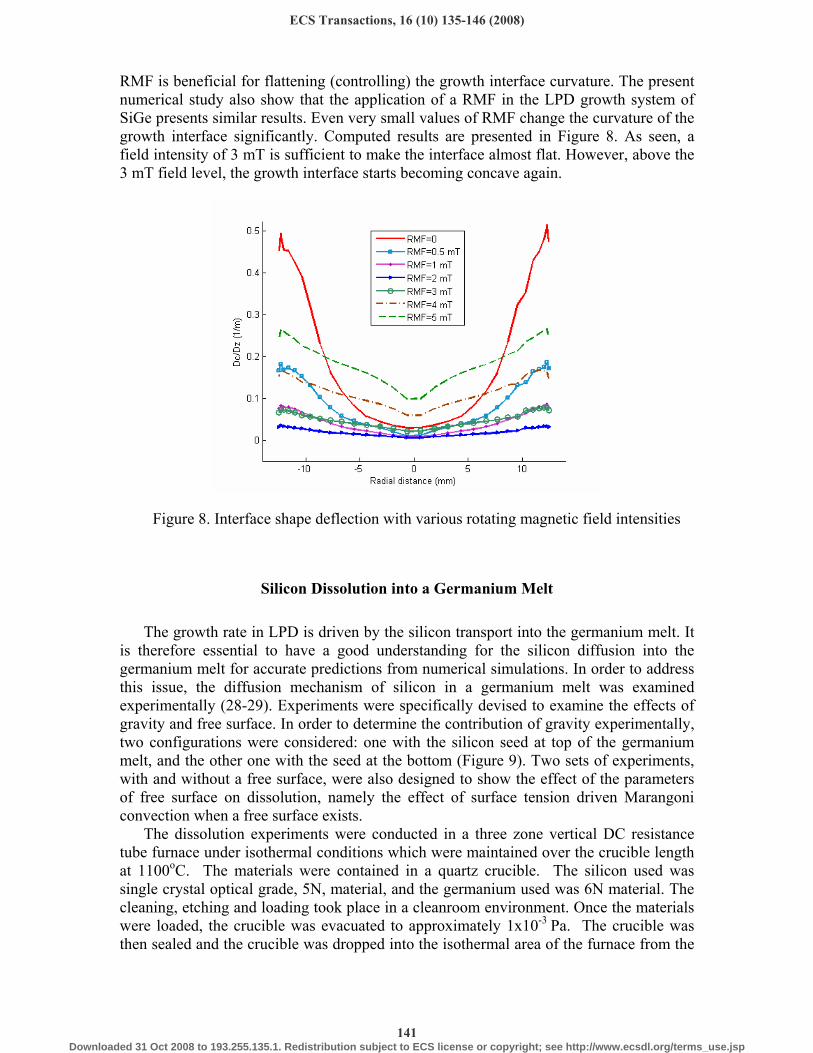
RMF is beneficial for flattening (controlling) the growth interface curvature. The present numerical study also show that the application of a RMF in the LPD growth system of SiGe presents similar results. Even very small values of RMF change the curvature of the growth interface significantly. Computed results are presented in Figure 8. As seen, a field intensity of 3 mT is sufficient to make the interface almost flat. However, above the 3 mT field level, the growth interface starts becoming concave again.
Figure 8. Interface shape deflection with various rotating magnetic field intensities
Silicon Dissolution into a Germanium Melt
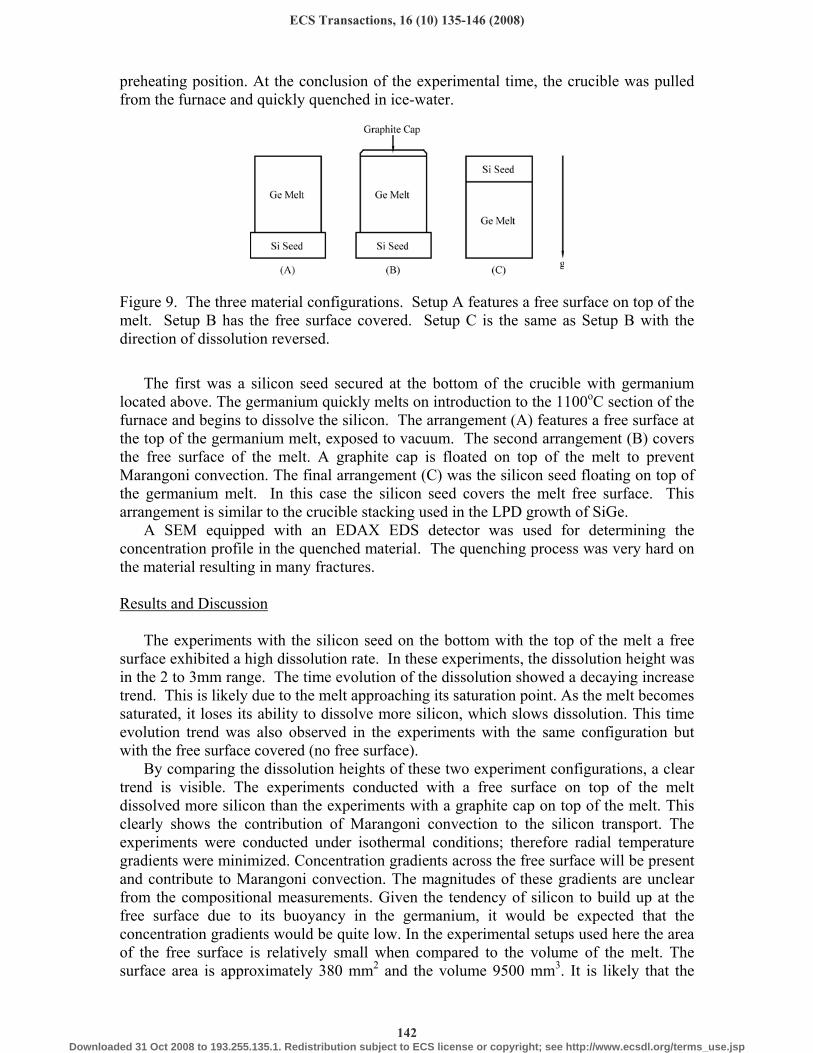
The growth rate in LPD is driven by the silicon transport into the germanium melt. It is therefore essential to have a good understanding for the silicon diffusion into the germanium melt for accurate predictions from numerical simulations. In order to address this issue, the diffusion mechanism of silicon in a germanium melt was examined experimentally (28-29). Experiments were specifically devised to examine the effects of gravity and free surface. In order to determine the contribution of gravity experimentally, two configurations were considered: one with the silicon seed at top of the germanium melt, and the other one with the seed at the bottom (Figure 9). Two sets of experiments, with and without a free surface, were also designed to show the effect of the parameters of free surface on dissolution, namely the effect of surface tension driven Marangoni convection when a free surface exists.
The dissolution experiments were conducted in a three zone vertical DC resistance tube furnace under isothermal conditions which were maintained over the crucible length at 1100oC. The materials were contained in a quartz crucible. The silicon used was single crystal optical grade, 5N, material, and the germanium used was 6N material. The cleaning, etching and loading took place in a cleanroom environment. Once the materials were loaded, the crucible was evacuated to approximately 1x10⁻³ Pa. The crucible was then sealed and the crucible was dropped into the isothermal area of the furnace from the
ECS Transactions, 16 (10) 135-146 (2008)
141Downloaded 31 Oct 2008 to 193.255.135.1. Redistribution subject to ECS license or copyright; see http://www.ecsdl.org/terms_use.jsp
preheating position. At the conclusion of the experimental time, the crucible was pulled from the furnace and quickly quenched in ice-water.
Figure 9. The three material configurations. Setup A features a free surface on top of the melt. Setup B has the free surface covered. Setup C is the same as Setup B with the direction of dissolution reversed.
The first was a silicon seed secured at the bottom of the crucible with germanium located above. The germanium quickly melts on introduction to the 1100oC section of the furnace and begins to dissolve the silicon. The arrangement (A) features a free surface at the top of the germanium melt, exposed to vacuum. The second arrangement (B) covers the free surface of the melt. A graphite cap is floated on top of the melt to prevent Marangoni convection. The final arrangement (C) was the silicon seed floating on top of the germanium melt. In this case the silicon seed covers the melt free surface. This arrangement is similar to the crucible stacking used in the LPD growth of SiGe.
A SEM equipped with an EDAX EDS detector was used for determining the concentration profile in the quenched material. The quenching process was very hard on the material resulting in many fractures.
Results and Discussion
The experiments with the silicon seed on the bottom with the top of the melt a free
surface exhibited a high dissolution rate. In these experiments, the dissolution height was in the 2 to 3mm range. The time evolution of the dissolution showed a decaying increase trend. This is likely due to the melt approaching its saturation point. As the melt becomes saturated, it loses its ability to dissolve more silicon, which slows dissolution. This time evolution trend was also observed in the experiments with the same configuration but with the free surface covered (no free surface).
By comparing the dissolution heights of these two experiment configurations, a clear trend is visible. The experiments conducted with a free surface on top of the melt dissolved more silicon than the experiments with a graphite cap on top of the melt. This clearly shows the contribution of Marangoni convection to the silicon transport. The experiments were conducted under isothermal conditions; therefore radial temperature gradients were minimized. Concentration gradients across the free surface will be present and contribute to Marangoni convection. The magnitudes of these gradients are unclear from the compositional measurements. Given the tendency of silicon to build up at the free surface due to its buoyancy in the germanium, it would be expected that the concentration gradients would be quite low. In the experimental setups used here the area of the free surface is relatively small when compared to the volume of the melt. The surface area is approximately 380 mm2 and the volume 9500 mm3. It is likely that the
ECS Transactions, 16 (10) 135-146 (2008)
142Downloaded 31 Oct 2008 to 193.255.135.1. Redistribution subject to ECS license or copyright; see http://www.ecsdl.org/terms_use.jsp
effect of surface tension would become magnified as this ratio is adjusted to higher surface area. This could be significant in crystal growth systems using large melts such as Czochralski. The contribution of free surface convection to mixing is substantial enough to warrant attention when considering SiGe growth systems.
(a) (b)
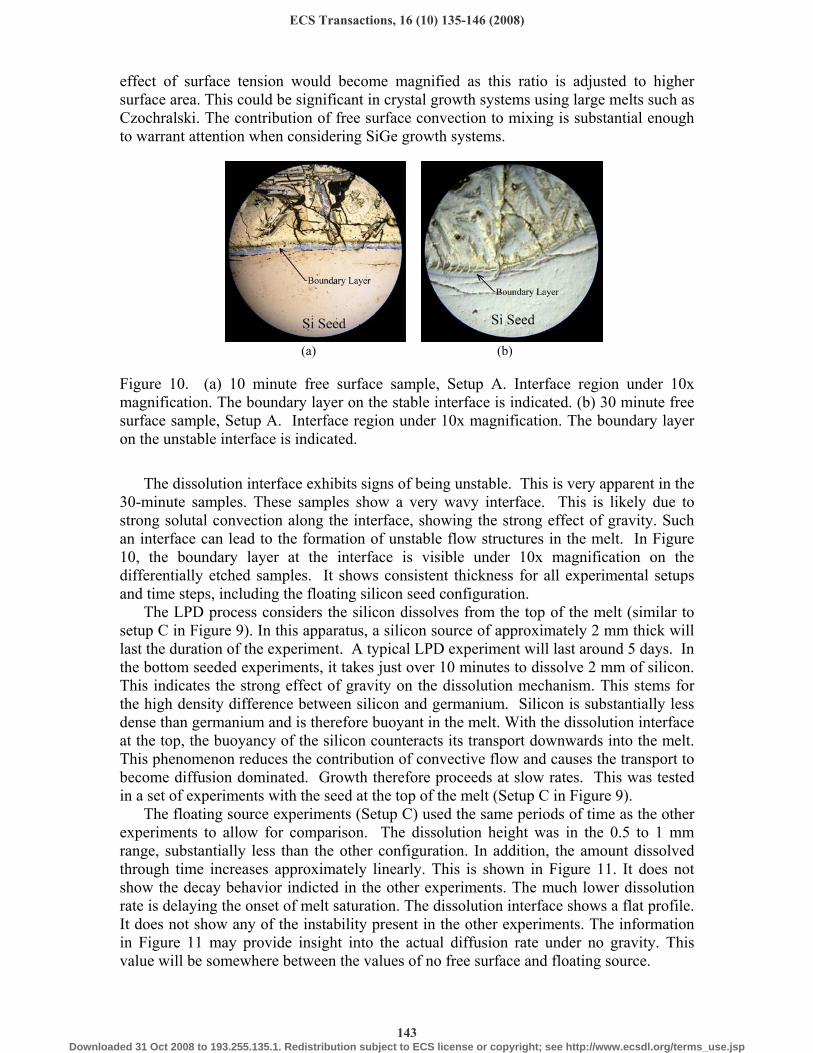
Figure 10. (a) 10 minute free surface sample, Setup A. Interface region under 10x magnification. The boundary layer on the stable interface is indicated. (b) 30 minute free surface sample, Setup A. Interface region under 10x magnification. The boundary layer on the unstable interface is indicated.
The dissolution interface exhibits signs of being unstable. This is very apparent in the
30-minute samples. These samples show a very wavy interface. This is likely due to strong solutal convection along the interface, showing the strong effect of gravity. Such an interface can lead to the formation of unstable flow structures in the melt. In Figure 10, the boundary layer at the interface is visible under 10x magnification on the differentially etched samples. It shows consistent thickness for all experimental setups and time steps, including the floating silicon seed configuration.
The LPD process considers the silicon dissolves from the top of the melt (similar to setup C in Figure 9). In this apparatus, a silicon source of approximately 2 mm thick will last the duration of the experiment. A typical LPD experiment will last around 5 days. In the bottom seeded experiments, it takes just over 10 minutes to dissolve 2 mm of silicon. This indicates the strong effect of gravity on the dissolution mechanism. This stems for the high density difference between silicon and germanium. Silicon is substantially less dense than germanium and is therefore buoyant in the melt. With the dissolution interface at the top, the buoyancy of the silicon counteracts its transport downwards into the melt. This phenomenon reduces the contribution of convective flow and causes the transport to become diffusion dominated. Growth therefore proceeds at slow rates. This was tested in a set of experiments with the seed at the top of the melt (Setup C in Figure 9).
The floating source experiments (Setup C) used the same periods of time as the other experiments to allow for comparison. The dissolution height was in the 0.5 to 1 mm range, substantially less than the other configuration. In addition, the amount dissolved through time increases approximately linearly. This is shown in Figure 11. It does not show the decay behavior indicted in the other experiments. The much lower dissolution rate is delaying the onset of melt saturation. The dissolution interface shows a flat profile. It does not show any of the instability present in the other experiments. The information in Figure 11 may provide insight into the actual diffusion rate under no gravity. This value will be somewhere between the values of no free surface and floating source.
ECS Transactions, 16 (10) 135-146 (2008)
143Downloaded 31 Oct 2008 to 193.255.135.1. Redistribution subject to ECS license or copyright; see http://www.ecsdl.org/terms_use.jsp

Figure 11. Plot showing the trends of all three sets of experiments. The linear increasing trend of the floating seed experiments is visible. The actual dissolution height without any gravity effect would be expected somewhere between the values of no free surface (Setup B) and floating seed (Setup C).
(b)
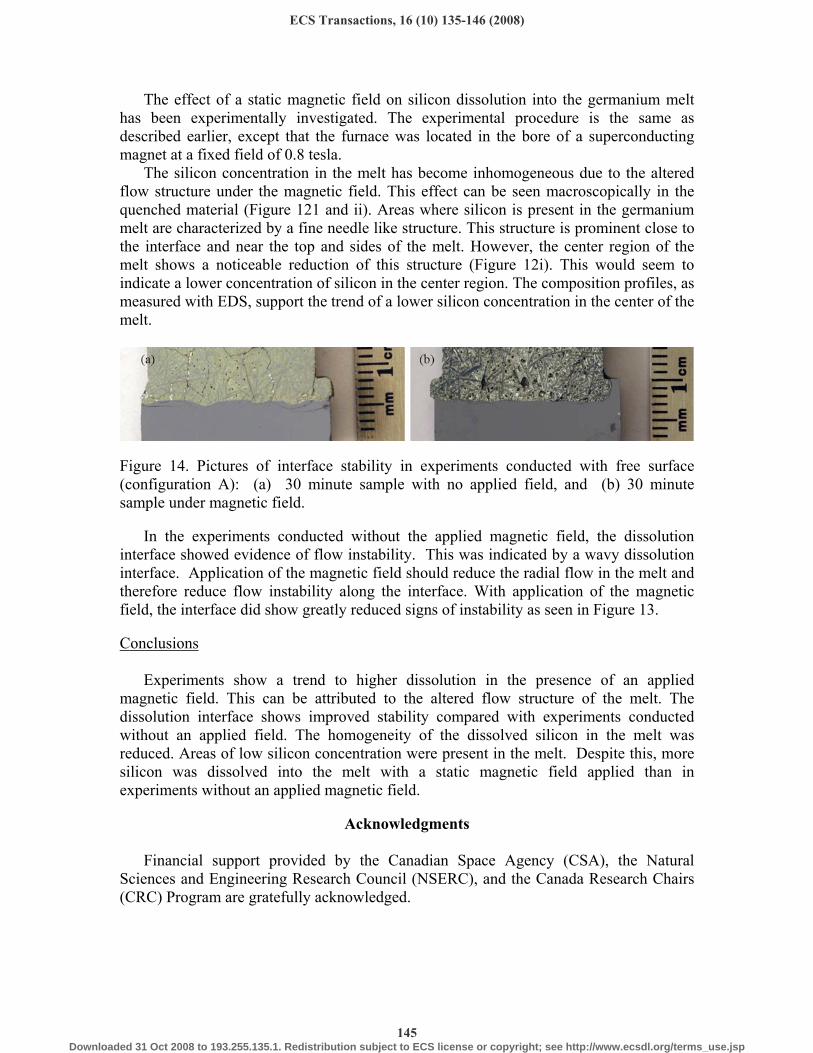
Figure 12. (a) The dissolved height of silicon versus experiment time. The experiments without magnetic field presented here were performed under the identical conditions of (28) other than the applied magnetic field. The trend to higher silicon dissolution in the presence of the magnetic field is clearly visible. (b) Pictures of the needle structure in the quenched samples. Both samples are for an experiment time of 20 minutes and the free surface was covered (configuration B). The samples were differentially etched to reveal the needle structure. (i) Sample from experiment conducted with magnetic field. (ii) Sample from experiment conducted without magnetic field. The silicon depleted center region is visible in the sample on the left where there is a lack of structure. Effect of an Applied Static Magnetic Field
(
(a)
ECS Transactions, 16 (10) 135-146 (2008)
144Downloaded 31 Oct 2008 to 193.255.135.1. Redistribution subject to ECS license or copyright; see http://www.ecsdl.org/terms_use.jsp
The effect of a static magnetic field on silicon dissolution into the germanium melt
has been experimentally investigated. The experimental procedure is the same as described earlier, except that the furnace was located in the bore of a superconducting magnet at a fixed field of 0.8 tesla.
The silicon concentration in the melt has become inhomogeneous due to the altered flow structure under the magnetic field. This effect can be seen macroscopically in the quenched material (Figure 121 and ii). Areas where silicon is present in the germanium melt are characterized by a fine needle like structure. This structure is prominent close to the interface and near the top and sides of the melt. However, the center region of the melt shows a noticeable reduction of this structure (Figure 12i). This would seem to indicate a lower concentration of silicon in the center region. The composition profiles, as measured with EDS, support the trend of a lower silicon concentration in the center of the melt.
Figure 14. Pictures of interface stability in experiments conducted with free surface (configuration A): (a) 30 minute sample with no applied field, and (b) 30 minute sample under magnetic field.
In the experiments conducted without the applied magnetic field, the dissolution interface showed evidence of flow instability. This was indicated by a wavy dissolution interface. Application of the magnetic field should reduce the radial flow in the melt and therefore reduce flow instability along the interface. With application of the magnetic field, the interface did show greatly reduced signs of instability as seen in Figure 13. Conclusions
Experiments show a trend to higher dissolution in the presence of an applied magnetic field. This can be attributed to the altered flow structure of the melt. The dissolution interface shows improved stability compared with experiments conducted without an applied field. The homogeneity of the dissolved silicon in the melt was reduced. Areas of low silicon concentration were present in the melt. Despite this, more silicon was dissolved into the melt with a static magnetic field applied than in experiments without an applied magnetic field.
Acknowledgments
Financial support provided by the Canadian Space Agency (CSA), the Natural Sciences and Engineering Research Council (NSERC), and the Canada Research Chairs (CRC) Program are gratefully acknowledged.
ECS Transactions, 16 (10) 135-146 (2008)
145Downloaded 31 Oct 2008 to 193.255.135.1. Redistribution subject to ECS license or copyright; see http://www.ecsdl.org/terms_use.jsp
References
1. Y.H. Luo, J. Wan, J. R.L. Forrest, J.L. Liu, M.S. Goorsky and K.L. Wang, J. Appl.
Phys., 89, 8279 (2001). 2. A.E. Fitzgerald, Y.H., Xie, M.L., Green, M.L., and et al., Appl. Phys. Lett., 59, 811
(1991). 3. P. Bhattacharya, J. Singh and I.E. Gular, Technical Report, Dept. of Electrical Engr.
and Computer Sc., The University of Michigan, Michigan, USA (1997). 4. B.S. Meyerson, K.E. Ismail, D.L. Harame, F.K. LeGoues, J.M.C. Stork,
Semiconductors Sci. Technol., 9, 2005 (1994). 5. D.J. Paul, Advanced Materials, 11(3), 191 (1999). 6. N.V. Abrasimov, S.N. Rossolenko, W. Thieme, A. Gerhardt and W. Schroder, J.
Crystal Growth, 174, 182 (1997). 7. Matsui, I. Yonenaga and K. Sumino, J. Crystal Growth, 183, 109 (1998). 8. M. Kurten and J. Schilz, J. Crystal Growth, 139, 1 (1994). 9. Yonenaga and M. Nonaka, J. Crystal Growth, 191, 393 (1998). 10. J. Wollweber, D. Schulz and W. Schroder, J. Crystal Growth, 163, 243 (1996). 11. P. Dold, A. Barz, S. Recha, K. Pressel, M. Franz and K.W. Benz, J. Crystal Growth,
192, 125 (1998). 12. A. Dahlen, A. Fattah, G. Hanke and E. Karthaus, Cryst. Res. Technol., 29, 187 (1994). 13. K. Nakajima, S. Kodama, S. Miyashita, G. Sazaki and S. Hiyamizu, J. Crystal
Growth, 205, 270 (1999). 14. D. Bliss, B. Demczyk, A. Anselm and J. Bailey, J. Crystal Growth, 174, 187 (1997). 15. Y. Azuma, N. Usami, T. Ujihara, G. Sazaki, Y. Murakami, S. Miyashita, K. Fijiwara
and K. Nakajima, J. Crystal Growth, 224, 204 (2001). 16. G. Sazaki, Y. Azuma, S. Miyashita, N. Usami, T. Ujihara, K. Fujiwara, Y. Murakami
and K. Nakajima, J. Crystal Growth, 236, 125 (2001). 17. K. Nakajima, T. Kusunoki, Y. Azuma, N. Usami, K. Fujiwara, T. Ujihara, G. Sazaki
and T. Shishido, J. Crystal Growth, 240, 373 (2002). 18. Y. Azuma, N. Usami, T. Ujihara, K. Fujiwara, G. Sazaki, Y. Murakami and K.
Nakajima, J. Crystal Growth, 250, 298 (2003). 19. Y. Nishijima, H. Tezuka and K. Nakajima, J. Crystal Growth, 280, 364 (2005). 20. N. Usami, M. Kitamura, K. Obara, Y. Nose, T. Shishido and K. Nakajima, J. Crystal
Growth, 284, 57 (2005). 21. S. Dost and B. Lent, Single Crystal Growth of Semiconductors from Metallic
Solutions, Elsevier, Amsterdam, 2007. 22. M. Yildiz, S. Dost and B. Lent., J. Crystal Growth, 280/1-2, 151 (2005). 23. M. Yildiz and S. Dost, Int. J. Engng. Sci., 43(13-14), 1059 (2005). 24. M. Yildiz, S. Dost and B. Lent, Crystal Res. Tech., 41(3), 211 (2006). 25. E. Yildiz, S. Dost and M. Yildiz, J. Crystal Growth, 291, 497 (2006). 26. E. Yildiz and S. Dost, J. Crystal Growth 303(1), 279 (2007). 27. M. Yildiz and S. Dost, Cryst. Res. Technol., 42(9), 914 – 919, 2007. 28. N. Armour, S. Dost and B. Lent, J. Crystal Growth, 299, 227-233, 2007. 29. N. Armour and S. Dost, J. Crystal Growth, 306(1), 200-2007, 2007.
ECS Transactions, 16 (10) 135-146 (2008)
146Downloaded 31 Oct 2008 to 193.255.135.1. Redistribution subject to ECS license or copyright; see http://www.ecsdl.org/terms_use.jsp
![DESORDRE ET DIFFUSION DIFFUSE - sorbonne …...X-Ray Diffraction in Crystals, Imperfect Crystals and Amorphous Bodies, A. Guinier, Dover publications. [] 1 exp( 2) 1 exp( 2 ) exp(](https://static.fdocuments.in/doc/165x107/5f21a2ebc937d12ad227faf5/desordre-et-diffusion-diffuse-sorbonne-x-ray-diffraction-in-crystals-imperfect.jpg)