Liquefaction, landslide and slope stability analyses of … Liquefaction, landslide and slope...
39
Liquefaction, landslide and slope stability analyses of soils: A case study of 1 soils from part of Kwara, Kogi and Anambra states of Nigeria 2 Olusegun O. Ige 1 , Tolulope A. Oyeleke 1 , Christopher Baiyegunhi 2 , Temitope L. Oloniniyi 2 3 and Luzuko Sigabi 2 4 1 Department of Geology and Mineral Sciences, University of Ilorin, Private Mail Bag 1515, 5 Ilorin, Kwara State, Nigeria 6 2 Department of Geology, Faculty of Science and Agriculture, University of Fort Hare, Private 7 Bag X1314, Alice, 5700, Eastern Cape Province, South Africa 8 Corresponding Email Address: [email protected] 9 10 ABSTRACT 11 Landslide is one of the most ravaging natural disaster in the world and recent occurrences in 12 Nigeria require urgent need for landslide risk assessment. A total of nine samples representing 13 three major landslide prone areas in Nigeria were studied, with a view of determining their 14 liquefaction and sliding potential. Geotechnical analysis was used to investigate the 15 liquefaction potential, while the slope conditions were deduced using SLOPE/W. The results 16 of geotechnical analysis revealed that the soils contain 6-34 % clay and 72-90 % sand. Based 17 on the unified soil classification system, the soil samples were classified as well graded with 18 group symbols of SW, SM and CL. The plot of plasticity index against liquid limit shows that 19 the soil samples from Anambra and Kogi are potentially liquefiable. The liquefaction screening 20 criteria also revealed that Anambra and Kogi are potentially susceptible to liquefaction, 21 whereas samples from Kwara are not susceptible to liquefaction. Samples from Kogi and 22 Anambra have lower values of MDD and OMC, ranging between 1.64-1.80 g/cm 3 and 8.0-12.3 23 % respectively. These values showed that the samples are granular material with soil having 24 anticipated embankments performance, subgrade and base material as poor-fair, fair-good and 25 good-poor, respectively. The direct shear strength test on the soil samples indicated that the 26 cohesion and angle of internal friction varies between 40-80 kPa and 24-35 o . The Coefficient 27 of permeability vary between 8.71 × 10 -5 and 1.18 × 10 -3 . The factor of safety (FOS) values for 28 soils from Anambra, Kogi and Kwara are 1.452, 1.946 and 2.488, respectively. These values 29 indicate stability but care must be taken as the condition at the site shows that the slope is in its 30 state of impending failure. The FOS for dry slope was higher when compared to the FOS values 31 from wet slope. This was due to the effect of pore water pressure on the soil as it reduced the 32 1 Nat. Hazards Earth Syst. Sci. Discuss., doi:10.5194/nhess-2016-297, 2016 Manuscript under review for journal Nat. Hazards Earth Syst. Sci. Published: 26 October 2016 c Author(s) 2016. CC-BY 3.0 License.
Transcript of Liquefaction, landslide and slope stability analyses of … Liquefaction, landslide and slope...

Liquefaction, landslide and slope stability analyses of soils: A case study of 1
soils from part of Kwara, Kogi and Anambra states of Nigeria 2
Olusegun O. Ige1, Tolulope A. Oyeleke 1, Christopher Baiyegunhi2, Temitope L. Oloniniyi2 3
and Luzuko Sigabi2 4
1Department of Geology and Mineral Sciences, University of Ilorin, Private Mail Bag 1515, 5
Ilorin, Kwara State, Nigeria 6
2Department of Geology, Faculty of Science and Agriculture, University of Fort Hare, Private 7
Bag X1314, Alice, 5700, Eastern Cape Province, South Africa 8
Corresponding Email Address: [email protected] 9
10
ABSTRACT 11
Landslide is one of the most ravaging natural disaster in the world and recent occurrences in 12
Nigeria require urgent need for landslide risk assessment. A total of nine samples representing 13
three major landslide prone areas in Nigeria were studied, with a view of determining their 14
liquefaction and sliding potential. Geotechnical analysis was used to investigate the 15
liquefaction potential, while the slope conditions were deduced using SLOPE/W. The results 16
of geotechnical analysis revealed that the soils contain 6-34 % clay and 72-90 % sand. Based 17
on the unified soil classification system, the soil samples were classified as well graded with 18
group symbols of SW, SM and CL. The plot of plasticity index against liquid limit shows that 19
the soil samples from Anambra and Kogi are potentially liquefiable. The liquefaction screening 20
criteria also revealed that Anambra and Kogi are potentially susceptible to liquefaction, 21
whereas samples from Kwara are not susceptible to liquefaction. Samples from Kogi and 22
Anambra have lower values of MDD and OMC, ranging between 1.64-1.80 g/cm3 and 8.0-12.3 23
% respectively. These values showed that the samples are granular material with soil having 24
anticipated embankments performance, subgrade and base material as poor-fair, fair-good and 25
good-poor, respectively. The direct shear strength test on the soil samples indicated that the 26
cohesion and angle of internal friction varies between 40-80 kPa and 24-35o. The Coefficient 27
of permeability vary between 8.71 × 10⁻⁵ and 1.18 × 10⁻³. The factor of safety (FOS) values for 28
soils from Anambra, Kogi and Kwara are 1.452, 1.946 and 2.488, respectively. These values 29
indicate stability but care must be taken as the condition at the site shows that the slope is in its 30
state of impending failure. The FOS for dry slope was higher when compared to the FOS values 31
from wet slope. This was due to the effect of pore water pressure on the soil as it reduced the 32
1
Nat. Hazards Earth Syst. Sci. Discuss., doi:10.5194/nhess-2016-297, 2016Manuscript under review for journal Nat. Hazards Earth Syst. Sci.Published: 26 October 2016c© Author(s) 2016. CC-BY 3.0 License.
Highlight
lenovo
Sticky Note
We suggest: "Liquefaction and landslide in soils from part of Kwara, Kogi and Anambra states of Nigeria"
lenovo
Highlight
lenovo
Sticky Note
From the text we deduce that the direct shear tests were performed on reconstructed samples.
lenovo
Highlight
lenovo
Sticky Note
The FOS values are calculated for slope models defined by: geometric characteristics, stratigraphy, geotechnical parameters of soils, pore water pressures, and failure surfaces. failures.
lenovo
Highlight
lenovo
Sticky Note
We think that is obvious.
lenovo
Highlight

2
shear strength of the soil. A reduced value of FOS was observed in the model under loading 33
conditions, which indicate that loading is also a contributing factor to the slope failure. It is 34
recommended that proper and efficient drainage system should be employed in these areas to 35
reduce the influence of pore water pressure in the soil. 36
Keywords: Liquefaction, landslide, slope stability, geotechnical analyses, Nigeria 37
38
1. INTRODUCTION 39
The effect of natural disaster in the world cannot be over-emphasized, as a number of failures 40
of embankments, natural slopes, earth structures and foundations have been attributed to the 41
liquefaction of sands, landslides and slope instability. According to the report documented by 42
National Research Council (1985), case studies of landslides or flow failures due to 43
liquefaction are the 1937 Zeeland coast of Holland slides involving 7 million cubic meters of 44
alluvial sands, and the 1944 Mississippi River slide near Baton Rouge containing about 4 45
million cubic meters of fine sands. Just to mention a few cases, failure of hydraulic fill dams 46
such as the Calaveras Dam (California) in 1918, Fort Peck Dam (Montana) in 1938, and Lower 47
San Fernando Dam (California) in 1971, were triggered by the liquefaction of sands. Landslides 48
are a major hazard in Africa where resources worth several millions of dollars are lost annually 49
during seasons of heavy and light rains. In West Africa, landslides are caused primarily by 50
rainfall. Depending on meteorological and geomorphologic conditions, individual rainfall 51
events can trigger small or large slope failures. 52
One of the most recent natural disasters threatening Nigeria is landslide. In Nigeria, landslide 53
has done a serious destruction to physical structure and resulted in the loss of lives and 54
properties. For instance, the December 2005 landslides in Umuchiani community of Anambra 55
state has led to the inhabitation of about 250 families, while over 20 communities in Awgu and 56
Oji-River Local Government Areas of Enugu State were thrown into serious difficulties by 57
landslides cutting off a portion of the Awgu-Achi-Oji River Federal road in October 58
2011. According to the report documented by State Emergency Management Agency (SEMA), 59
the landslide that occurred in Oko Community of Anambra State has rendered more than 150 60
people homeless. In addition, they reported that 15 buildings were destroyed, but no life was 61
lost. In 2013, no fewer than nine persons were buried alive, while many others sustained 62
injuries in the landslide that occurred at Edim Otop community of Calabar metropolis (Figure 63
1). The landslide occurred after heavy rainfall which lasted for more than five hours. Landslides 64
Nat. Hazards Earth Syst. Sci. Discuss., doi:10.5194/nhess-2016-297, 2016Manuscript under review for journal Nat. Hazards Earth Syst. Sci.Published: 26 October 2016c© Author(s) 2016. CC-BY 3.0 License.
lenovo
Highlight

3
induced by high-intensity or prolonged rainfalls constitute a major risk factor in Nigeria 65
especially because they have generally been poorly defined in the past. The landslides have the 66
potential to damage human settlements, industrial development, cattle ranch, forestry and 67
agricultural activities. Landslide is mass movement on slope involving rock fall, debris flow, 68
topples, and sliding (Varnes et al., 1984). Landslide occurs as result of the presence of saturated 69
clay materials on the impermeable layer on steep slopes. Landslide that occurred on a slope is 70
influenced by gravity. The internal and external causes of landslide is presented in Table 1. The 71
presence of soil moisture also increases the pore water pressure and lessens the material 72
stability. A change in pore water pressure is regarded as the main triggering factor to land 73
sliding (Ngecu and Mathu, 1999 and Knapen et al., 2006). If an external load is applied to a 74
soil mass on a slope in the form of additional water or overburden, the pore water pressure will 75
build up such that mass and water will be expelled at weak points (Alexander, 1993). 76
Slope instability is the condition which gives rise to slope movements (Alexander, 1993). In 77
every slope, there are forces (stresses) that tend to instigate or cause movement (shear stress), 78
and opposing forces which tend to resist movement (shear strength), (Bromhead, 1984; 79
Alexander, 1993). Sliding occurs when shear stress is greater than shear strength. In normal 80
circumstances, the shear stress is balanced by shear strength and a state of equilibrium is 81
maintained (Alexander, 1993). However, this equilibrium can be disturbed by stress increments 82
or weakening of frictional force. The failure of slope material depends partly on the strength of 83
frictional force between the sliding mass and the bedrock (Crozier, 1984; Alexander, 1993; and 84
Matsushi et al., 2006). Slope stability analysis can be performed using either total or effective 85
stress. Total stress analysis is applicable to embankments and multistage loading problems 86
where the short term condition is critical, while effective stress analysis should be used for 87
excavation problems where the long-term condition is critical (Duncan, 1996). The search for 88
the preparatory factors and cause(s) of an individual landslide or an attempt to designate the 89
state of instability is prompted to find an efficient way of responding to the problem by legal 90
necessity, or simply by a desire for knowledge (Crozier, 1984). The danger of slope instability 91
can never be over emphasized in its destructive property. To understand and evaluate 92
liquefaction potential of soils and degree of slope stability, as well as causes of landslide in the 93
area, three localities (Anambra, Kogi and Kwara state, Figure 3) that differ in geology and land 94
use were studied. While slope failure and landslides are common and frequent in the 95
mountainous parts of Anambra and Kogi state because of their unique geology, long-time 96
residents report that the recent landslides at Oko, in Anambra state (Figure 1) is the first major 97
Nat. Hazards Earth Syst. Sci. Discuss., doi:10.5194/nhess-2016-297, 2016Manuscript under review for journal Nat. Hazards Earth Syst. Sci.Published: 26 October 2016c© Author(s) 2016. CC-BY 3.0 License.
lenovo
Highlight
lenovo
Sticky Note
The reference is "Varnes, 1984"
lenovo
Sticky Note
...1984 or 1987 (...see in REFERENCES)
lenovo
Highlight
lenovo
Highlight
lenovo
Sticky Note
In Figure 3, the studied localities (areas) (named Anambra, Kogi and Kwara States) must be better individuated. The Figure 2 (Kogi State) is not cited before of the Figure 3.

4
slope failures despite the much higher elevation and steepness of slopes in the area. These 98
differences in scale and frequency were the major motivating factors for the research. 99
2. GEOLOGICAL BACKGROUND 100
Nigeria is a part of Africa that forms the continental crust and lies in the Pan-African mobile 101
belt that has been affected by Pan- African events during the ages of orogenic, epeiorogenetic, 102
tectonic and metamorphic cycles (Rahaman, 1976). The geology of Nigeria can be subdivided 103
into the Precambrian Basement Complex and Cretaceous to Tertiary sedimentary basins. The 104
Nigerian Basement Complex forms part of the Pan-African mobile belt and lies between the 105
West African and Congo Cratons (Figure 3) and to the south of Tuareg Shield (Black, 1980). 106
It consists of gneiss migmatite complex, schist belt and granitoids (older granites) of the 107
Archean, Paleoproterozoic and Neoproterozoic (Annor, 1998). The Nigerian basement 108
(Fig.2.1) was affected by the 600 Ma Pan-African orogeny and it occupies the reactivated 109
region which resulted from plate collision between the passive continental margin of the West 110
African craton and the active Pharusian continental margin (Burke and Dewey, 1972; Dada, 111
2006). About 50% of the total landmass of Nigeria is covered by sedimentary basins. These 112
basins are Bida Basin, Benue Trough, Chad Basin, Anambra Basin, Dahomey Basin and Niger 113
Delta Basin. The basins generally develop over the Precambrian basement and dominated by 114
clastic deposit and in places, ironstone and organic coal-bearing sediments (Nguimbous-115
Kouoh, 2012). The study area falls in both the Basement Complex and sedimentary areas. The 116
areas under sedimentary part of Nigeria are Oko in Anambra State and Agbaja in Kogi State, 117
while those in the Basement Complex are Eyenkorin and Asa Dam in Ilorin, Kwara State. 118
2.1 Location of the study area 119
2.1.1 Oko, Anambra State 120
Oko is situated in Orumba North Local Government Area (LGA) of Anambra state. It is 121
geographically situated between 6o02'37.34" N and 7o 04'54.32" E and has humid climatic 122
condition. The average annual rainfall in Oko is about 2,000 mm. Most rainfall occurs in well-123
defined rainy seasons of six to seven months (April to October) and is typically concentrated 124
in high intensity storms and often causes flooding and erosion leading to the formation of 125
gullies. Oko is a rain forest area and is characterized by vast undulating landscape and of 126
alluvial plain. Greater part of its vegetation is made up of forest (tropical vegetation). 127
128
129
Nat. Hazards Earth Syst. Sci. Discuss., doi:10.5194/nhess-2016-297, 2016Manuscript under review for journal Nat. Hazards Earth Syst. Sci.Published: 26 October 2016c© Author(s) 2016. CC-BY 3.0 License.
lenovo
Highlight
lenovo
Sticky Note
We have not clear "...the major motivating factors for the research. ...".
lenovo
Highlight
lenovo
Sticky Note
We think is Figure 3
lenovo
Highlight
lenovo
Sticky Note
In the REFERENCES: Nguimbous-Kouoh et al. (2012)
lenovo
Highlight
lenovo
Sticky Note
Are the study areas: Oko area, Agbaja area, Asa Dam and Eyenkorin areas ?
lenovo
Sticky Note
...insert (Fig. 1)
lenovo
Sticky Note
It is opportune to indicate: - the lithologies present in the study area; - a synthesis of landslide conditions.

5
2.1.2 Agbaja, Kogi State 130
Agbaja is the locality of a large iron ore deposit in Kogi State, central Nigeria. It is located on 131
a plateau about 300 km south of the capital Abuja, and more importantly about 70 km from the 132
heavy duty railway to the sea at Itakpe which is about 70 km to the south. It is geographically 133
situated between 7o56’53.33" N and 6o39’38.40" E. The land rises from about 300 m along the 134
Niger Benue confluence, to the heights of about 500 m above sea level in the uplands. Agbaja 135
Plateau, which ranges from 335-366 m above sea level, is one of the predominant landforms in 136
the state. The state is drained by the Niger and Benue rivers and their tributaries. 137
2.1.3 Asa Dam and Eyenkorin, Kwara State 138
The sample localities are located in Ilorin metropolis which is a Basement Complex terrain that 139
has undergone deep weathering. The Nigeria Basement Complex is a group of igneous and 140
metamorphic rocks of Precambrian age (Kogbe, 1975). It is largely undifferentiated and 141
constitutes about 50 % of the bedrock in Nigeria. Large outcrops of granite and gneisses with 142
cross-cutting pegmatites are common (Alao, 1983). The general trend of the outcrops in the 143
area is SW-NE with a west dip. 144
3. MATERIALS AND METHODS 145
3.1 Site visit and Data collection 146
Oko area in Anambra State, Agbaja Hill in Lokoja, Kogi State as well as Asa Dam and 147
Eyenkorin (Ilorin metropolis) in Kwara State of Nigeria were visited for soil sampling and to 148
evaluate existing conditions of slopes situated in the site. The weathered surface was removed 149
and the outcrop was horizontally dug inward in order to obtain fresh samples. The effective 150
soil sampling depth was determined using a screw soil auger, a surveying tape, depths of recent 151
landslides and slope remodelling. However, in areas where landslides had occurred, the 152
samples were collected from the sides of scar. In special cases, selection of sample locations 153
were based on indications of slope instability, mainly soil creeping and cracking. Coordinates 154
of the sampling pits (sites) and photographs were taken during field visits to provide additional 155
records. The collected fresh soil samples were transported to the Mechanical Engineering 156
Department’s soil laboratory, University of Ilorin, Nigeria for geotechnical tests in order to 157
access the probable mechanical behaviour. The investigated shear strength parameters of the 158
soil samples were later used in slope stability evaluation. 159
160
161
Nat. Hazards Earth Syst. Sci. Discuss., doi:10.5194/nhess-2016-297, 2016Manuscript under review for journal Nat. Hazards Earth Syst. Sci.Published: 26 October 2016c© Author(s) 2016. CC-BY 3.0 License.
lenovo
Sticky Note
...insert (Fig. 2)
lenovo
Sticky Note
...insert a new Figure or collect in Figure 1 the locations of the studied areas (Oko, etc.).
lenovo
Sticky Note
It is opportune to indicate: the lithologies present in the study area; a synthesis of landslide conditions.
lenovo
Sticky Note
It is opportune to indicate a synthesis of the landslide conditions.
lenovo
Highlight
lenovo
Sticky Note
Are the samples undisturbed?
lenovo
Sticky Note
Move in the section 3.2
lenovo
Highlight

6
3.2 Geotechnical analysis 162
Preliminary geotechnical classification and identification tests such as moisture content, bulk 163
density, specific gravity, grain size distribution, hydraulic conductivity, particle density, bulk 164
density, liquid limit, plastic limit, and plasticity index, compaction and shear strength tests were 165
carried out on the soil samples based on the British Standard (BSI 1377:1990). Each 166
geotechnical test was performed twice on the same soil sample under the same condition in 167
order to determine the reliability of the geotechnical test results. The result of the Atterberg 168
consistency limits were plotted after Seed et al. (1983; 2003) in order to deduce whether the 169
soils are susceptible to liquefaction. The boundaries in the gradation curves for soils susceptible 170
to liquefaction, as proposed by Tsuchida (1970) were also used to determine whether the soils 171
are susceptible to liquefaction. 172
3.2.1 Grain Size Analysis 173
Mechanical and hydrometer methods were used to determine the grain size distributions. The 174
mechanical method (wet sieving) was employed in the analysis of particles that are greater than 175
0.075 mm in diameter. A calibrated (ASTM 152H) hydrometer was used to analyse the finer 176
grains (d < 0.075 mm) in the laboratory. 177
3.2.1.1 Procedures for mechanical method (wet sieving) 178
The soil particles were gently separated from each other. The sieve set (stack of sieves) were 179
arranged in descending order from the top with a retainer beneath it. 100 g of each soil sample 180
was weighed and poured into the sieve stack. The soil filled sieve stack was placed on the 181
mechanical sieve shaker for about 10 minutes. The sieve stack was later separated and the soil 182
fraction retained by the mesh of each sieve was retrieved. The soil fraction retained by each 183
sieve was weighed and the statistical data of the grain size analysis was computed. 184
3.2.1.2 Procedures for hydrometer method 185
The sieved clay and silt from the sieve washing was collected in a container and allowed to 186
settle. The supernatant water was decanted and the mud residue was dried in the drying oven 187
for about 24 hours. 500 g of the dried mud was soaked in distilled water for 24 hours and mixed 188
properly in a stirrer with a dispersive agent (hexametaphosphate) added to avoid flocculation 189
of the grains. The suspension was poured into 1 litre measuring cylinder and mixed before the 190
soil grains were allowed to settle in the suspension. The hydrometer was later inserted into the 191
water in the measuring cylinder and its reading was recorded periodically. As the settling 192
proceeds, the hydrometer sinks deeper into the solution. The temperature at each hydrometer 193
Nat. Hazards Earth Syst. Sci. Discuss., doi:10.5194/nhess-2016-297, 2016Manuscript under review for journal Nat. Hazards Earth Syst. Sci.Published: 26 October 2016c© Author(s) 2016. CC-BY 3.0 License.
lenovo
Highlight
lenovo
Sticky Note
We suggest to write "tests" instead of "analysis"
lenovo
Sticky Note
In general, these tests were carried out based on BSI, list only non-standard details that have been used, if is the case.
lenovo
Highlight
lenovo
Highlight
lenovo
Sticky Note
In general, these tests were carried out based on BSI, list only non-standard details that have been used, if is the case.
lenovo
Highlight
lenovo
Sticky Note
In general, these tests were carried out based on BSI, list only non-standard details that have been used, if is the case.
lenovo
Highlight
lenovo
Sticky Note
Insert the correct reference.

7
reading was recorded and then a statistical data sheet was produced showing the results of the 194
analysis. The clay and silt percentage in the samples were then calculated from the graph 195
obtained by plotting percentage passing against the grain diameters. 196
3.2.2 Atterberg limits determination 197
To determine the liquid limit of the soil samples, the fraction of the soil that passed through the 198
425μm sieve was weighed (230 g) on a weighing balance and carefully mixed with clean water 199
in order to form a thick homogeneous paste. A groove was cut through the paste (soil sample) 200
that was placed inside the Casangrade’s apparatus cup and the numbers of blows were counted 201
and recorded until the groove in the soil closes. The moisture contents were determined and 202
the moisture contents were plotted against the numbers of blows in order to determine the liquid 203
limit. To determine the plastic limit, soil sample was also taken from the soil sample that passes 204
through the 425μm sieve and weighed on the balance. Then it was thoroughly mixed with water 205
using the hand until it becomes homogenous and plastic enough to form ellipsoidal-circular 206
shape (i.e. ball). The ball-shaped soil was rolled in a rolling device until the thread cracks or 207
crumbles at about 4 mm diameter. The crumbled sample (4 mm) was then air-dried thus the 208
moisture contents were determined. 209
3.2.3 Procedures for compaction test 210
3 kg of soil sample was weighed and poured into the mixing pan. 120 cm³ (4 %) of water was 211
measured, added and mixed with the soil in the mixing pan using a hand trowel. The cylinder 212
mould was placed on a base plate, then a representative specimen of the soil was put into the 213
mould and compacted with 25 evenly distributed blows of the rammer. This represents the first 214
layer. After the compaction, the volume of soil in the mould reduced, more soil specimen was 215
added into the mould and compacted with another 25 evenly distributed blows. The extension 216
collar was fixed unto the mould. This is mainly for the last layer and removed after the last 217
layer was made and aided to achieve a smooth level surface. The mould was filled with more 218
of the soil specimen and compacted to make the third layer. This is for standard Proctor, and 219
five layers of the soil specimen with 55 evenly distributed blows of the rammer makes the 220
modified Proctor. The mould with the soil was weighed and the soil was sampled at the top 221
and bottom of the mould for water content and the dry density determination. The mould was 222
emptied into the mixing pan and another 120 cm³ (4%) of water was added to the soil and 223
mixed. The same procedure was repeated for all the samples. The dry densities were plotted 224
against water contents for the standard Proctor and modified Proctor in order to determine the 225
Nat. Hazards Earth Syst. Sci. Discuss., doi:10.5194/nhess-2016-297, 2016Manuscript under review for journal Nat. Hazards Earth Syst. Sci.Published: 26 October 2016c© Author(s) 2016. CC-BY 3.0 License.
lenovo
Highlight
lenovo
Highlight
lenovo
Sticky Note
In general, these tests were carried out based on BSI, list only non-standard details that have been used, if is the case.
lenovo
Sticky Note
In general, these tests were carried out based on BSI, list only non-standard details that have been used, if is the case.

8
maximum dry densities (MDD) and optimum moisture contents (OMC) of the soil samples in 226
each situation. 227
3.2.4 Shear strength determination 228
Two 3 kg of both soil samples (standard and modified Proctor for each soil sample) were 229
weighed and mixed with the corresponding optimum moisture content. The soil samples were 230
then compacted as described in the above procedure. A square sampler was then gently used 231
to collect a representative sample. Each collected sample was placed in a shear box and a load 232
was placed on it both in horizontal and vertical positions and the deformation dial gauges were 233
set at zero. A set of normal loads of 5 kg, 10 kg, 15 kg and 20 kg were applied one after the 234
other in successive tests. The readings on the load dial units were recorded, and the procedure 235
was repeated for the standard Proctor and modified Proctor for other samples. The shear 236
strength results were presented as stress-strain curves and the shear stress was plotted against 237
the normal stress, thus the angle of cohesion and angle of internal friction were determined. 238
3.3 Method of slices using SLOPE/W software 239
The slope model was analysed using SLOPE/W and SEEP/W software with the aim of giving 240
the state of the slopes with their factor of safety using Limit Equilibrium Method (LEM).The 241
software computes the factor of safety (FOS) for various shear surfaces (SS), for example 242
circular and non-circular. However, only the circular SS was automatically searched. The 243
method of slices was considered in relation to its application to SLOPE/W and traditional 244
methods of analysis. According to Abramson et al. (2002) slices method is widely used by 245
much computer software because it can accommodate geometry of complex slope, different 246
soil conditions and influence of external boundary loads. Conventionally, the weight of soil 247
lying at a particular point should influence the stress acting normal to that point on sliding 248
surface. Theoretically, the basic principle of slices method is the potential slide mass, which is 249
subdivided into several vertical slices and the equilibrium of individual slice can be evaluated 250
in terms of forces and moments. This would allow easy estimation of the allowable safety factor 251
of a slide mass. In this study, two soil layers obtained from shear strength test, with different 252
strength parameters were used for slope stability analyses. This same shear strength parameters 253
were used in both dry and wet conditions. Similarly, two unit weight of soils, one above the 254
groundwater table (GWT) and the other below the GWT were also considered. The complete 255
set of input parameters used in the study are shown in Table 9. The three different conditions 256
considered for slope stability analyses are dry slope, wet slope and dry slope with external 257
loads. The analysed load conditions were defined as: 258
Nat. Hazards Earth Syst. Sci. Discuss., doi:10.5194/nhess-2016-297, 2016Manuscript under review for journal Nat. Hazards Earth Syst. Sci.Published: 26 October 2016c© Author(s) 2016. CC-BY 3.0 License.
lenovo
Sticky Note
The collected samples are "reconstructed samples". We think that must be proved their representativeness of the soils present in the study areas.
lenovo
Highlight
lenovo
Sticky Note
...use the SI standard
lenovo
Highlight
lenovo
Highlight
lenovo
Highlight
lenovo
Sticky Note
List only non-standard details that have been used, if is the case.
lenovo
Sticky Note
List only non-standard details that have been used, if is the case.
lenovo
Sticky Note
We suggest "Parametric analysis of the slope stability" as title of this sub-section
lenovo
Highlight
lenovo
Highlight
lenovo
Sticky Note
We suggest to delete this part and introduce the software manual as reference
lenovo
Highlight
lenovo
Sticky Note
We suggest to delete this part and introduce a reference for example Abramson et al. (2002)
lenovo
Sticky Note
The elements that concur to the geotechnical model, of representative slopes in the study areas, must be defined in more complete and clear form
lenovo
Highlight
lenovo
Highlight
lenovo
Sticky Note
...in this position Table 9 must be numbered as Table 2
lenovo
Highlight
lenovo
Sticky Note
The parametric analysis of the stability conditions proposed, must be supported by geological, geomorphological, hydrogeological and geotechnical conditions that can be assumed as representative in the study areas. We don't find in the paper a clear description of the required conditions.
lenovo
Sticky Note
...insert references and details, if necessary, about the permeability tests used
lenovo
Highlight

9
Case 1: Completely dry slope, i.e. no GWT inside the model, 259
Case 2: Completely saturated slope, i.e. GWT on the surface (hydrostatic pore pressure), 260
Case 3: Dry slope with external forces, i.e. q = 40 and 50 kPa. 261
The stability of the dry slope was first analysed in SLOPE/W. The minimum factor of 262
safety (FOS), critical slip surfaces (CSS) were searched by entry and exit option as well as 263
groundwater table (GWT) level shown in the model using limit equilibrium (LM) principle. 264
The CSS was searched from thousands of possible SS by defining the input of 15 265
slices, 1500 iterations, 15 increments for entry, 10 increments for exit and 5 increments for 266
radius. In addition to the limit equilibrium methods (LEM), the Bishop’s and Janbu’s simplified 267
methods as well as the Spencer and Morgenstern-Price (M-P) factors of safety were used for 268
rotational and irregular surface failure mechanisms. 269
4. RESULTS AND DISCUSSION 270
4.1 Grain size distribution and soil classification 271
The results of grain size analysis is shown in Figure 4 and Table 2. The grain size distribution 272
curves show that the soil samples consist of all fractions ranging from gravely to clayey. The 273
clay content is found between 2-34 % in all the soil samples. The soil sample from Asa Dam 274
road in Ilorin, which is plastic in nature has the highest clay content of about 34 %. Soil samples 275
from Lokoja and Anambra states have very low fine content ranging from 2-12 % and are not 276
plastic in nature. The sand fraction dominated the samples (constituted about 70-80 % of the 277
samples) especially those gotten from Lokoja and Anambra states. Similarly, the grading 278
coefficient (Cu = D60/D10) varies from 5-275, except for the sample from Asa Dam 1 with Cu 279
of 2000. Based on the Unified Soil Classification System (ASTM D2487-90, 1992), all the soil 280
samples are classified as well graded with group symbols SW, SM and CL (Figures 4 and 5; 281
Table 2). 282
4.2 Atterberg limit 283
The summary of results obtained from moisture content, liquid limit, plastic limit and plasticity 284
index analyses are presented in Figure 6 and Table 3. The plasticity charts (Figure 7) was used 285
to classify the samples and most of the samples are above A-line (Figure 8). Eyenkorin 1, 2 286
and Asa Dam 1, 2 are in the region with symbol CL, thus they are classified as inorganic clays 287
of medium compressibility. Anambra 1, 2 and Lokoja 1, 2 and 3 falls in the CL-ML region and 288
thus they are classified as cohesionless and inorganic silts of low compressibility. 289
290
Nat. Hazards Earth Syst. Sci. Discuss., doi:10.5194/nhess-2016-297, 2016Manuscript under review for journal Nat. Hazards Earth Syst. Sci.Published: 26 October 2016c© Author(s) 2016. CC-BY 3.0 License.
lenovo
Highlight
lenovo
Sticky Note
...in this position Table 2 must be numbered as Table 3
lenovo
Highlight
lenovo
Highlight
lenovo
Sticky Note
...it is sufficient the reference (ASTM, 1992), remove Figure 5
lenovo
Sticky Note
The standard cited considers other coefficients, see Figure 5
lenovo
Highlight
lenovo
Highlight
lenovo
Sticky Note
...remove Figure 7, it is not essential
lenovo
Highlight
lenovo
Sticky Note
...in this position Table 2 must be numbered as Table 3
lenovo
Highlight
lenovo
Sticky Note
...in this position Table 3 must be numbered as Table 4

10
4.3 Compaction test 291
The compaction test at standard state condition yielded maximum dry densities (MDD) of 292
1.84g/cm3 and 1.88g/cm3 for Eyenkorin 1 and 2, respectively (Figure 9). The optimum moisture 293
content (OMC) for Eyenkorin (in Kwara state) 1 and 2 are 14.0 % and 13 %, respectively. 294
Samples from Lokoja (Kogi state) and Oko (Anambra state) have lower values of MDD and 295
OMC, ranging between 1.64-1.80 g/cm3 and 8.0-12.3 %, respectively. These values when 296
compared to Table 4 show that the samples can be described as granular material with soil 297
having anticipated embankments performance as poor to fair, value as subgrade material as fair 298
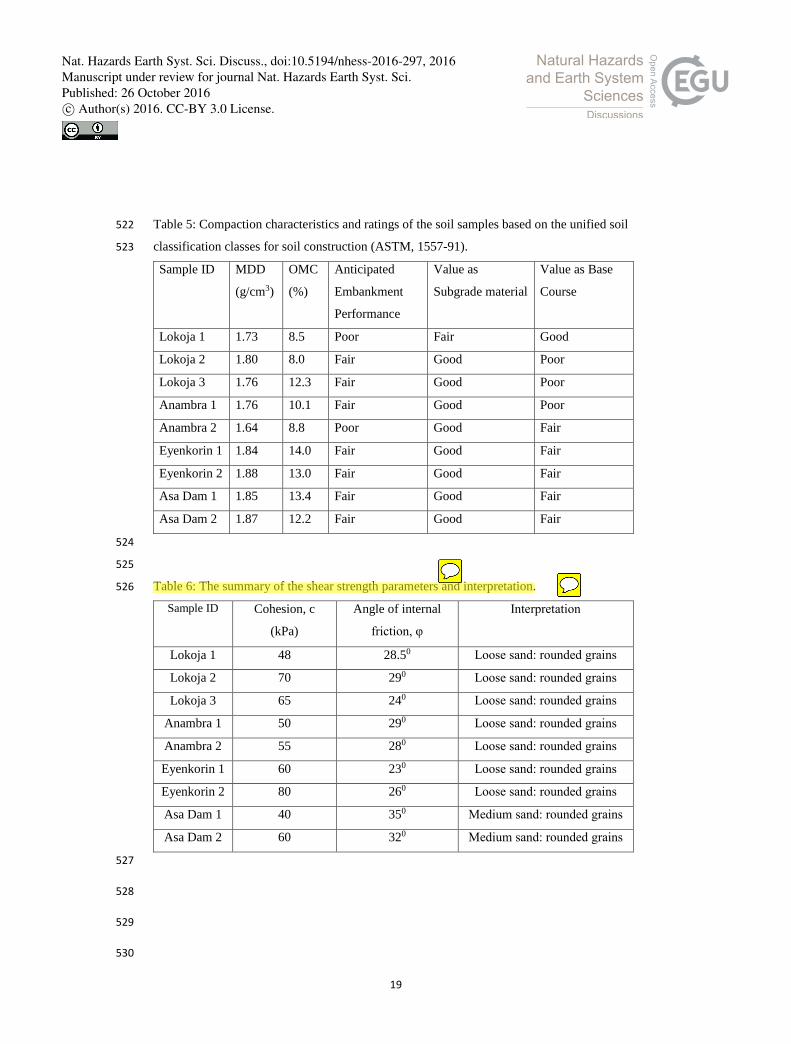
to good and value as a base course as good to poor (Table 5). 299
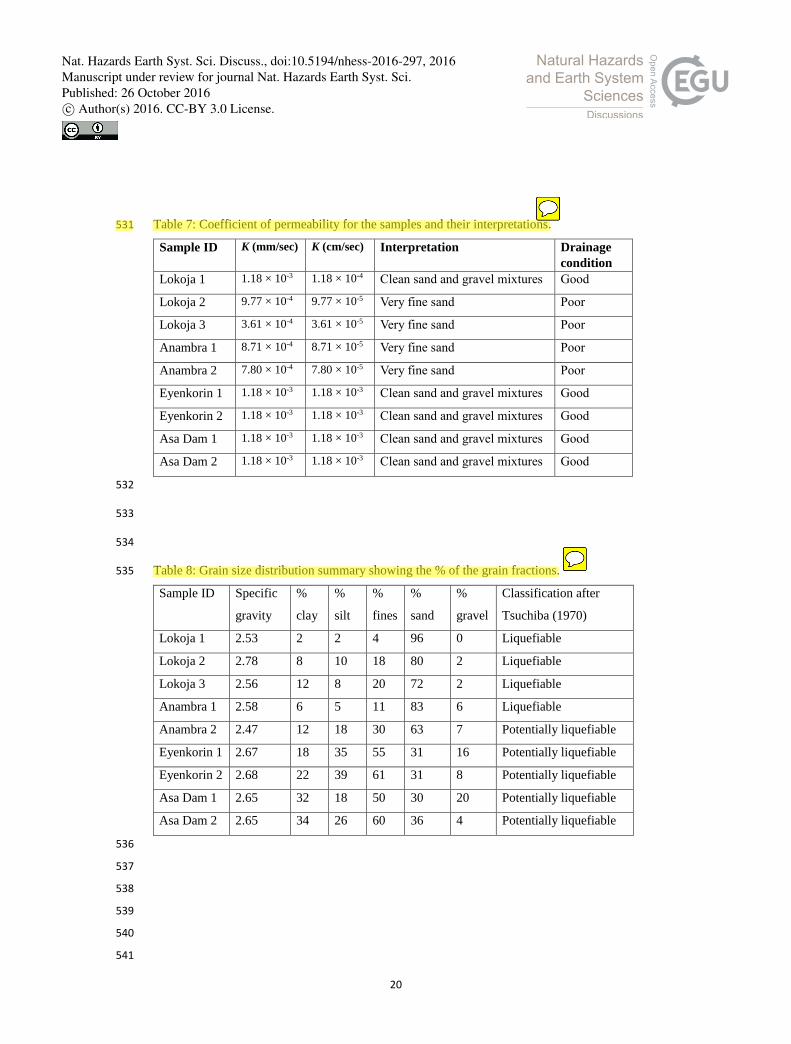
4.4 Shear strength and permeability 300
The summary of shear strength and permeability results, as well as their interpretations are 301
tabulated in Tables 6 and 7. The direct shear strength test on the soil samples show that the 302
cohesion and angle of internal friction varies between 40-80 kPa and 24-35o. The Coefficient 303
of permeability of the soil samples vary between 8.71 × 10⁻⁵ and 1.18 × 10⁻³. 304
4.5 Liquefaction susceptibility 305
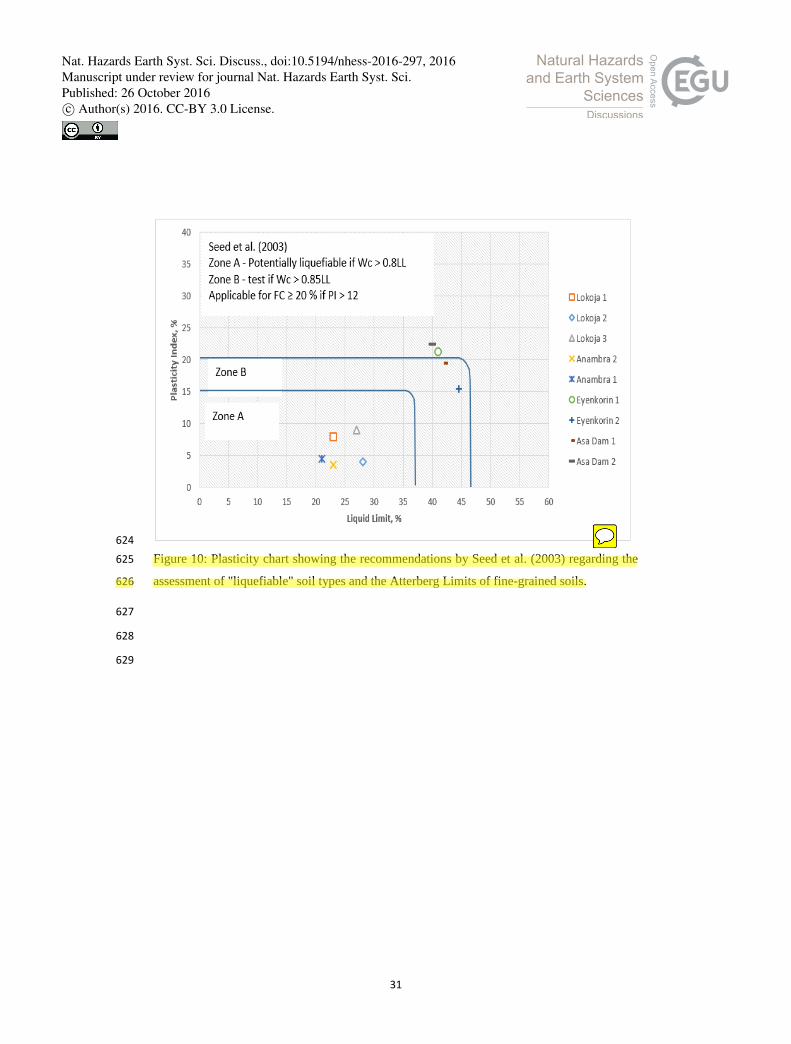
The results of liquefaction studies after Seed et al. (1983; 2003) are depicted in Figures 10 and 306
11. Liquefaction involves the temporary loss of internal cohesion of material, such that it 307
behaves as a viscous fluid rather than as a soil (Alexander, 1993). Soils containing a high 308
percentage of sand and silt will deform more quickly than those containing high percentage of 309
clay. Due to their cohesive strength, clays adjust more slowly to increase pore-water pressure 310
than unconsolidated soils. The plot of plasticity index against Liquid limit after Seed et al. 311
(2003) shows that the soil samples from Anambra and Lokoja are potentially liquefiable. The 312
liquefaction screening criteria after Andrews and Martin (2000) also shows that Oko 313
(Anambra), Eyenkorin (Kwara) and Lokoja (Kogi) are potentially susceptible to liquefaction, 314
whereas samples from Asa Dam 1 - 2 (Kwara) are not susceptible to liquefaction (Figure 11). 315
Boundaries in the gradation curves for soils were used to determine liquefaction susceptibility 316
of the soil samples (Tsuchida, 1970). Boundary most susceptible to liquefaction is in the sand 317
region, with about 60-80 % of sand, whereas boundary for potentially liquefiable soil is in the 318
region of 20-40 % sand (Tsuchida, 1970). Soils with a higher percentage of gravels tend to 319
mobilize higher strength during shearing, and to dissipate excess pore pressures more rapidly 320
than sands. However, there are case histories indicating that liquefaction has occurred in loose 321
gravelly soils (Seed, 1968; Ishihara, 1985; Andrus et al., 1991) during severe ground shaking 322
Nat. Hazards Earth Syst. Sci. Discuss., doi:10.5194/nhess-2016-297, 2016Manuscript under review for journal Nat. Hazards Earth Syst. Sci.Published: 26 October 2016c© Author(s) 2016. CC-BY 3.0 License.
lenovo
Highlight
lenovo
Sticky Note
...remove Table 4, it is sufficient the reference (ASTM, 1557-91 1991)
lenovo
Highlight
lenovo
Sticky Note
...use the SI standard
lenovo
Highlight
lenovo
Sticky Note
...use the SI standard
lenovo
Highlight
lenovo
Sticky Note
...reconstructed soil samples!!
lenovo
Highlight
lenovo
Sticky Note
...insert unit of measure
lenovo
Sticky Note
We think that it is necessary to furnish a discussion of the obtained results with reference to the lithologies present in the studied areas
lenovo
Sticky Note
...(Figure 10)
lenovo
Sticky Note
...remove Table 7
lenovo
Highlight

11
or when the gravel layer is confined by an impervious layer. Based on Tsuchida (1970) 323
classification, it can be deduced that soil samples from Anambra 1and Lokoja 1-3 have % of 324
sand ranging from 72-96 %, thus they are liquefiable in nature (Figure 12; Table 8). Anambra 325
2 has 63 % of sand which is potentially liquefiable, based on the classification proposed by 326
Tsuchiba (1970). Some of the soil samples fall outside Tsuchida's boundaries and Walker and 327
Steward (1989) documented that non-plastic and low plasticity silts, despite having their grain 328
size distribution curves outside of Tsuchida's boundaries for soils susceptible to liquefaction, 329
have a potential for liquefaction similar to that of sands. In addition, they further stated that 330
increased plasticity will reduce the level of pore pressure response in silts. This reduction, 331
however, is not significant enough to resist liquefaction for soils with plasticity indices of ≤ 5. 332
4.6 Landslide and slope stability 333
Slope angles, slope length play important roles in the stability of slopes. The slope angle is 334
regarded as the major topographic factor in determining stability. The physical characteristics 335
of the terrain influencing slope instability were measured. The characteristics recorded 336
included slope length, angles, and altitude. The slope angles can be classified as steep angle as 337
they are close to 60-70o in the study areas. Though the embankment slopes in Asa Dam area 338
and Eyenkorin area have values in the range of 30-35o and are classified as moderate angles. 339
The factor of safety (FOS) gotten from SLOPE/W software were used to classify the slopes 340
into safe, state of impending failure and failed slopes. Several authors have proposed different 341
values for slope classification. The general and acceptable value for stable slope is 1.5, whereas 342
a value less than 1 is always classified as unsafe. The analysed samples have values ranging 343
from 1.366 - 2.488 (Figure 13-19; Table 10). The value of 1.366 is from the Oko area in 344
Anambra state where landslide occurred. The maximum value of 2.488 was obtained at Asa 345
Dam, which is an embankment slope and it depicts stable slope. The FOS for dry slope was 346
higher when compared to the FOS values from wet slope (Figure 13). This was due to the effect 347
of pore water pressure on the soil as it reduced the shear strength of the soil. Figure 14 shows 348
the critical slip surface (CSS) and factor of safety (FOS) for non-optimised wet slope. The slip 349
surface was at the top of the slope (Figure 13a) whereas in Figure 13b, it shows the CSS passing 350
through ground water table (GWT), thus making the slip surface size bigger and occupies all 351
of the entry point. Since suction effect has not been considered in the analysis, the located 352
GWT has serious effect on the FOS. Figure 14 shows an increased in the geometry, and the 353
CSS and FOS was affected drastically. The reduction in FOS from 2.51 to 1.45 (Figure 13) is 354
an indication of the effect of pore water pressure and gravity on the failed site. Limit 355
Nat. Hazards Earth Syst. Sci. Discuss., doi:10.5194/nhess-2016-297, 2016Manuscript under review for journal Nat. Hazards Earth Syst. Sci.Published: 26 October 2016c© Author(s) 2016. CC-BY 3.0 License.
lenovo
Sticky Note
...remove Figure 12, it is sufficient the reference (Tsuchida, 1970)
lenovo
Highlight
lenovo
Highlight
lenovo
Sticky Note
...but "...Boundary most susceptible to liquefaction is in the sand region, with about 60-80 % of sand, whereas boundary for potentially liquefiable soil is in the region of 20-40 % sand (Tsuchida, 1970). ..."
lenovo
Sticky Note
...insert a reference or explain this assertion
lenovo
Highlight
lenovo
Highlight
lenovo
Sticky Note
We suggest "Parametric analysis of the slope stability" as title of this sub-section
lenovo
Highlight
lenovo
Highlight
lenovo
Highlight
lenovo
Sticky Note
The elements that concur to the geotechnical schemes used for the parametric analysis, of representative slopes in the study areas, must be defined in more complete and clear form
lenovo
Sticky Note
It is necessary to report that the assessment of the shear strength was carried out on reconstructed samples
lenovo
Highlight
lenovo
Highlight
lenovo
Sticky Note
The discussed results demonstrate that the geotechnical schemes adopted to carry out the parametric analysis are not representative of the slopes that in the studied areas are interested by landslides.
lenovo
Sticky Note
...remove Table 8
lenovo
Highlight
lenovo
Highlight
lenovo
Highlight
lenovo
Highlight
lenovo
Sticky Note
...numbered as Table 7 in this position

12
equilibrium methods computed the values of FOS slightly lower than 1.5 which depict 356
instability. The pore pressure at the toe causes reduction in the effective normal stresses, and 357
hence the shear strength. 358
Two of the primary assumptions of Bishop’s simplified method ignores interslice shear forces 359
and satisfies only moment equilibrium. However, not considering shear forces in the General 360
Limit Equilibrium (GLE) terminology mean that lambda (λ) is zero. As a result, the Bishop’s 361
Simplified factor of safety falls on the moment curve in Figure 17 where lambda is zero. 362
Janbu’s Simplified method also ignores interslice shear forces and only satisfies force 363
equilibrium. The Janbu’s Simplified factor of safety consequently falls on the force curve in 364
Figure 17 where λ is zero. The Spencer and Morgenstern-Price (M-P) factors of safety are 365
determined at the point where the two curves cross. At this point the factor of safety satisfies 366
both moment and force equilibrium. Whether the crossover point is the Spencer or M-P factor 367
of safety depends on the interslice force function. Spencer only considered a constant X/E ratio 368
for all slices, which in the GLE formulation corresponds to a constant (horizontal) interslice 369
force function. 370
371
5. CONCLUSION 372
Liquefaction was suspected as the main cause of the landslide that occurred in Oko area of 373
Anambra State. The results from gradation curve which gave over 80% sand for the samples 374
from Lokoja and Anambra suggested that liquefaction is possible in the area if necessary 375
vibration is generated either from blasting or trucks/vehicular movement. In addition, from the 376
satellite image, the terrain is rugged in nature and the slope is steep which can facilitate 377
landslide by gravity. The results from the Atterberg limits show mixed values and therefore 378
making it difficult to use the values in the liquefaction interpretation. The liquefaction effects 379
on the soils has been proven to be one of the strong factors in the failure of these sites especially 380
the site at Oko area in Anambra State. With necessary vibration, liquefaction in those sites 381
could be a serious issues because of the composition of the grains (70-90%) sand and low 382
plasticity. The FOS values for Anambra 1-2, Lokoja 1-3, Eyenkorin 1-2 and Asa Dam 1-2 are 383
1.452, 1.946, 2.196 and 2.488, respectively. These values indicate stability but care must be 384
taken as the condition at the site shows that the slope is in its state of impending failure. 385
Optimisation effects was also tried and the results shown that loads on these slope might 386
contribute to the failure of the slopes. 387
388
Nat. Hazards Earth Syst. Sci. Discuss., doi:10.5194/nhess-2016-297, 2016Manuscript under review for journal Nat. Hazards Earth Syst. Sci.Published: 26 October 2016c© Author(s) 2016. CC-BY 3.0 License.
lenovo
Highlight
lenovo
Highlight
lenovo
Sticky Note
We suggest to delete this part because it is general and not relevant with reference to the goals of the paper.
lenovo
Highlight
lenovo
Sticky Note
We suggest to rewriting the CONCLUSION after a thorough reworking of the paper.

13
AUTHOR CONTRIBUTION 389
Dr Omoniyi Ige supervised the field work and writing of the manuscript. Tolulope Oyeleke 390
and Temitope Oloniniyi carried out the fieldwork. Christopher Baiyegunhi carried out data 391
processing and writing of the manuscript, while Luzuko Sigabi was involved in data processing 392
and correction of manuscript. 393
ACKNOWLEDGEMENT 394
The authors wish to thank Mr Ojuola Raymond of Rafworld Geological Services Limited, 395
Abuja, Nigeria for accommodation and assistance during fieldwork. 396
CONFLICT OF INTERESTS 397
The authors declared that there are no conflicts of interest concerning the publication of this 398
research work. 399
400
REFERENCES 401
Alao, D.A., 1983. Geology and Engineering properties of laterites from Ilorin, Nigeria” 402
Engineering Geology Vol. 20, pp. 111 - 118. 403
Abramson, L. W., Lee, T. S., Sharma, S. and Boyce, G. M., 2002. Slope stability and 404
stabilization methods, 2nd ed., John Wiley and Sons, Inc., New York, 712 p. 405
Alexander, D. (1993). Natural Disaster, London, University College Library Press. 406
Ako T. A., Abba F. M., Onoduku S., Nuhu W. M., Alabi A. A. and Mamodu A., 2014. The October 407
13, 2010 Landslides on the Azenge Mountain in Imande Ukusu, Nkomon Disrict, Benue 408
State, Nigeria Environment and Ecology Research Vol. 2, (3), 113-121. 409
American Association of State Highway and Transportation Officials (AASHTO). AASHTO 410
M145-91, 2003. Standard Specifications for Classification of Soils and Soil-Aggregate 411
Mixtures for Highway Construction Purposes. 412
American Society for Testing Materials, ASTM, 1992. Standard test method for classification 413
of soils for engineering purposes (Unified Soil Classification System). 414
ASTM standard D2487-90, 1992. Annual Books of ASTM Standards, Vol. 04.08, sec. 4. 415
American Society for Testing and Materials (ASTM), Philadelphia, Penn. pp. 326–336. 416
American Society for Testing Materials, ASTM, 1557, 1991. Test Method for Laboratory 417
Compaction Characteristics of Soil Using Modified Effort. ASTM D 1557-91 Standard 418
Test Method for Laboratory Compaction Characteristics of Soil Using Modified Effort. 419
Annual Book of ASTM Standards. 420
Nat. Hazards Earth Syst. Sci. Discuss., doi:10.5194/nhess-2016-297, 2016Manuscript under review for journal Nat. Hazards Earth Syst. Sci.Published: 26 October 2016c© Author(s) 2016. CC-BY 3.0 License.
lenovo
Highlight
lenovo
Sticky Note
This reference is cited in Table 11, but Table 11 is not present in the text
lenovo
Highlight
lenovo
Sticky Note
This reference is not present in the text
14
Andrus, R. D., Stokoe, K. H., and Roesset, J. M., 1991. Liquefaction of Gravelly Soil at Pence 421
Ranch during the 1983 Borah Peak, Idaho Earthquake. First International Conference on 422
Soil Dynamics and Earthquake Engineering V, Karlsruhe, Germany. 423
Andrews, D. C. A. and Martin, G. R., 2000. Criteria for liquefaction of silty soils, Proceedings 424
of the 12th World Conference on Earthquake Engineering, New Zealand, Paper No. 425
0312. 426
Annor, A.E., 1998. Structural and chronology relationship between low grade Igarra schist 427
terrain in the Precambrian exposure of Southwestern Nigeria” Journal of mining and 428
geology. Vol. 32, No. 2, pp. 187-194. 429
Ashiru M. A., Jacob E. S. and Sule M., 2014. Slope Stability Analysis Using Computer Software 430
for Black Cotton Soil of North - Eastern Nigeria. J. of Sciences and Multidisciplinary Research, 431
6 (2) 60 – 77. 432
Black, R., 1980. Precambrian of West Africa. Episodes 4:3–8. 433
British Standard Institution, 1990. Methods of Test for Soils for Civil Engineering Properties 434
(BS 1377)” British Standard Institution: London, UK. 143p. 435
Bromhead, E.N., 1987. Slopes and embankment. In P. Attewell and R. Taylor (eds). 436
Ground movements and their effects on structures, Glass glow, Survey University Press, 437
Blackie Group. 438
Burke, K. C, and Dewey, J. F., 1972. Orogeny in Africa. In: Dessauvagie TFJ, Whiteman AJ 439
(eds), Africa geology. University of Ibadan Press, Ibadan, 583–608. 440
Casagrande, A., and Fadum, R.E., 1936. Notes on Soil Testing for Engineering Purposes, Soil 441
Mechanics Series, Graduate School of Engineering, Harvard University, Cambridge. 442
M.A., 8, 567. 443
Crozier M. J., 1984. Field Assessment of Slope Instability in D Brunsden and D Prior (eds). 444
Slope Instability, New York, John Wiley and Sons. 445
Dada, S. S., 2006. Proterozoic evolution of Nigeria. In: Oshi O (ed) The basement complex of 446
Nigeria and its mineral resources (A Tribute to Prof. M. A. O. Rahaman). Akin Jinad & 447
Co. Ibadan, 29–44. 448
Duncan, J. M., 1996. State of the Art: Limit Equilibrium and Finite Element Analysis in 449
Slopes. Journal of Geotechnical Engineering, Vol. 122 No. 7, 577-96. 450
Nat. Hazards Earth Syst. Sci. Discuss., doi:10.5194/nhess-2016-297, 2016Manuscript under review for journal Nat. Hazards Earth Syst. Sci.Published: 26 October 2016c© Author(s) 2016. CC-BY 3.0 License.
lenovo
Highlight
lenovo
Sticky Note
This reference is cited in Table 11, but Table 11 is not present in the text
lenovo
Highlight
lenovo
Sticky Note
...1984 in the text
lenovo
Highlight
lenovo
Sticky Note
This reference is not present in the text

15
Ishihara, K., 1985. Stability of natural deposits during earthquakes. Proceedings of the Eleventh 451
International Conference on Soil Mechanics and Foundation Engineering, San Francisco. 452
Knapen, J. K, Poesen M, Brengelmans, J; Deckers W. J. and Muwanga, A. (2006). Landslides 453
in Densely Populated County at the Foot Slopes of Mount Elgon (Uganda): 454
Characteristics and Causal Factors, Geomorphology 73, 149–165. 455
Kogbe C.A., 1975. The cretaceous and Precambrian basement sediments of southwestern 456
Nigeria in Kogbe C.A (ed). Geology of Nigeria, 2nd revised edition 457
Matsushi, Y. Hattanji, T. and Matsukura, Y., 2006. Mechanics of Shallow Landslides on Soil 458
Mantled Slopes with Permeable and Impermeable Bedrock in Boso Peninsula, Japan, 459
Geomorphology 76, 92 -108. 460
McCall, G.J.H., Laming, D.J.C. and Scott, S.C., 1992. Geohazards. Natural and Man-Made. 461
Chapman and Hall, London. 462
National Research Council, 1985. Liquefaction of soils during earthquakes. Committee on 463
Earthquake Engineering, National Research Council, National Academy Press, 464
Washington, D.C. 465
Nguimbous-Kouoh, J.J., Takougang, E.M.T. Nouayou, R., Tabod, C.T. and Manguelle-466
Dicoum, E., 2012. Structural Interpretation of the Mamfe Sedimentary Basin of 467
Southwestern Cameroon along the Manyu River Using Audiomagnetotellurics Survey. 468
ISRN Geophysics. pp. 1–7. http://dx.doi.org/10.5402/2012/41304. 469
Ngecu, M. and Mathu, E.M., 1999. The El-Nino Triggered Landslides and Their Socio-470
Economic Impact on Kenya. Environmental Geology 38, 277 - 284. 471
Obaje N.G., 2009. Geology and Mineral Resources of Nigeria. Springer-Verlag Berlin 472
Heidelberg, 219p. 473
Okogbue, C.O., 1992. The 1988 Nanka landslide, Anambra State, Nigeria, Bull. Int. Assoc. 474
Eng. Geol. 46: 79 - 87. 475
Rahaman M.A., 1976. Review of the Basement Geology of South-Western Nigeria,” In: Kogbe 476
CA (ed) Geology of Nigeria, 2nd ed., Elizabethan Publishers, Lagos, pp. 41–58. 477
Seed, H. B., 1968. Landslides during earthquakes. Journal of the soil mechanics and 478
foundations division, ASCE, Vol. 94, No. SM5. 479
Seed, H. B., Idriss, I. M., and Arango, I., 1983. Evaluation of Liquefaction Potential Using 480
Field Performance Data," Journal of the Geotechnical Engineering Division, ASCE, Vol. 481
109, No. GT3. 482
Nat. Hazards Earth Syst. Sci. Discuss., doi:10.5194/nhess-2016-297, 2016Manuscript under review for journal Nat. Hazards Earth Syst. Sci.Published: 26 October 2016c© Author(s) 2016. CC-BY 3.0 License.
lenovo
Highlight
lenovo
Sticky Note
This reference is cited in Table 11, but Table 11 is not present in the text
16
Seed, R. B., Cetin, K. O., Moss, R. E. S., Kammerer, A. M., Wu, J., Pestana, J. M., Riemer, 483
M.F., Sancio, R. B., Bray, J. D., Kayen, R. E., Faris, A., 2003. Recent Advances in Soil 484
Liquefaction Engineering: A Unified and consistent framework, 26th Annual ASCE 485
Keynote Presentation, 71. 486
Tsuchida H., 1970. Prediction and countermeasure against the liquefaction in sand deposits. 487
Seminar Abstract In: Port Harbour Research Institute, 3.1–3.33. 488
Varnes, D.J., 1984. Slope Movement and Types and Process; In Schuster, R.L. and Krizek, 489
R.J. (eds), Landslides: Analysis and Control, Transportation Research Board Special 490
Report 176, National Academy of Sciences, Washington D.C. 491
Walker, A.J., and Steward, H.E., 1989. Cyclic undrained behaviour of nonplastic and low 492
plasticity silts," Technical Report NCEER-89-0035, National Center for Earthquake 493
Engineering Research, SUNY at Buffalo. 494
495
496
497
498
499
500
501
502
503
504
505
506
507
508
509
510
Nat. Hazards Earth Syst. Sci. Discuss., doi:10.5194/nhess-2016-297, 2016Manuscript under review for journal Nat. Hazards Earth Syst. Sci.Published: 26 October 2016c© Author(s) 2016. CC-BY 3.0 License.

17
511
Table 1: Causes of landslides (After McCall, 1992). 512
External Causes Internal Causes
1. Geometrical change
Height
Gradient
Slope length
1. Progressive Failure (internal response to unloading)
Expansion and swelling
Fissuring
Straining, softening
Stress concentration
2. Loading
Natural
Man-induced
2. Weathering
Physical property changes
Chemical changes
3. Unloading
Natural
Man-induced
3. Seepage erosion
Removal of cements
Removal of fine particles
4. Vibrations
Single
Multiple/Continuous
4. Water regime change
Saturation
Rise in water table
Excess pressures
Draw down
513
514
Table 2: Summary of the grain size analysis and soil classification. 515
Sample ID S.G %
clay
%
silt
%
fine
%
sand
%
gravel
Cu Cc Group
symbol
Lokoja 1 2.53 2 2 4 96 0 5 1.19 SW
Lokoja 2 2.78 8 10 18 80 2 12 0.0005 SM
Lokoja 3 2.56 12 8 20 72 2 389 81 SM
Anambra 1 2.58 6 5 11 83 6 86 38 SM
Anambra 2 2.47 12 18 30 63 7 267 6 SM
Eyenkorin 1 2.67 18 35 55 31 16 220 7 CL
Eyenkorin 2 2.68 22 39 61 31 8 33 0.42 CL
Asa Dam 1 2.65 32 18 50 30 20 2000 0.035 CL
Asa Dam 2 2.65 34 26 60 36 4 275 0.074 CL
Key: SW and SM = Poorly Graded Sand, CL= Well Graded Sandy silt. 516
517
Nat. Hazards Earth Syst. Sci. Discuss., doi:10.5194/nhess-2016-297, 2016Manuscript under review for journal Nat. Hazards Earth Syst. Sci.Published: 26 October 2016c© Author(s) 2016. CC-BY 3.0 License.
lenovo
Highlight
lenovo
Sticky Note
...McCall et al.
lenovo
Highlight
lenovo
Sticky Note
- numbered this table as Table 3 - insert the column (Classification after Tsuchida (1970)) present in Table 8, and remove Table 8
lenovo
Highlight

18
Table 3: Plasticity values of the soil samples. 518
Sample ID Depth
(m)
Moisture
content (%)
Liquid limit
(%)
Plastic limit
(%)
Plasticity
index (%)
Lokoja 1 8.6 1.6 23.0 15.0 8.0
Lokoja 2 12.5 0.8 28.0 24.0 4.0
Lokoja 3 17.0 9.8 27.0 18.0 9.0
Anambra 1 10.2 0.8 21.0 16.5 4.5
Anambra 2 12.0 0.8 23.0 19.45 3.55
Eyenkorin 1 2.3 1.3 41.0 21.3 19.7
Eyenkorin 2 3.0 1.8 44.5 15.5 29.0
Asa Dam 1 2.5 2.5 40.0 17.5 22.5
Asa Dam 2 3.4 3.3 43.0 22.5 19.5
519
Table 4: Compaction characteristics and ratings of unified soil classification classes for soil 520
construction (ASTM, 1557-91). 521
Visual
Description
Maximum
Dry-Weight
Range
(g/cm3)
Optimum
Moisture
Range
(%)
Anticipated
Embankment
Performance
Value as
Subgrade
material
Value as
Base Course
Granular
material
2.00-2.27 7-15 Good to
excellent
Excellent Good
Granular
material
with soil
1.76-2.16 9-18 Fair to excellent Good Fair to poor
Fine sand
and sand
1.76-1.84 9-15 Fair to good Good to fair Poor
Sandy silts
and silts
1.52-2.08 10-20 Poor to good Fair to poor Not suitable
Elastic silts
and clays
1.36-1.60 20-35 unsatisfactory Poor Not suitable
Silty-clay 1.52-1.92 10-30 Poor to good Fair to poor Not suitable
Elastic silty
clay
1.36-1.60 20-35 unsatisfactory Poor to very
poor
Not suitable
Clay 90-115 15-30 Poor to fair Very poor Not suitable
Nat. Hazards Earth Syst. Sci. Discuss., doi:10.5194/nhess-2016-297, 2016Manuscript under review for journal Nat. Hazards Earth Syst. Sci.Published: 26 October 2016c© Author(s) 2016. CC-BY 3.0 License.
lenovo
Sticky Note
...remove this table, it is sufficient the reference (ASTM, 1557-91 1991) in the text
lenovo
Highlight
lenovo
Highlight
lenovo
Sticky Note
...numbered this table as Table 4
19
Table 5: Compaction characteristics and ratings of the soil samples based on the unified soil 522
classification classes for soil construction (ASTM, 1557-91). 523
Sample ID MDD
(g/cm3)
OMC
(%)
Anticipated
Embankment
Performance
Value as
Subgrade material
Value as Base
Course
Lokoja 1 1.73 8.5 Poor Fair Good
Lokoja 2 1.80 8.0 Fair Good Poor
Lokoja 3 1.76 12.3 Fair Good Poor
Anambra 1 1.76 10.1 Fair Good Poor
Anambra 2 1.64 8.8 Poor Good Fair
Eyenkorin 1 1.84 14.0 Fair Good Fair
Eyenkorin 2 1.88 13.0 Fair Good Fair
Asa Dam 1 1.85 13.4 Fair Good Fair
Asa Dam 2 1.87 12.2 Fair Good Fair
524
525
Table 6: The summary of the shear strength parameters and interpretation. 526
Sample ID Cohesion, c
(kPa)
Angle of internal
friction, φ
Interpretation
Lokoja 1 48 28.50 Loose sand: rounded grains
Lokoja 2 70 290 Loose sand: rounded grains
Lokoja 3 65 240 Loose sand: rounded grains
Anambra 1 50 290 Loose sand: rounded grains
Anambra 2 55 280 Loose sand: rounded grains
Eyenkorin 1 60 230 Loose sand: rounded grains
Eyenkorin 2 80 260 Loose sand: rounded grains
Asa Dam 1 40 350 Medium sand: rounded grains
Asa Dam 2 60 320 Medium sand: rounded grains
527
528
529
530
Nat. Hazards Earth Syst. Sci. Discuss., doi:10.5194/nhess-2016-297, 2016Manuscript under review for journal Nat. Hazards Earth Syst. Sci.Published: 26 October 2016c© Author(s) 2016. CC-BY 3.0 License.
lenovo
Highlight
lenovo
Sticky Note
insert the columns: - K (cm/sec) - Interpretation - Drainage condition present in Table 7, and remove Table 7
lenovo
Sticky Note
Table 6: Summary of the shear strength and permeability for the (reconstructed !!) samples and their interpretations.
20
Table 7: Coefficient of permeability for the samples and their interpretations. 531
Sample ID K (mm/sec) K (cm/sec) Interpretation Drainage
condition
Lokoja 1 1.18 × 10⁻³ 1.18 × 10⁻⁴ Clean sand and gravel mixtures Good
Lokoja 2 9.77 × 10⁻⁴ 9.77 × 10⁻⁵ Very fine sand Poor
Lokoja 3 3.61 × 10⁻⁴ 3.61 × 10⁻⁵ Very fine sand Poor
Anambra 1 8.71 × 10⁻⁴ 8.71 × 10⁻⁵ Very fine sand Poor
Anambra 2 7.80 × 10⁻⁴ 7.80 × 10⁻⁵ Very fine sand Poor
Eyenkorin 1 1.18 × 10⁻³ 1.18 × 10⁻³ Clean sand and gravel mixtures Good
Eyenkorin 2 1.18 × 10⁻³ 1.18 × 10⁻³ Clean sand and gravel mixtures Good
Asa Dam 1 1.18 × 10⁻³ 1.18 × 10⁻³ Clean sand and gravel mixtures Good
Asa Dam 2 1.18 × 10⁻³ 1.18 × 10⁻³ Clean sand and gravel mixtures Good
532
533
534
Table 8: Grain size distribution summary showing the % of the grain fractions. 535
Sample ID Specific
gravity
%
clay
%
silt
%
fines
%
sand
%
gravel
Classification after
Tsuchiba (1970)
Lokoja 1 2.53 2 2 4 96 0 Liquefiable
Lokoja 2 2.78 8 10 18 80 2 Liquefiable
Lokoja 3 2.56 12 8 20 72 2 Liquefiable
Anambra 1 2.58 6 5 11 83 6 Liquefiable
Anambra 2 2.47 12 18 30 63 7 Potentially liquefiable
Eyenkorin 1 2.67 18 35 55 31 16 Potentially liquefiable
Eyenkorin 2 2.68 22 39 61 31 8 Potentially liquefiable
Asa Dam 1 2.65 32 18 50 30 20 Potentially liquefiable
Asa Dam 2 2.65 34 26 60 36 4 Potentially liquefiable
536
537
538
539
540
541
Nat. Hazards Earth Syst. Sci. Discuss., doi:10.5194/nhess-2016-297, 2016Manuscript under review for journal Nat. Hazards Earth Syst. Sci.Published: 26 October 2016c© Author(s) 2016. CC-BY 3.0 License.
lenovo
Highlight
lenovo
Sticky Note
...remove Table 7
lenovo
Highlight
lenovo
Sticky Note
...remove Table 8

21
Table 9: Input parameters used in SLOPE/W analyses. 542
Location Soil layer C (kPa) Phi ( o ) γ ( kN/m3)
Oko1 (Anambra state) Upper 50 29 16.30
Oko 2 (Anambra state) Lower 55 28 15.70
Lokoja 1 (Kogi state) Upper 48 28.5 16.40
Lokoja 2 (Kogi state) Middle 70 29 17.10
Lokoja 3 (Kogi state) Lower 65 24 15.50
Eyenkorin 1 (Kwara state) Upper 70 26 14.21
Eyenkorin 2 (Kwara state) Lower 90 27 14.70
Asa Dam 1 (Kwara state) Upper 40 35 14.70
Asa Dam 2 (Kwara state) Lower 60 32 15.48
543
544
545
546
Table 10: Summary of the factor of safety (FOS) for the soil samples. 547
O.D B.M J.M M.P FOS
M F M F M F M F M
Anambra 1 and 2 1.366 1.396 - - 1.434 1.452 1.462 1.452
Lokoja 1 and 2 1.885 1.951 - - 1.883 1.946 1.950 1.946
Eyenkorin 1 and 2 2.430 2.489 - - 2.462 2.488 2.485 2.196
Asa Dam 1 and 2 2.118 2.200 - - 2.112 2.196 2.201 2.488
M = Moment, F= Force, O.D = Ordinary method, B.M = Bishop method, J.M = Janbu method, 548
M.P = Morgestein price. 549
550
551
552
553
554
555
556
557
558
559
560
561
Nat. Hazards Earth Syst. Sci. Discuss., doi:10.5194/nhess-2016-297, 2016Manuscript under review for journal Nat. Hazards Earth Syst. Sci.Published: 26 October 2016c© Author(s) 2016. CC-BY 3.0 License.
lenovo
Highlight
lenovo
Sticky Note
...numbered this table as Table 2
lenovo
Sticky Note
parametric analysis
lenovo
Highlight
lenovo
Sticky Note
...numbered this table as Table 7
lenovo
Highlight
lenovo
Sticky Note
...obtained from parametric analysis
22
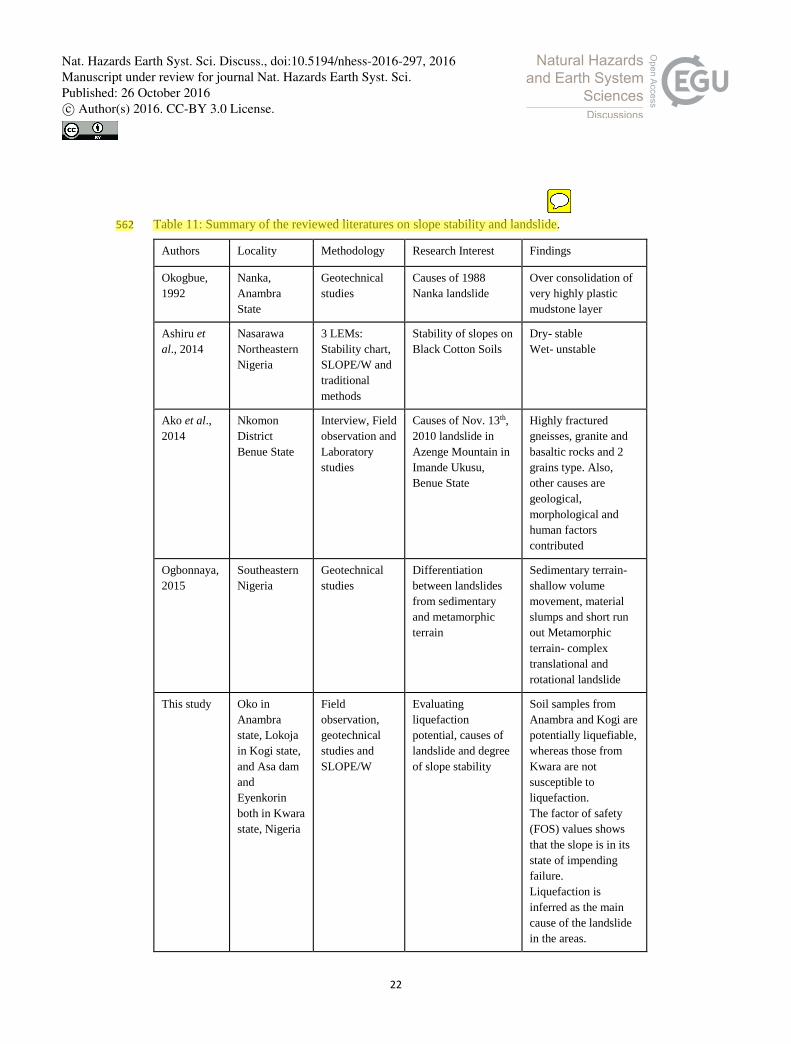
Table 11: Summary of the reviewed literatures on slope stability and landslide. 562
Authors Locality Methodology Research Interest Findings
Okogbue,
1992
Nanka,
Anambra
State
Geotechnical
studies
Causes of 1988
Nanka landslide
Over consolidation of
very highly plastic
mudstone layer
Ashiru et
al., 2014
Nasarawa
Northeastern
Nigeria
3 LEMs:
Stability chart,
SLOPE/W and
traditional
methods
Stability of slopes on
Black Cotton Soils
Dry- stable
Wet- unstable
Ako et al.,
2014
Nkomon
District
Benue State
Interview, Field
observation and
Laboratory
studies
Causes of Nov. 13th,
2010 landslide in
Azenge Mountain in
Imande Ukusu,
Benue State
Highly fractured
gneisses, granite and
basaltic rocks and 2
grains type. Also,
other causes are
geological,
morphological and
human factors
contributed
Ogbonnaya,
2015
Southeastern
Nigeria
Geotechnical
studies
Differentiation
between landslides
from sedimentary
and metamorphic
terrain
Sedimentary terrain-
shallow volume
movement, material
slumps and short run
out Metamorphic
terrain- complex
translational and
rotational landslide
This study Oko in
Anambra
state, Lokoja
in Kogi state,
and Asa dam
and
Eyenkorin
both in Kwara
state, Nigeria
Field
observation,
geotechnical
studies and
SLOPE/W
Evaluating
liquefaction
potential, causes of
landslide and degree
of slope stability
Soil samples from
Anambra and Kogi are
potentially liquefiable,
whereas those from
Kwara are not
susceptible to
liquefaction.
The factor of safety
(FOS) values shows
that the slope is in its
state of impending
failure.
Liquefaction is
inferred as the main
cause of the landslide
in the areas.
Nat. Hazards Earth Syst. Sci. Discuss., doi:10.5194/nhess-2016-297, 2016Manuscript under review for journal Nat. Hazards Earth Syst. Sci.Published: 26 October 2016c© Author(s) 2016. CC-BY 3.0 License.
lenovo
Highlight
lenovo
Sticky Note
...this table it is non present in the text, remove this table

23
563
564
Figure 1: Satellite image of Oko area in Anambra State showing the landslide region (Red 565
circle: Landslide affected area). 566
567
568
569
570
Nat. Hazards Earth Syst. Sci. Discuss., doi:10.5194/nhess-2016-297, 2016Manuscript under review for journal Nat. Hazards Earth Syst. Sci.Published: 26 October 2016c© Author(s) 2016. CC-BY 3.0 License.
lenovo
Sticky Note
...is 630 m2 the extension of the landslide area?
lenovo
Sticky Note
We suggest to improve the readability of this figure
24
571
572
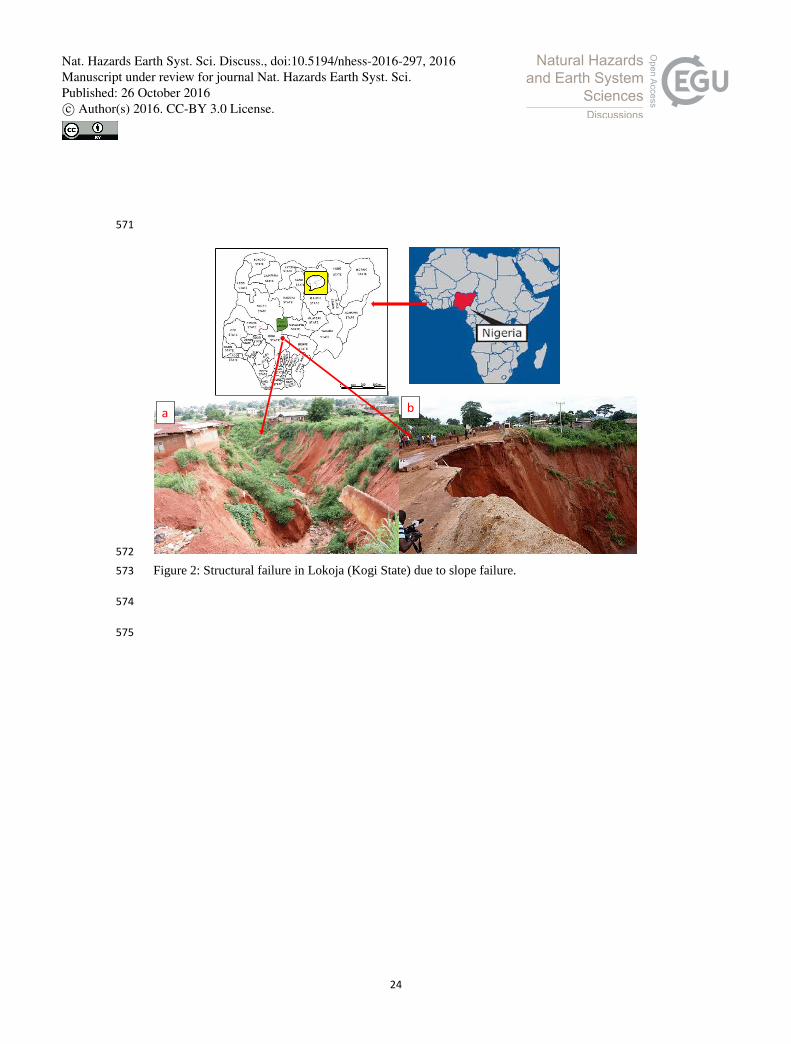
Figure 2: Structural failure in Lokoja (Kogi State) due to slope failure. 573
574
575
a b
Nat. Hazards Earth Syst. Sci. Discuss., doi:10.5194/nhess-2016-297, 2016Manuscript under review for journal Nat. Hazards Earth Syst. Sci.Published: 26 October 2016c© Author(s) 2016. CC-BY 3.0 License.
lenovo
Sticky Note
We suggest to improve the readability of this figure

25
576 Figure 3: Geological map of Nigeria showing the major geological components and sampling 577
location (After Obaje, 2009). 578
579
580
581
582
583
584
585
586
587
588
589
LOKOJA
Nat. Hazards Earth Syst. Sci. Discuss., doi:10.5194/nhess-2016-297, 2016Manuscript under review for journal Nat. Hazards Earth Syst. Sci.Published: 26 October 2016c© Author(s) 2016. CC-BY 3.0 License.

26
590
Figure 4: Grain size distribution curves for the soil samples. 591
592
593
594
595
596
0
10
20
30
40
50
60
70
80
90
100
0.0001 0.001 0.01 0.1 1 10 100
Pe
rce
nt
fin
er
Particle size (mm)
Lokoja 2
Lokoja 1
Lokoja 3
Anambra 1
Anambra 2
Eyenkorin 1
Eyenkorin 2
Asa Dam 1
Asa Dam 2
Nat. Hazards Earth Syst. Sci. Discuss., doi:10.5194/nhess-2016-297, 2016Manuscript under review for journal Nat. Hazards Earth Syst. Sci.Published: 26 October 2016c© Author(s) 2016. CC-BY 3.0 License.
lenovo
Sticky Note
We suggest to use: - for the same area one color - for the sample sites in the same area different symbols
lenovo
Highlight

27
597
Figure 5: Unified Classification System (Based on materials passing 75mm sieve) (Based on 598
ASTM-2487). 599
600
601
602
Nat. Hazards Earth Syst. Sci. Discuss., doi:10.5194/nhess-2016-297, 2016Manuscript under review for journal Nat. Hazards Earth Syst. Sci.Published: 26 October 2016c© Author(s) 2016. CC-BY 3.0 License.
lenovo
Sticky Note
...remove this figure, it is sufficient the reference (ASTM, 1992) in the text
lenovo
Highlight

28
603
Figure 6: Plot of Moisture Content against No of blows, N for the soil samples. 604
605
606
607
608
609
10
15
20
25
30
35
40
45
50
55
60
0 10 20 30 40 50
Mo
istu
re c
on
ten
t (%
)
No of Blows, N
Lokoja 3
Anambra 2
Asa Dam 1
Asa Dam 2
Eyenkorin 1
Eyenkorin 2
Linear (Lokoja 3)
Linear (Anambra 2)
Linear (Asa Dam 1)
Linear (Asa Dam 2)
Linear (Eyenkorin 1)
Linear (Eyenkorin 2)
Nat. Hazards Earth Syst. Sci. Discuss., doi:10.5194/nhess-2016-297, 2016Manuscript under review for journal Nat. Hazards Earth Syst. Sci.Published: 26 October 2016c© Author(s) 2016. CC-BY 3.0 License.

29
610
Figure 7: Standard plot of plasticity index against liquid limit (AASHTO SOIL classification 611
system). 612
613
614
615
Figure 8: Plasticity chart plot for fine grained soil and fine fraction in coarse grained soil. 616
Nat. Hazards Earth Syst. Sci. Discuss., doi:10.5194/nhess-2016-297, 2016Manuscript under review for journal Nat. Hazards Earth Syst. Sci.Published: 26 October 2016c© Author(s) 2016. CC-BY 3.0 License.
lenovo
Highlight
lenovo
Sticky Note
...remove Figure 7, it is not essential
lenovo
Sticky Note
Ref. Figure 4. We suggest to use: - for the same area one color - for the sample sites in the same area different symbols
lenovo
Highlight

30
617
618
Figure 9: Compaction curves showing MDD and OMC of the soil samples. 619
620
621
622
623
1.4
1.45
1.5
1.55
1.6
1.65
1.7
1.75
1.8
1.85
1.9
0 5 10 15 20 25 30 35
Dry
De
nsi
ty (
g/cm
3)
Moisture content (%)Lokoja 1 Lokoja 2 Lokoja 3 Anambra 1 Anambra 2
Asa Dam 1 Asa Dam 2 Eyenkorin 1 Eyenkorin 2
Lokoja 1 MDD=1.73gm-3 OMC=8.5% Lokoja 2 MDD=1.80gcm-3 OMC=8.0% Lokoja 3 MDD=1.76g/cm-3 OMC=12.3% Anambra 1 MDD=1.76g/cm-3 OMC=10.1% Anambra 2 MDD=1.64gcm-3 OMC=8.8% Eyenkorin 1 MDD=1.8gcm-3 OMC=14.0% Eyenkorin 2 MDD=1.88gcm-3 OMC=13.0% Asa Dam 1 MDD=1.85gcm-3 OMC=13.4% Asa Dam 2 MDD=1.84gcm-3 OMC=12.2%
Nat. Hazards Earth Syst. Sci. Discuss., doi:10.5194/nhess-2016-297, 2016Manuscript under review for journal Nat. Hazards Earth Syst. Sci.Published: 26 October 2016c© Author(s) 2016. CC-BY 3.0 License.
lenovo
Highlight
lenovo
Sticky Note
Ref. Figure 4. We suggest to use: - for the same area one color - for the sample sites in the same area different symbols
31
624
Figure 10: Plasticity chart showing the recommendations by Seed et al. (2003) regarding the 625
assessment of "liquefiable" soil types and the Atterberg Limits of fine-grained soils. 626
627
628
629
Nat. Hazards Earth Syst. Sci. Discuss., doi:10.5194/nhess-2016-297, 2016Manuscript under review for journal Nat. Hazards Earth Syst. Sci.Published: 26 October 2016c© Author(s) 2016. CC-BY 3.0 License.
lenovo
Highlight
lenovo
Sticky Note
Ref. Figure 4. We suggest to use: - for the same area one color - for the sample sites in the same area different symbols

32
630
Figure 11: Liquefaction screening criteria after Andrews and Martin (2000). 631
632
633
Nat. Hazards Earth Syst. Sci. Discuss., doi:10.5194/nhess-2016-297, 2016Manuscript under review for journal Nat. Hazards Earth Syst. Sci.Published: 26 October 2016c© Author(s) 2016. CC-BY 3.0 License.
lenovo
Highlight
lenovo
Sticky Note
Ref. Figure 4. We suggest to use: - for the same area one color - for the sample sites in the same area different symbols

33
634
Figure 12: Boundaries in the gradation curves for soils susceptible to liquefaction (After 635
Tsuchida, 1970). 636
637
638
639
Nat. Hazards Earth Syst. Sci. Discuss., doi:10.5194/nhess-2016-297, 2016Manuscript under review for journal Nat. Hazards Earth Syst. Sci.Published: 26 October 2016c© Author(s) 2016. CC-BY 3.0 License.
lenovo
Highlight
lenovo
Sticky Note
...remove this figure, it is sufficient the reference (Tsuchida, 1970) in the text

34
640
Figure 13: Non-optimised (a) dry and (b) wet slopes for Oko 1 and 2 (Anambra state). 641
642
643
02
4
6
8
10
12
14
16
18
20
22
24
26
28
5
10
15 20 25 30 35 40 45
Distance (m)
Elev
atio
n (m
)
FOS (2.510)
a
04
6
8
10
12
14
16
18
20
22
24
26
28
5
10
15 20 25 30 35 40 45
Distance (m)
Elev
atio
n (m
)
FOS (1.452)
b
Nat. Hazards Earth Syst. Sci. Discuss., doi:10.5194/nhess-2016-297, 2016Manuscript under review for journal Nat. Hazards Earth Syst. Sci.Published: 26 October 2016c© Author(s) 2016. CC-BY 3.0 License.
Nota
To discuss the results of the parametric analysis, we suggest to aggregate the figures from 13 to 19 after a thorough reworking of the paper...
Evidenziato

35
644
Figure 14: Non-optimised wet slope and factor of safety for Oko 1 and 2 (Anambra state). 645
646
647
648
Figure 15: Non-optimised wet slope model and factor of safety for Eyenkorin 1 and 2 (Kwara). 649
650
04
6
8
10
12
14
16
18
20
22
24
26
28
5
10
15 20 25 30 35 40 45
Distance (m)
Elev
atio
n (m
)
FOS (1.452)
6
4
6
8
10
12
14
16
18
20
22
24
26
28
8
10
16 18 20 30 32 34 36
Distance (m)
Ele
va
tio
n (
m)
FOS (2.488)
12 14 2826242
30
22
32
Nat. Hazards Earth Syst. Sci. Discuss., doi:10.5194/nhess-2016-297, 2016Manuscript under review for journal Nat. Hazards Earth Syst. Sci.Published: 26 October 2016c© Author(s) 2016. CC-BY 3.0 License.
Evidenziato
Evidenziato

36
651
Figure 16: Non-optimised wet slope model and factor of safety for Asa Dam 1 and 2 (Kwara). 652
653
654
4
6
8
10
12
14
16
18
20
22
24
26
8
10
16 18 20 30 32 34 36
Distance (m)
Ele
va
tio
n (
m)
FOS (2.196)
12 14 2826242
22
Nat. Hazards Earth Syst. Sci. Discuss., doi:10.5194/nhess-2016-297, 2016Manuscript under review for journal Nat. Hazards Earth Syst. Sci.Published: 26 October 2016c© Author(s) 2016. CC-BY 3.0 License.
Evidenziato

37
655
Figure 17: Critical slip surfaces and factor of safety from limit equilibrium analysis using 656
SLOPE/W for 3 soil layers in Agbaja Hill, Lokoja (Kogi state), and plot of factor of safety 657
versus lambda, λ (non-optimized). 658
659
4
6
8
12
14
16
18
20
22
24
26
5
10
15 20 35 4540
Distance (m)
Ele
vati
on
(m
)
FOS (1.847)
10 3025
2
28
0
Janbu
Fact
or o
f saf
ety
Lambda
Force
Moment
1.7
1.8
1.9
2.1
2.2
-1
2
-0.6 -0.4 0.2 0.60.4-0.8 0-0.2
1.6
1.50.8
Nat. Hazards Earth Syst. Sci. Discuss., doi:10.5194/nhess-2016-297, 2016Manuscript under review for journal Nat. Hazards Earth Syst. Sci.Published: 26 October 2016c© Author(s) 2016. CC-BY 3.0 License.
Evidenziato

38
660
Figure 18: Showing (a) Optimised slope with point load of 40kPa, (b) Plot of FOS versus 661
lambda, λ (optimised) with external loads of 40 kPa. 662
663
0
0
2
4
8
1012
14
16
1820
22
24
6
3020 60Distance (m)
Ele
va
tio
n (
m)
FOS (1.806)
10 50-2
26
40
28
30
32a
Fact
or o
f saf
ety
Lambda
1.4
1.6
1.8
2.0
2.2
-1 0
1.2
11
b
Force
Moment
Nat. Hazards Earth Syst. Sci. Discuss., doi:10.5194/nhess-2016-297, 2016Manuscript under review for journal Nat. Hazards Earth Syst. Sci.Published: 26 October 2016c© Author(s) 2016. CC-BY 3.0 License.
Evidenziato

39
664 Figure 19: Showing (a) Optimised slope with reinforcement load of 50 kPa, (b) Plot of FOS 665
versus lambda, λ (optimised) with reinforcement load of 50 kPa. 666
667
-4
0
1
3
4
5
6
7
8
9
10
5
2
15 20 35 4540
Distance (m)
Elev
atio
n (m
)
FOS (3.699)
10 3025
-2
11
-355500
12a
Fact
or o
f saf
ety
Lambda
3.3
3.4
3.7
3.8
3.9
-1 0
3.2
3.11
b
3.5
3.6
Force
Moment
Nat. Hazards Earth Syst. Sci. Discuss., doi:10.5194/nhess-2016-297, 2016Manuscript under review for journal Nat. Hazards Earth Syst. Sci.Published: 26 October 2016c© Author(s) 2016. CC-BY 3.0 License.
Evidenziato