Light Scatter Spectroscopy and Imaging of Cellular and Subcellular Events
24
16-1 0-8493-1116-0/03/$0.00+$1.50 © 2003 by CRC Press LLC 16 Light Scatter Spectroscopy and Imaging of Cellular and Subcellular Events Abstract.........................................................................................16-1 16.1 Introduction ......................................................................16-1 16.2 Brief Theoretical Overview...............................................16-2 General Formulation of Scattering by a Single Particle • Common Approximations to Solve for the Scattered Field of Biological Particles• Solving the Scattering Problem for a Scatterer of Arbitrary Shape and Index 16.3 Scatter Data Interpretation ...............................................16-7 16.4 Methods and Applications of Light Scatter Measurements to the Study of Cells and Organelles, and in Tissue Slices ...........................................................16-8 Light Scattering Spectroscopy of Cells and Organelles in Suspensions • Light Scattering Spectroscopy of Cellular Monolayers and Thin Tissue Slices • Combining Spectrscopy and Imaging of Tissue Slices and Cellular Monolayers 16.5 Summary and Conclusion ..............................................16-18 References ...................................................................................16-20 Abstract Ex-vivo, thin biological specimens, such as single cells and tissue slices, are widely used in biology and medicine. Optical microscopic imaging and spectroscopic techniques are ideal to probe the composition of these specimens nondestructively and with minimal sample preparation and handling. This chapter is focused on elastic scattering as one of these optically based analytical techniques. Unlike most turbid tissues analyzed in vivo, light scattering in these relatively thin ex-vivo specimens is dominated by single scattering. Here, we describe the methods currently used to collect and interpret elastic scattering data from thin biological specimens, and biomedical applications in this field. 16.1 Introduction The optical analysis of single cells or thin biological specimens, such as cells and tissue slices, plays an important role in many clinical and biological diagnostic studies, including the evaluation of disease biopsies and the examination of live tissue metabolism in real time. Several optical techniques are available to study ex-vivo biological specimens and serve as probes of human disease and biological function. These Nada N. Boustany Johns Hopkins University School of Medicine Baltimore, Maryland Nitish V. Thakor Johns Hopkins University School of Medicine Baltimore, Maryland 1116_frame_MASTER.book Page 1 Thursday, September 19, 2002 10:34 AM
Transcript of Light Scatter Spectroscopy and Imaging of Cellular and Subcellular Events

16
-1
0-8493-1116-0/03/$0.00+$1.50© 2003 by CRC Press LLC
16
Light ScatterSpectroscopy and
Imaging of Cellular and
Subcellular Events
Abstract.........................................................................................
16-
116.1 Introduction ......................................................................
16-
116.2 Brief Theoretical Overview...............................................
16-
2
General Formulation of Scattering by a Single Particle • Common Approximations to Solve for the Scattered Field of Biological Particles• Solving the Scattering Problem for a Scatterer of Arbitrary Shape and Index
16.3 Scatter Data Interpretation...............................................
16-
716.4 Methods and Applications of Light Scatter
Measurements to the Study of Cells and Organelles,and in Tissue Slices ...........................................................
16-
8
Light Scattering Spectroscopy of Cells and Organelles in Suspensions • Light Scattering Spectroscopy of Cellular Monolayers and Thin Tissue Slices • Combining Spectrscopy and Imaging of Tissue Slices and Cellular Monolayers
16.5 Summary and Conclusion..............................................
16-
18References ...................................................................................
16-
20
Abstract
Ex-vivo
, thin biological specimens, such as single cells and tissue slices, are widely used in biology andmedicine. Optical microscopic imaging and spectroscopic techniques are ideal to probe the compositionof these specimens nondestructively and with minimal sample preparation and handling. This chapteris focused on elastic scattering as one of these optically based analytical techniques. Unlike most turbidtissues analyzed
in vivo
, light scattering in these relatively thin
ex-vivo
specimens is dominated by singlescattering. Here, we describe the methods currently used to collect and interpret elastic scattering datafrom thin biological specimens, and biomedical applications in this field.
16.1 Introduction
The optical analysis of single cells or thin biological specimens, such as cells and tissue slices, plays animportant role in many clinical and biological diagnostic studies, including the evaluation of diseasebiopsies and the examination of live tissue metabolism in real time. Several optical techniques are availableto study
ex-vivo
biological specimens and serve as probes of human disease and biological function. These
Nada N. Boustany
Johns Hopkins University School of MedicineBaltimore, Maryland
Nitish V. Thakor
Johns Hopkins University School of MedicineBaltimore, Maryland
1116_frame_MASTER.book Page 1 Thursday, September 19, 2002 10:34 AM

16
-2
Biomedical Photonics Handbook
include microscopic imaging techniques and spectroscopy. Diagnostic tests based on fluorescent labels ofcellular metabolism as well as intrinsic fluorescence, elastic scattering and Raman scattering from naturalbiomolecules have all been described. Typically, fluorescence and Raman scattering techniques are usedto identify or localize specific biochemical entities. However, an important aspect of tissue diagnosis isbased on assessing cellular and subcellular morphology. The morphological analysis of cells and subcellularorganelles is the primary objective of biomedical optical techniques based on elastic light scattering.
Alterations in tissue morphology and composition will result in detectable changes in the way light istransmitted, refracted, diffracted or reflected from a given tissue specimen. Experimental measurements,such as light scatter intensity and its angular dependence, can be used to infer changes in size and shapeor refractive index of the specimen under study. Biological analysis methods based on elastic lightscattering include microscopic imaging techniques, such as dark field, phase contrast or differentialinterference contrast, as well as quantitative spectroscopic methods, in which the sample is not visualized.In phase contrast and differential interference contrast microscopy, variations in the refractive index ofthe tissue are utilized to optically manipulate the scattered wavefronts and produce a high-resolutionimage of the biological specimen under study. These types of microscopic images are widely used tovisualize the morphology of the cells in culture or track cell movement, for example. In these cases,morphological analysis of the tissue stems from direct observation by the user.
On the other hand, spectroscopy-based techniques find their way into applications that require auto-mated quantification of cellular and subcellular morphology, without visualization of the specimen bya qualified technician. Such techniques are very useful in cell and tissue screening procedures in clinicaland biological studies. Emerging techniques that combine imaging and spectroscopy are also increasinglyutilized to localize the scatter information within a tissue slice or a monolayer of cells.
The constituent parts of cells and biological tissue, such organelles or connective tissue fibers, are oftenat the limit of the resolution of optical microscopes. Alterations in organelle or subtissue morphologycan be important indicators of underlying biochemical activity in living cells. While these changes couldbe quantified by electron microscopy in fixed tissue, greater insight about a biological process can begained from minimally invasive techniques that require minimal sample preparation and are suited forlive tissue monitoring. Quantitative light scattering techniques are an ideal tool to address this problemand complement the existing microscopic techniques. They are noninvasive and sensitive to changes inthe dimension and optical properties of particles with size on the order of the wavelength.
Light scatter measurements have had a significant impact in medicine and biology. Applications inflow cytometry include cell diagnosis and differential blood cell count
1–4
and human and bacterial cellresponse to various agents.
5–9
In static suspensions, light scattering has been used to monitor plateletaggregation,
10–12
the mitochondrial permeability transition
13–16
and the optical properties of normal andtumor cells for future tissue diagnosis.
17,18
Optical analysis of thin biological specimens may involvemonolayers of cells in culture and tissue slices. These
ex vivo
experimental models are used extensivelyto study important biological processes, and are crucial to advancing our understanding of biologicalprocesses at the cellular and molecular level in a controlled laboratory environment. As we will see,numerous applications of quantitative light scattering exist for the analysis of cells, organelles, and tissueslices. These biological specimens are usually thin enough to be dominated by single scattering, as opposedto studies of turbid whole tissue samples, where multiple scattering prevails.
The uses of light scattering techniques to analyze thin biological specimens are the subject of thischapter. In particular, this chapter focuses on applications of quantitative light scattering, where a specificlight scattering parameter is measured, such as intensity of the scattered light, or angular dependence ofthe scattered light. Methods for data acquisition and interpretation are discussed, as well as on-goingwork in this field.
16.2 Brief Theoretical Overview
A very brief overview of the light scattering problem is given here. The general treatment of light scatteringby a single particle can be found in Van de Hulst
19
and Bohren and Huffman.
20
1116_frame_MASTER.book Page 2 Thursday, September 19, 2002 10:34 AM
Light Scatter Spectroscopy and Imaging of Cellular and Subcellular Events
16
-3
16.2.1 General Formulation of Scattering by a Single Particle
The biological samples considered in this chapter will contain many scattering particles; however, thesamples studied will be sufficiently thin to safely assume single scattering. This condition may be satisfiedif
e
–
m,
z
<< 1, where
m
s
is the tissue scattering coefficient, and
z
is the sample thickness.
m
s
is a functionof wavelength, and 1/ms represents the mean free path of the light before a scattering event occurs. Valuesof
m
s
have been tabulated in the literature.
21
For example,
m
s
is on the order of 100cm
–1
at 780 nm forbiological tissue.
22
When single particle scattering is considered, the following conditions ensue:
• Multiple scattering will be neglected.
• Each scatterer within the tissue will be exposed only to the radiation of the original incident beam.
• Light scattered from one particle will not be subjected to further scatter by another particle.
Thus, when only a single scattering event is considered for each particle making up the tissue, the totalamount of scatter intensity by
N
particles will be equal to the sum of the individual scatter intensitiesby each of the
N
particles. If the particles in the sample are of varying size, the number density distributionof the particles may be taken into account. A case commonly considered is a distribution of sphericalparticle with different radii,
a
, in which case
.
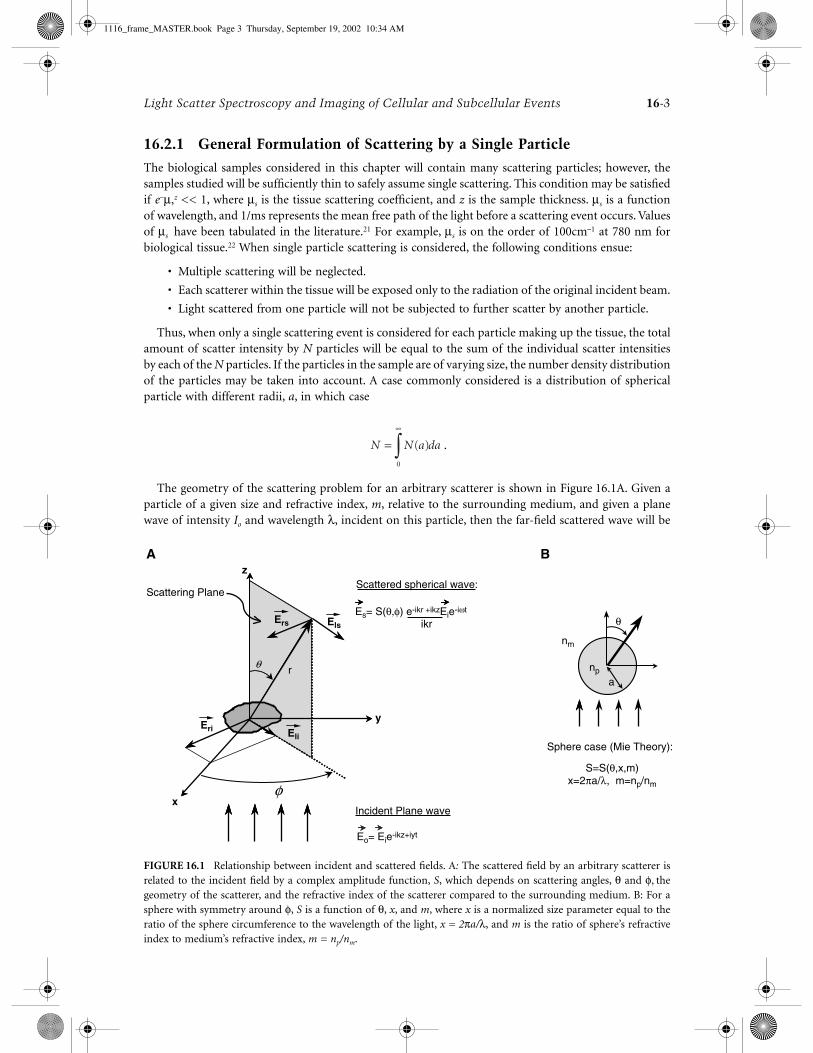
The geometry of the scattering problem for an arbitrary scatterer is shown in Figure 16.1A. Given aparticle of a given size and refractive index,
m
, relative to the surrounding medium, and given a planewave of intensity
I
o
and wavelength
l
, incident on this particle, then the far-field scattered wave will be
FIGURE 16
.
1
Relationship between incident and scattered fields. A
:
The scattered field by an arbitrary scatterer isrelated to the incident field by a complex amplitude function,
S
, which depends on scattering angles,
q
and
f,
thegeometry of the scatterer, and the refractive index of the scatterer compared to the surrounding medium. B: For asphere with symmetry around
f
,
S
is a function of
q
,
x
, and
m
, where
x
is a normalized size parameter equal to theratio of the sphere circumference to the wavelength of the light,
x = 2
p
a/
l
, and
m
is the ratio of sphere’s refractiveindex to medium’s refractive index,
m = n
p
/n
m
.
N N a da=•
Ú ( )
0
A B
Scattering Plane
z
Ers Els
Es= S(θ,φ) e-ikr +ikzEie-iωt
Eo= Eie-ikz+iyt
Eri Eli
θ r
φ
y
Scattered spherical wave:
ikr
Incident Plane wavex
nm
np
θ
a
Sphere case (Mie Theory):
S=S(θ,x,m)x=2πa/λ, m=np/nm
1116_frame_MASTER.book Page 3 Thursday, September 19, 2002 10:34 AM

16
-4
Biomedical Photonics Handbook
a spherical wave originating at the particle. The intensity of the scattered wave,
I
s
, at any distance,
r
, inthe far field can be written as
I
s
= I
o
F
(
q
,
f
)/
k
2
r
2
, where the scattering direction is defined by the angles
q
and
f
, and k is the wave number with
k = 2
p
/
l
. The angle
q
is the angle between the incident directionand the scattered direction and
f
is the azimuthal angle of scatter. The scattering cross section of theparticle is defined as
,
where d
w
is a solid angle differential element with
d
w
= sin
q
d
q
d
f
. The function
F
/(
C
sca
k
2
) is thenondimensional phase function, whose integral over solid angle is equal to 1.
Solving the scattering problem typically consists of solving for
F
(
q
,
f
), which can therefore be used tocalculate the scattered light intensity and all directions. Solving for
F
(
q
,
f
)
involves solving for the electro-magnetic filed everywhere in space. Maxwell’s equations are solved to calculate the electromagnetic fieldsinside the particle and in the medium outside the particle. The field outside the particle will be asuperposition of the incident field and the field scattered by the particle. The boundary conditions atthe particle/medium interface require that the tangential components of the electric and magnetic fieldbe continuous to satisfy conservation of energy at the interface. The problem is then reformulated interms of electric fields, where the scattered field,
E
s
, is related to the incident field
E
i
by a complexamplitude function,
S
(
q
,
f
). The function S may be represented as a matrix, such that:
(16.1)
where
.
The elements of the matrix S in Equation 16.1 are complex numbers having amplitude and phase andare functions of
q
and
f
. The subscripts
i
and
s
denote the scattered and incident components, respectively.The subscripts l and r denote parallel and perpendicular polarization of the E fields, respectively. Theparallel and perpendicular directions are defined with respect to the scattering plane defined by theincident and scattering directions (Figure 16.1A). The function F, discussed earlier and which defines the
intensity
relationship between the incident and scattered light, can be deduced from the relationshipbetween the incident and scattered fields given by the matrix S. For light of arbitrary polarization it iscommon to rewrite Equation 16.1 as:
(16.2)
I, Q, U, and V are the Stokes parameters, which can be given in terms of the electric field components as:
I = E
l
E
l
* + E
r
E
r
*,Q = E
l
E
l
* – E
r
E
r
*,U = E
l
E
r
* + E
r
E
l
*,V = i(E
l
E
r
* – E
r
E
l
*).
Ck
F dsca = Ú12
( , )q f w
E
E
S S
S S
e
ikr
E
E
ls
rs
ikr ikzli
ri
Ê
ËÁ
ˆ
¯˜ =
Ê
ËÁ
ˆ
¯˜ ◊
Ê
ËÁ
ˆ
¯˜
- +2 3
4 1
'
SS S
S S=
Ê
ËÁ
ˆ
¯˜
2 3
4 1
( , ) ( , )
( , ) ( , )
q f q f
q f q f
I
Q
U
V
k r
S S S S
S S S S
S S S S
S S S S
I
Q
U
V
s
s
s
s
i
i
i
i
È
Î
ÍÍÍÍÍÍ
˘
˚
˙˙˙˙˙˙
=
È
Î
ÍÍÍÍÍÍ
˘
˚
˙˙˙˙˙˙
È
Î
ÍÍÍÍÍÍ
˘
˚
˙˙˙˙˙˙
12 2
11 12 13 14
21 22 23 24
31 32 33 34
41 42 43 44
1116_frame_MASTER.book Page 4 Thursday, September 19, 2002 10:34 AM
Light Scatter Spectroscopy and Imaging of Cellular and Subcellular Events
16
-5
The asterisk indicates the complex conjugate and the parameter I represents the intensity of the light.In this notation, unpolarized (or natural light) is represented by the Stokes vector (1,0,0,0). The matrixin Equation 16.2 is known as the Mueller matrix. The explicit relationship between the elements of theMueller scattering matrix and those of the matrix S in Equation 16.1 can be found on page 65 of Reference20. Also note that the 16 elements of the scattering Mueller matrix are not all independent. Only sevenof them are independent, corresponding to the magnitudes of the S1, S2, S3, and S4 of Equation 16.1, andthe three possible independent phase differences between these Sj. Therefore there are nine independentrelationships between the elements of the Mueller matrix.
16.2.2 Common Approximations to Solve for the Scattered Field of Biological Particles
The matrix S in Equation 16.1 is a general expression that describes light scattering from a single scatterer.To predict the scattered field, the matrix elements of S need to be determined. In general, these arecomplex numbers with magnitude and phase dependent on q and f, as well as the dimensions of theparticle, the wavelength of light, and the refractive index ratio m = np/nm, between the particle (indexnp) and the surrounding medium (index np). The elements of S are rarely solved analytically in thegeneral case of a scatterer with arbitrary shape and refractive index. Depending on the biological systemat hand, an approximation is usually made to simplify the problem. Commonly used approximationsare discussed below.
16.2.2.1 Rayleigh-Gans Theory for Scattering Particles with Refractive Index Ratio Close to 1
Qualitatively, a scattering particle may be viewed as composed of different microscopic regions. Anoscillating dipole moment is induced to by the applied incident electric field in each of these microscopicregions. In turn, these driven dipoles scatter radiations in all directions. Thus the scattered wave origi-nating from the particle is the sum of all the dipole radiations. The angular intensity dependence of thescattered wave will therefore depend on the phase relationships between the radiated waves and theseparations between the particle dipoles relative to the incident wavelength. If the particle is very smallcompared to the wavelength, it may be approximated by a single dipole, and one can use Rayleigh’s theoryof scattering. In this case the elements of the matrix S in Equation 16.1 are S3 = S4 = 0, S1 = ik3a, andS2 = ik3acosq. a is the polarizability of the particle, and k is the wavenumber 2p/l. For a sphere withradius r and refractive index ratio, m, a = r3(m2 – 1)/(m2 + 2), and for a homogeneous particle withrefractive index ratio close to 1, a = (m2 – 1)(V/4p), where V is the particle’s volume (Chapter 6 inReference 19).
To satisfy the Rayleigh approximation, |m|ka << 1, where a is a lengthscale on the order of the size ofthe particle. A similar situation arises if the refractive index ratio, m, is close to one, such that |m – 1|<< 1, and 2ka|m – 1| << 1. These two latter conditions imply that the field inside the particle is close tothe incident field, and that the particle may be assumed to be composed of volume elements dV that aresubjected to the same incident field. Thus, instead of assuming that the particle is a single dipole, theparticle is now composed of independently scattering dipoles corresponding to the different volumeelements. These dipoles are therefore driven by the same applied field, and the scattered wave is the sumof the waves scattered by these dipoles. In this case, S3 = S4 = 0, as for Rayleigh scattering, and:
(16.3)
Sik m
VR
Sik m
VR
RV
e dVi
1
3
2
3
1
2
1
2
1
= -
= -
= Ú
( )( , )
( )( , )cos
( , )
pq f
pq f q
q f dwith
1116_frame_MASTER.book Page 5 Thursday, September 19, 2002 10:34 AM

16-6 Biomedical Photonics Handbook
The phase d refers to the phase of the scattered waves with respect to a common origin in the referencecoordinate system. After reformulating d in terms of the problem’s geometry, R can then be integratedfor a given particle shape. Calculations of R for spheres, ellipsoids and cylinders are discussed in Reference19 (Chapter 7) and reference 20 (Chapter 6). The treatment of scattering resulting in Equation 16.3 isreferred to as the Rayleigh-Gans, or Rayleigh-Debye-Gans, theory.
Because the refractive index of biological organelles, such as mitochondria, is typically close to thatof the surrounding medium,23,24 various light scattering studies based on Rayleigh-Gans theory can befound in the literature. These include studies of scattering by bacteria,24,25 macromolecules26,27 or nucle-ated lymphocytes.28 Moreover, if the size and refractive index of the scattering particles satisfy theRayleigh-Gans conditions, light scattering by a three-dimensional scattering object may be approximatedas Fraunhofer diffraction by a two-dimensional aperture function.29 This diffraction-based approachallows the Fourier optical treatment of diffraction and can be used to extract cellular geometric parametersfrom the diffraction pattern of biological cells.30,31
16.2.2.2 Mie Theory for Spherical Particles of Arbitrary Size and Index
For a sphere with symmetry around f (Figure 16.1B), S may be re-expressed as a function of q, x, andm, where q is the angle of scatter, x is a dimensionless size parameter equal to the ratio of the spherecircumference to the wavelength, x = 2pa/l, a = particle radius, and l = wavelength; m = np/nm is theratio of the particle’s refractive index, np, to the surrounding medium’s refractive index, nm. The analyticalsolution for spheres was given by Mie in 1908, and can be found in Chapter 9 of Reference 19 or Chapter4 of Reference 20. For a sphere, S3 and S4 are 0 in Equation 16.1, while S1 and S2 can be expressed asinfinite sums that can be calculated on a computer. Fortran computing routines to solve for the angularscattering function for a homogeneous or coated sphere can be found in Reference 20. Graaff et al.32
present a simple numerical approximation of Mie scattering for 5 < x < 50, and 1 < m <1.1. Combinedwith a model of light propagation in a microscope with high numerical aperture, Mie theory was alsoused successfully to predict high-resolution images of spheres.33
The existence of an analytical solution for the case of a spherical scatterer has prompted many toapproximate biological particles as spheres as a first-order approach to understanding light scatter fromcells and tissues. Despite the complicated morphologies of biological particles, studies have been suc-cessful in utilizing Mie theory to model the angular scattering response of bulk biological tissue. Forexample, the angular scattering functions of brain and muscle were successfully predicted by use of Mietheory and assuming that the tissue is composed of spheres with sizes distributed according to a skewedlogarithmic function.34 Similarly, a model based on Mie theory was able to approximate reflectance spectraof colon tissue adequately.35
16.2.3 Solving the Scattering Problem for a Scatterer of Arbitrary Shape and Index
Although biological particles are close to spherical in some cases, such as when considering the nucleiof certain cells, in general this assumption is not necessarily warranted, especially when consideringmitochondria, which appear rather filamentous in situ, or when considering neuronal dendritic structuresor scattering collagen and elastin fibers in connective tissue. Thus when considering these tissue com-ponents individually, light scattering studies should take into account their potential nonspherical andsometime complicated geometries. Moreover, some tissue components, such as lipids, collagen, or mel-anin, have refractive index ration m > 1.36,37 Numerical approaches to solving the problem of scatteringby particles of arbitrary shape and refractive index have been gradually emerging in applications of lightscatter to biological systems. Two popular approaches for the study of nonspherical biological particlesare the T-matrix method originally developed by Waterman,38,39 and the finite-difference time-domain(FDTD) technique originally proposed by Yee.40 With recent advances in computer hardware, numericalcomputations of angular scatter intensities can now be achieved on a personal computer. Details on the
1116_frame_MASTER.book Page 6 Thursday, September 19, 2002 10:34 AM

Light Scatter Spectroscopy and Imaging of Cellular and Subcellular Events 16-7
T matrix with accompanying software can be found in Barber and Hill.41 The T-matrix and FDTDmethods are also discussed in detail with relevant references in Mishchenko et al.42
In the T-matrix (or transition matrix) method, the incident and scattered field are expanded intovector spherical wave functions. Due to the linearity of Maxwell’s equations, the incident and scatteredfield can then be related by means of a transition matrix (the T-matrix), which depends solely on theparticle geometry and refractive index. Solving for the elements of the T-matrix allows prediction of thescattered field. For example, the T-matrix method was used to study light scattering by red blood cells.43
On the other hand, the FDTD technique is based on the discretization of Maxwell’s curl equations intime and space. Numerical calculation of the electric field as a function of time near the scattering particleis computed after applying the appropriate boundary conditions at the edges of each grid element inspace. The near-field values thus computed are then transformed to yield the scattered far field. At present,the FDTD technique has been used to predict scattering by inhomogeneous cells composed of a sphericalnucleus and of ellipsoidal organelles.17,37 By using an incident time-limited pulse instead of an incidentmonochromatic plane wave, the frequency response of the scattered far-field response can be calculated.The pulsed FDTD approach was implemented to predict the angular scattering response of two-dimen-sional models of inhomogeneous cells as a function of wavelength.44
16.3 Scatter Data Interpretation
Typically, changes in light scatter will result from changes in the scattering particle’s size, shape, refractiveindex and concentration. Changes in these parameters may accompany important biochemical events inorganelles, cells and tissues, and thus serve as diagnostic markers. If the particles that will change havealready been identified, it may be feasible to predict the scattering behavior of these particles by utilizingthe theoretical approaches described in Section 16.2. Combining the scatter measurements with theexpected theoretical predictions will then serve to quantify the cellular or tissue events under study. Inthis case the light scattering methods can be utilized to optically track known variations in cell or tissuesubstructure. The light scatter technique can serve to sort the data, for example, or to automate a wellunderstood diagnostic process.
Light scattering can also be used to probe tissue dynamics in which the scattering sources have notyet been identified. Interpreting the scatter data from such measurements can be particularly complicatedin this case, however, because one must solve the “inverse problem” consisting of extracting hithertounknown tissue properties from the available scatter data. Typically, biological systems are inhomoge-neous, and contain particles of various geometries and optical properties, all of which could potentiallyresult in the observed light scatter changes. As seen in the previous section, the dependence of scatterintensity on angle of scatter is complicated. Thus, in order to extract an absolute optical or morphologicalparameter, extensive angular scatter data may need to be gathered such that sufficient measurements areavailable to fully characterize the angular scatter and cross-section properties of the tissue under study.
Such extensive data are rarely available experimentally, and theoretical prediction about the scatterersis often limited by the set of measurements at hand. In most cases, to identify and characterize the possiblesources of the tissue scatter, including organelles and other substructures, the biological system must beapproximated by a model that can be easily plugged into the theoretical frameworks available. Forexample, the particles within the biological specimen are often assumed to be spherical or randomlyoriented. Although such simplifying assumptions are necessary to begin analyzing a given scatter problem,such assumptions restrict data interpretation. Refining the initial simplifying assumptions will often provenecessary to ensure that the model is adequately taking into account the important variables in a givenbiological situation. In light of the difficulty of specifically identifying the sources of scatter change in agiven tissue, light scattering techniques are best used in conjunction with other methods. For example,light scatter can be used to detect and localize possible morphological changes, while additional bio-chemical manipulation can be used to modulate scatter changes and help identify the molecules or tissuecomponents leading to the observed change.
1116_frame_MASTER.book Page 7 Thursday, September 19, 2002 10:34 AM
16-8 Biomedical Photonics Handbook
16.4 Methods and Applications of Light Scatter Measurements to the Study of Cells and Organelles, and in Tissue Slices
As we have briefly seen in Section 16.2, the amount of light scattered from a given particle typicallydepends on its size compared to the incident wavelength, and on the ratio of its refractive index comparedto the surrounding medium. In general, the larger the particle and its refractive index ratio are, the largerthe amount of scatter it will produce. Moreover, the shape and size of the particle will also affect theangular dependence of the scattered light. Thus, light scattered sideways as a fraction of the total lightscattered will be larger for small spheres than for larger ones. Several techniques have been used to tracksuch changes in the light scattering properties of biological samples. These techniques typically consistof measuring the angular scattering properties of a given sample. For example, changes in angular scatteras a function of sample composition or experimental condition can be monitored to deduce the size,shape or index of the scatterers in each case. In some studies, the dependence of light scatter on incidentwavelength or polarization is also taken into account.
Scatter intensities at multiple angles could be studied by collected angular scatter intensity with theaid of a motorized goniometer. On the other hand, the pattern of diffraction by the sample could beanalyzed utilizing Fourier optics to infer angular scatter. Quantitative transmission and reflection micros-copy have also been used to generate images in which the scatter intensity signals are measured locallyin different parts of the specimen. Representative examples of these scatter measurement methods andtheir applications are discussed in this section.
16.4.1 Light Scattering Spectroscopy of Cells and Organelles in Suspensions
16.4.1.1 Methods to Study Scattering by Particle Suspensions
Particle suspensions are usually probed spectroscopically without optically resolving the individual scat-terers. Scatter intensities at multiple angles can be collected with a rotating goniometer and a singlephotodetector.17,18,45 (Figure 16.2A), or by many detectors positioned at different angles around thespecimen27 (Figure 16.2B). The cell or organelle suspensions are usually contained in a cuvette, or theparticles may be flowed in single file through the optical analysis chamber of a flow cytometer (Fig-ure 16.2C). Scatter intensities are plotted vs. angle around the specimen, and could then be comparedto theoretical predictions. By varying the polarization of the incident light and analyzing the polarizationof the scattered light (if polarizers are used in Figure 16.2A), additional elements of the scattering Muellermatrix (see Section 16.2.1) can be measured.46 Bohren and Huffman list all the possible relationshipsbetween the intensity of the scattered light at the different polarization and the intensity of the polarizedincident beam in terms of the Mueller matrix elements, Sij (Table 13.1 in Reference 20).
16.4.1.2 Applications
16.4.1.2.1 Flow CytometryLight scattering spectroscopy has extensively been employed in cell analysis, such as flow cytometry, toprobe intracellular morphology. In a flow cytometer, scattering near the forward direction and sidescatter near 90∞ are typically collected. Although data at many angles are necessary to characterize thescatterers in the suspensions fully, limited measurements, such as the amount of near-forward scatteredlight and side-scattered light, can also provide very useful information. These two measurements offorward- and side-scatter can be used individually, or combined into a ratio to yield discriminating datathat allow cell identification.
In clinical flow cytometry, cells flowing in a single file through an optical analysis chamber can beanalyzed, sorted and counted based on the ratio of forward- to side-scatter intensity. These cells mayoriginate from a patient’s blood or from a tissue biopsy. By sorting and counting the cells with specificforward-to-side scatter signatures, the status of a patient may be evaluated, and disease may be ruled inor out. For example, utilizing the elastic scattering properties of the different blood cells, human leuko-cytes may be sorted and counted.47 Differentiation of leukocyte can also be improved by measuring
1116_frame_MASTER.book Page 8 Thursday, September 19, 2002 10:34 AM

Light Scatter Spectroscopy and Imaging of Cellular and Subcellular Events 16-9
changes in the amount of depolarization of the side-scattered light.48 A discussion of light scattering asit applies to flow cytometry can be found in Salzman et al.2 (See also the and in the accompanying chapteron flow cytometry.)
16.4.1.2.2 Angular Scatter Measurements of Isolated MitochondriaLight scattering spectroscopy has been extensively used to study mitochondrial swelling and changes inmitochondrial matrix conformations. Although change in mitochondrial morphology could be assessedby electron microscopy, dynamic studies of viable mitochondria typically utilize light scattering to studythis organelle, whose size is close to the optical resolution of microscopes. Light scattering is a simpleand convenient method that is sensitive to changes in the size and shape of particles with dimensionson the order of the wavelength. Moreover, as an optical method, light scattering permits rapid detection
FIGURE 16.2 Schematics illustrating the principle behind experimental setups for collecting angular scatter fromparticle suspensions. A: Scanning goniometer. Light scattered by the sample at a given scattering angle, q, is collectedby a low numerical aperture setup. The collection-detection setup is mounted on the arm of a rotating goniometer.The polarizers and modulator are optional. B: Multidetector setup. Light scattered by the sample is collected as afunction of scattering angle, q, by several detectors placed around the sample. In contrast to the setup in panel A,here the angular measurements are made simultaneously. (Adapted from Wyatt, P.J., Anal. Chim. Acta, 272, 1, 1993.)C: Flow cytometry. The diagram shows cells flowing in single file through a flow cytometer channel, while thescattered light is collected through an optical window. Near-forward and near-90° scatter are typically collected.
]
]
laser
C
B
A
laser
dataanalysis lock-in
amplifier
scatteringsample
modulator
laserθ
Detectors
Sample containingcuvette
Incident laserbeam
detectoron rotating arm
Low Numericalaperture detection
detector 1
detector 2
Forward scatter
Side scatter
optical window
flow inlet flow outlet
polarizer
θ
polarizer
1116_frame_MASTER.book Page 9 Thursday, September 19, 2002 10:34 AM
16-10 Biomedical Photonics Handbook
commensurate with the rates at which mitochondria are expected to change. The light scattering mea-surement may be carried out in a spectrophotometer with the mitochondria suspension contained in aregular cuvette or by flow cytometry. Studies on mitochondria isolated from tissue date back almost 50years to the 1950s. Alterations in mitochondrial morphology measured by light scattering have beenassociated with mitochondrial metabolic state.49–56 Measurements of light transmission or angular lightscattering at 90∞ from a suspension of isolated mitochondria have long been correlated with the mor-phology of mitochondria in the orthodox and condensed states.14,51,52,57 Since these early studies, lightscattering has become the technique of choice to detect mitochondrial size change. Light scatteringtechniques have proved essential in studying the mitochondrial permeability transition.14–16,58–62
The first scattering studies of mitochondria were interpreted by correlating the absorbance or 90∞scatter intensity from the mitochondrial suspension with electron micrographs of the tested mitochon-dria. In most cases, mitochondrial scatter at 90∞ decreased as the number of mitochondria in the “aggre-gated” configuration decreased.14 This aggregated form was typically characterized by a shrunken,electron-dense matrix space with large intercristal space.54 In addition, the absorbance and 90∞ scatter bymitochondrial suspensions were shown to decrease with increased mitochondrial swelling63,64 (Fig-ure 16.3). More recently, this relationship between swelling and mitochondrial absorbance and 90∞ scatterwas utilized in the detection of mitochondrial morphology change during apoptosis. These recent studieswere conducted utilizing flow cytometry65 and by measuring changes either in 90∞ scatter or absorbanceby a suspension of isolated mitochondria in a spectrophotometer cell.66–69
Nonetheless, one should interpret single angle scatter, or absorbance measurements with great care.Under certain conditions the early scattering studies of mitochondrial scatter have provided good cor-relation between light absorbance, or 90∞ scatter intensity, and mitochondrial morphology;14,63,64 however,these methods could present some shortcomings. The general relationship between transmitted light, orlight scattered at one single angle, and particle volume is not always monotonic.70,71 Moreover, changesin refractive index also contribute to the change in light scatter in addition to morphology change, thusconfounding data interpretation. A study by Knight et al.72 shows how changes in light scattered at 90∞may not necessarily correlate with mitochondrial volume change and points at the difficulty in inter-preting single angle scatter data. Thus, additional validation by means of electron microscopy, forexample, will prove necessary to infer the particles’ morphologic configurations correctly from absor-bance or single angle scatter measurements.
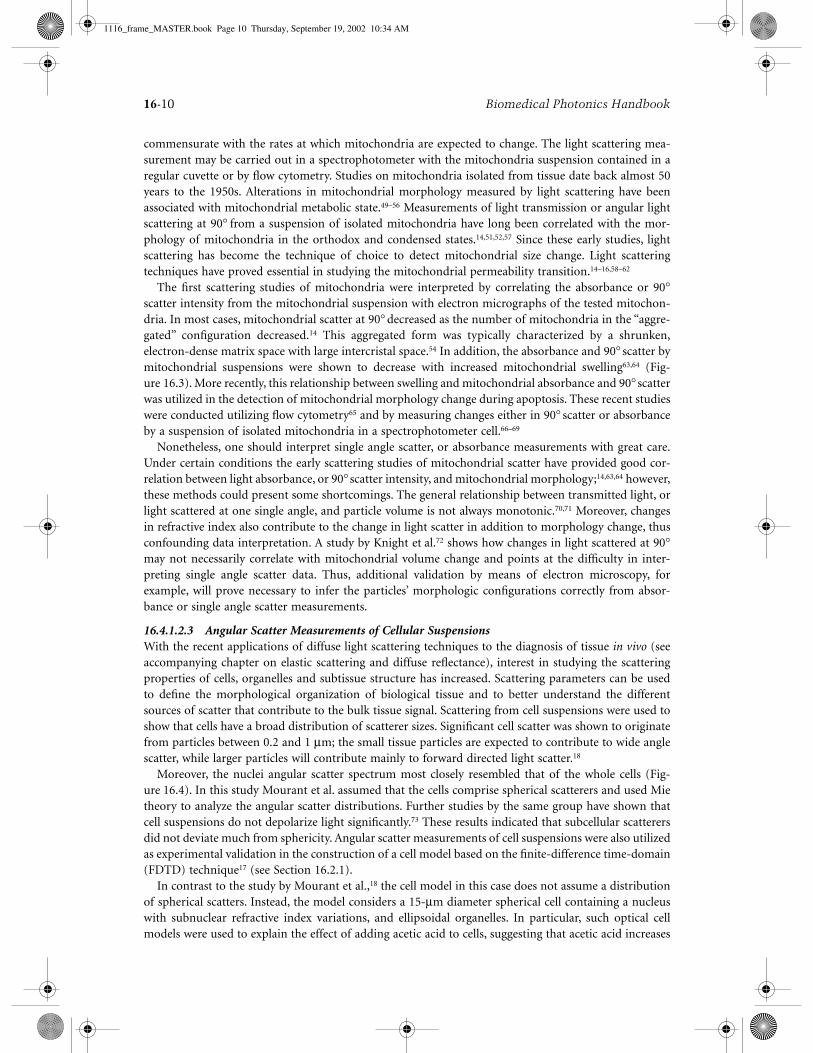
16.4.1.2.3 Angular Scatter Measurements of Cellular SuspensionsWith the recent applications of diffuse light scattering techniques to the diagnosis of tissue in vivo (seeaccompanying chapter on elastic scattering and diffuse reflectance), interest in studying the scatteringproperties of cells, organelles and subtissue structure has increased. Scattering parameters can be usedto define the morphological organization of biological tissue and to better understand the differentsources of scatter that contribute to the bulk tissue signal. Scattering from cell suspensions were used toshow that cells have a broad distribution of scatterer sizes. Significant cell scatter was shown to originatefrom particles between 0.2 and 1 mm; the small tissue particles are expected to contribute to wide anglescatter, while larger particles will contribute mainly to forward directed light scatter.18
Moreover, the nuclei angular scatter spectrum most closely resembled that of the whole cells (Fig-ure 16.4). In this study Mourant et al. assumed that the cells comprise spherical scatterers and used Mietheory to analyze the angular scatter distributions. Further studies by the same group have shown thatcell suspensions do not depolarize light significantly.73 These results indicated that subcellular scatterersdid not deviate much from sphericity. Angular scatter measurements of cell suspensions were also utilizedas experimental validation in the construction of a cell model based on the finite-difference time-domain(FDTD) technique17 (see Section 16.2.1).
In contrast to the study by Mourant et al.,18 the cell model in this case does not assume a distributionof spherical scatters. Instead, the model considers a 15-mm diameter spherical cell containing a nucleuswith subnuclear refractive index variations, and ellipsoidal organelles. In particular, such optical cellmodels were used to explain the effect of adding acetic acid to cells, suggesting that acetic acid increases
1116_frame_MASTER.book Page 10 Thursday, September 19, 2002 10:34 AM

Light Scatter Spectroscopy and Imaging of Cellular and Subcellular Events 16-11
the frequency of fluctuations in nuclear refractive index; acetic acid was also found to increase theamplitude of these index variations.
Acetic acid addition is very relevant to cancer diagnosis. Topical application of acetic acid to tissue isa very common method used by colposcopists to enhance contrast between normal and diseased regionsof the cervical epithelium. Thus, by understanding how different conditions may change the opticalscattering properties of the cells under study, cell modeling, together with scattering studies of cellsuspensions, represents an important set of data, which will undoubtedly be helpful when optimizingand designing current and future optical diagnostic tools.
16.4.1.2.4 Angular Scatter Measurements of Bacteria, Macromolecules and VesiclesScattering spectroscopy of cells and organelles has direct applications to understanding the scatteringproperties of biological tissues. It is important to note that the methods described here for collectingangular scatter data from particle suspensions may also have other biologically relevant applications. Inparticular, angular scatter has been used to identify bacteria.25 The state of polarization of the lightscattered by bacteria was also shown to be sensitive to very small changes in bacterial structure.46 Angular
FIGURE 16.3 Electron microcrographs and absorbance measurements from mitochondrial suspensions subjectedto calcium overload. A: Isolated liver mitochondria suspended in calcium-free incubation medium. B: The mediumwas supplemented with 150 mM Ca2+. C: The decrease in the measured 90° light scattering at 545 nm correlates withmitochondrial swelling upon addition of 150 mM Ca2+ to the control medium. Bar = 1 mm. (From Petronilli, V.,Cola, C., Massari, S., Colonna, R., and Bernardi, P., J. Biol. Chem., 268, 1939, 1993. With permission.)
1116_frame_MASTER.book Page 11 Thursday, September 19, 2002 10:34 AM

16-12 Biomedical Photonics Handbook
scattering was used to characterize the size of macromolecules in suspension.27 In addition, in a systemwhere angular scatter distributions were measured as a function of time, the dynamics of time varyingsystems were characterized. Thus, time-dependent angular scatter measurement was used to track thepolymerization of microtubules as well as dynamic changes in the size of chromaffin granules subjectedto osmotic stress.26
16.4.2 Light Scattering Spectroscopy of Cellular Monolayers and Thin Tissue Slices
16.4.2.1 Methods for Collecting Angular Scatter Measurements by Diffraction
Another way to infer angular scatter is by analyzing the sample’s diffraction pattern with Fourier optics.The principle behind this method is shown in Figure 16.5. In this setup, the sample is illuminated by aplane wave of light obtained by a collimated laser beam, for example. The light scattered by the sampleis collected by a lens, whose numerical aperture will determine the highest angle of scatter that can becollected in by the setup. As shown in Figure 16.5, the diffraction pattern of the sample is formed in theback focal plane, F, of the collection lens. Because the incident laser beam is collimated, the diffractionpattern is generated from light scattered by the sample. The angles of scatter are mapped onto the planeF in increasing order, moving radially away from the optical axis. The laser light that is transmittedwithout being scattered by the sample will be focused in the center of the plane F, and can be subtractedby a beam block at this point. Usually the diffraction pattern in F is reimaged by a second lens onto aphotodetector array, such as a charge-coupled device (CCD) camera.30,31,74 Changes in angular scatteringby the sample can be studied by analyzing its diffraction pattern. The cell sample can be plated on amicroscope slide in this diffraction-based setup, so this method is particularly useful for analyzing cellsin a monolayer, as opposed to in suspension, as was discussed in the previous section.
As for the angular scattering measurements of particle suspensions, the diffraction technique is ofspectroscopic nature: the diffraction pattern corresponds to scattering by the entire sample region illu-minated by the laser beam. The size of this illuminated region can be a few hundreds of microns inwidth. To correlate the angular scatter pattern with a specific region of the sample, Valentine et al.74 useda microscope condenser in the illumination path and were able to set the laser beam diameter to 70 tomm, thus selectively analyzing small regions of a porcine skin specimen (Figure 16.6). In that system the
FIGURE 16.4 Normalized angular scatter measurements, P(q), of fibroblast cells (M1 cells), isolated fibroblast nucleiand isolated fibroblast mitochondria. Values below 9 and 168° were extrapolated. (From Mourant, J.R., Freyer, J.P.,Hielscher, A.H., Eick, A.A., Chen, D., and Johnson, T.M., Appl. Opt., 30, 3586, 1998. With permission.)
1116_frame_MASTER.book Page 12 Thursday, September 19, 2002 10:34 AM

Light Scatter Spectroscopy and Imaging of Cellular and Subcellular Events 16-13
optical microscope was also equipped with a beam splitter after the collection lens, such that an imageof the sampled 70- to -mm region could be collected simultaneously with an image of its diffractionpattern on two separate cameras.
16.4.2.2 Applications of Diffraction to Cellular Analysis
Analysis of angular scattering by modeling the scatter as a Fraunhofer diffraction field from a two-dimensional flat object was used to measure the diameters of the nucleus and cytoplasm of stainedcervical cells.30 The nucleated cells were modeled as two circular concentric regions having differentoptical densities, and diameters dN and dC corresponding to the nucleus and cytoplasm, respectively. Insome cases the effects of offsetting the nucleus from the center of the cell were also considered. Thesolution of the Fraunhofer diffraction model gives the radial dependence of the light intensity in thediffraction pattern of the sample. By analyzing only one radial scan of the diffraction pattern, nuclearand cytoplasmic diameters were calculated and compared with the actual dimensions of normal, dys-
FIGURE 16.5 Experimental setup for imaging the diffraction pattern of cells or tissue slices plated on a microscopeslide. F = objective’s back focal plane. F and F’¢are conjugate Fourier planes. The scattered light (gray beam), whichforms the diffraction pattern of the sample, is reimaged onto a photodetector array, while the transmitted light (cross-hatched beam) is blocked at the center of the plane F.
FIGURE 16.6 Images and diffraction patterns from two porcine skin specimens, 20 mm thin. In panel A, the tissueregion sampled is homogeneous and the diffraction pattern is isotropic. In panel B, a region in the vicinity of a hairresults in an anisotropic scattering pattern. The black rod in the diffraction images corresponds to the transmittedlight beam block. The scattering angle, q, increases in the radial direction. Transmitted light and light scattered at0° will be focused in the center of the diffraction pattern. (From Valentine, M.T., Popp, A.K., Weitz, D.A., and Kaplan,P.D., Opt. Lett., 26, 890, 2001. With permission.)
transmitted
scattered
Conjugate planes
transmitted beamblocked
F’
Photodetectorarray
collection lensobjective
F
θ2
θ1
thin scatteringsample
1116_frame_MASTER.book Page 13 Thursday, September 19, 2002 10:34 AM

16-14 Biomedical Photonics Handbook
plastic and cancerous cells. The results show that the correct nuclear diameter was inferred in more than80% of the 378 cells tested.
A similar approach was taken by Burger et al.31 to extract nuclear and cytoplasmic diameters from theFraunhofer diffraction pattern of nucleated cell models and nucleated erythrocytes. The cellular dimen-sions inferred from the light scatter analysis in the diffraction pattern matched the microscopicallydetermined dimensions of the cytoplasm and nucleus very well. An additional radial scan of the diffractionpattern taken at 90∞ to the first one also helped differentiate the major and minor axes’ diameters of theseelliptical erythrocytes. More recently, modeling of light scattering as a Fraunhofer diffraction pattern wasused to monitor the rounding of initially elongated cells in response to follicle-stimulating hormone75
and the changes in cell diameter at the onset of apoptosis.76
16.4.2.3 Other Techniques to Study Scattering of Cellular Monolayers and Thin Tissue Slices
Angular scatter measurements from thin tissue slices can be made by directly measuring the intensity ofthe forward scattered light from a tissue slice mounted on a cover slip. Direct measurements of angularlight scattering were used to extract information about order and spacing between the collagen fibers incartilage. In particular, the average scatter angle from 40-mm thin cartilage slices was shown to decreaseas a function of the aggregate compressive modulus (measured separately from the bulk samples priorto slicing).77 This relationship between angular scatter and modulus could be explained by a theoreticalanalysis relating average scatter angle, compressive modulus and a short-range order parameter. Fromthis analytical model, this short-range order parameter, which describes the spatial correlation lengthbetween the collagen fibers, was found to be 8.2 mm.
Other scattering spectroscopic techniques of monolayers of cells and thin tissue slices have also beendescribed. By analyzing the refractive index fluctuations of mouse liver tissue obtained by phase-contrastmicroscopy, Schmitt and Kumar78 showed that the number density of scattering particles in the tissuedecreases as a function of increasing diameter and follows an inverse power law similar to that whichdescribes the volume fractions of subunits of a fractal object. In this study the scatterers were assumedto be spherical and were described by Mie theory.
Angle-dependent low coherence interferometry was used to measure the backscatter intensity as afunction of angle from monolayers of cultured HT29 epithelial cells.79 As for optical coherence tomog-raphy, this technique offers a depth resolution defined by the coherence length of the light source andallows scattering measurements from a specific point within the penetration depth of the sample. Whenprobing a point close to the sample surface, or thin monolayers of cells, the angular scattering isdominated by single scattering and can be analyzed by Mie theory. Assuming spherical scatterers, theangle-dependent low coherence method was used to extract nuclear diameter and nuclear refractiveindex. Once the nuclear contribution to the angular scattering is subtracted, the remaining angularscatter spectrum can be analyzed to extract information about subcellular organelles smaller than thenucleus. This study yielded a subcellular scatterer size distribution similar to that previously measuredby Schmitt and Kumar,78 where the number density of tissue scatterers followed an inverse power lawas a function of scatterer diameter.
16.4.3 Combining Spectrscopy and Imaging of Tissue Slices and Cellular Monolayers
16.4.3.1 Transmission and Reflectance Images of Brain Slices
The techniques described in the two previous subsections probe the angular dependence of light scatteringby the specimen under study, but without imaging the sample. The scatter intensities are typicallycollected from an ensemble of particles, and information about the location of the scatter sources withinthe specimen is not always saved. Cells often respond differentially to a given treatment; tracking thelocation of the scatter change within a monolayer of cells or within a tissue slice could provide a betterunderstanding of the basic dynamics of a time dependent biological process. To this end, imaging methods
1116_frame_MASTER.book Page 14 Thursday, September 19, 2002 10:34 AM

Light Scatter Spectroscopy and Imaging of Cellular and Subcellular Events 16-15
based on scattering signals can be used to record relative changes in light scatter within the full field ofview. Scattering information can be collected directly from bright-field and dark-field microscopic imagescollected at a specific wavelength.
The imaging wavelength is typically chosen in the red or near infrared, which penetrate tissue deeperthan shorter wavelengths. The intensity distributions within transmission and reflectance microscopyimages depend on the way the light is absorbed or scattered by the tissue under study. Changes in thebiological composition of the tissue can affect absorbance and transmission through the specimen andcan therefore be used to track subtissue dynamics. Transmission and reflectance imaging have been usedto map neural activity within brain slices by differentiating the response of the different neuronal layerswithin the slice in response to a stimulus. Intrinsic optical signals such as transmittance or reflectanceare often recorded in conjunction with fluorescent images using voltage-sensitive dyes or mitochondrialpotential dyes for, example. These fluorescent images help correlate the optical scatter signal with bio-chemical and electrophysiological properties of the different tissue regions.
A short review of the application of intrinsic optical imaging techniques to brain slices can be foundin Aitken et al.80 Transmitted and reflected light signals are shown in the CA1 region of the hippocampusas a function of hypotonic stress,80,81 neural stimulation80 or spreading depression.80 Changes in lighttransmission were also compared between the CA1 and CA3 regions of the hippocampus as a functionof N-Methyl D-aspartate (NMDA) and kainate mediated excito-toxic injury.82 Changes in transmittedlight and mitochondrial depolarization measured with the fluorescent dye rhodamine 123 were used totrack the spatio-temporal dynamics of hypoxia and spreading depression within hippocampal slices.83
Using a fiber-optic excitation/collection bundle, reflected light was measured in-vivo from the cat hip-pocampus and correlated with evoked potentials.84
Brain slices are advantageous compared to isolated neuronal cultures in that they preserve the physi-ological relationship between neurons and glia, as well as the connectivity between different neuronalregions. However, to preserve these relationships adequately and maintain an experimentally viable tissue,the slices are often several microns in thickness. As a result, multiple scattering may affect the opticalsignals detected, and the single particle scattering approaches presented in Section 16.2 may not beapplicable. Moreover, because most studies do not record the full angular scatter response from the tissue,the optical signal interpretation becomes limited.
16.4.3.2 Dual Angle Scatter Imaging Of Brain Slices
To explore angular scatter by brain slices, Johnson et al. measured light scattered by hippocampal slicesafter illuminating the tissue at two different angles (Figure 16.7).85 These brain slices were still 310-mmthick and multiple scatter may not be negligible. However, by comparing the individual images collectedat each of the two illumination angles and their ratio, Johnson et al. were able to differentiate thehippocampal response to hypotonic stress from the response to NMDA-mediated injury (Figure 16.8).85
When each illumination angle was considered individually, both hypotonic and NMDA treatmentsshowed a relative decrease in the intensity of the light scattered by the CA1 region. However, when theratio of the images collected at the two angles was considered, changes could only be measured after theNMDA treatment.
Although several scattering components, such as dendritic processes, axonal varicosities or cellularorganelles, can contribute to transmission, reflection and scattering measurements of brain slices,86 thestudy by Johnson et al. still shows that intrinsic optical signals can be successfully used to differentiatefunctional neuronal responses. As such, despite the difficulty in fully interpreting the scattering responseof relatively thick tissue slices, transmission and reflectance imaging of brain slices remain very valuablebecause they provide a simple method to record spatio-temporal dynamics that reflect morphologicalchange and that can be measured simultaneously in the whole preparation, unlike focal electrode recordings.
16.4.3.3 Optical Scatter Imaging of Cellular Monolayers
Recently, Boustany et al. demonstrated an optical scatter imaging (OSI) technique that produces imagesthat directly encode a morphometric parameter within the full field of view of the microscope.87 This
1116_frame_MASTER.book Page 15 Thursday, September 19, 2002 10:34 AM

16-16 Biomedical Photonics Handbook
OSI method combines Fourier filtering with central dark-field microscopy to detect alterations in thesize of particles with wavelength-scale dimensions. A “scatter ratio” image is generated by taking the ratioof images collected at high and low numerical aperture in central dark-field microscopy. Such an imagespatially encodes the ratio of wide to narrow angle scatter (or optical scatter image ratio, designated hereas “OSIR”) and hence provides a measure of local particle size.
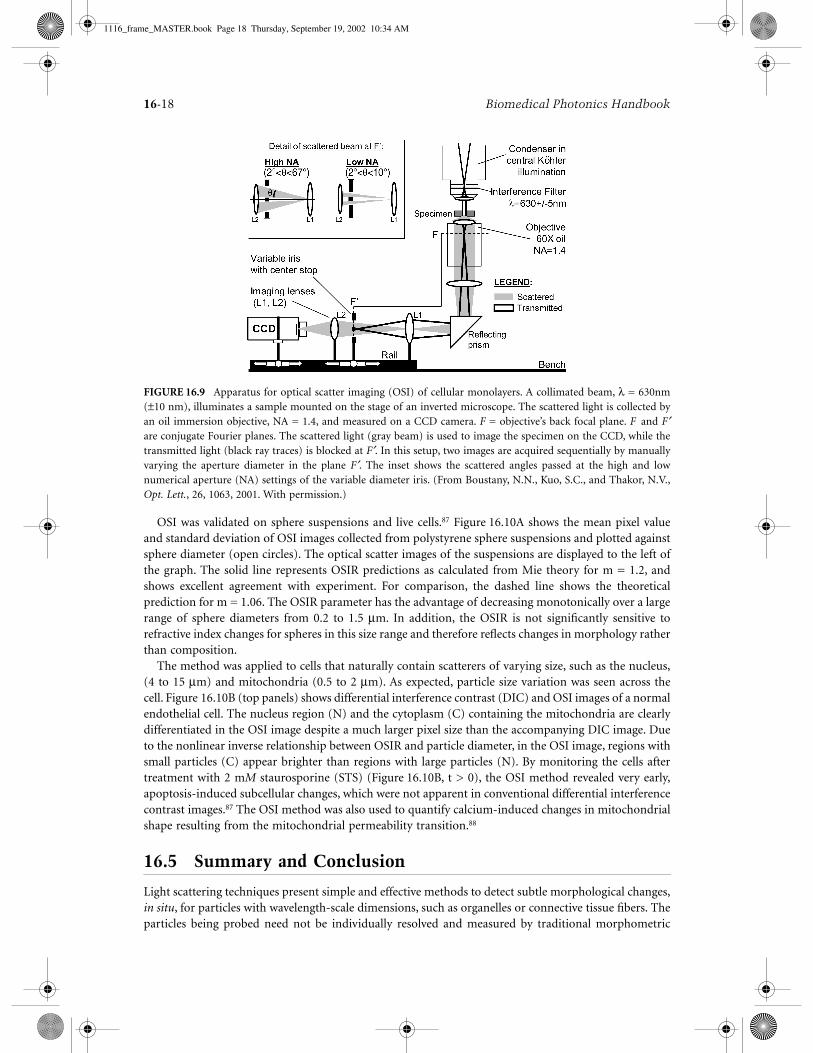
Figure 16.9 shows the OSI microscopy setup. The specimens are mounted on the stage of an invertedmicroscope, which can also be fitted with an epi-fluorescence and differential interference contrast (DIC)imaging capabilities. The microscope condenser is adjusted to central Kohler illumination, with a con-denser numerical aperture (NA) of 0.03 (condenser front aperture closed). For illumination, light fromthe microscope’s Halogen lamp is filtered to yield an incident red beam, l = 630 ± 5 nm. The imageswere collected with a 60X oil immersion objective, NA = 1.4, and displayed on a charge coupled devicecamera. In a Fourier plane conjugate to the back focal plane of the objective, a beam stop was placed inthe center of an iris with variable diameter. As the inset in Figure 16.9 shows, the variable iris collectslight scattered within a solid angle, bound by 2∞ < q <10∞ for low NA, and 2∞ < q < 67∞ for high NA. Twosequential dark-field images are acquired at high and low NA by manually adjusting the diameter of thevariable iris. The scatter ratio image is obtained by dividing the background subtracted the high NAimage by the background subtracted low NA image.
FIGURE 16.7 (A): Setup for dual-angle scattering images of hippocampal slices. a, shutter; b, infrared filter; c, beamsplitter; d, mirror; e, shutter; f, mirror; g, polarizer; h, specimen; i, low numerical aperture objective; j, polarizer; k,interference filter. (B): Stage design for experiments on microsphere suspensions. (C): Stage design for brain sliceexperiment. q1,2 represent the two scattering angles, 31 and 34°, for which the images were acquired. (From Johnson,L.J., Hanley, D.F., and Thakor, N.V., J. Neurosc. Methods, 98, 21, 2000. With permission.)
1116_frame_MASTER.book Page 16 Thursday, September 19, 2002 10:34 AM

Light Scatter Spectroscopy and Imaging of Cellular and Subcellular Events 16-17
FIGURE 16.8 Single-angle and dual-angle scatter images of hippocampal slices under osmotic stress and subjectedto NMDA. In each case, the colorbars indicate the percent change in image intensity. In regions of the slice wherethe change is less than ±2%, the grayscale images of the hippocampus are shown. (a) The scatter image of ahippocampal slice is shown. The three main regions of the hippocampus are CA1, CA3 and the dentate gyrus. Alsoshown are single-angle scatter images at 31∞ (b) and 34∞ (c) of an NMDA treated slice. In both (b) and (c) there isa large change in the CA1 region. There is also a significant change in the dendate gyrus that fades by minute 39 ofthe experiment. Single-angle scatter images at 31∞ (d) and 34∞ (e) are shown for hypotonic treatment. In both (d)and (e), a large change is indicative of cellular swelling in the CA1 region. There is also a significant change in thedendate gyrus. Dual angle scatter ratio images are shown for NMDA (f) and hypotonic (g) treatments. The NMDAtreated slices in (f) undergo a relatively larger change in the dual-angle scatter ratio in CA1. In CA1 the scatter ratiochange is negative, possibly indicating particle shrinkage. In (g), hypotonic treatment, the magnitude of the changein the scatter ratio is less in CA1. In addition, the overall location of the scatter change is more spread out than forNMDA treatment. In both (f) and (g) the white matter areas reveal a positive change in the scatter ratio. (FromJohnson, L.J., Hanley, D.F., and Thakor, N.V., J. Neurosc. Methods, 98, 21, 2000. With permission.)
1116_frame_MASTER.book Page 17 Thursday, September 19, 2002 10:34 AM
16-18 Biomedical Photonics Handbook
OSI was validated on sphere suspensions and live cells.87 Figure 16.10A shows the mean pixel valueand standard deviation of OSI images collected from polystyrene sphere suspensions and plotted againstsphere diameter (open circles). The optical scatter images of the suspensions are displayed to the left ofthe graph. The solid line represents OSIR predictions as calculated from Mie theory for m = 1.2, andshows excellent agreement with experiment. For comparison, the dashed line shows the theoreticalprediction for m = 1.06. The OSIR parameter has the advantage of decreasing monotonically over a largerange of sphere diameters from 0.2 to 1.5 mm. In addition, the OSIR is not significantly sensitive torefractive index changes for spheres in this size range and therefore reflects changes in morphology ratherthan composition.
The method was applied to cells that naturally contain scatterers of varying size, such as the nucleus,(4 to 15 mm) and mitochondria (0.5 to 2 mm). As expected, particle size variation was seen across thecell. Figure 16.10B (top panels) shows differential interference contrast (DIC) and OSI images of a normalendothelial cell. The nucleus region (N) and the cytoplasm (C) containing the mitochondria are clearlydifferentiated in the OSI image despite a much larger pixel size than the accompanying DIC image. Dueto the nonlinear inverse relationship between OSIR and particle diameter, in the OSI image, regions withsmall particles (C) appear brighter than regions with large particles (N). By monitoring the cells aftertreatment with 2 mM staurosporine (STS) (Figure 16.10B, t > 0), the OSI method revealed very early,apoptosis-induced subcellular changes, which were not apparent in conventional differential interferencecontrast images.87 The OSI method was also used to quantify calcium-induced changes in mitochondrialshape resulting from the mitochondrial permeability transition.88
16.5 Summary and Conclusion
Light scattering techniques present simple and effective methods to detect subtle morphological changes,in situ, for particles with wavelength-scale dimensions, such as organelles or connective tissue fibers. Theparticles being probed need not be individually resolved and measured by traditional morphometric
FIGURE 16.9 Apparatus for optical scatter imaging (OSI) of cellular monolayers. A collimated beam, l = 630nm(±10 nm), illuminates a sample mounted on the stage of an inverted microscope. The scattered light is collected byan oil immersion objective, NA = 1.4, and measured on a CCD camera. F = objective’s back focal plane. F and F¢are conjugate Fourier planes. The scattered light (gray beam) is used to image the specimen on the CCD, while thetransmitted light (black ray traces) is blocked at F¢. In this setup, two images are acquired sequentially by manuallyvarying the aperture diameter in the plane F¢. The inset shows the scattered angles passed at the high and lownumerical aperture (NA) settings of the variable diameter iris. (From Boustany, N.N., Kuo, S.C., and Thakor, N.V.,Opt. Lett., 26, 1063, 2001. With permission.)
1116_frame_MASTER.book Page 18 Thursday, September 19, 2002 10:34 AM

Light Scatter Spectroscopy and Imaging of Cellular and Subcellular Events 16-19
methods, thus avoiding a tedious process of image recognition, particle sizing and counting. Lightscattering techniques complement other microscopic methods and, in contrast to electron microscopy,require no potentially damaging cell preparation procedures.
Unlike fluorescence labeling, which results in illuminating specific biochemical markers, methodsbased on light scattering do not require labeling. As a result, scattering is not biochemically specific,and may originate from different tissue and cellular structures, often requiring further biochemicalelucidation. Still, light scattering data can have important diagnostic value despite having limitedspecificity. One of the strengths of light scattering techniques is that they can reveal the presence ofcellular and subcellular morphological dynamics noninvasively. Morphological information comple-ments biochemical data, and could be particularly valuable if the biochemical events and time sequenceunderlying a given biological behavior are not yet known to allow specific biochemical manipulation.Moreover, under certain conditions in which only a few parameters are known to vary, scattering datacan be used to automate cell differentiation and sorting efficiently during high-throughput cell analysis,as in flow cytometry.
Combining theory and experiment, various researchers have been striving to provide novel approachesto solve the “inverse problem” and infer, from a limited light scattering data set, the morphologic andoptical properties of cells and organelles. These studies are invaluable in transforming hitherto phenom-enological results into data that could be used to design optical instruments with a high impact on biologyand medicine.
FIGURE 16.10 A: OSI images and measurement of the optical scatter image ratio (OSIR) in aqueous suspensionsof polystyrene spheres (m = 1.2). The OSIR is a measure of wide to narrow angle scatter. Experimental data (opencircles), and theoretical predictions (solid line: m = 1.2, dashed line: m = 1.06) are shown. The experimental datapoints show the mean pixel value and standard deviation in the scatter images displayed to the left of the graph.(From Boustany, N.N., Kuo, S.C., and Thakor, N.V., Opt. Lett., 26, 1063, 2001. With permission.) B: Representativecell undergoing apoptosis after treatment with 2 mm staurosporine (STS). The cell was imaged in differentialinterference contrast (DIC) (left panels) and OSI (right panels) at different time points. C = cytoplasm, N = nucleus.Images are displayed at times t = –10, 4, 18, and 37 min. from STS addition at t = 0. The ratiometric scatter imagesshow a decreasing scatter ratio within the cytoplasm (C).
1116_frame_MASTER.book Page 19 Thursday, September 19, 2002 10:34 AM

16-20 Biomedical Photonics Handbook
References
1. Darynkiewicz, Z., Juan, G., Li, X., Goreczyca, W., Murakami, T., and Traganos, F., Cytometry incell necrobiology: analysis of apoptosis and accidental cell death, Cytometry, 27, 1, 1997.
2. Salzman, G.C., Sigham, S.B., Johnston, R.G., and Bohren, C.F., Light scattering and cytometry, inFlow Cytomet. Sorting, 2nd ed., Melamed, M.R., Lindmo, T., and Mendelsohn, M.L., eds., Wiley-Liss: New York, 81,, 1990.
3. Lizard, G., Fournel, S., Genestier, L., Dhedin, N., Chaput, C., Flacher, M., Mutin, M., Panaye, G.,and Revillard, J.-P., Kinetics of plasma membrane and mitochondrial alterations in cells undergoingapoptosis, Cytometry, 21, 275, 1995.
4. Ost, V., Neukammer, J., and Rinneberg, H., Flow cytometric differentiation of erythrocytes andleukocytes in dilute whole blood by light scattering, Cytometry, 32, 191, 1998.
5. Weston, K.M., Alsalami, M., and Raison, R., Cell membrane changes induced by the cytolyticpeptide, mellitin, are detectable by 90° laser scatter, Cytometry, 15, 141, 1994.
6. Conville, P.S., Witebsky, F.G., and MacLowry, J.D., Antomicrobial susceptibilities of micobacteriaas determined by differential light scattering and correlation with results from multiple referencelaboratories, J. Clin. Microbiol., 32, 1554, 1994.
7. Anderson, A.M., Angyal, G.N., Weaver, C.M., Felkner, I.C., Wolf, W.R., and Worthy, B.E., Potentialapplication of laser/microbe bioassay technology for determining water-soluble vitamins in foods,J. AOAC Int., 76, 682, 1993.
8. Lavergne-Mazeau, F., Maftah, A., Cenatiempo, Y., and Julien, R., Linear correlation between bac-terial overexpression of recombinant peptides and cell light scatter, Appl. Environ. Microbiol., 62,3042, 1996.
9. Smeraldi, C., Berardi, E., and Porro, D., Monitoring of peroxisome induction and degradation byflow cytometric analysis of hansenula polymorpha cells grown in methanol and glucose media: cellvolume refractive index and FITC retention, Microbiology, 140, 3161, 1994.
10. Hubbell, J.A., Pohl, P.I., and Wagner, W.R., The use of laser light scattering and controlled shearin platelet aggregometry, Thrombosis Haemostasis, 65, 601, 1991.
11. Tohgi, H., Takashi, H., Watanabe, K., and Hiroyuki, K., Development of large platelet aggregatesfrom small aggregates as determined by laser light scattering: effect of aggregant concentration andantiplatelet medication, Thrombosis Haemostasis, 75, 838, 1996.
12. Ozaki, Y., Satoh, K., Yatomi, Y., Yamamoto, T., and Shirasawa, Y., Detection of platelet aggregateswith particle counting method using light scattering, Anal. Biochem., 218, 284, 1994.
13. Tedeshi, H. and Harris, D., Some observations on the photometric estimation of mitochondrialvolume, Biochim. Biophys. Acta, 28, 392, 1958.
14. Hunter, D.R. and Haworth, R.A., The Ca2+-induced membrane transition in mitochondria, Arch.Biochem. Biophys., 195, 453, 1979.
15. Bernardi, P., Vassanelli, S., Veronese, P., Colonna, R., Szabo, I., and Zoratti, M., Modulation of themitochondrial permeability transition pore, J. Biol. Chem., 267, 2934, 1992.
16. Kristal, B.S. and Dubinsky, J.M., mitochondrial permeability transition in the central nervoussystem: induction by calcium cycling-dependent and -independent pathways, J. Neurochem., 69,,524, 1997.
17. Drezek, R., Dunn, A., and Richards-Kortum, R., Light scattering from cells: finite-difference time-domain simulations and goniometric measurements, Appl. Opt., 38, 3651, 1999.
18. Mourant, J.R., Freyer, J.P., Hielscher, A.H., Eick, A.A., Chen, D., and Johnson, T.M., Mechanismsof light scattering from biological cells relevant to noninvasive optical-tissue diagnostics, Appl.Opt., 37, 3586, 1998.
19. Van de Hulst, H.C., Light Scattering by Small Particles, New York: Dover, 1981.20. Bohren, C.F. and Huffman, D.R., Absorption and Scattering of Light by Small Particles, New York:
John Wiley & Sons, 1983.
1116_frame_MASTER.book Page 20 Thursday, September 19, 2002 10:34 AM

Light Scatter Spectroscopy and Imaging of Cellular and Subcellular Events 16-21
21. Cheong, W.F., Prahl, S.A., and.Welch, A.J., A review of the optical properties of biological tissues,IEEE J. Quantum Electron., 26, 2166, 1990.
22. Beauvoit, B., Evans, S.M., Jenkins, T.W., Miller, E.E., and Chance, B., correlation between the lightscattering and the mitochondrial content of normal tissues and transplantable rodent tumors,Anal. Biochem., 226, 167, 1995.
23. Beuthan, J., Minet, O., Helfmann, J., Herrig, M., and Muller, G., The spatial variation of therefractive index in bbiological cells, Phys. Med. Biol., 41, 369, 1996.
24. Koch, A.L., Some calculations on the turbidity of mitochondria and bacteria, Biochim. Biophys.Acta, 51, 429, 1961.
25. Wyatt, P.J., Differential light scattering: a physical method for identifying living bacterial cells, Appl.Opt., 7, 1879, 1968.
26. Morris, S.J., Shultens, H.A., Hellweg, M.A., Striker, G., and Jovin, T.M., Dynamics of structuralchanges in biological particles from rapid light scattering measurements, Appl. Opt., 18, 303, 1979.
27. Wyatt, P.J., Light scattering and the absolute characterization of macromolecules, Analytica ChimicaActa, 272, 1, 1993.
28. Sloot, P.M.A., Hoekstra, A.G., and Figdor, C.G., Osmotic response of lymphocytes measured bymeans of forward light scattering: theoretical considerations, Cytometry, 9, 636, 1988.
29. Evans, E., Comparison of the diffraction theory of image formation with the three-dimensional,first Born scattering approximation in lens systems, Opt. Commn., 2, 317, 1970.
30. Turke, B., Seger, G., Achatz, M., and Seelen, W.v., Fourier optical approach to the extraction ofmorphological parameters from the diffraction pattern of biological cells, Appl. Opt., 17, 2754,1978.
31. Burger, D.E., Jett, J.H., and Mullaney, P.F., Extraction of morphological features from biologicalmodels and cells by Fourier analysis of static light scatter measurements, Cytometry, 2, 327, 1982.
32. Graaff, R., Aarnoudse, J.G., Zijp, J.R., Sloot, P.M.A., Mul, F.F.M.D., Grieve, J., and Kolink, M.H.,Reduced light scattering properties for mixtures of spherical particles: a simple approximationderived form Mie calculation, Appl. Opt., 31, 1370, 1992.
33. Ovryn, B. and Izen, S.H., Imaging of transparent spheres through a planar interface using a high-numerical-aperture optical microscope, J. Opt. Soc. Am. A, 17, 1202, 2000.
34. Schmitt, J.M. and Kumar, G., Optical scattering properties of soft tissue: a discrete particle model,Appl. Opt., 37, 2788, 1998.
35. Zonios, G., Perelman, L.T., Backman, V., Manoharan, R., Fitzmaurice, M., Dam, J.V., and Feld,M.S., Diffuse reflectance spectroscopy of human adenomatous colon polyps in vivo, Appl. Opt.,38, 6628, 1999.
36. Johnsen, S. and Widder, E.A., The physical basis of transparency in biological tissue: ultrastructureand the minimization of light scattering, J. Theor. Biol., 199, 181, 1999.
37. Dunn, A. and Richards-Kortum, R., Three-dimensional computation of light scattering from cells,IEEE J. Selected Topics Quantum Electron., 2, 898, 1996.
38. Waterman, P.C., Matrix formulation of electro-magnetic scattering, Proc. IEEE, 53, 805, 1965.39. Waterman, P.C., Symmetry, unitarity, and geometry in electro-magnetic scattering, Phys. Rev. D,
3, 825, 1971.40. Yee, S.K., Numerical solution of initial boundary value problems involving Maxwell’s equations in
isotropic media, IEEE Trans. Antennas Propag., 14, 302, 1966.41. Barber, P.W. and Hill, S.C., Light Scattering by Particles: Computational Methods, 1990, World
Scientific: Singapore.42. Mishchenko, M.I., Travis, L.D., and Macke, A., T-matrix method and its applications, in Light
Scattering by Nonspherical Particles: Theory Measurements and Applications, Mishchenko, M.I.,Hovenier, J.W., and Travis, L.D., eds., Academic Press: San Diego, 147, 2000.
43. Nilsson, A.M.K., Alsholm, P.L., Karlsson, A., and Andersson-Engles, S., T-matrix computations oflight scattering by red blood cells, Appl. Opt., 37, 2735, 1998.
1116_frame_MASTER.book Page 21 Thursday, September 19, 2002 10:34 AM

16-22 Biomedical Photonics Handbook
44. Drezek, R., Dunn, A., and Richards-Kortum, R., A pulsed finite-difference time-domain (FDTD,method for calculating light scattering from biological cells over broad wavelength ranges, Opt.Express, 6, 148, 2000.
45. Bolt, R.A. and deMul, F.F.M., Goniometric instrument for light scattering measurment of biologicaltissues and phantoms, Rev. Sci. Instrum., 73, 2211, 2002.
46. Bickel, W.S., Davidson, J.F., Huffman, D.R., and Kilkson, R., Application of polarization effects inlight scattering: a new biophysical tool, Proc. Nat. Acad. Sci. USA, 73, 486, 1976.
47. Salzman, G.C., Crowell, J.M., Martin, J.C., Trujillo, T.T., Romero, A., Mullaney, P.F., and Labauve,P.M., Cell classification by laser light scattering: identification and separation of unstained leuko-cytes, Acta Cytol. Praha,, 19, 374, 1975.
48. deGrooth, B.G., Terstappen, L.W.M.M., Puppels, G.J., and Greve, J., Light-scattering polarizationmeasurements is a new parameter in floe cytometry, Cytometry, 8, 539, 1987.
49. Lehninger, A.L., Reversal of thyroxine-induced swelling of rat liver mitochondria by adenosinetriphosphate, J. Biol. Chem., 234, 2187, 1959.
50. Packer, L., Metabolic and structural states of mitochondria, J. Biol. Chem., 235, 242, 1960.51. Hackenbrock, C.R., Ultrastructural bases for metabolically linked mechanical acivity in mitochon-
dria I, J. Cell Biol., 30, 269, 1966.52. Packer, L., Energy-linked low amplitude mitochondrial swelling, in Methods in Enzymology, Vol.
10, Estabrook, R.W. and Pullman, M.E., eds., Academic Press: New York, 685, 1967.53. Harris, R.A., Asbell, M.A., Asai, J., Jolly, W.W., and Green, D.E., The conformational basis of energy
transduction in membrane systems.V. Measurement of configurational changes by light scattering,Arch. Biochem. Biophys., 132, 545, 1969.
54. Hunter, D.R., Haworth, R.A., and Southward, J.H., Relationship between configuration, function,and permeability in calcium-treated mitochondria, J. Biol. Chem., 251, 5069, 1976.
55. Halestrap, A.P., Regulation of mitochondrial metabolism through changes in matrix volume,Biochem. Soc. Trans., 22, 522, 1994.
56. Territo, P.R., French, S.A., Dunleavy, M.C., Evans, F.J., and Balaban, R.S., Calcium Activation ofHeart Mitochondrial Oxidative Phosphorilation, J. Biol. Chem., 276,, 2586, 2001.
57. Hunter Jr, F.E. and Smith, E.E., Measurement of mitochndrial swelling and shrinking — highamplitude, in Methods in Enzymology, Estabrook, R.W. and Pullman, M.E. eds., Academic Press:New York, 689, 1967.
58. Bernardi, P., Modulation of the Mitochondrial cyclosporin a-sensitive permeability transition poreby the proton electrochemical gradient, J. Biol. Chem., 267, 8834, 1992.
59. Petronilli, V., Constantini, P., Scorrano, L., Colonna, R., Passamonti, S., and Bernardi, P., the voltagesensor of the mitochondrial permeability transition pore is tuned by the oxidation-reduction stateof vicinal thiols, J. Biol. Chem., 269, 16638, 1994.
60. Hoek, J.B., Farber, J.L., Thomas, A.P., and Wang, X., Calcium ion-dependent signaling and mito-chondrial dysfunction: mitochondrial calcium uptake during hormonal stimulation in intact livercells and its implication for the mitochondrial permeability transition, Biochim. Biophys. Acta,1271, 93, 1995.
61. Constantini, P., Chernyak, B.V., Petronilli, V., and Bernardi, P., Modulation of the mitochondrialpermeability transition pore by pyridine nucleotides and dithiol oxidation at two separate sites, J.Biol. Chem., 271, 6746, 1996.
62. Scorrano, L., Petronilli, V., and Bernardi, P., On the voltage dependence of the mitochondrialpermeability transition pore, J. Biol. Chem., 272, 12295, 1997.
63. Pfeiffer, D.R., Kuo, T.H., and Chen, T.T., Some effect of Ca2+, Mg2+, and Mn2+ on the ultrastructure,light scattering properties, and malic enzyme activity of adrenal cortex mitochondria, Arch. Bio-chem. Biophys., 176, 556, 1976.
64. Petronilli, V., Cola, C., Massari, S., Colonna, R., and Bernardi, P., Physiological effectors modifyvoltage sensing by the cyclosporin a-sensitive permeability transition pore of mitochondria, J. Biol.Chem., 268, 21939, 1993.
1116_frame_MASTER.book Page 22 Thursday, September 19, 2002 10:34 AM

Light Scatter Spectroscopy and Imaging of Cellular and Subcellular Events 16-23
65. Vander-Heiden, M.G., Chandel, N.S., Williamson, E.K., Schumacker, P.T., and Thompson, C.B.,Bcl-xL regulates the membrane potential and volume homeostasis of mitochondria, Cell, 91, 627,1997.
66. Zamzami, N., Susin, S.A., Marchetti, P., Hirsh, T., Gomez-Monterrey, I., Castedo, M., and Kroemer,G., mitochondrial control of apoptosis, J. Exp. Med., 183, 1533, 1996.
67. Jurgensmeier, J.M., Xie, Z., Deveraux, Q., Ellerby, L., Bredesen, D., and Reed, J.C., Bax directlyinduces release of cytochrome c from isolated mitochondria, Proc. Natl. Acad. Sci. USA, 95, 4997,1998.
68. Narita, M., Shimizu, S., Ito, T., Chittenden, T., Lutz, R.J., Matsuda, H., and Tsujimoto, Y., Baxinteracts with the permeability transition pore to induce permeability transition and cytochromec release in isolated mitochondria, Proc. Natl. Acad. Sci. USA, 95, 14681, 1998.
69. Finucane, D.M., Bossy-Wetzel, E., Waterhouse, N.J., Cotter, T.G., and Green, D.R., Bax-inducedcaspase activation and apoptosis via cytochrome c release from mitochondria is inhibitable by Bcl-xL, J. Biol. Chem., 274, 2225, 1999.
70. Bryant, F.D., Latimer, P., and Seiber, B.A., Changes in total light scattering and absorption causedby changes in particle conformation — a test of theory, Arch. Biochem. Biophys., 135, 109, 1969.
71. Latimer, P. and Pyle, B.E., Light Scattering at Various Angles, Theoretical Predictions of the Effectsof Particle Volume Change, Biophy. J., 12, 764, 1972.
72. Knight, V.A., Wiggins, P.M., Harvey, J.D., and O’Brien, J.A., The relationship between the size ofmitochondria and the intensity of light that they scatter in different states, Biochim. Biophys. Acta,637, 146, 1981.
73. Mourant, J.R., Johnson, T.M., and Freyer, J.P., Characterizing mammalian cells and cell phantomsby polarized backscattering fiber-optic measurements, Appl. Opt., 40, 5114, 2001.
74. Valentine, M.T., Popp, A.K., Weitz, D.A., and Kaplan, P.D., Microscope-based static light-scatteringinstrument, Opt. Lett., 26, 890, 2001.
75. Schiffer, Z., Ashkenazy, Y., Tirosh, R., and Deutsch, M., Fourier analysis of light scattered byelongated scatterers, Appl. Opt., 38, 3626, 1999.
76. Shiffer, Z., Zurgil, N., Shafran, Y., and Deutsch, M., Analysis of laser scattering pattern as an earlymeasure of apoptosis, Biochem. Biophys. Res. Commn., 289, 1320, 2001.
77. Kovach, I.S. and Athanasiou, K.A., Small-angle HeNe laser light scatter and the compressivemodulus of articular cartilage, J. Orthopaed. Res., 15, 437, 1997.
78. Schmitt, J.M. and Kumar, G., Turbulent nature of refractive index variations in biological tissue,Opt. Lett., 21, 1310, 1996.
79. Wax, A., Yang, C., Backman, V., Badizadegan, K., Boone, C.W., Dasari, R.R., and Feld, M.S., Cellularorganization and substructure measured using angle-resolved low-coherence interferometry, Bio-phy. J., 82, 2256, 2002.
80. Aitken, P.G., Fayuk, D., Somjen, G.G., and Turner, D.A., Use of intrinsic optical signals to monitorphysiological changes in brain tissue slices, Methods: Companion Methods Enzymol., 18, 91, 1999.
81. Andrew, R.D., Lobinowich, M.E., and Osehobo, E.P., Evidence against volume regulation by corticalbrain cells during acute osmotic stress, Exp. Neurol., 143, 300, 1997.
82. Andrew, R.D., Adams, J.R., and Polischuk, T.M., Imaging NMDA- and kainate- induced intrinsicoptical signals from the hippocampla slice, J. Neurophys., 76, 2707, 1996.
83. Bahar, S., Fayuk, D., Somjen, G.G., Aitken, P.G., and Turner, D.A., Mitochondrial and intrinsicoptical signals imaged during hypoxia and spreading depression in rat hippocampal slices, J.Neurophys., 84, 311, 2000.
84. Rector, D.M., Poe, G.R., Kristensen, M.P., and Harper, R.M., Light scattering changes follow evokedpotentials from hippocampal schaeffer collateral stimulation, J. Neurophys., 78, 1707, 1997.
85. Johnson, L.J., Hanley, D.F., and Thakor, N.V., Optical light scatter imaging of cellular and subcel-lular morphology changes in stressed rat hippocampal slices, J. Neurosci. Methods, 98, 21,, 2000.
86. Andrew, R.D., Jarvis, C.R., and Obeidat, A.S., Potential sources of intrinsic optical signals imagedin live brain slices, Methods: Companion Methods Enzymol., 18, 185, 1999.
1116_frame_MASTER.book Page 23 Thursday, September 19, 2002 10:34 AM
16-24 Biomedical Photonics Handbook
87. Boustany, N.N., Kuo, S.C., and Thakor, N.V., Optical scatter imaging: subcellular morphometryin situ with Fourier filtering, Opt. Lett., 26, 1063, 2001.
88. Boustany, N.N., Drezek, R., and Thakor, N.V., Calcium-induced alterations in mitochondrialmorphology quantified in situ with Optical Scatter Imaging, Biophy. J., in press, 2002.
1116_frame_MASTER.book Page 24 Thursday, September 19, 2002 10:34 AM