emotional sphere physical sphere social sphere Intellectual sphere spiritual sphere.
T E C H N I C A L N O T E
UV/Vis/NIR Spectroscopy
Integrating Sphere Functionality: The Scatter Transmission Measurement
Introduction
The integrating sphere is a simple, yet often misunderstood spectrophotometer accessory for measuring optical radiation. The function of an integrating sphere is to spatially integrate radiant flux in scatter transmission and diffuse reflectance sample measurements. Before one can optimize a sphere design for a particular application, it is important to understand how the integrating sphere works. How light passes through the sphere begins with a discussion of
diffuse reflecting surfaces. From this, the radiance of the inner surface of an integrating sphere is derived and discussed.
This study will center on how sphere characteristics such as size, port ratio, and detector baffling influence scatter transmission measurements. Three different sphere types will be evaluated; the 60 mm, the 100 mm, and the 150 mm sphere.
Authors:Jeffrey L. Taylor, Ph.D.
PerkinElmer, Inc. Shelton, CT
2
Integrating Sphere Basics
Obviously, an integrating sphere’s design will affect its measurement accuracy. The reflectivity of the surface of the sphere as well as the size and location of ports, detectors, and baffles will all influence how the light bounces around inside the sphere. All of these parameters can influence the light integration ability of a sphere. As will be discussed in this section, large 150 mm diameter spheres have better light integration characteristics and their measurements are less likely to be affected by sample generated hot spots. The signal integration is not as good in smaller spheres, and the large port fraction typically found in smaller spheres can introduce significant errors in measurement due to flux loss.
All of these factors must be considered when choosing an integrating sphere accessory which is appropriate to the user’s application. We will consider in this paper the singular measurement mode of the scatter transmission from a sample.
Anatomy of a Scattering Sample
Figure 1 displays the general characteristics of a typical scattering transmission sample. Integrating sphere scatter transmission measurements are typically performed on samples that are hazy or turbid. In essence these are samples that are not your typical transparent liquid or solid. These types of samples tend to scatter light away from the straight-line path from the sample to the detector. Basically three events can happen when a spectrophotometer’s collimated beam of light interacts with a scattering sample in transmission mode. First, the light can be absorbed due to the chemistry or physical nature of the sample. This is depicted as the pink area within the sample in Figure 1. Secondly, light can be transmitted through the sample in a rather complex fashion. This scatter transmission is shown in blue and
consists of a 180 degree cone of forward scattered light that is related to the diffuse characteristics of the sample. Third, light can be diffusely reflected or backscattered in a 180 degree cone from the front surface and interior of the sample. This is depicted in red. While an integrating sphere is capable of measuring all of these interactions, we will be concerned with only the scatter transmission interaction in this investigation.
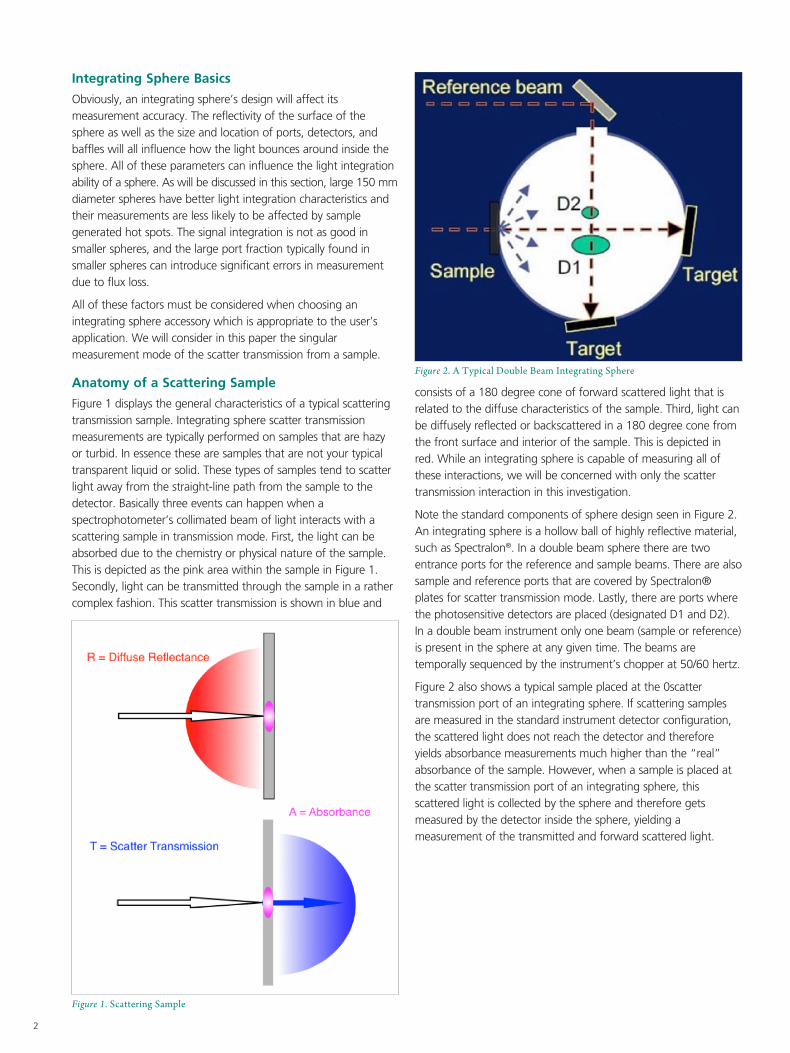
Note the standard components of sphere design seen in Figure 2. An integrating sphere is a hollow ball of highly reflective material, such as Spectralon®. In a double beam sphere there are two entrance ports for the reference and sample beams. There are also sample and reference ports that are covered by Spectralon® plates for scatter transmission mode. Lastly, there are ports where the photosensitive detectors are placed (designated D1 and D2). In a double beam instrument only one beam (sample or reference) is present in the sphere at any given time. The beams are temporally sequenced by the instrument’s chopper at 50/60 hertz.
Figure 2 also shows a typical sample placed at the 0scatter transmission port of an integrating sphere. If scattering samples are measured in the standard instrument detector configuration, the scattered light does not reach the detector and therefore yields absorbance measurements much higher than the “real” absorbance of the sample. However, when a sample is placed at the scatter transmission port of an integrating sphere, this scattered light is collected by the sphere and therefore gets measured by the detector inside the sphere, yielding a measurement of the transmitted and forward scattered light.
Figure 2. A Typical Double Beam Integrating Sphere
Figure 1. Scattering Sample
3
Sphere Radiant Flux and Spatial Integration Ability
The radiant energy flux of an integrating sphere is a measure of the sphere’s ability to “integrate” light onto the detector through multiple reflections within the sphere interior. The more reflections, the more uniform that distribution becomes. Deriving the radiance of an internally illuminated integrating sphere begins with an expression of the radiance in Equation 1.
Here Φ is radiant flux, P is the reflectance, A the illuminated area, f the port fraction, and pi the total projected solid angle from the surface. When more than two ports exist, f is calculated from the sum of all port areas, including light entry ports and detector ports. This equation is used to predict integrating sphere radiance for a given input flux as a function of sphere diameter, reflectance, and port fraction. Note that the radiance decreases as sphere diameter increases. Equation 1 is purposely divided into two parts. The first part is approximately equal to the flux of the radiance on a diffuse surface. The second part of the equation is a unitless quantity which can be referred to as the sphere multiplier. It accounts for the increase in radiance due to multiple reflections. A simplified intuitive approach to predicting a flux density inside the integrating sphere might be to simply divide the input flux by the total surface area of the sphere. However, the effect of the sphere multiplier is that the radiance of an integrating sphere is at least an order of magnitude greater than this simple intuitive approach. A handy rule of thumb is that for most real integrating spheres the sphere multiplier is in the range of 10 - 30 units with 0.94 < P < 0.99 and 0.02 < f < 0.05.
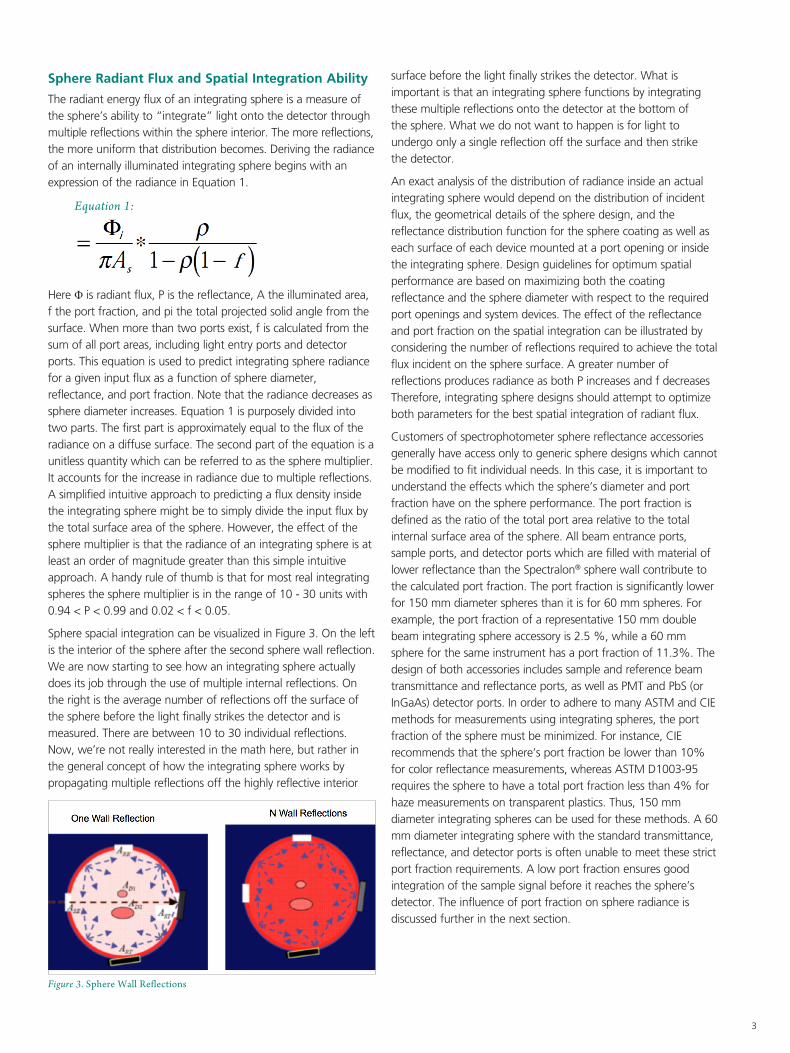
Sphere spacial integration can be visualized in Figure 3. On the left is the interior of the sphere after the second sphere wall reflection. We are now starting to see how an integrating sphere actually does its job through the use of multiple internal reflections. On the right is the average number of reflections off the surface of the sphere before the light finally strikes the detector and is measured. There are between 10 to 30 individual reflections. Now, we’re not really interested in the math here, but rather in the general concept of how the integrating sphere works by propagating multiple reflections off the highly reflective interior
surface before the light finally strikes the detector. What is important is that an integrating sphere functions by integrating these multiple reflections onto the detector at the bottom of the sphere. What we do not want to happen is for light to undergo only a single reflection off the surface and then strike the detector.
An exact analysis of the distribution of radiance inside an actual integrating sphere would depend on the distribution of incident flux, the geometrical details of the sphere design, and the reflectance distribution function for the sphere coating as well as each surface of each device mounted at a port opening or inside the integrating sphere. Design guidelines for optimum spatial performance are based on maximizing both the coating reflectance and the sphere diameter with respect to the required port openings and system devices. The effect of the reflectance and port fraction on the spatial integration can be illustrated by considering the number of reflections required to achieve the total flux incident on the sphere surface. A greater number of reflections produces radiance as both P increases and f decreases Therefore, integrating sphere designs should attempt to optimize both parameters for the best spatial integration of radiant flux.
Customers of spectrophotometer sphere reflectance accessories generally have access only to generic sphere designs which cannot be modified to fit individual needs. In this case, it is important to understand the effects which the sphere’s diameter and port fraction have on the sphere performance. The port fraction is defined as the ratio of the total port area relative to the total internal surface area of the sphere. All beam entrance ports, sample ports, and detector ports which are filled with material of lower reflectance than the Spectralon® sphere wall contribute to the calculated port fraction. The port fraction is significantly lower for 150 mm diameter spheres than it is for 60 mm spheres. For example, the port fraction of a representative 150 mm double beam integrating sphere accessory is 2.5 %, while a 60 mm sphere for the same instrument has a port fraction of 11.3%. The design of both accessories includes sample and reference beam transmittance and reflectance ports, as well as PMT and PbS (or InGaAs) detector ports. In order to adhere to many ASTM and CIE methods for measurements using integrating spheres, the port fraction of the sphere must be minimized. For instance, CIE recommends that the sphere’s port fraction be lower than 10% for color reflectance measurements, whereas ASTM D1003-95 requires the sphere to have a total port fraction less than 4% for haze measurements on transparent plastics. Thus, 150 mm diameter integrating spheres can be used for these methods. A 60 mm diameter integrating sphere with the standard transmittance, reflectance, and detector ports is often unable to meet these strict port fraction requirements. A low port fraction ensures good integration of the sample signal before it reaches the sphere’s detector. The influence of port fraction on sphere radiance is discussed further in the next section.
Equation 1:
Figure 3. Sphere Wall Reflections
4
Measurement Accuracy
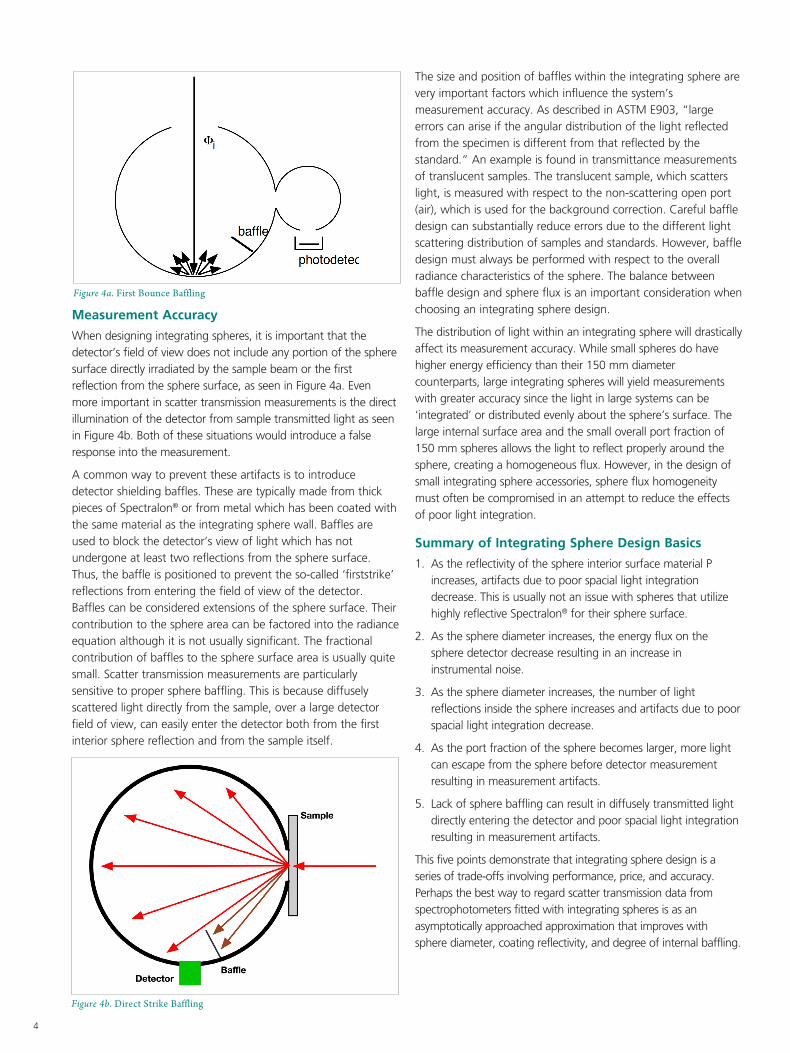
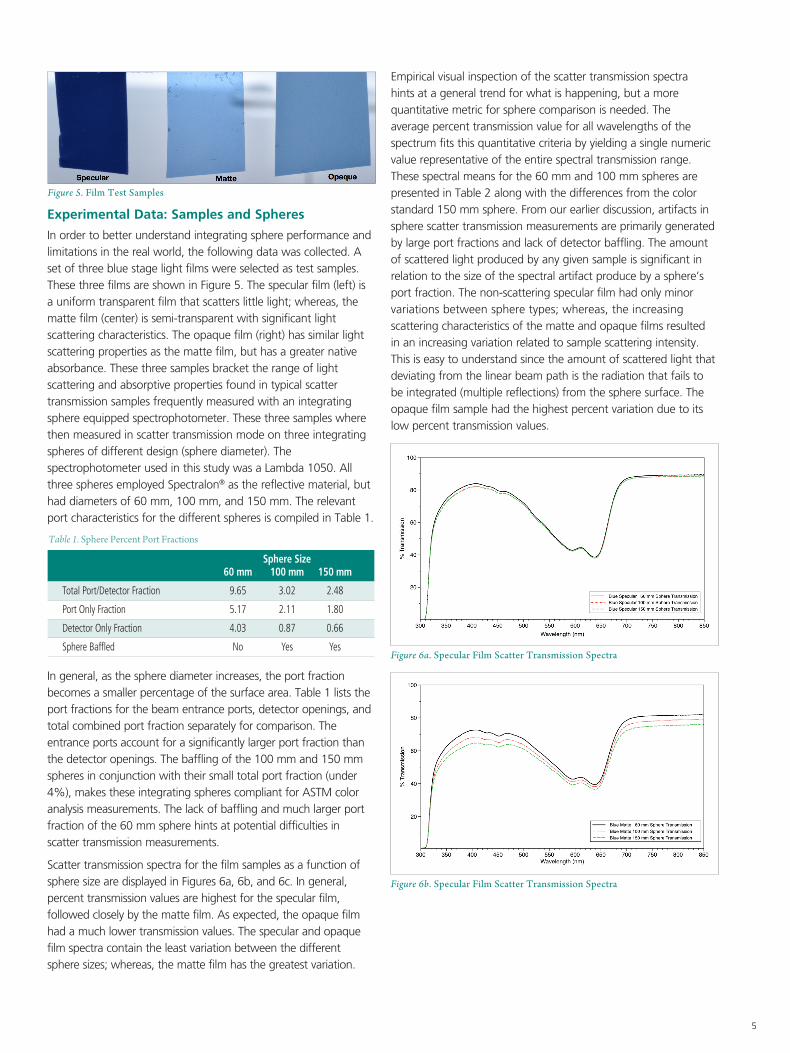
When designing integrating spheres, it is important that the detector’s field of view does not include any portion of the sphere surface directly irradiated by the sample beam or the first reflection from the sphere surface, as seen in Figure 4a. Even more important in scatter transmission measurements is the direct illumination of the detector from sample transmitted light as seen in Figure 4b. Both of these situations would introduce a false response into the measurement.
A common way to prevent these artifacts is to introduce detector shielding baffles. These are typically made from thick pieces of Spectralon® or from metal which has been coated with the same material as the integrating sphere wall. Baffles are used to block the detector’s view of light which has not undergone at least two reflections from the sphere surface. Thus, the baffle is positioned to prevent the so-called ‘firststrike’ reflections from entering the field of view of the detector. Baffles can be considered extensions of the sphere surface. Their contribution to the sphere area can be factored into the radiance equation although it is not usually significant. The fractional contribution of baffles to the sphere surface area is usually quite small. Scatter transmission measurements are particularly sensitive to proper sphere baffling. This is because diffusely scattered light directly from the sample, over a large detector field of view, can easily enter the detector both from the first interior sphere reflection and from the sample itself.
The size and position of baffles within the integrating sphere are very important factors which influence the system’s measurement accuracy. As described in ASTM E903, “large errors can arise if the angular distribution of the light reflected from the specimen is different from that reflected by the standard.” An example is found in transmittance measurements of translucent samples. The translucent sample, which scatters light, is measured with respect to the non-scattering open port (air), which is used for the background correction. Careful baffle design can substantially reduce errors due to the different light scattering distribution of samples and standards. However, baffle design must always be performed with respect to the overall radiance characteristics of the sphere. The balance between baffle design and sphere flux is an important consideration when choosing an integrating sphere design.
The distribution of light within an integrating sphere will drastically affect its measurement accuracy. While small spheres do have higher energy efficiency than their 150 mm diameter counterparts, large integrating spheres will yield measurements with greater accuracy since the light in large systems can be ‘integrated’ or distributed evenly about the sphere’s surface. The large internal surface area and the small overall port fraction of 150 mm spheres allows the light to reflect properly around the sphere, creating a homogeneous flux. However, in the design of small integrating sphere accessories, sphere flux homogeneity must often be compromised in an attempt to reduce the effects of poor light integration.
Summary of Integrating Sphere Design Basics
1. As the reflectivity of the sphere interior surface material P increases, artifacts due to poor spacial light integration decrease. This is usually not an issue with spheres that utilize highly reflective Spectralon® for their sphere surface.
2. As the sphere diameter increases, the energy flux on the sphere detector decrease resulting in an increase in instrumental noise.
3. As the sphere diameter increases, the number of light reflections inside the sphere increases and artifacts due to poor spacial light integration decrease.
4. As the port fraction of the sphere becomes larger, more light can escape from the sphere before detector measurement resulting in measurement artifacts.
5. Lack of sphere baffling can result in diffusely transmitted light directly entering the detector and poor spacial light integration resulting in measurement artifacts.
This five points demonstrate that integrating sphere design is a series of trade-offs involving performance, price, and accuracy. Perhaps the best way to regard scatter transmission data from spectrophotometers fitted with integrating spheres is as an asymptotically approached approximation that improves with sphere diameter, coating reflectivity, and degree of internal baffling.
Figure 4a. First Bounce Baffling
Figure 4b. Direct Strike Baffling
5
In general, as the sphere diameter increases, the port fraction becomes a smaller percentage of the surface area. Table 1 lists the port fractions for the beam entrance ports, detector openings, and total combined port fraction separately for comparison. The entrance ports account for a significantly larger port fraction than the detector openings. The baffling of the 100 mm and 150 mm spheres in conjunction with their small total port fraction (under 4%), makes these integrating spheres compliant for ASTM color analysis measurements. The lack of baffling and much larger port fraction of the 60 mm sphere hints at potential difficulties in scatter transmission measurements.
Scatter transmission spectra for the film samples as a function of sphere size are displayed in Figures 6a, 6b, and 6c. In general, percent transmission values are highest for the specular film, followed closely by the matte film. As expected, the opaque film had a much lower transmission values. The specular and opaque film spectra contain the least variation between the different sphere sizes; whereas, the matte film has the greatest variation.
Empirical visual inspection of the scatter transmission spectra hints at a general trend for what is happening, but a more quantitative metric for sphere comparison is needed. The average percent transmission value for all wavelengths of the spectrum fits this quantitative criteria by yielding a single numeric value representative of the entire spectral transmission range. These spectral means for the 60 mm and 100 mm spheres are presented in Table 2 along with the differences from the color standard 150 mm sphere. From our earlier discussion, artifacts in sphere scatter transmission measurements are primarily generated by large port fractions and lack of detector baffling. The amount of scattered light produced by any given sample is significant in relation to the size of the spectral artifact produce by a sphere’s port fraction. The non-scattering specular film had only minor variations between sphere types; whereas, the increasing scattering characteristics of the matte and opaque films resulted in an increasing variation related to sample scattering intensity. This is easy to understand since the amount of scattered light that deviating from the linear beam path is the radiation that fails to be integrated (multiple reflections) from the sphere surface. The opaque film sample had the highest percent variation due to its low percent transmission values.
Sphere Size 60 mm 100 mm 150 mm
Total Port/Detector Fraction 9.65 3.02 2.48
Port Only Fraction 5.17 2.11 1.80
Detector Only Fraction 4.03 0.87 0.66
Sphere Baffled No Yes Yes
Table 1. Sphere Percent Port Fractions
Figure 5. Film Test Samples
Figure 6a. Specular Film Scatter Transmission Spectra
Experimental Data: Samples and Spheres
In order to better understand integrating sphere performance and limitations in the real world, the following data was collected. A set of three blue stage light films were selected as test samples. These three films are shown in Figure 5. The specular film (left) is a uniform transparent film that scatters little light; whereas, the matte film (center) is semi-transparent with significant light scattering characteristics. The opaque film (right) has similar light scattering properties as the matte film, but has a greater native absorbance. These three samples bracket the range of light scattering and absorptive properties found in typical scatter transmission samples frequently measured with an integrating sphere equipped spectrophotometer. These three samples where then measured in scatter transmission mode on three integrating spheres of different design (sphere diameter). The spectrophotometer used in this study was a Lambda 1050. All three spheres employed Spectralon® as the reflective material, but had diameters of 60 mm, 100 mm, and 150 mm. The relevant port characteristics for the different spheres is compiled in Table 1.
Figure 6b. Specular Film Scatter Transmission Spectra
For a complete listing of our global offices, visit www.perkinelmer.com/ContactUs
Copyright ©2013, PerkinElmer, Inc. All rights reserved. PerkinElmer® is a registered trademark of PerkinElmer, Inc. All other trademarks are the property of their respective owners. 011486_01
PerkinElmer, Inc. 940 Winter Street Waltham, MA 02451 USA P: (800) 762-4000 or (+1) 203-925-4602www.perkinelmer.com
Figure 6c. Specular Film Scatter Transmission Spectra
Figure 7. Port Fraction versus Mean Scatter Transmission Values
A natural question to ask at this point is, "Does the port fraction correlate to the mean percent transmission value?" Figure 7 graphs this relationship and states linear correlation values for the three sample types. While all three samples displayed an increasing mean trans- mission trend, only the specular sample showed highly correlated values.
Any scatter transmission measurement obtained on an integrating sphere is an approximation and should never be considered an absolute measurement. All spheres must have entrance ports and detectors; therefore, a sphere port fraction of zero is impossible. A well de- signed integrating sphere will reduce the port fraction down to an acceptable value of less than 4%, but port fractions less than 2% are rare. Both the PerkinElmer 100 mm and 150 mm integrating spheres are compliant with this criteria and generate acceptable data. Small unbaffled spheres like the 60 mm sphere are a low cost alternative for diffuse reflectance measurements, but care should be exercised in understanding their limitations for particular scatter transmission applications.
The spectral artifact due to high port fraction and lack of baffling results in a higher than expected percent transmission measurement. One very common sphere scatter transmission measurement is the UV transmission of pharmaceutical vials and bottles. Here a inaccurate high transmission value can cause a false negative type error and the rejection of good product. The common industry trend is to use inexpensive, small, unbaffled spheres for this type of quality control application. This can result in a multiplicity of values for the same product measured on different sphere designs. A possible solution to this hardware problem is to perform “round-rob- in” calibration studies on a selected “representative” samples. Since, as we have seen in this paper, these artifacts relate to the scattering properties of the sample; therefore these calibration can become exhaustive and detailed.
For scatter transmission measurements, the integrating sphere should be selected to match the application.
Average %T (300 nm - 850 nm) 60 mm - 150 mm Difference % Difference 60 nm 100 mm 150 mm 60 mm 100 mm 150 mm 60 mm 100 mm 150 mm
Blue Opaque Film 7.53 6.66 6.11 1.42 0.55 0.00 18.88 8.26 0.00
Blue Matte Film 63.79 60.84 58.23 5.55 2.62 0.00 8.71 4.30 0.00
Blue Specular Film 70.149 69.17 69.13 1.06 0.04 0.00 1.51 0.06 0.00
Table 2. Mean Scatter Transmission Values