Liberty Group Limited International Presentation October 2002.
39
-
Upload
alice-floyd -
Category
Documents
-
view
223 -
download
1
Transcript of Liberty Group Limited International Presentation October 2002.

Liberty Group LimitedInternational Presentation
October 2002
ContentsContents
• Market positioning• What makes Liberty different?• Standard Bank relationship• Bancassurance• Capital management• Corporate governance• Black Economic Empowerment• HIV/AIDS• Sources of future growth
• Additional information
• Market positioning• What makes Liberty different?• Standard Bank relationship• Bancassurance• Capital management• Corporate governance• Black Economic Empowerment• HIV/AIDS• Sources of future growth
• Additional information

Corp/Commercial
HNW
Mass affluent
Middle
Mass market
STANLIB•Asset Management•Unit Trusts
Liberty Corporate Benefits
Liberty Personal BenefitsSBFC/IFAs/Agency/Franchise
Liberty Corporate BenefitsCharter LifeBancassurance
Market positioningMarket positioning
What makes Liberty different?What makes Liberty different?
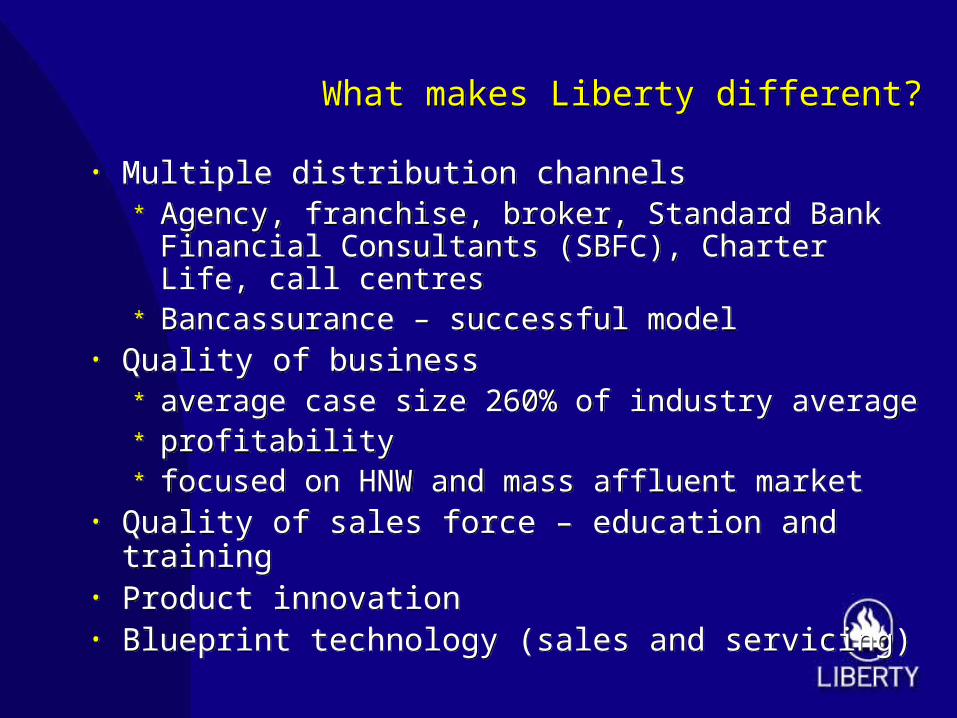
• Multiple distribution channels* Agency, franchise, broker, Standard Bank
Financial Consultants (SBFC), Charter Life, call centres
* Bancassurance – successful model• Quality of business
* average case size 260% of industry average* profitability* focused on HNW and mass affluent market
• Quality of sales force – education and training• Product innovation• Blueprint technology (sales and servicing)

What makes Liberty different?What makes Liberty different?
• Current superior relative investment performance* STANLIB* Liberty Ermitage
• Focused business units• Preferred employer status• Top team incentivisation• Capital strength• High ROE – greater than 20%• Insurance cash flow
• Current superior relative investment performance* STANLIB* Liberty Ermitage
• Focused business units• Preferred employer status• Top team incentivisation• Capital strength• High ROE – greater than 20%• Insurance cash flow

Standard Bank – the ideal bancassurance partnerStandard Bank – the ideal bancassurance partner
35% of South Africa’s bankingStrongest financial services brand
Penetration by Liberty/Charter ± 20%
35% of South Africa’s bankingStrongest financial services brand
Penetration by Liberty/Charter ± 20%
Affluent35 000 customers
Middle1m customers
Mass market3m customers
Corp/Commercial15 000 businesses
Small/Medium250 000 businesses
R3 300 p.m.
R33 000 p.m.

Standard Bank relationshipStandard Bank relationship
• Developments during the year* Improved and extended bancassurance
agreement - to 2012
* Bancassurance distribution now managed by Liberty – sales up 18%
* Creation of STANLIB by merging asset management, mutual fund and linked product operations
• Liberty achieving increased share of growing market
• No anticipated change to shareholding structure

Advantages• Creates scale and economies –
* assets under management R135 billion* largest mutual fund in South Africa
• Leverages off all distribution channels• Pools intellectual capital• Creates ability to design products using banking and
insurance licenses
Advantages• Creates scale and economies –
* assets under management R135 billion* largest mutual fund in South Africa
• Leverages off all distribution channels• Pools intellectual capital• Creates ability to design products using banking and
insurance licenses
Major benefits without the risks of a full bank on insurer merger

Dedicated investment marketing for:• STANLIB Asset Management – in-house active
management• Simeka – empowerment quants asset manager• STANLIB – multi-manager• Liberty Ermitage – international hedge fund and long
equities• Third party funds
Dedicated investment marketing for:• STANLIB Asset Management – in-house active
management• Simeka – empowerment quants asset manager• STANLIB – multi-manager• Liberty Ermitage – international hedge fund and long
equities• Third party funds
Full asset management offering availablethrough STANLIB
Capital managementCapital management
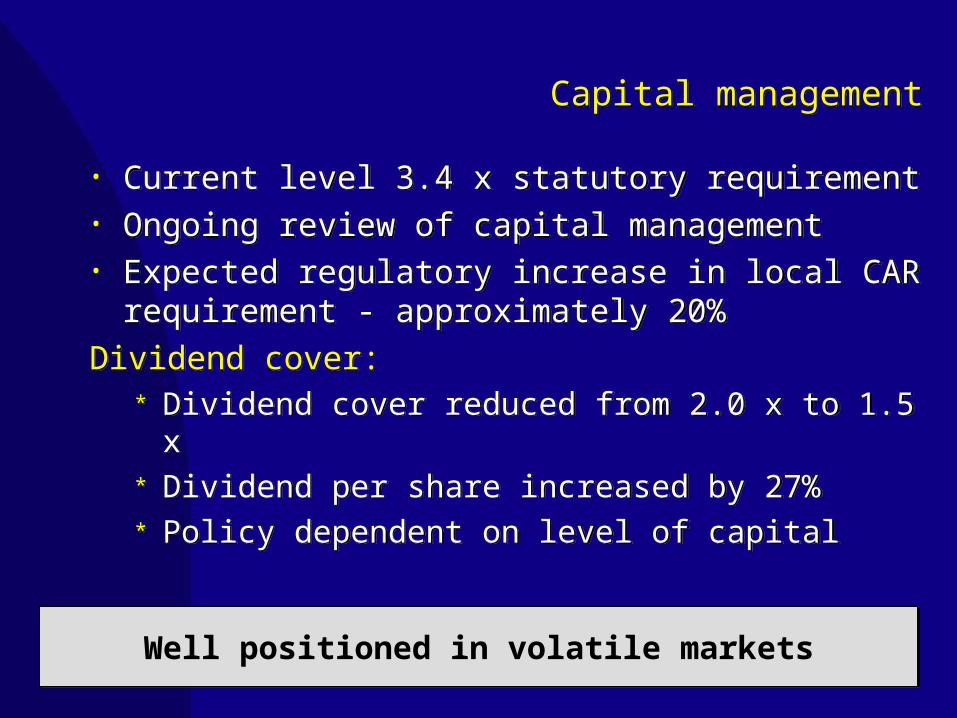
• Current level 3.4 x statutory requirement• Ongoing review of capital management• Expected regulatory increase in local CAR
requirement - approximately 20%Dividend cover:
* Dividend cover reduced from 2.0 x to 1.5 x* Dividend per share increased by 27%* Policy dependent on level of capital
• Current level 3.4 x statutory requirement• Ongoing review of capital management• Expected regulatory increase in local CAR
requirement - approximately 20%Dividend cover:
* Dividend cover reduced from 2.0 x to 1.5 x* Dividend per share increased by 27%* Policy dependent on level of capital
Well positioned in volatile markets

CAR cover multiple(Capital and reserves divided
by statutory CAR)
CAR cover multiple(Capital and reserves divided
by statutory CAR)
14.4
10.6
6.25.6
3.8 3.43.5
7.38.9
0
2
4
6
8
10
12
14
16
Jun 98
Dec 98
Jun 99
Dec 99
Jun 00
Dec 00
Jun 01
Dec 01
Jun 02

Total net cash inflow from insurance operations
Total net cash inflow from insurance operations
Rm
-1 000
0
1 000
2 000
3 000
4 000
1998 1999 2000 2001 2002
June December Linear (June)

Value extracted for shareholdersValue extracted for shareholders
Shareholders’ interests distributed:1999
* Liberty International PLC* Standard Bank
April 2001* Capital reduction R10.50 per share
August 2002* Dividend cover reduced from 2.0 to 1.5
Shareholders’ interests distributed:1999
* Liberty International PLC* Standard Bank
April 2001* Capital reduction R10.50 per share
August 2002* Dividend cover reduced from 2.0 to 1.5
Total assets and capital distributed R17.0 billion

Corporate governanceCorporate governance
• Committed to King II Code• High ratings for corporate governance• South Africa follows International Accounting
Standards• Appropriate number of independent
non-executive directors• Strong audit and remuneration committees• Share options - 3.5% of shares outstanding
• Committed to King II Code• High ratings for corporate governance• South Africa follows International Accounting
Standards• Appropriate number of independent
non-executive directors• Strong audit and remuneration committees• Share options - 3.5% of shares outstanding
Embedded value calculations audited by PwC

Black Economic EmpowermentBlack Economic Empowerment
• Engaging government on Financial Services Charter – co-operative not confrontational
• Government recognises need for sound business principles
• Empowerment partnerships* Asset management – Simeka* Corporate Benefits - being developed
• Employment equity targets achievable• Affirmative procurement in place

HIV/AIDSLiberty’s positioning
HIV/AIDSLiberty’s positioning
• Most new business investment only• High value policies in upper income market –
reduced exposure• HIV screening on policies greater than
R100 000 sum assured• Ongoing repricing in Corporate Benefits
markets• Rates reviewable• Minimal effect on mortality experienced• Industry initiative to cover lower end of market
(mortgage cover)
Risks well managed
Sources of future growthSources of future growth
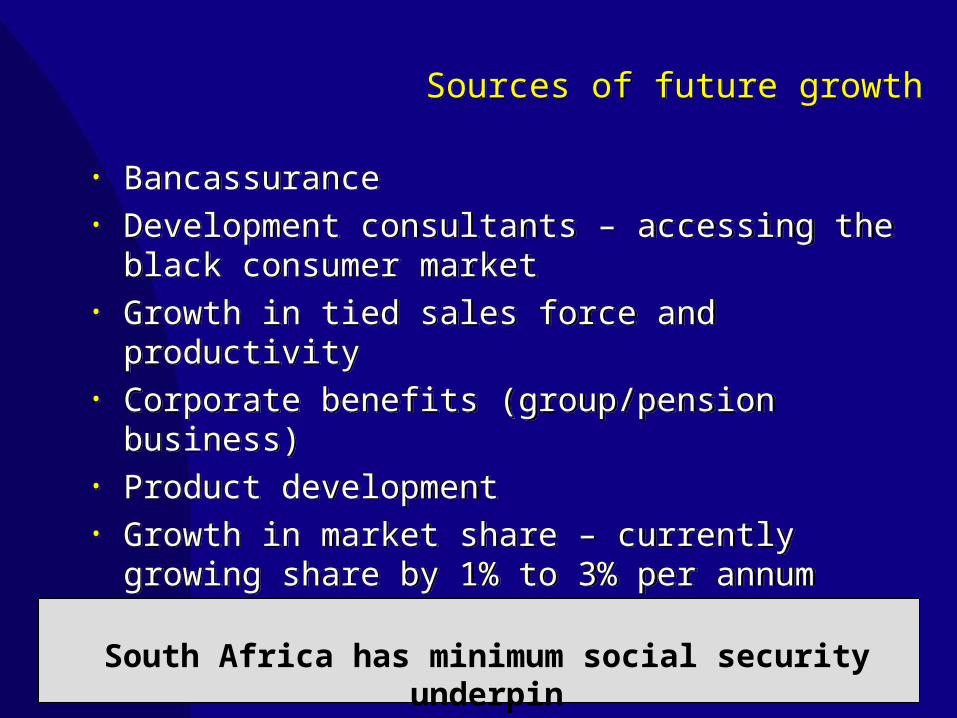
• Bancassurance• Development consultants – accessing the
black consumer market• Growth in tied sales force and productivity• Corporate benefits (group/pension business)• Product development• Growth in market share – currently growing
share by 1% to 3% per annum
• Bancassurance• Development consultants – accessing the
black consumer market• Growth in tied sales force and productivity• Corporate benefits (group/pension business)• Product development• Growth in market share – currently growing
share by 1% to 3% per annum
South Africa has minimum social security underpin

Growing bancassurance productionGrowing bancassurance production
680757
1 155
1 556
1 244
0
300
600
900
1 200
1 500
1 800
1997 1998 1999 2000 2001 Jun-02
Rm
Bancassurance business up 81% at 30 June 2002
1 661
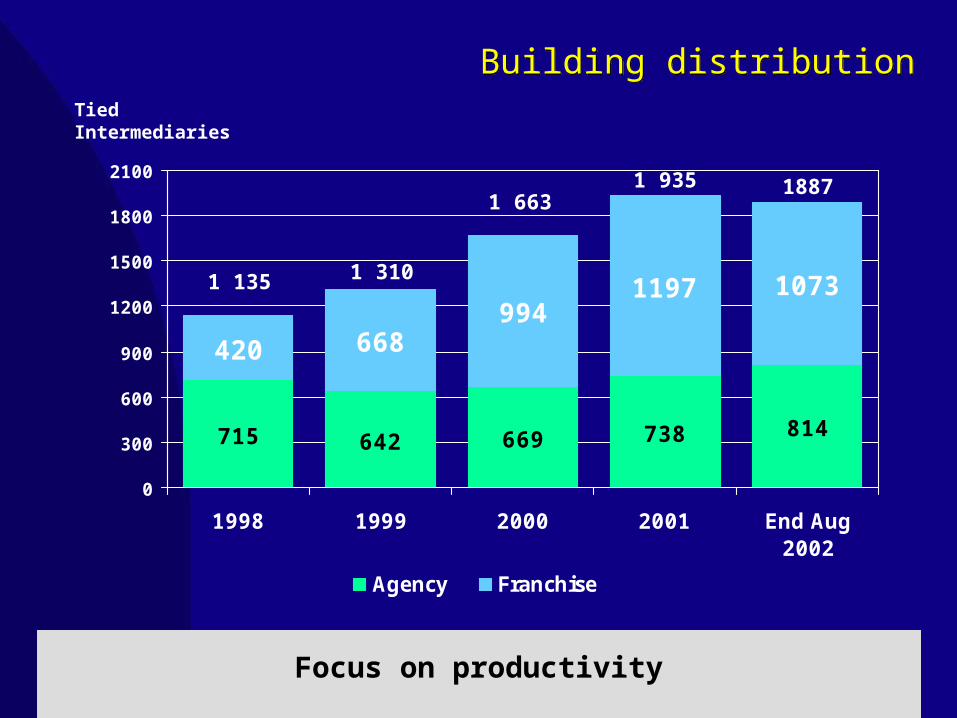
715 642 669 738 814
420 668994
1197 1073
0
300
600
900
1200
1500
1800
2100
1998 1999 2000 2001 End Aug2002
Agency Franchise
1 135 1 310
1 6631 935
Building distributionBuilding distributionTiedIntermediaries
1887
Focus on productivity

Growth in black adult consumer market
(Financial services products purchased)
Growth in black adult consumer market
(Financial services products purchased)
0
50
100
150
200
250
Whole life Endow RA Funeral Medicalinsurance
Short term
Other
19982002
People000s
Based on a sample of 29.5 million black adults with personal income of R5 000+ (Liberty’s target market)
Source AMPS 1998 and 2002

The Liberty storyThe Liberty story
• Strongest diversified distribution• New business growth 16% per annum for
past five years
• Successful bancassurance model• Well capitalised – high ROE• Strong governance• Proven track record of achieving objectives• Historic dividend yield 7% - trading at
close to embedded value
• Strongest diversified distribution• New business growth 16% per annum for
past five years
• Successful bancassurance model• Well capitalised – high ROE• Strong governance• Proven track record of achieving objectives• Historic dividend yield 7% - trading at
close to embedded value

Additional information

Group structureGroup structure
Financial Services Operations STANLI B L im ited (50% )
Liberty Group L im ited
Liberty H oldings L im ited (54 .7% )
Standard Bank G roup L im ited (54.7% )
Financial Services Operations STANLI B L im ited (50% )
Liberty Group L im ited
Liberty H oldings L im ited (54 .7% )
Standard Bank G roup L im ited (54.7% )
Subsidiaries- Charter Life (100%)- Liberty Group Properties (100%)- Liberty Healthcare (100%)- Electric Liberty (100%)- Liberty Ermitage (100%)
Joint Ventures- Astute Financial Services Exchange (33%)-Simeka Financial Services (18%)-Medscheme

Financial highlightssix months to 30 June 2002
Financial highlightssix months to 30 June 2002
• Indexed new business• New business margin• Bancassurance new business• Headline earnings per share• Net cash inflow from insurance
operations: R1.6 billion• Embedded value per share:
R56.68• Dividend cover amended:
reduced from 2.0 x to 1.5 x• Dividend per share of 162 cents
• Indexed new business• New business margin• Bancassurance new business• Headline earnings per share• Net cash inflow from insurance
operations: R1.6 billion• Embedded value per share:
R56.68• Dividend cover amended:
reduced from 2.0 x to 1.5 x• Dividend per share of 162 cents
+22%18%
+81%-5%
+60%+5%
+27%
+22%18%
+81%-5%
+60%+5%
+27%
Significant gain in market share

Headline earnings –continuing operations
Headline earnings –continuing operations
Life fund operating surplus
Revenue earnings – shareholders’ funds
STC on ordinary dividends
Preference dividend
Headline earnings
Headline EPS (cents)
Dividend per share (cents)
Life fund operating surplus
Revenue earnings – shareholders’ funds
STC on ordinary dividends
Preference dividend
Headline earnings
Headline EPS (cents)
Dividend per share (cents)
563
171
(44
(28
662
242.5
162
563
171
(44
(28
662
242.5
162
)
)
)
)
594
120
(20
694
255.7
128
594
120
(20
694
255.7
128
)
)
(5
42
41
(5
(5
27
(5
42
41
(5
(5
27
)
)
)
)
)
)
30 June2002Rm
30 June2002Rm
30 June2001Rm
30 June2001Rm
Change
%
Change
%

Life fund earningsLife fund earnings
Reduced by 5.1% from R594 million to R563 million Geared to investment returns earned for policyholders’
portfolios
Reduced by 5.1% from R594 million to R563 million Geared to investment returns earned for policyholders’
portfolios
Significant reduction in this component of life fund earnings
Offset by benefits from expense management
Significant reduction in this component of life fund earnings
Offset by benefits from expense management
Portfolio weighted average
Mainly due to:Offshore portfolio
Portfolio weighted average
Mainly due to:Offshore portfolio
(0.4
(16.2
(0.4
(16.2
)
)
)
)
10.2
0.8
10.2
0.8
30 June2002
%
30 June2002
%
30 June 2001
%
30 June 2001
%
Local equity and bond portfolios outperformed benchmarks
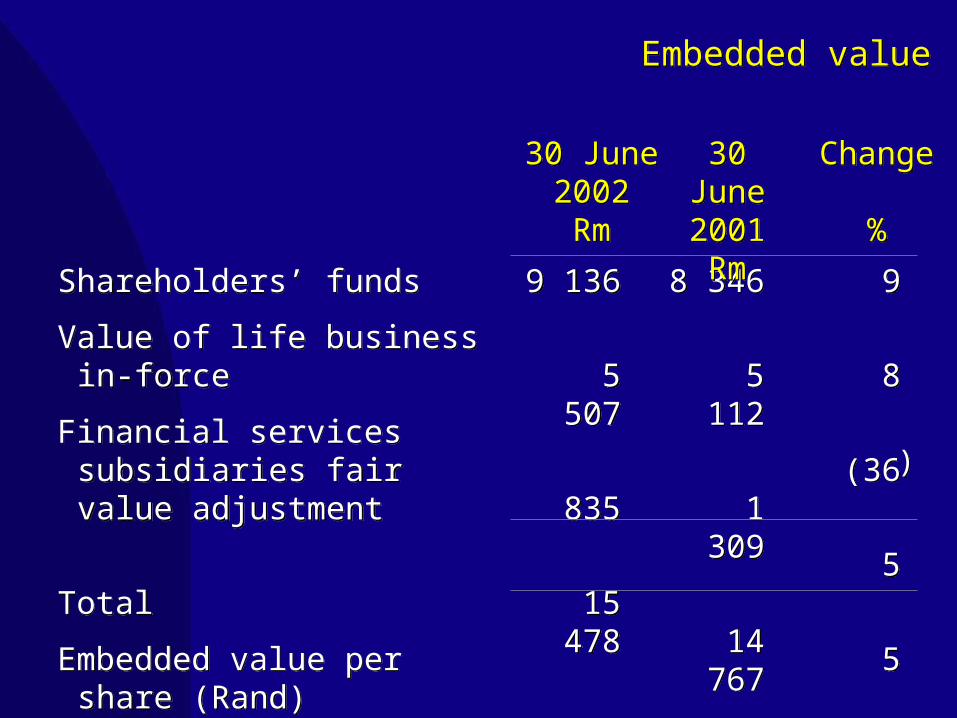
Embedded valueEmbedded value
Shareholders’ funds
Value of life businessin-force
Financial services subsidiaries fair value adjustment
Total
Embedded value per share (Rand)
Shareholders’ funds
Value of life businessin-force
Financial services subsidiaries fair value adjustment
Total
Embedded value per share (Rand)
9 136
5 507
835
15 478
56.68
9 136
5 507
835
15 478
56.68
8 346
5 112
1 309
14 767
54.21
8 346
5 112
1 309
14 767
54.21
9
8
(36
5
5
9
8
(36
5
5
)
)
30 June2002Rm
30 June2002Rm
30 June2001Rm
30 June2001Rm
Change
%
Change
%

Key issues for second half 2002Key issues for second half 2002
• Profitability will be influenced by investment market performance
• Higher Secondary Tax on Companies on higher dividend – R42 million (total for 2002 - R82 million, 2001 - R32 million)
• Merger costs – STANLIB – R44 million
• Profitability will be influenced by investment market performance
• Higher Secondary Tax on Companies on higher dividend – R42 million (total for 2002 - R82 million, 2001 - R32 million)
• Merger costs – STANLIB – R44 million

Market shareMarket share
New recurring individualBrokersAgents
Individual single premiumsBrokersAgents
New recurring individualBrokersAgents
Individual single premiumsBrokersAgents
17.8616.9618.94
14.7613.2514.95
17.8616.9618.94
14.7613.2514.95
18.5619.1017.93
17.0116.4317.87
18.5619.1017.93
17.0116.4317.87
Full yearsFull years1st Quarter
2002%
1st Quarter
2002% 15.72
14.1117.68
11.499.46
17.00
15.7214.1117.68
11.499.46
17.00
2001% %
2000

Average recurring premiumsAverage recurring premiums
Liberty average premiums
Industry average
Liberty % average
Liberty average premiums
Industry average
Liberty % average
6 086
2 519
242
6 086
2 519
242
6 626
2 465
269
6 626
2 465
269
Full year2001
Full year2001
1st Quarter
2002
1st Quarter
2002
8.9
(2.1
8.9
(2.1
Change%
Change%
)
)
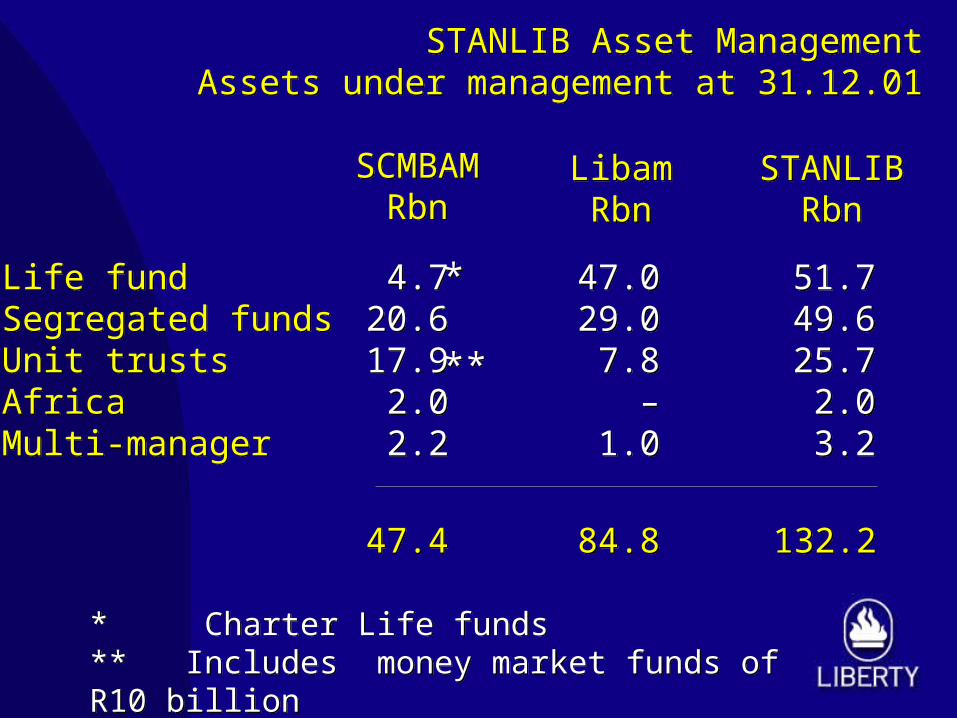
STANLIB Asset ManagementAssets under management at 31.12.01
STANLIB Asset ManagementAssets under management at 31.12.01
SCMBAMRbn
SCMBAMRbn
LibamRbn
LibamRbn
STANLIBRbn
STANLIBRbn
Life fundSegregated fundsUnit trustsAfricaMulti-manager
Life fundSegregated fundsUnit trustsAfricaMulti-manager
* Charter Life funds** Includes money market funds of R10 billion
* Charter Life funds** Includes money market funds of R10 billion
4.720.617.9
2.02.2
4.720.617.9
2.02.2
*
**
*
**
47.029.0
7.8–
1.0
47.029.0
7.8–
1.0
51.749.625.7
2.03.2
51.749.625.7
2.03.2
47.447.4 84.884.8 132.2132.2

International strategyInternational strategy
• Grow Liberty Ermitage distribution• Follow Stanbank into emerging markets• Build distribution in Europe
• Grow Liberty Ermitage distribution• Follow Stanbank into emerging markets• Build distribution in Europe

Liberty ErmitageLiberty Ermitage
• Assets under management increased from US$2 152 million to US$2 258 million at 30 June
• Investment marketing sales force now in place
• Strong support from Standard Bank and STANLIB
• Alternative asset management strategy• Focusing primarily on wholesale market
• Assets under management increased from US$2 152 million to US$2 258 million at 30 June
• Investment marketing sales force now in place
• Strong support from Standard Bank and STANLIB
• Alternative asset management strategy• Focusing primarily on wholesale market

Liberty ErmitageLiberty Ermitage
• Hedge funds standing up well to turmoil in world markets as at 30 June:
* Alpha –0.03% in US dollars
* Asset Selection +0.94% in US dollars
• Hedge funds standing up well to turmoil in world markets as at 30 June:
* Alpha –0.03% in US dollars
* Asset Selection +0.94% in US dollars
Three out of four equity funds achieved Micropal4-Star ratings placing them in the top 30% of their
categories in the world over three years

ScorecardScorecard
Goals set for 20021. Launch and grow STANLIB2. Develop SBFC and
bancassurance sales3. Reposition Charter Life in
mass and niche markets4. Focus on profitability of
Liberty Corporate Benefits
Goals set for 20021. Launch and grow STANLIB2. Develop SBFC and
bancassurance sales3. Reposition Charter Life in
mass and niche markets4. Focus on profitability of
Liberty Corporate Benefits
½½
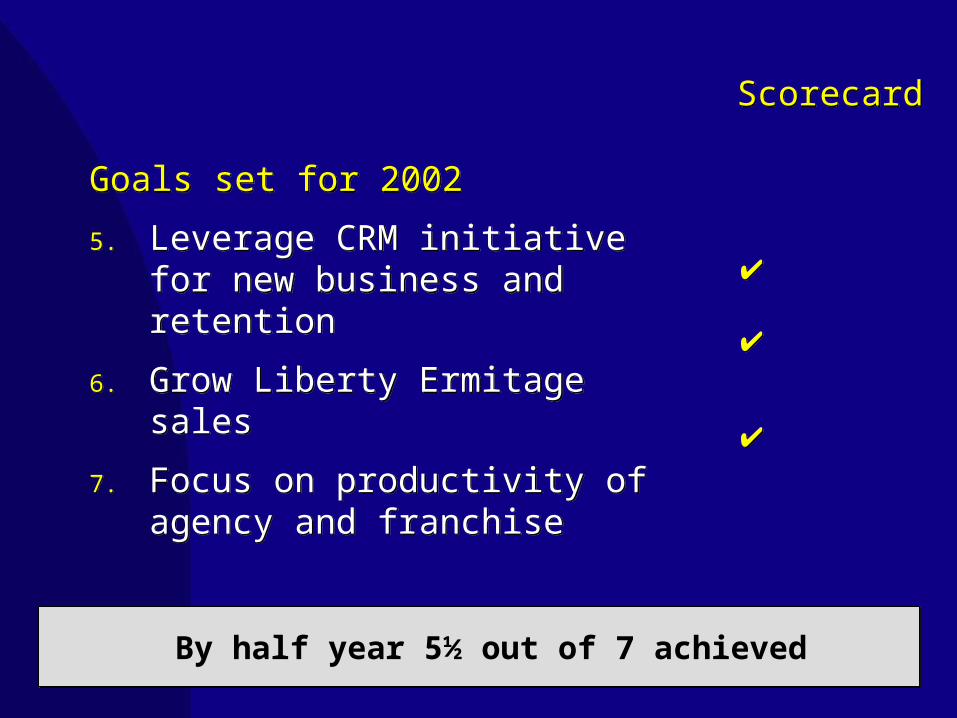
ScorecardScorecard
Goals set for 2002
5. Leverage CRM initiative for new business and retention
6. Grow Liberty Ermitage sales
7. Focus on productivity of agency and franchise
Goals set for 2002
5. Leverage CRM initiative for new business and retention
6. Grow Liberty Ermitage sales
7. Focus on productivity of agency and franchise
By half year 5½ out of 7 achieved