Liberty Group Limited Interim Results Presentation 6 August 2003 Liberty. Lighting your way to...
41
-
Upload
lionel-horn -
Category
Documents
-
view
217 -
download
0
Transcript of Liberty Group Limited Interim Results Presentation 6 August 2003 Liberty. Lighting your way to...


Liberty Group LimitedInterim Results Presentation
6 August 2003
www.liberty.co.za
Liberty. Lighting your way to financial prosperity.

A challenging six months at LibertyA challenging six months at Liberty
Some changes in senior management
Restructure of business operations
Accounting and regulatory issues
Market update issued in May
Growth in market share and positive cash flow
Some changes in senior management
Restructure of business operations
Accounting and regulatory issues
Market update issued in May
Growth in market share and positive cash flow
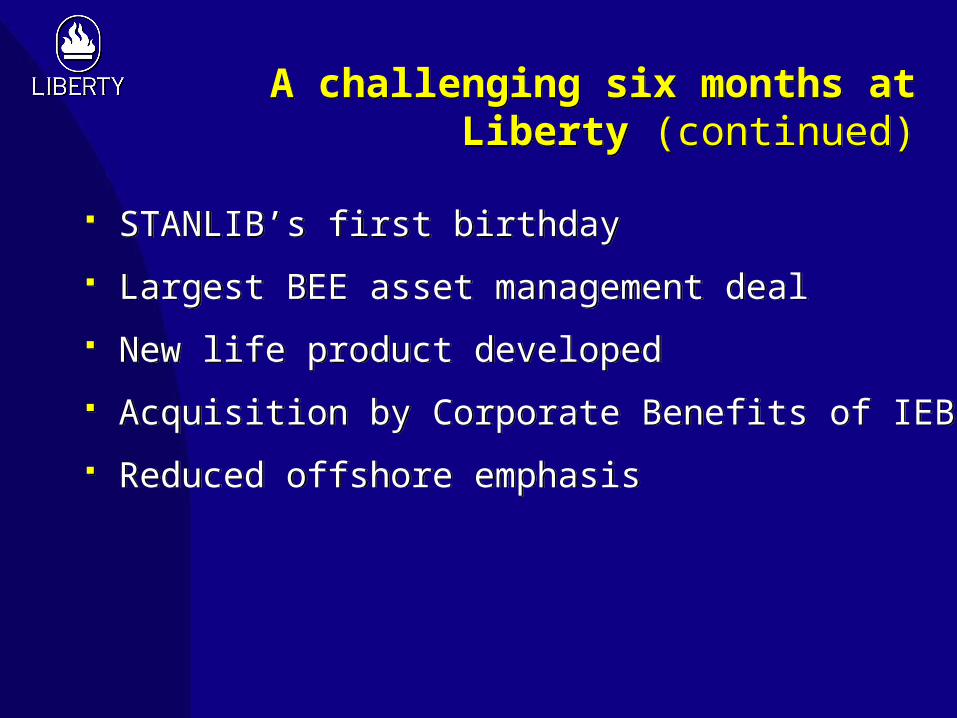
A challenging six months at Liberty (continued)
A challenging six months at Liberty (continued)
STANLIB’s first birthday
Largest BEE asset management deal
New life product developed
Acquisition by Corporate Benefits of IEB
Reduced offshore emphasis
STANLIB’s first birthday
Largest BEE asset management deal
New life product developed
Acquisition by Corporate Benefits of IEB
Reduced offshore emphasis

Some changes in senior management
Some changes in senior management
New Chief Executive Officer
Deon de Klerk (6 years’ service) replaces Mark Bloom
Andrew Lonmon-Davis (16 years’ service) becomes Chief Actuary
Mike Jackson moves on
146 years’ service on Exco
New Chief Executive Officer
Deon de Klerk (6 years’ service) replaces Mark Bloom
Andrew Lonmon-Davis (16 years’ service) becomes Chief Actuary
Mike Jackson moves on
146 years’ service on Exco

Restructure of business operationsRestructure of business operations
Executive Committees integrated
• Insurance Operations Committee and Investment Operations Committee= Group Executive Committee
• Executive Management Committee = Executive Communications Forum
Executive Committees integrated
• Insurance Operations Committee and Investment Operations Committee= Group Executive Committee
• Executive Management Committee = Executive Communications Forum

Restructure of business operations(continued)
Restructure of business operations(continued)
Subsidiary board meetings streamlined
Healthcare incorporated into Personal
Benefits
STANLIB restructure – phase 2
Subsidiary board meetings streamlined
Healthcare incorporated into Personal
Benefits
STANLIB restructure – phase 2
Duplication removed
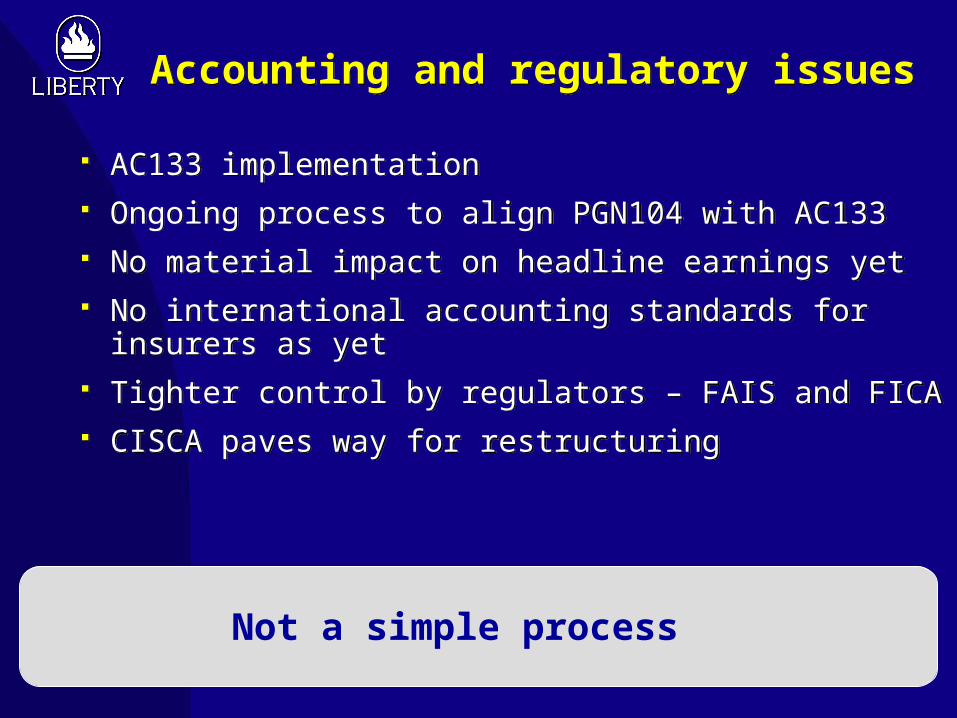
Accounting and regulatory issuesAccounting and regulatory issues
AC133 implementation Ongoing process to align PGN104 with AC133 No material impact on headline earnings yet No international accounting standards for
insurers as yet Tighter control by regulators – FAIS and FICA CISCA paves way for restructuring
AC133 implementation Ongoing process to align PGN104 with AC133 No material impact on headline earnings yet No international accounting standards for
insurers as yet Tighter control by regulators – FAIS and FICA CISCA paves way for restructuring
Not a simple process

TransformationTransformation
A huge challenge
Financial Services Charter – work in progress
Employment equity – high priority receiving continuous focus
STANLIB BEE deal the beginning of the road
Financial Services Charter – work in progress
Employment equity – high priority receiving continuous focus
STANLIB BEE deal the beginning of the road

New CEO’s thoughts on the business
New CEO’s thoughts on the business
Sound business Good products and distribution Healthy margins Strong capital position Positive cash flows
but Volatile earnings Service issues Cost base
Sound business Good products and distribution Healthy margins Strong capital position Positive cash flows
but Volatile earnings Service issues Cost base

Financial results

Features - 2003/2002Features - 2003/2002
Indexed new business• Individual• Corporate
Value of new business New business margin Headline earnings per share Dividend maintained
Indexed new business• Individual• Corporate
Value of new business New business margin Headline earnings per share Dividend maintained
++++
-162
++++
-162
6%2%
30%6%
18%46%
cents
6%2%
30%6%
18%46%
cents
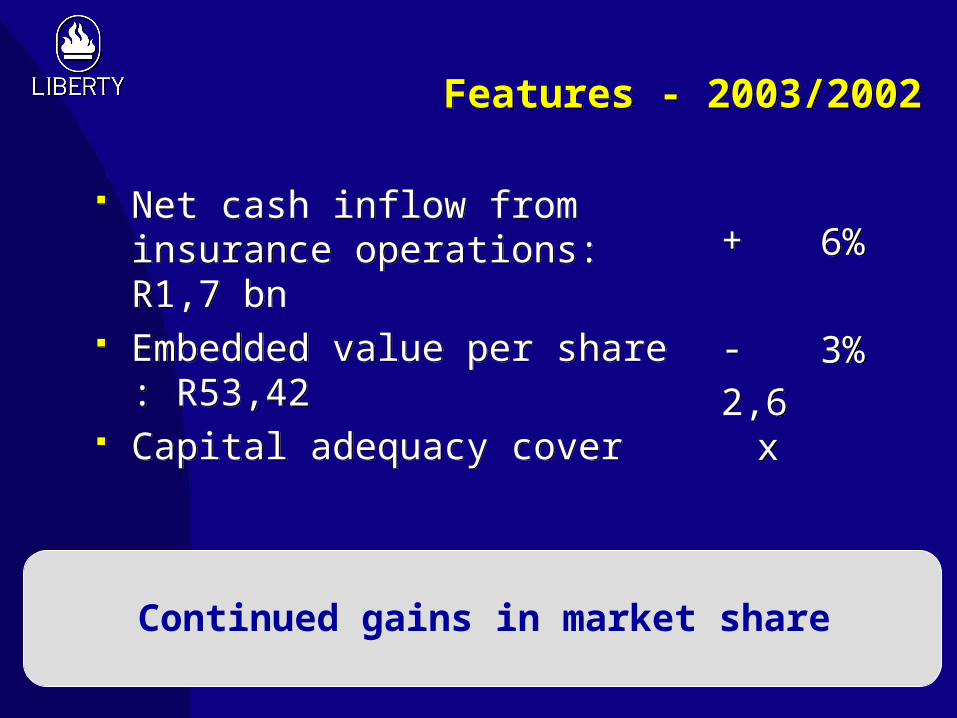
Features - 2003/2002Features - 2003/2002
Net cash inflow from insurance operations: R1,7 bn
Embedded value per share : R53,42
Capital adequacy cover
Net cash inflow from insurance operations: R1,7 bn
Embedded value per share : R53,42
Capital adequacy cover
+ -2,6 x
+ -2,6 x
6%
3%
6%
3%
Continued gains in market share

Headline earningsHeadline earnings
Life fund operating surplus
Revenue earnings – shareowners’ funds
Preference dividend
Headline earnings
Headline EPS (cents)
Life fund operating surplus
Revenue earnings – shareowners’ funds
Preference dividend
Headline earnings
Headline EPS (cents)
253
148
(45
356
130,0
253
148
(45
356
130,0
)
)
563
127
(28
662
242,5
563
127
(28
662
242,5
)
)
(55
17
61
(46
(55
17
61
(46
)
)
)
)
30 June2003Rm
30 June2003Rm
30 June2002Rm
30 June2002Rm
Change
%
Change
%
(46 )

Life fund operating surplusLife fund operating surplus
Significant reduction due to 10% shareowners’ participation in negative returns
Further reduction in fees due to lower levels of assets under management
1H02 included significant expense profits due to cost containment not repeated in 1H03
Significant reduction due to 10% shareowners’ participation in negative returns
Further reduction in fees due to lower levels of assets under management
1H02 included significant expense profits due to cost containment not repeated in 1H03

Investment returns(Weighted average of equity, managed
and foreign assets portfolios)
Investment returns(Weighted average of equity, managed
and foreign assets portfolios)
-15
-10
-5
0
5
10
15
Year-to-date return 2002 Year-to-date return 2003Expected return 2003
-15
-10
-5
0
5
10
15
Year-to-date return 2002 Year-to-date return 2003Expected return 2003
Markets continued to decline in 2003New generation products earn management fees
instead of 10% capital bonuses
Year-to-date June 2002 : - 0,4%
Year-to-date June 2003 : - 3,6%
Jan
Feb
Mar
Ap
r
May
Jun
Jul
Au
g
Sep
Oct
Nov
Dec

Total insurance expenses (Rm)
Net inflow of policies (number)
Total insurance expenses (Rm)
Net inflow of policies (number)
663
16 560
663
16 560
587
20 417
587
20 417
13
(19
13
(19
)
)
30 June2003
30 June2003
30 June2002
30 June2002
Change%
Change%
Renewal cost per policy increased/(decreased) by
Acquisition cost per policy increased/(decreased) by
+7,6%
+9,3%
+7,6%
+9,3%
0,0%
+2,1%
0,0%
+2,1%
Expenses
Significant non-recurring expenses incurred in 1H03Cost saving targets set throughout the Group
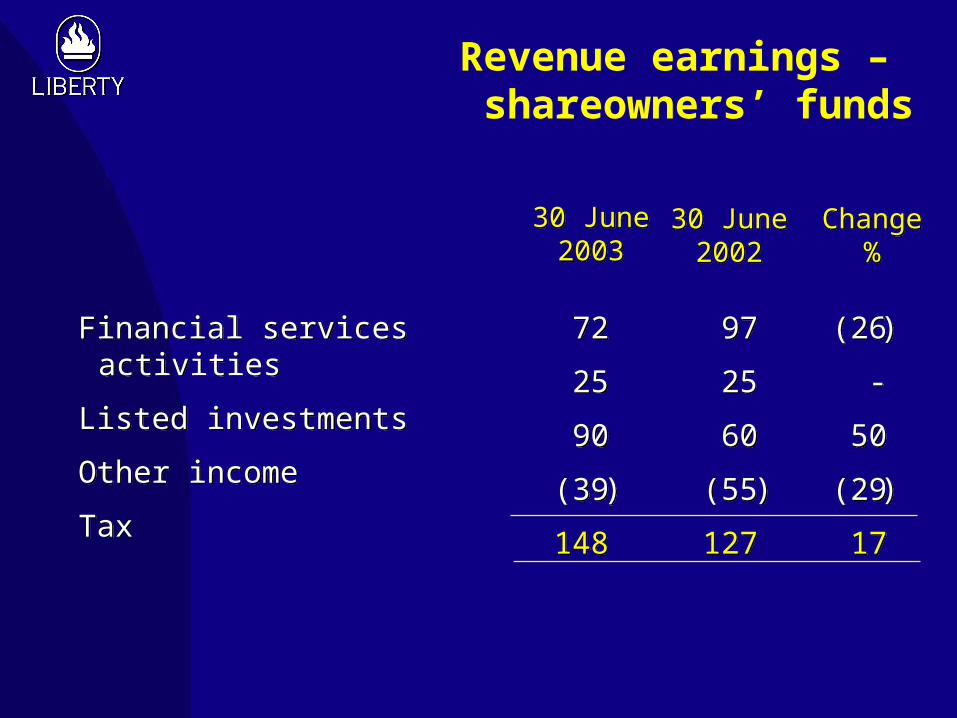
Financial services activities
Listed investments
Other income
Tax
Financial services activities
Listed investments
Other income
Tax
72
25
90
(39
148
72
25
90
(39
148
97
25
60
(55
127
97
25
60
(55
127
(26
-
50
(29
17
(26
-
50
(29
17
30 June2003
30 June2003
30 June2002
30 June2002
Change%
Change%
Revenue earnings – shareowners’ funds
)) ))
)
)
)
)

Shareowners’ funds
Value of life businessin-force
Financial services subsidiaries fair value adjustment
Total
Embedded value per share (Rand)
Shareowners’ funds
Value of life businessin-force
Financial services subsidiaries fair value adjustment
Total
Embedded value per share (Rand)
8 266
5 646
711
14 623
53,42
8 266
5 646
711
14 623
53,42
8 588
5 700
838
15 126
55,28
8 588
5 700
838
15 126
55,28
(4)
(1)
(15)
(3)
(3)
(4)
(1)
(15)
(3)
(3)
30 June2003Rm
30 June2003Rm
31 Dec2002Rm
31 Dec2002Rm
Change
%
Change
%
Embedded value

Financial services subsidiariesfair value adjustment
Financial services subsidiariesfair value adjustment
STANLIB impaired : R54 million
Liberty Ermitage multiple revised down to 12 x and stronger Rand : R70 million
Liberty Properties multiple maintained at 10 x
STANLIB impaired : R54 million
Liberty Ermitage multiple revised down to 12 x and stronger Rand : R70 million
Liberty Properties multiple maintained at 10 x

Shareowners’ fundsShareowners’ funds
Impairments:
• Hightree goodwill : R62 million
• Unlisted investments : R39 million
Impairments:
• Hightree goodwill : R62 million
• Unlisted investments : R39 million

2,6
3,0
3,43,5
3,8
0
2
4
1H01 2H01 1H02 2H02 1H03
Capital adequacy cover
Capital adequacy cover on new statutory basis: 2,6 x
CA
R
mult
iple
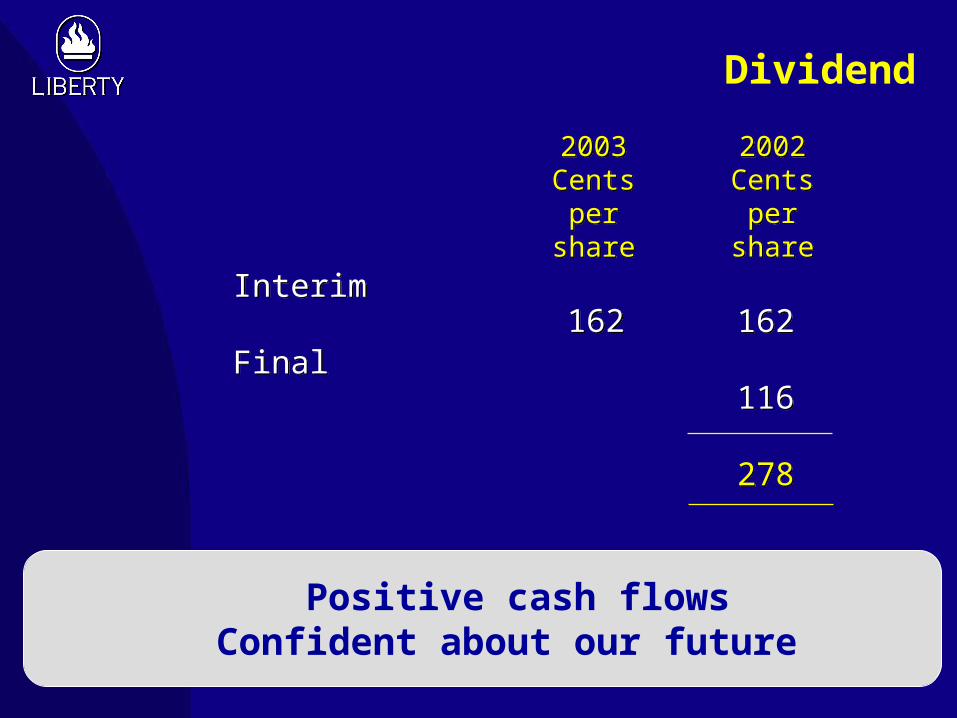
Interim
Final
Interim
Final
2003Cents per
share
2003Cents per
share
2002Cents per
share
2002Cents per
share
162162 162
116
278
162
116
278
Positive cash flowsConfident about our future
Dividend

Operations

Recurring
Single
Total
Index
Recurring
Single
Total
Index
10
(20
(14
2
10
(20
(14
2
22
51
45
30
22
51
45
30
12
(9
(5
6
12
(9
(5
6
Individual business
%
Individual business
%
Corporate business
%
Corporate business
%
Total
%
Total
%
• Continuing market share gains• Focus on productivity of sales force• Investment performance competitive over longer
periods• Strong property backed sales
New business – percentage increase
))
))

15,4
19,6
22,7
16,6
20,2
23,6 24,8
22,6
0,0
5,0
10,0
15,0
20,0
25,0
30,0
Recurring individual Single individual
Year ended 31 December 2000 Year ended 31 December 2001Year ended 31 December 2002 Quarter ended 31 March 2003
15,4
19,6
22,7
16,6
20,2
23,6 24,8
22,6
0,0
5,0
10,0
15,0
20,0
25,0
30,0
Recurring individual Single individual
Year ended 31 December 2000 Year ended 31 December 2001Year ended 31 December 2002 Quarter ended 31 March 2003
Source: LOA market sharestatistics for all life offices
Market share individual business(including Charter)
%
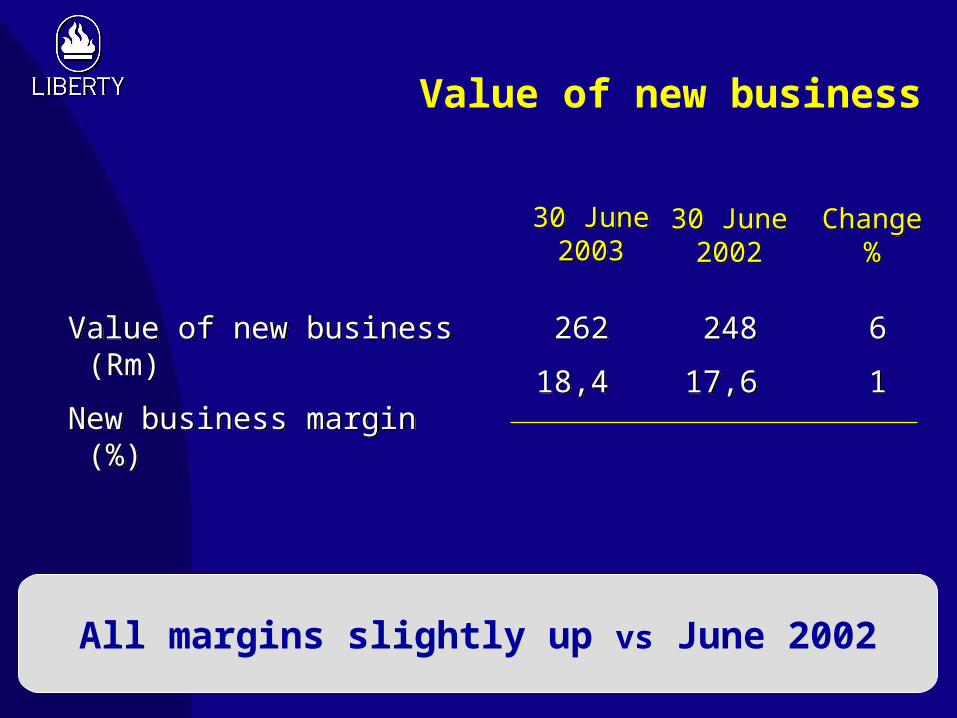
Value of new business (Rm)
New business margin (%)
Value of new business (Rm)
New business margin (%)
262
18,4
262
18,4
248
17,6
248
17,6
6
1
6
1
30 June2003
30 June2003
30 June2002
30 June2002
Change%
Change%
Value of new business
All margins slightly up vs June 2002
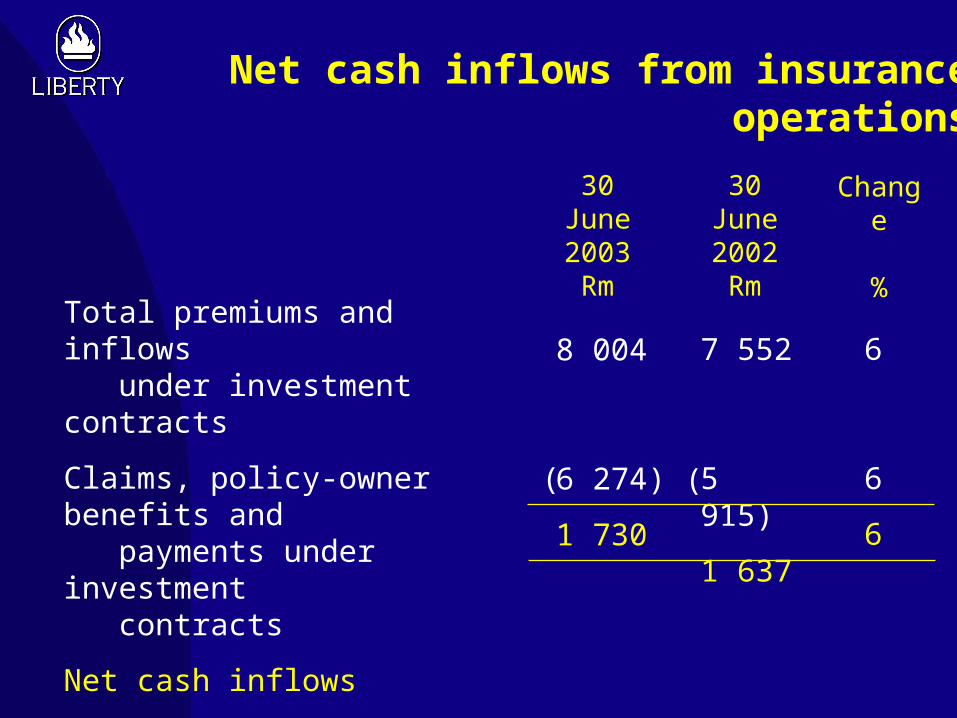
Net cash inflows from insuranceoperations
Total premiums and inflows under investment contracts
Claims, policy-owner benefits and payments under investment contracts
Net cash inflows
8 004
6 274)
1 730
7 552
5 915)
1 637
6
6
6
(
(
30 June2003Rm
30 June2002Rm
Change
%
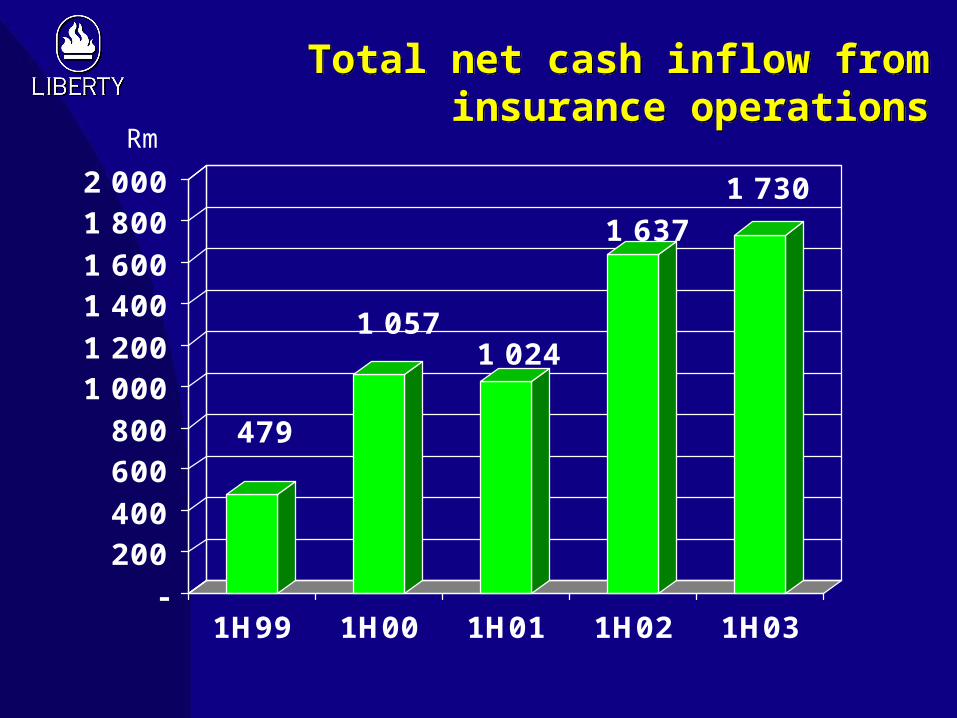
Total net cash inflow from insurance operations
Total net cash inflow from insurance operations
479
1 0571 024
1 6371 730
-200400600800
1 0001 2001 4001 6001 8002 000
1H99 1H00 1H01 1H02 1H03
Rm
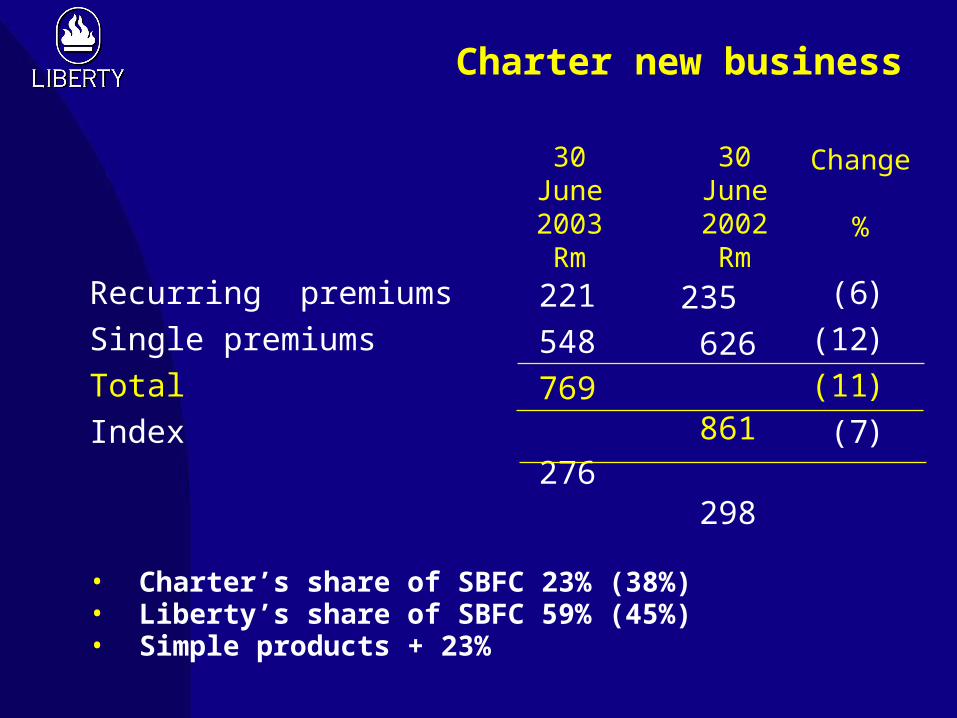
Charter new business
30 June2003Rm
30 June2002Rm
Change
%
Recurring premiumsSingle premiumsTotalIndex
221 548769
276
235 626
861
298
(6(12(11(7
))))
• Charter’s share of SBFC 23% (38%)• Liberty’s share of SBFC 59% (45%)• Simple products + 23%

Launch of Lifestyle Protector product
Launch of Lifestyle Protector product
New generation risk protection product
Cover for multiple lives
Number of unique benefits
• Settles the disability/impairment debate
Further leverages our Blueprint software
Retained the very successful Universal Lifestyle product
New generation risk protection product
Cover for multiple lives
Number of unique benefits
• Settles the disability/impairment debate
Further leverages our Blueprint software
Retained the very successful Universal Lifestyle product

STANLIBLiberty Ermitage
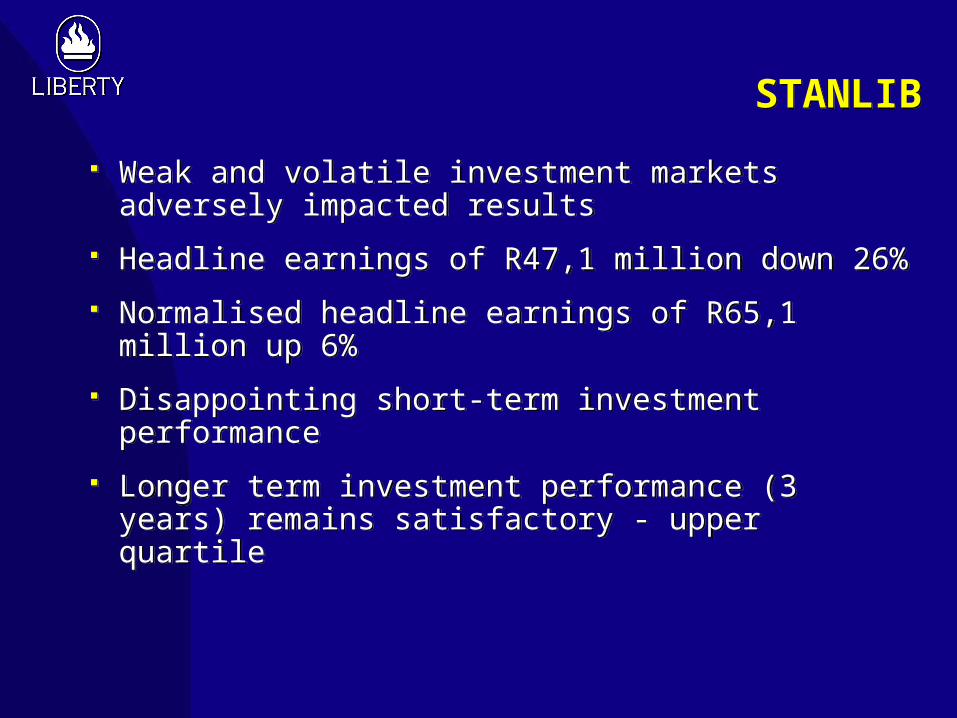
STANLIBSTANLIB
Weak and volatile investment markets adversely impacted results
Headline earnings of R47,1 million down 26%
Normalised headline earnings of R65,1 million up 6%
Disappointing short-term investment performance
Longer term investment performance (3 years) remains satisfactory - upper quartile
Weak and volatile investment markets adversely impacted results
Headline earnings of R47,1 million down 26%
Normalised headline earnings of R65,1 million up 6%
Disappointing short-term investment performance
Longer term investment performance (3 years) remains satisfactory - upper quartile
STANLIBSTANLIB
Most portfolios positioned for expected re-rating of equities relative to bonds
Merger and systems integration activities continue (R25,7 million spent this half year)
Merger costs cease end 2003
Cost saving initiative in progress
Empowerment transaction announced in June
Most portfolios positioned for expected re-rating of equities relative to bonds
Merger and systems integration activities continue (R25,7 million spent this half year)
Merger costs cease end 2003
Cost saving initiative in progress
Empowerment transaction announced in June
STANLIBSTANLIB
Asset Management net inflows for the six months of R4 billion
Wealth Management net inflows for the six months of R4 billion
Asset Management assets under management of R131,8 billion up 3%
Wealth Management funds under administration of R55,1 billion up 6%
Asset Management net inflows for the six months of R4 billion
Wealth Management net inflows for the six months of R4 billion
Asset Management assets under management of R131,8 billion up 3%
Wealth Management funds under administration of R55,1 billion up 6%

STANLIBAsset Management - assets
STANLIBAsset Management - assets
Life fundsSegregated fundsUnit trustsTotal
Life fundsSegregated fundsUnit trustsTotal
30 June2003Rm
30 June2003Rm
31 December2002Rm
31 December2002Rm
Increase
%
Increase
%
53 10748 41430 259
131 780
53 10748 41430 259
131 780
52 63348 33427 464
128 431
52 63348 33427 464
128 431
1-
10 3
1-
10 3

Liberty ErmitageAssets under management
Liberty ErmitageAssets under management
Hedge fundsLong only fundsMoney fundsTotal
Hedge fundsLong only fundsMoney fundsTotal
30 June2003US$m
30 June2003US$m
31 December2002US$m
31 December2002US$m
Increase
%
Increase
%
1 059889646
2 594
1 059889646
2 594
807792667
2 266
807792667
2 266
3112(315
3112(315
57% external third party funds
))
Conclusion

Focus areas for next six monthsFocus areas for next six months
Improve service levels
Emphasis on cost reduction
Focus on domestic operations
Renewed emphasis on people
Explore other market segments and Africa
Address capital situation
Improve service levels
Emphasis on cost reduction
Focus on domestic operations
Renewed emphasis on people
Explore other market segments and Africa
Address capital situation
Building and changing ona solid platform

PanelPanel
Myles Ruck Chief Executive
Deon de Klerk Chief Financial Officer
Andrew Lonmon-Davis Chief Actuary
Myles Ruck Chief Executive
Deon de Klerk Chief Financial Officer
Andrew Lonmon-Davis Chief Actuary