Lecture strategic management
109
- 1 - © Dr. Hartwig Maly, DHBW Mannheim, International Office Lecture 2013 Strategic Management Baden-Wuerttemberg Cooperative State University Mannheim International Office Coblitzallee 1-9 68163 Mannheim Shaping ALPHA Power Dr. Hartwig Maly E-Mail: [email protected] Kußmaulstr. 4-6 68 167 Mannheim Tel.: +49 (0)170 55 46 628 S t r a t e g i c M a n a g e m e n t D H B W I n t e r n a t i o n a l O f f i c e, V e r s i o n March 2013 L e c t u r e
-
Upload
dr-hartwig-maly -
Category
Documents
-
view
222 -
download
3
description
Autumn 2014
Transcript of Lecture strategic management

- 1 - © Dr. Hartwig Maly, DHBW Mannheim, International Office Lecture 2013
Strategic Management
Baden-Wuerttemberg Cooperative State University Mannheim
International Office
Coblitzallee 1-9
68163 Mannheim
Shaping ALPHA Power
Dr. Hartwig Maly
E-Mail: [email protected]
Kußmaulstr. 4-6 68 167 Mannheim
Tel.: +49 (0)170 55 46 628
S t r a t e g i c M a n a g e m e n t D H B W I n t e r n a t i o n a l O f f i c e, V e r s i o n March 2013
L e c t u r e

- 2 - © Dr. Hartwig Maly, DHBW Mannheim, International Office Lecture 2013
Strategic Management
A ge n d a
Topic Page Status
1. Basics 1-24
1.1 Strategy names and buzz words 11
1.2 From vision to technology 14
1.3 Meaning of targets 19
1.4 Methodologies 21
1.5 Lifecycle and feasibility study 24
2. Tools 25-70
2.1 Entrepreneurial intuition 25
2.2 Forward accounting 29
2.3 Co-opetition/ Sensitivity Analysis 50
2.3 Delphi method 53
2.4 BCG: Portfolio, experience curve effects and product lifecycle 61

- 3 - © Dr. Hartwig Maly, DHBW Mannheim, International Office Lecture 2013
Strategic Management
A ge n d a
Topic Page Status
2. Tools 25-70
2.5 Porter‘s competition strategy: Five forces, generic strategies, value chain 68
2.6 Co-opetition 69
2.7 Technology-S-curve 70
3. Case-Studies 71-108
3.1 Sales Company for laboratory equipment: Identifying strategic scenarios with ´Sensitivity Analysis´
30-50
3.2 Sales Company: From SWOT-analysis to corporate strategy 71-83
3.3 Aviation company: Translation from vision to action with ´Balanced Scorecard 84-108
- 4 - © Dr. Hartwig Maly, DHBW Mannheim, International Office Lecture 2013
Strategic Management
E xe rc i s e s / Q u e st i o n s
Page Exercise/ Question
11 Story of our lecture
11 Names of strategies
17 Ways of planning/ MBO
19 Two or more objectives
21 Meaning of methodologies
50 Sensitivity Analysis
66 Porter´s Value Chain
108 Balanced Scorecard

- 5 - © Dr. Hartwig Maly, DHBW Mannheim, International Office Lecture 2013
Strategic Management
S t ra t e g i c A n a l y s i s , P l a n n i n g , C o n t ro l l i n g
What‘ s a strategy? Which variables might be important?
An
y V
aria
ble
Time
Overview

- 6 - © Dr. Hartwig Maly, DHBW Mannheim, International Office Lecture 2013
Strategic Management
C o m m o n N a m e s fo r S t ra t e g i e s – p l e a s e ex p l a i n !
Variable/ Company
Low costs
High quality
Very innovative
Fastest acting
Second fastest
High quality and high depth of added value
Strategy
Cost Leadership
Quality Leadership
Intellectual Leadership
First Mover
Fast Follower
Hidden Champion Strategy
Overview

- 7 - © Dr. Hartwig Maly, DHBW Mannheim, International Office Lecture 2013
Strategic Management
H i d d e n C h a m p i o n s
Source: Wikipedia, Hidden Champions

- 8 - © Dr. Hartwig Maly, DHBW Mannheim, International Office Lecture 2013
Strategic Management
Imagine to be responsible for NOKIA as CEO. Which strategy would you prefer? The green one or the red strategy? How to define the right strategy?
C h o o s i n g a s t ra t e g y fo r N o k i a
Source: http://www37.wolframalpha.com/input/?i=nokia
http://en.wikipedia.org/wiki/Nokia
Source: Knowledge engine Wolfram ALPHA http://www.wolframalpha.com/input/?i=nokia

- 9 - © Dr. Hartwig Maly, DHBW Mannheim, International Office Lecture 2013
Strategic Management
H i s t o r y a n d p re s e n c e
Battle of Waterloo „Battle“ of selling Smart cars
Overview
Method: Sensitivity analysis, Pages 30 - 47

- 10 - © Dr. Hartwig Maly, DHBW Mannheim, International Office Lecture 2013
Strategic Management
A l l o c a t e B u z z Wo rd s
• Strategy
• Tactics
• Operations
• Target
• Objective
• Goal
An
y V
aria
ble
Time
?
Overview
More interesting information: http://www.12manage.com/i_s.html

- 11 - © Dr. Hartwig Maly, DHBW Mannheim, International Office Lecture 2013
Strategic Management
Q u e st i o n
Some definitions (8/ 100 pt)
If a friend would ask you about our lecture, what would you tell him? What is our lecture on?
You know . . . (15/ 100 pt)
. . . that strategies are describing the way between today‘s situation and an desired end state of an organisation (company, administration, etc).
i. Please list five different strategies and allocate only one characteristic attribute to each of them. If you like, its USP (unique selling proposition). (5)
ii. Imagine your company to be in a highly competetive and volatile (quickly changing) market. Your company‘s success and your strategy therefore are very much dependent on time. (5)
iii. Please list your five strategies in the order of diminishing utility for this purpose. (5)
- 12 - © Dr. Hartwig Maly, DHBW Mannheim, International Office Lecture 2013
Strategic Management
M a n a ge r i a l Re s p o n s i b i l i t i e s
Management Levels Responsibilities
Function
Responsibility
Planning Horizon
Executive board
Vision Strategy
> 3 years
Manager Tactics 1 – 3 years
Group leader, Team leader
Operations < 1 year
Overview

- 13 - © Dr. Hartwig Maly, DHBW Mannheim, International Office Lecture 2013
Strategic Management
F ro m V i s i o n t o Te c h n o l o g y
Harvard Terms and Definitions
Strategy: long-term planning
Structure: operational and organisational
operational–processes
organisational–f.e.line, staff
Technology: Infrastructure, f.e. IT,
manufacturing facilities,
high rack warehouse Structure follows strategy and technology follows structure. (Prof. Alfred Chandler, 1962, Harvard University)
Vision
Overview

- 14 - © Dr. Hartwig Maly, DHBW Mannheim, International Office Lecture 2013
Strategic Management
M a n a ge m e n t C i rc l e a n d S t ra t e g y
Remember our first definition of strategy (page 2)
Command structure
S t r a t e g y
T a c t i c s
O p e r a t i o n s
Overview

- 15 - © Dr. Hartwig Maly, DHBW Mannheim, International Office Lecture 2013
Strategic Management
W h a t ‘s a Ta rge t ?
Definition
Overview

- 16 - © Dr. Hartwig Maly, DHBW Mannheim, International Office Lecture 2013
Strategic Management
M a n a ge m e n t b y Ta rge t s
Hierarchy of Targets Way of planning
Top - Down
Bottom - Up
Mixed Planning
Overview

- 17 - © Dr. Hartwig Maly, DHBW Mannheim, International Office Lecture 2013
Strategic Management
Q u e st i o n
Strategic analysis (12/ 100 pt)
Imagine to be chief executive manager. You have decided to manage your company using Peter Drucker‘s MBO.
i. What does it mean? (4)
ii. What is the difference between an objective and a target/ goal? (4)
iii. What is your related preferred way of planning? Please describe in brief. (4)

- 18 - © Dr. Hartwig Maly, DHBW Mannheim, International Office Lecture 2013
Strategic Management
C o m p a t i b i l i t i e s o f Ta rge t s
Compatible targets
Not compatible targets
Target 1
Targ
et 2
Target 1
Targ
et 2
Overview
Any idea? What could it mean to be compatible or not compatibel?
Which are the consequences of non-compatible target for your planning ?
- 19 - © Dr. Hartwig Maly, DHBW Mannheim, International Office Lecture 2013
Strategic Management
Q u e st i o n
Two or more objectives. (10/ 100 pt)
Imagine that you have already defined more than one objective as a first draft for 2012.
i. Which problems may occur? Mention at least two of them. (5)
ii. How would you solve this problems? (5)

- 20 - © Dr. Hartwig Maly, DHBW Mannheim, International Office Lecture 2013
Strategic Management
D i f fe re n t M e t h o d o l o g i e s t o F i n d S t ra t e g i e s
Three-Step and Draw-See-Think
There are many approaches to strategic planning but typically
a three-step process may be used:
Situation - evaluate the current situation and how it came
about.
Target - define goals and/or objectives (sometimes called
ideal state)
Path - map a possible route to the goals/objectives
One alternative approach is called Draw-See-Think
Draw - what is the ideal image or the desired end state?
See - what is today's situation? What is the gap from ideal and
why?
Think - what specific actions must be taken to close the gap
between today's situation and the ideal state?
Plan - what resources are required to execute the activities?
See-Think-Draw and From Vision to Action
An alternative to the Draw-See-Think approach is called See-
Think-Draw
See - what is today's situation?
Think - define goals/objectives
Draw - map a route to achieving the goals/objectives
In other terms strategic planning can be as follows:
Vision - Define the vision and set a mission statement with
hierarchy of goals and objectives
SWOT - Analysis conducted according to the desired goals
Formulate - Formulate actions and processes to be taken to
attain these goals
Implement - Implementation of the agreed upon processes
Control - Monitor and get feedback from implemented
processes to fully control the operation
http://en.wikipedia.org/wiki/Strategic_Planning
Overview

- 21 - © Dr. Hartwig Maly, DHBW Mannheim, International Office Lecture 2013
Strategic Management
Q u e st i o n
Methodologies (10 pt)
Methodology is generally a guideline for solving a problem. In our case a guideline to reach a desired final state, applying a strategy. In literature there are two different methodologies mentioned for the strategy-business.
i. Please describe both in brief. (5)
ii. Please mention two strength and two weaknesses of both. (5)

- 22 - © Dr. Hartwig Maly, DHBW Mannheim, International Office Lecture 2013
Strategic Management
B o o m , B u st a n d S t ra t e g y
Enough Information But Not Power of judgement
WHY?
Overview

- 23 - © Dr. Hartwig Maly, DHBW Mannheim, International Office Lecture 2013
Strategic Management
P ro j e c t L i fe c yc l e M o d e l
Overview

- 24 - © Dr. Hartwig Maly, DHBW Mannheim, International Office Lecture 2013
Strategic Management
Fe a s i b i l i t y - S t u d y
Importance of Starting Points
• Start of a project/ contract
• Description of the current situation (company f.e.)
Agenda Feasibility Study
Overview
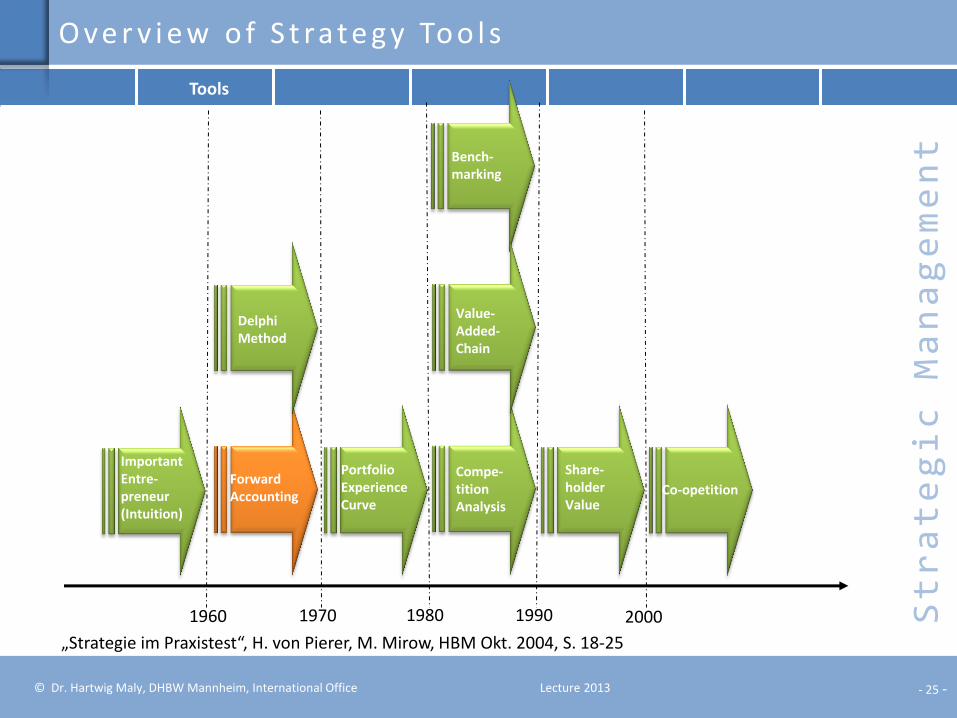
- 25 - © Dr. Hartwig Maly, DHBW Mannheim, International Office Lecture 2013
Strategic Management
„Strategie im Praxistest“, H. von Pierer, M. Mirow, HBM Okt. 2004, S. 18-25
Important Entre- preneur (Intuition)
Forward Accounting
Delphi Method
Compe- tition Analysis
Value- Added- Chain
Bench- marking
Portfolio Experience Curve
Share- holder Value
Co-opetition
1960 1970 1980 1990 2000
Tools
O ve r v i e w o f S t ra t e g y To o l s
Ansoff Matrix

- 26 - © Dr. Hartwig Maly, DHBW Mannheim, International Office Lecture 2013
Strategic Management
Fo r w a rd A c c o u n t i n g
Description Operational business, 5- 10 years, based on markets analysis and trend extrapolations
Strength First strategic approach, is not meant to be universally applicable Quantitative, simple tools, works well under certain conditions
Weakness Works well in steady markets with constant growth and strong correlation between variables
Example Assured facts and correlations between e.g. growth of GDP, consumption of electricity Companies like Siemens or GE, producing power plants, could estimate capacities in the long run
Suitability for daily use
Improper for rapidly growing markets, innovative markets (groundbreaking technologies)
2006 2007 2008 2009 2010
2007 2008 2009 2010 2011 2006 2007 2008 2009 2010 2011 2012 2013 2014 2015
Tools

- 27 - © Dr. Hartwig Maly, DHBW Mannheim, International Office Lecture 2013
Strategic Management
Fo r w a rd A c c o u n t i n g
Steady Markets Forecast
Capacity utilisation of 100 %
Market growth 10 %
e.g. Production and consumption of electricity
Nr. power plants
Consump-tion
+
+
Tools

- 28 - © Dr. Hartwig Maly, DHBW Mannheim, International Office Lecture 2013
Strategic Management
E x p o n e n t i a l G ro w t h
2011 - 2020 2000 - 2010
Tools

- 29 - © Dr. Hartwig Maly, DHBW Mannheim, International Office Lecture 2013
Strategic Management
C o n s u m p t i o n E l e c t r i c i t y
Tools

- 30 - © Dr. Hartwig Maly, DHBW Mannheim, International Office Lecture 2013
Strategic Management
„Strategie im Praxistest“, H. von Pierer, M. Mirow, HBM Okt. 2004, S. 18-25
Important Entre- preneur (Intuition)
Forward Accounting
Delphi Method
Compe- tition Analysis
Value- Added- Chain
Bench- marking
Portfolio Experience Curve
Share- holder Value
Co-opetition
1960 1970 1980 1990 2000
Co-opetition
Tools
O ve r v i e w o f S t ra t e g y To o l s

- 31 - © Dr. Hartwig Maly, DHBW Mannheim, International Office Lecture 2013
Strategic Management
C o - o p e t i t i o n
supplier
customer
Co-operator competitor company
money
money
products & services
raw materials & manpower
Zero - sum Win - win non - zero - sum
Porter‘s Force Field
Tools

- 32 - © Dr. Hartwig Maly, DHBW Mannheim, International Office Lecture 2013
Strategic Management
S e n s i t i v i t y A n a l y s i s
Current Situation Company
• Sales Company for laboratory equipment
• Consultation intensive products
• Considerable know-how in sales is necessary to
be successful regarding products and possible
fields of application
• For a short time, sales commissions depend on
profit margins
Current Problems in Sales
Sales volume
Turn over
Fluctuation of employees
Case Study I

- 33 - © Dr. Hartwig Maly, DHBW Mannheim, International Office Lecture 2013
Strategic Management
C u r re n t S i t u a t i o n C u st o m e rs
Current Situation for Customers
• More often we have visits of your new sales
representatives at our company
• Not familiar with our technical and
internal problems. How shall they give us advice?
• Although we have a cut of budget we have an
increasing demand for support
• Your competitors have already adjusted their
prices to beat the competition
• Difficult to justify the purchase of your products
Field Sales Manager
Customer
Case Study I
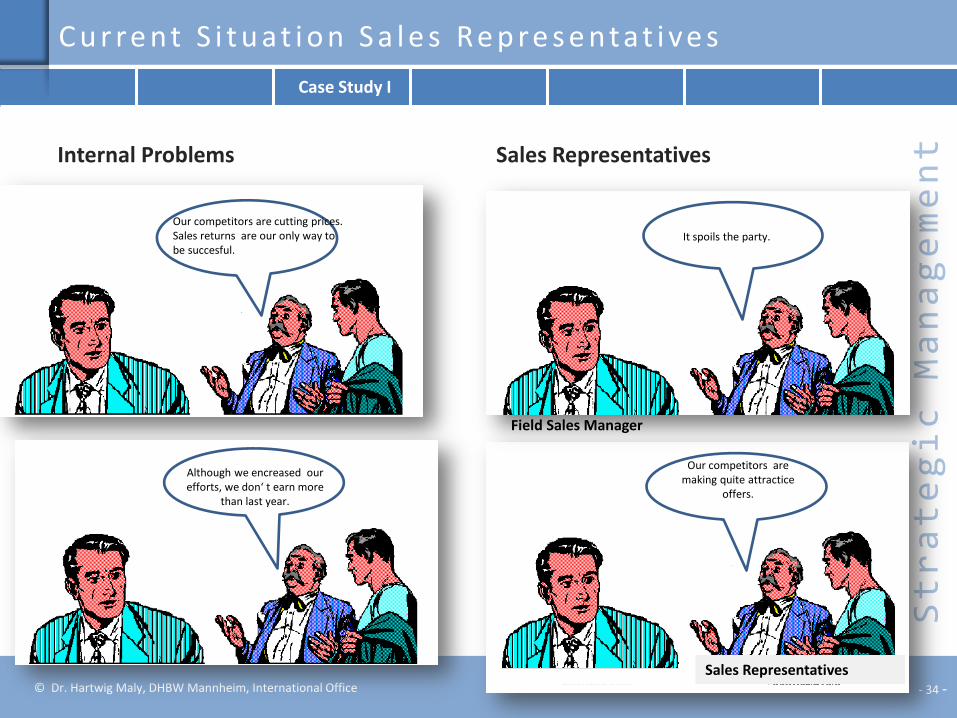
- 34 - © Dr. Hartwig Maly, DHBW Mannheim, International Office Lecture 2013
Strategic Management
C u r re n t S i t u a t i o n S a l e s Re p re s e n t a t i ve s
Internal Problems Sales Representatives
Sales Representatives
Field Sales Manager
Our competitors are cutting prices. Sales returns are our only way to be succesful.
It spoils the party.
Although we encreased our efforts, we don‘ t earn more
than last year.
Our competitors are making quite attractice
offers.
Case Study I

- 35 - © Dr. Hartwig Maly, DHBW Mannheim, International Office Lecture 2013
Strategic Management
C u r re n t S i t u a t i o n C o n t ro l l e r
You can only manage, what you can measure.
Controller
We are loosing money for month. We have to raise our prices to increase our revenue.
We have to cut down our staff costs.
Job hopping is a great problem for us. New sales represen-tatives
have to be recruited and trained.
Case Study I

- 36 - © Dr. Hartwig Maly, DHBW Mannheim, International Office Lecture 2013
Strategic Management
S o l u t i o n
Systemic modelling – a possible approach for complex situations.
Find the root of all evil. I expect proposals for a sudden improvement.
Firm owner
1. Challenging conditions for the field manager.
2. No chance for a solution with unilateral measures.
3. Quite complex actual situation with difficult dependencies.
4. Common meeting with colleagues of relevant organisational units:
Sales Controlling HR Department
Case Study I

- 37 - © Dr. Hartwig Maly, DHBW Mannheim, International Office Lecture 2013
Strategic Management
K i c k - O f f
Kick-Off Meeting
Sales volume
Turn over
Fluctuation of employees
Our problems seem to be . . .
Case Study I

- 38 - © Dr. Hartwig Maly, DHBW Mannheim, International Office Lecture 2013
Strategic Management
Ta rge t s / O b j e c t i ve s
Our Objectives
1. Reduction of fluctuation/ employee turnover
2. Improvement of turn over.
3. Strengthening of customer loyalty. Let‘ s start our brainstorming
to find the most important variables. for a solution.
Case Study I
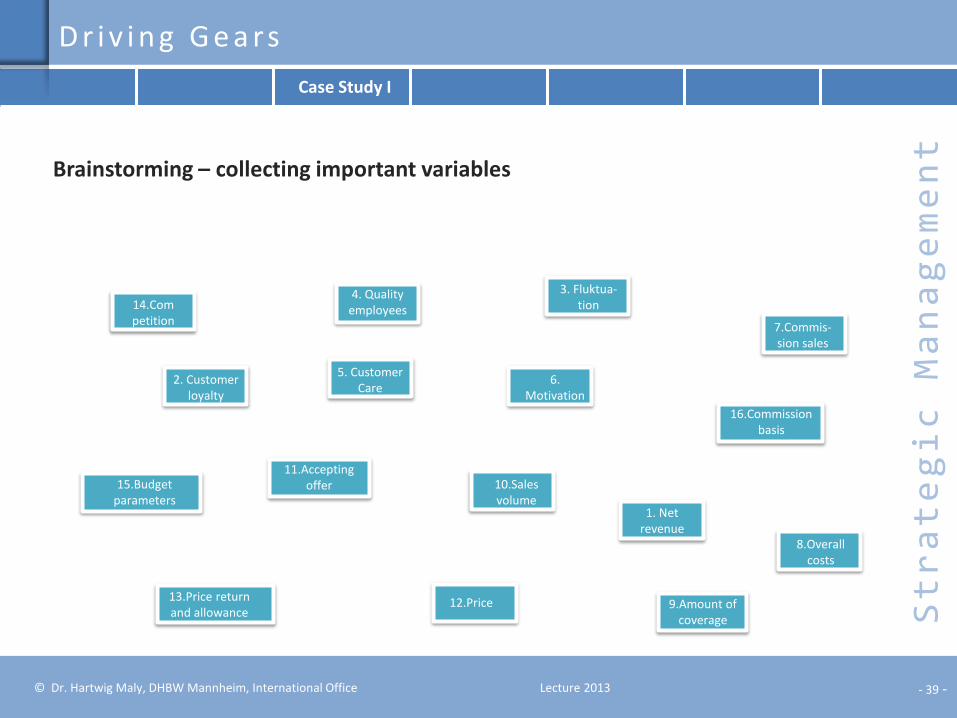
- 39 - © Dr. Hartwig Maly, DHBW Mannheim, International Office Lecture 2013
Strategic Management
D r i v i n g G e a rs
Brainstorming – collecting important variables
16.Commission basis
15.Budget parameters
14.Competition
13.Price return and allowance
12.Price
11.Accepting offer 10.Sales
volume
9.Amount of coverage
8.Overall costs
7.Commis-sion sales
6. Motivation
5. Customer Care
4. Quality employees
3. Fluktua-tion
2. Customer loyalty
1. Net revenue
Case Study I

- 40 - © Dr. Hartwig Maly, DHBW Mannheim, International Office Lecture 2013
Strategic Management
Ta rge t s
Targets [green]
16.Commission basis
15.Budget parameters
14.Competition
13.Price return and allowance
12.Price
11.Accepting offer 10.Sales
volume
9.Amount of coverage
8.Overall costs
7.Commis-sion sales
6. Motivation
5. Customer Care
4. Quality employees 3. Fluktuation
2. Customer loyalty
1. Net revenue
Case Study I

- 41 - © Dr. Hartwig Maly, DHBW Mannheim, International Office Lecture 2013
Strategic Management
D i f fe re n t i a t i o n b y I m p a c t
Steerable [ red ], Influence Sales [ orange ], External Variables [ yellow ]
16.Commission basis
15.Budget parameters
14.Competition
13.Price return and allowance
11.Accepting offer 10.Sales
volume
9.Amount of coverage
8.Overall costs
7.Commis-sion sales
6. Motivation
5. Customer Care
4. Quality employees 3. Fluktuation
2. Customer loyalty
1. Net revenue
12.Price
Case Study I

- 42 - © Dr. Hartwig Maly, DHBW Mannheim, International Office Lecture 2013
Strategic Management
F i rs t N e t w o r k
Approach
16.Commission basis
15.Budget parameters
14.Competition
13.Price return and allowance
11.Accepting offer 10.Sales
volume
9.Amount of coverage
8.Overall costs
7.Commis -sion sales
6. Motivation
5. Customer Care
4. Quality employees
3. Fluktuation
2. Customer loyalty
1. Net revenue
12.Price
Case Study I
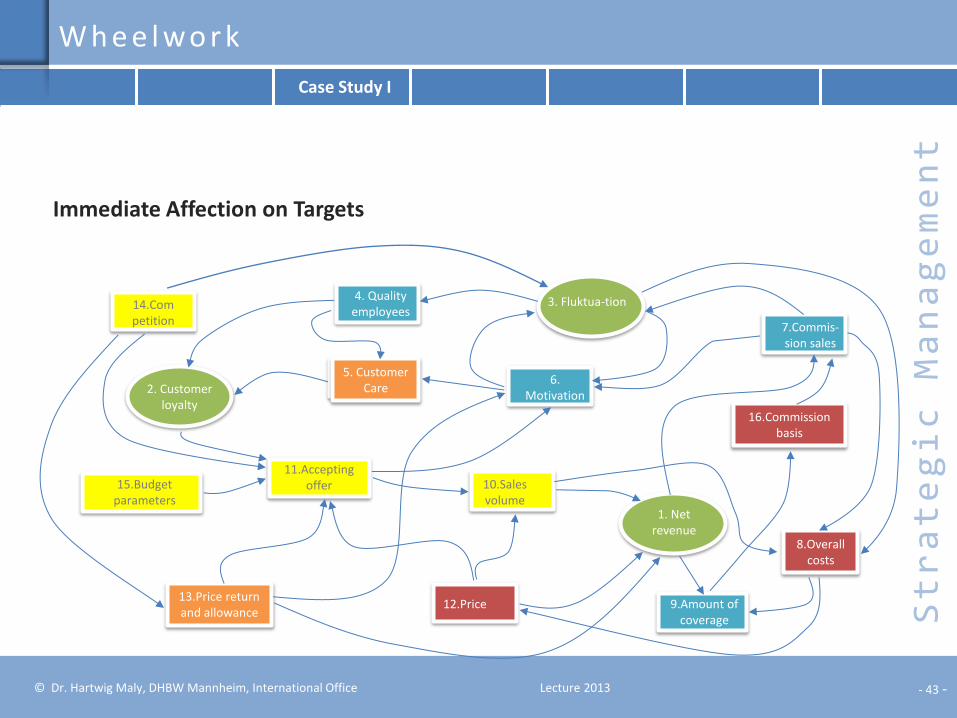
- 43 - © Dr. Hartwig Maly, DHBW Mannheim, International Office Lecture 2013
Strategic Management
W h e e l w o r k
Immediate Affection on Targets
16.Commission basis
15.Budget parameters
14.Competition
13.Price return and allowance
11.Accepting offer 10.Sales
volume
9.Amount of coverage
8.Overall costs
7.Commis-sion sales
6. Motivation
5. Customer Care
4. Quality employees
3. Fluktua-tion
2. Customer loyalty
1. Net revenue
12.Price
Case Study I

- 44 - © Dr. Hartwig Maly, DHBW Mannheim, International Office Lecture 2013
Strategic Management
S t re n gt h o f I n f l u e n c e
Strength of Arrows
16.Commission basis
15.Budget parameters
14.Competition
13.Price return and allowance
11.Accepting offer 10.Sales
volume
9.Amount of coverage
8.Overall costs
7.Commis-sion sales
6. Motivation
5. Customer Care
4. Quality employees
3. Fluktuation
2. Customer loyalty
1. Net revenue
12.Price
Case Study I

- 45 - © Dr. Hartwig Maly, DHBW Mannheim, International Office Lecture 2013
Strategic Management
D y n a m i c s
black [ short-term ], blue [ middle-term ], light-blue [ long-term ]
16.Commission basis
15.Budget parameters
14.Competition
13.Price return and allowance
11.Accepting offer 10.Sales
volume
9.Amount of coverage
8.Overall costs
7.Commis-sion sales
6. Motivation
5. Customer Care
4. Quality employees
3. Fluktua-tion
2. Customer loyalty
1. Net revenue
12.Price
Case Study I

- 46 - © Dr. Hartwig Maly, DHBW Mannheim, International Office Lecture 2013
Strategic Management
Way o f I n f l u e n c e
Same direction [ + ], inverse direction [ - ]
16.Commission basis
15.Budget parameters
14.Competition
13.Price return and allowance
11.Accepting offer 10.Sales
volume
9.Amount of coverage
8.Overall costs
7.Commis-sion sales
6. Motivation
5. Customer Care
4. Quality employees
3. Fluktua-tion
2. Customer loyalty
1. Net revenue
12.Price
+
+ +
+ +
+ +
+
+
+
+
+ +
+
+ - -
-
+
- +
-
+
+ +
- -
-
- -
Case Study I

- 47 - © Dr. Hartwig Maly, DHBW Mannheim, International Office Lecture 2013
Strategic Management
Pa r t i a l N e t w o r k
Network „Commission Sales“
16.Commission basis
15.Budget parameters
14.Competition
13.Price return and allowance
11.Accepting offer 10.Sales
volume
9.Amount of coverage
8.Overall costs
7.Commis- sion sales
6. Motivation
5. Customer Care
4. Quality employees
3. Fluktua-tion
2. Customer loyalty
1. Net revenue
12.Price
+
+ +
+ +
+ +
+
+
+
+
+ +
+
+ - -
-
+
- +
-
+
+ +
- -
-
- -
-
Case Study I
Small world

- 48 - © Dr. Hartwig Maly, DHBW Mannheim, International Office Lecture 2013
Strategic Management
Pa r t i a l N e t w o r k
Network „Customer Loyalty“
16.Commission basis
15.Budget parameters
14.Competition
13.Price return and allowance
11.Accepting offer 10.Sales
volume
9.Amount of coverage
6. Motivation
5. Customer Care
4. Quality employees
3. Fluktua-tion
2. Customer loyalty
1. Net revenue
12.Price
+
+ +
+
+ - -
+ +
-
Case Study I
Small world
Targets compatible?

- 49 - © Dr. Hartwig Maly, DHBW Mannheim, International Office Lecture 2013
Strategic Management
Pa r t i a l N e t w o r k
Network Quality
16.Commission basis
15.Budget parameters
14.Competition
13.Price return and allowance
11.Accepting offer 10.Sales
volume
9.Amount of coverage
8.Overall costs
7.Commis-sion sales
6. Motivation
5. Customer Care
4. Quality employees
3. Fluktua-tion
2. Customer loyalty
1. Net revenue
12.Price
+
+ +
+ +
+ +
+
+
+
+
+ +
+
+ - -
-
+
- +
-
+ +
- -
-
- -
Case Study I
Small world

- 50 - © Dr. Hartwig Maly, DHBW Mannheim, International Office Lecture 2013
Strategic Management
Q u e st i o n
Strategic analysis (15/ 100 pt)
You have finished your ‚sensitivity analysis` to find the most important drivers (KPIs) to achieve your targets.
i. What is going on in the ‚small world` between your targets ‚fluctuation (of empolyees)‘ and`customer loyalty‘ ? Please tell the story in brief. (5)
ii. Please describe the compatibility of our targets. Possible to achieve both? (5)
iii. Which KPI seem to be useful? (5)
50
Sales volume
Turn over
Fluctuation of employees

- 51 - © Dr. Hartwig Maly, DHBW Mannheim, International Office Lecture 2013
Strategic Management
„Strategie im Praxistest“, H. von Pierer, M. Mirow, HBM Okt. 2004, S. 18-25
Important Entre- preneur (Intuition)
Forward Accounting
Delphi Method
Compe- tition Analysis
Value- Added- Chain
Bench- marking
Portfolio Experience Curve
Share- holder Value
Co-opetition
1960 1970 1980 1990 2000
Delphi Method
Tools
O ve r v i e w o f S t ra t e g y To o l s

- 52 - © Dr. Hartwig Maly, DHBW Mannheim, International Office Lecture 2013
Strategic Management
D e l p h i M e t h o d
Description Experts were asked to give their opinion on the probability, frequency and intensity of possible enemy attacks or development of groundbreaking technologies. Other experts could anonymously give feedback. This process was repeated several times until a consensus emerged.
Strength Brainstorming of trends Qualitative and quantitative forecasts possible Diverse experts important
Weakness Depends on choice of experts
Example Japan: Forecast of technological megatrends
Suitability for daily use
Very useful for forecasts
Tools

- 53 - © Dr. Hartwig Maly, DHBW Mannheim, International Office Lecture 2013
Strategic Management
B ra i n s t o r m i n g
The name "Delphi" derives from the Oracle of Delphi.
The authors of the method were not happy with this
name, because it implies "something oracular,
something smacking a little of the occult". The Delphi
method is based on the assumption that group
judgments are more valid than individual judgments.
The Delphi method was developed at the beginning
of the Cold War to forecast the impact of technology
on warfare. In 1944, General Henry H. Arnold
ordered the creation of the report for the U.S. Army
Air Corps on the future technological capabilities that
might be used by the military.
Tools

- 54 - © Dr. Hartwig Maly, DHBW Mannheim, International Office Lecture 2013
Strategic Management
O ve r v i e w o f S t ra t e g y To o l s
Important Entre- preneur (Intuition)
Forward Accounting
Delphi Method
Compe- tition Analysis
Value- Added- Chain
Bench- marking
Portfolio Experience Curve
Share- holder Value
Co-opetition
1960 1970 1980 1990 2000
Tools

- 55 - © Dr. Hartwig Maly, DHBW Mannheim, International Office Lecture 2013
Strategic Management
Po r t fo l i o
Description The BCG matrix is a chart that had been created by Bruce Henderson for the Boston Consulting Group in 1968 to help corporations with analyzing their business units or product lines. This helps the company allocate resources and is used as an analytical tool in brand marketing, product management, strategic management, and portfolio analysis
Strength •It encourages top management to evaluate each of the corporation’s businesses individually and to set objectives and allocate resources for each. •It stimulates the use of externally oriented data to supplement management’s judgment. •It raises the issue of cash flow availability for use in expansion and growth. •Its graphic depiction facilitates communication.
Weakness •It is not easy to define market segments. • It suggests the use of standard strategies that can miss opportunities or be impractical. • It provides an illusion of scientific rigor when in reality positions are based on subjective judgments. • Terms like “cash cow” and “dog” can lead to self-fulfilling prophecies. • It is not always clear what makes an industry attractive or what stage a product is at in its life cycle. • Naively following the prescriptions of a portfolio model may actually reduce corporate profits if they are used inappropriately.
Example Nr. 1 strategy Siemens,General Electric
Suitability for daily use Quite good for qualitative development of strategies
Tools

- 56 - © Dr. Hartwig Maly, DHBW Mannheim, International Office Lecture 2013
Strategic Management
B a s i c s
low high
low
h
igh
Tools

- 57 - © Dr. Hartwig Maly, DHBW Mannheim, International Office Lecture 2013
Strategic Management
B C G Po r t fo l i o
Question marks (also known as problem child) are
growing rapidly and thus consume large amounts of cash,
but because they have low market shares they do not
generate much cash. The result is a large net cash
consumption. A question mark has the potential to gain
market share and become a star, and eventually a cash
cow when the market growth slows. If the question mark
does not succeed in becoming the market leader, then
after perhaps years of cash consumption it will degenerate
into a dog when the market growth declines.
Stars are units with a high market share in a fast-growing
industry. The hope is that stars become the next cash
cows. Sustaining the business unit's market leadership may
require extra cash, but this is worthwhile if that's what it
takes for the unit to remain a leader. When growth slows,
stars become cash cows if they have been able to maintain
their category leadership, or they move from brief stardom
to dogdom.
Tools

- 58 - © Dr. Hartwig Maly, DHBW Mannheim, International Office Lecture 2013
Strategic Management
B C G Po r t fo l i o
Cash cows are units with high market share in a slow-
growing industry. These units typically generate cash in
excess of the amount of cash needed to maintain the
business. They are regarded as staid and boring, in a
"mature" market, and every corporation would be thrilled
to own as many as possible. They are to be "milked"
continuously with as little investment as possible, since
such investment would be wasted in an industry with low
growth.
Dogs, or more charitably called pets, are units with low
market share in a mature, slow-growing industry. These
units typically "break even", generating barely enough
cash to maintain the business's market share. Though
owning a break-even unit provides the social benefit of
providing jobs and possible synergies that assist other
business units, from an accounting point of view such a
unit is worthless, not generating cash for the company.
Tools

- 59 - © Dr. Hartwig Maly, DHBW Mannheim, International Office Lecture 2013
Strategic Management
M c Fa r l a n‘s I T Po r t fo l i o M a t r i x
Tools

- 60 - © Dr. Hartwig Maly, DHBW Mannheim, International Office Lecture 2013
Strategic Management
E xa m p l e s Po r t fo l i o
Tools

- 61 - © Dr. Hartwig Maly, DHBW Mannheim, International Office Lecture 2013
Strategic Management
Po r t fo l i o - Ve c t o r
Tools

- 62 - © Dr. Hartwig Maly, DHBW Mannheim, International Office Lecture 2013
Strategic Management
O ve r v i e w o f S t ra t e g y To o l s
Important Entre- preneur (Intuition)
Forward Accounting
Delphi Method
Compe- tition Analysis
Value- Added- Chain
Bench- marking
Portfolio Experience Curve
Share- holder Value
Co-opetition
1960 1970 1980 1990 2000
Tools

- 63 - © Dr. Hartwig Maly, DHBW Mannheim, International Office Lecture 2013
Strategic Management
Po r t e r ‘s F i ve Fo rc e s
the bargaining power of customers
the bargaining power of suppliers
the threat of new entrants
the threat of substitute products
the intensity of competitive rivalry
Tools

- 64 - © Dr. Hartwig Maly, DHBW Mannheim, International Office Lecture 2013
Strategic Management
Po r t e r ‘s G e n e r i c S t ra t e g i e s
Tools

- 65 - © Dr. Hartwig Maly, DHBW Mannheim, International Office Lecture 2013
Strategic Management
Va l u e - A d d e d C h a i n
Tools

- 66 - © Dr. Hartwig Maly, DHBW Mannheim, International Office Lecture 2013
Strategic Management
Q u e st i o n
Porter‘s value chain (15/ 100 pt)
Your company is producing and selling laboratory equipment. You are in a precarious financial situation (rich portfolio of products, many of them with a negative profit margin, etc. page 5 ).
i. How would you utilize Michael Porter‘s ‚Competition Theory‘ to improve your situation? (5) Five-Forces-Approach
Value Added-Chain
ii. Which measures could be taken regarding the primary and secondary Porter-processes? (5) for the short term (operational measures)
in the medium term (tactical measures)
In the long term (strategic measures)
iii. Do you see any additional use of the co-opetion-approach? (5)

- 67 - © Dr. Hartwig Maly, DHBW Mannheim, International Office Lecture 2013
Strategic Management
B re a kd o w n S t r u c t u re

- 68 - © Dr. Hartwig Maly, DHBW Mannheim, International Office Lecture 2013
Strategic Management
F l o w C h a r t „O rd e r t o c a s h“
1 confirm standard
offer
prereservation of resources
customer approval
?
receive customer order
yes
cancel prereservation
no
recheck/match conditions
allocation of resources for
„make to order“
Conditions unchanged
?
no
yes Confirm customer order
material from stock
?
yes
no
Tools
- 69 - © Dr. Hartwig Maly, DHBW Mannheim, International Office Lecture 2013
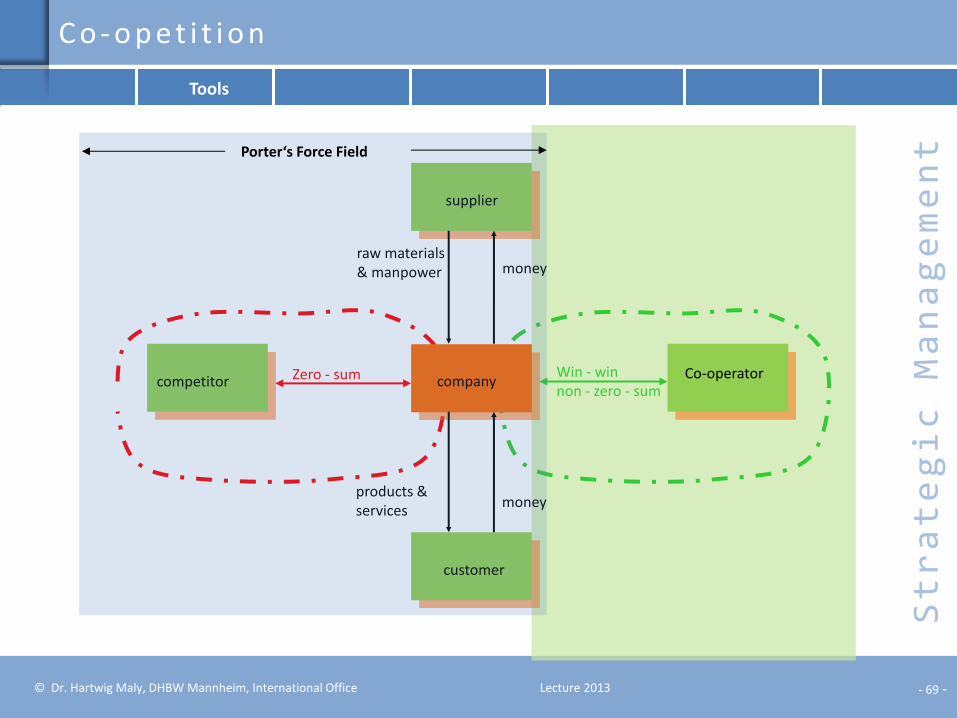
Strategic Management
C o - o p e t i t i o n
supplier
customer
Co-operator competitor company
money
money
products & services
raw materials & manpower
Zero - sum Win - win non - zero - sum
Porter‘s Force Field
Tools

- 70 - © Dr. Hartwig Maly, DHBW Mannheim, International Office Lecture 2013
Strategic Management
Te c h n o l o g y - S - C u r ve
Tools

- 71 - © Dr. Hartwig Maly, DHBW Mannheim, International Office Lecture 2013
Strategic Management
D e ve l o p i n g C o r p o ra t e S t ra t e g y
Internal/ external assessments
Case Study

- 72 - © Dr. Hartwig Maly, DHBW Mannheim, International Office Lecture 2013
Strategic Management
S t e p 1 : F ro m S e n s i t i v i t y - A n a l y s i s t o S W OT - A n a l y s i s
Sensitivity Analysis
SWOT-Analysis
i. Remember the current situation of our case study (sales company for laboratory equipment, see page 19) and our proposals to succeed/ achieve our targets.
ii. Define all targets SMART. (see page 12)
iii. Collect internal and external assessments of our company for SWOT-analysis (see page 19 – 25) i. Distances between variables and targets (see page 26, 30)
ii. Strength of arrows (see page 31)
iii. Time axis/ dynamics (see page 32)
iv. Tendencies/ +,- (see page 33)
iv. Allocate internal assessments to Strength or Weaknesses (see pages 44, 45)
v. Allocate external assessments to Opportunities or Threats (see pages 44, 45)
vi. Weigth all items between [0, 10]
vii. Generate action items for important entries in SWOT- matrix (see page 47)
Case Study

- 73 - © Dr. Hartwig Maly, DHBW Mannheim, International Office Lecture 2013
Strategic Management
S W OT - A n a l y s i s
Orienting SWOTS to an objective
used to evaluate the Strengths, Weaknesses,
Opportunities, and Threats involved in a project or in
a business venture. It involves specifying the
objective of the business venture or project and
identifying the internal and external factors that are
favourable and unfavourable to achieving that
objective. The technique is credited to Albert
Humphrey, who led a convention at Stanford
University in the 1960s and 1970s using data from
Fortune 500 companies.
Collecting items
S W
O T
Helpful To achieving the
objective
Harmful To achieving the
objective
Inte
rnal
o
rigi
n
Att
rib
ute
s to
th
e o
rgan
isat
ion
Exte
rnal
o
rigi
n
Att
rib
ute
s to
th
e en
viro
nm
ent
Strength Weaknesses
Opportunities Threats
Case Study

- 74 - © Dr. Hartwig Maly, DHBW Mannheim, International Office Lecture 2013
Strategic Management
S W OT - A n a l y s i s
Generating action items
How can we use and capitalise on each strength?
How can we exploit and benefit from each opportunity?
How can we improve each weakness?
How can we mitigate each threat? Threat?
S W
O T
Case Study

- 75 - © Dr. Hartwig Maly, DHBW Mannheim, International Office Lecture 2013
Strategic Management
S t e p 2 : Po t e n t i a l - A n a l y s i s
Strength/ Weaknesses
1. Find the most important variables out of SW-Matrix and
list of action items (6- 10 including relevant targets)
2. Paint an polygon with scaled axis from [0, 10]
3. Each axis represents one important variable respectively
target.
4. Paint the current status of our sales company according
the weights in your SWOT- matrix (see picture 1)
5. 0 means weakness, 10 strength
6. Connect this points for an polygon represen
ting the current status (see picture 2)
7. Paint the future status according each
variable to achieve the targets.
8. The difference between both pictures
represents the potential of changes
of our company
10 5 0 10 5 0
Picture 1 Picture 2
potential
strength
weakness
Case Study

- 76 - © Dr. Hartwig Maly, DHBW Mannheim, International Office Lecture 2013
Strategic Management
S t e p 3 : Tra n s fe r o f A c t i o n I t e m s t o Va l u e A d d e d C h a i n
Definition
The value chain, also known as value chain analysis, is a
concept from business management that was first described
and popularized by Michael Porter in his 1985 best-seller,
Competitive Advantage: Creating and Sustaining Superior
Performance.
A value chain is a chain of activities. Products pass through all
activities of the chain in order and at each activity the product
gains some value. The chain of activities gives the products
more added value than the sum of added values of all
activities. It is important not to mix the concept of the value
chain with the costs occurring throughout the activities. A
diamond cutter can be used as an example of the difference.
The cutting activity may have a low cost, but the activity adds
much of the value to the end product, since a rough diamond
is significantly less valuable than a cut diamond.
Value-added-chain
Case Study

- 77 - © Dr. Hartwig Maly, DHBW Mannheim, International Office Lecture 2013
Strategic Management
Va l u e A d d e d C h a i n S W OT
Primary Activities
Important Action Items Partial Strategy
Case Study
- 78 - © Dr. Hartwig Maly, DHBW Mannheim, International Office Lecture 2013
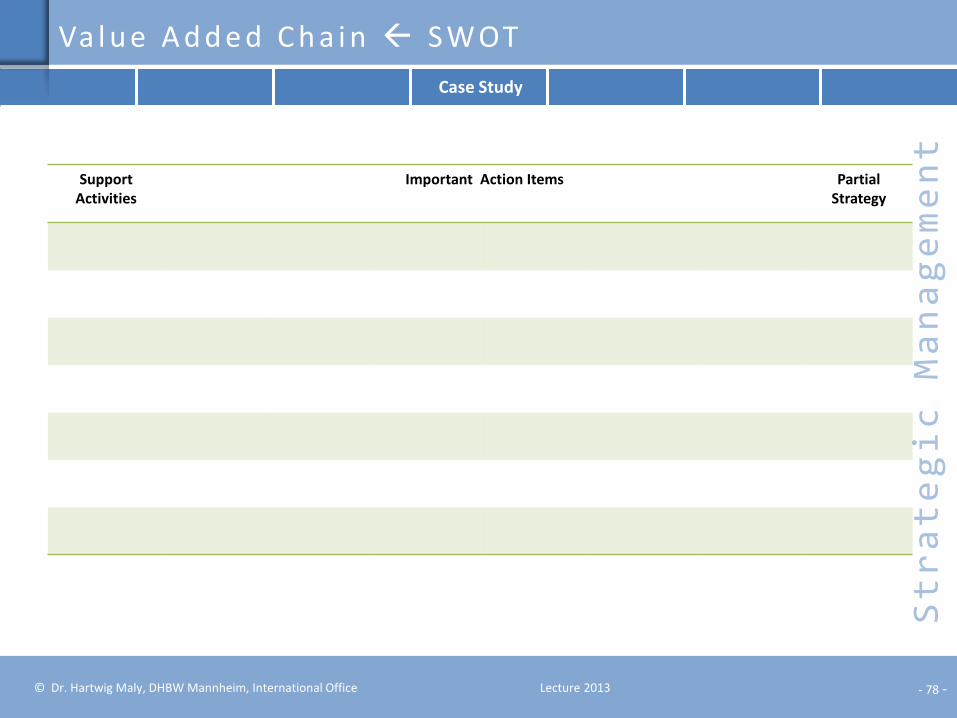
Strategic Management
Va l u e A d d e d C h a i n S W OT
Support Activities
Important Action Items Partial Strategy
Case Study
- 79 - © Dr. Hartwig Maly, DHBW Mannheim, International Office Lecture 2013
Strategic Management
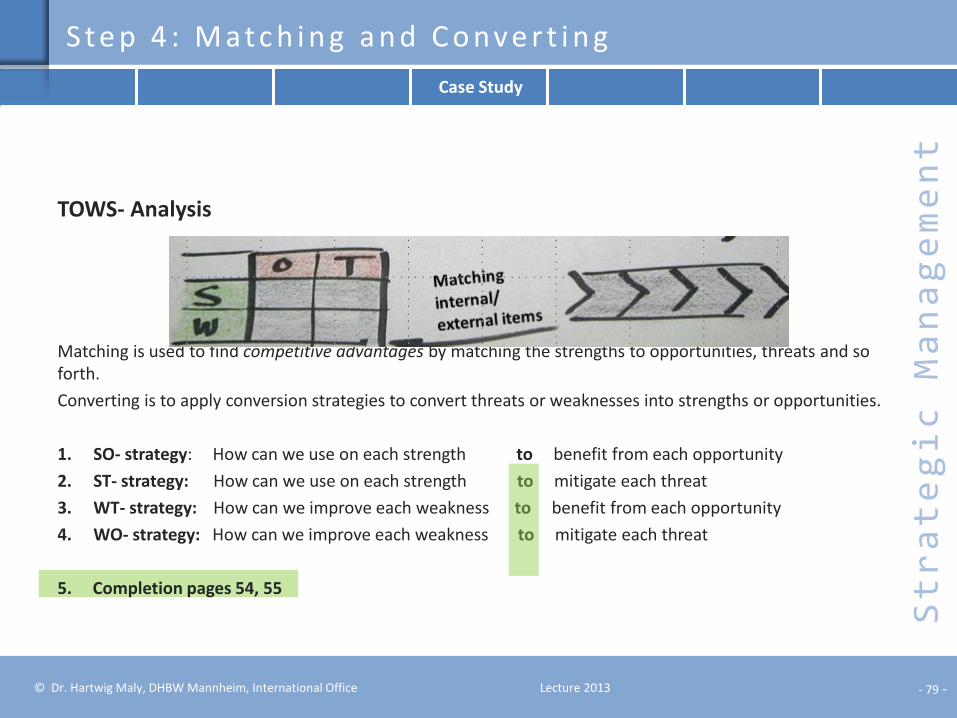
S t e p 4 : M a t c h i n g a n d C o nve r t i n g
TOWS- Analysis
Matching is used to find competitive advantages by matching the strengths to opportunities, threats and so forth.
Converting is to apply conversion strategies to convert threats or weaknesses into strengths or opportunities.
1. SO- strategy: How can we use on each strength to benefit from each opportunity
2. ST- strategy: How can we use on each strength to mitigate each threat
3. WT- strategy: How can we improve each weakness to benefit from each opportunity
4. WO- strategy: How can we improve each weakness to mitigate each threat
5. Completion pages 54, 55
Case Study
- 80 - © Dr. Hartwig Maly, DHBW Mannheim, International Office Lecture 2013
Strategic Management
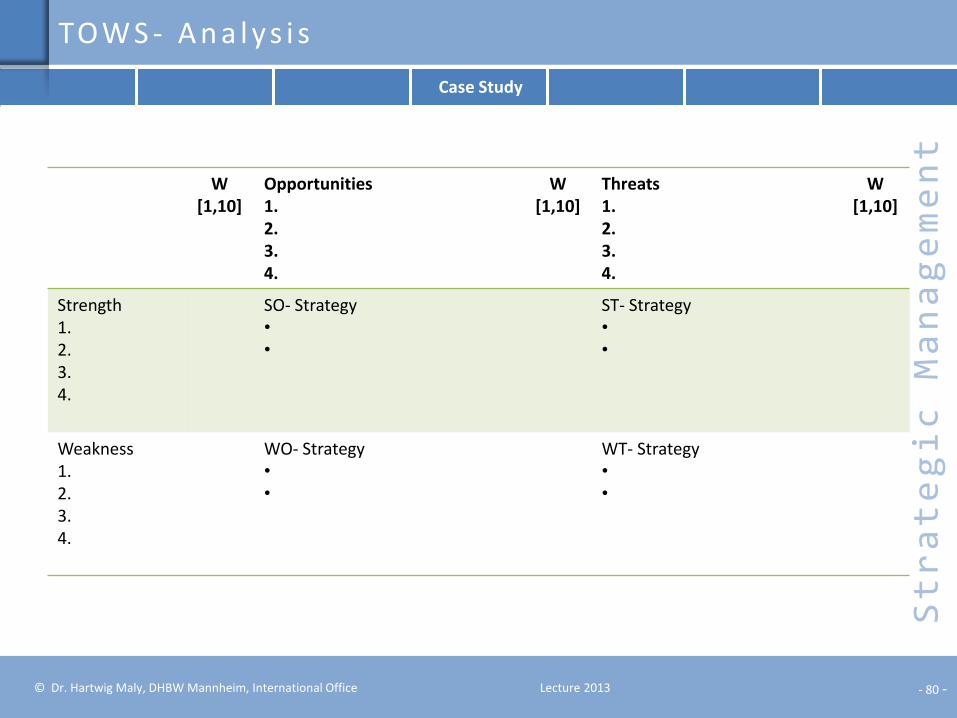
TOW S - A n a l y s i s
W [1,10]
Opportunities 1. 2. 3. 4.
W [1,10]
Threats 1. 2. 3. 4.
W [1,10]
Strength 1. 2. 3. 4.
SO- Strategy • •
ST- Strategy • •
Weakness 1. 2. 3. 4.
WO- Strategy • •
WT- Strategy • •
Case Study

- 81 - © Dr. Hartwig Maly, DHBW Mannheim, International Office Lecture 2013
Strategic Management
Va l u e A d d e d C h a i n TOW S
Support Activities
Important Action Items Partial Strategy
Case Study

- 82 - © Dr. Hartwig Maly, DHBW Mannheim, International Office Lecture 2013
Strategic Management
Va l u e A d d e d C h a i n TOW S
Primary Activities
Important Action Items Partial Strategy
Case Study

- 83 - © Dr. Hartwig Maly, DHBW Mannheim, International Office Lecture 2013
Strategic Management
S t e p 5 : S t ra t e g i e s ( Pa r t i a l / C o r p o ra t e )
Case Study

- 84 - © Dr. Hartwig Maly, DHBW Mannheim, International Office Lecture 2013
Strategic Management
B a l a n c e d S c o re c a rd : F ro m v i s i o n t o a c t i o n
Case Study

- 85 - © Dr. Hartwig Maly, DHBW Mannheim, International Office Lecture 2013
Strategic Management
Fa i r y Ta l e
birthday
Case Study

- 86 - © Dr. Hartwig Maly, DHBW Mannheim, International Office Lecture 2013
Strategic Management
History of the Balanced Scorecard
The BSC was developed in the early 1990’s by Dr
Robert Kaplan (Harvard Business School) and Dr
David Norton (Balanced Scorecard Collaboration)
The balanced scorecard approach was designed to
provide a clear prescription as to what companies
should measure in order to 'balance' the financial
perspective.
The balanced scorecard is a management system (not
only a measurement system) that enables
organizations to clarify their vision and strategy and
translate them into action. It provides feedback
around both the internal business processes and
external outcomes in order to continuously improve
strategic performance and results
Kaplan and Norton describe the innovation of the
balanced scorecard as follows:
"The balanced scorecard retains traditional
financial measures. But financial measures tell the
story of past events, an adequate story for
industrial age companies for which investments in
long-term capabilities and customer relationships
were not critical for success.
These financial measures are inadequate,
however, for guiding and evaluating the journey
that information age companies must make to
create future value through investment in
customers, suppliers, employees, processes,
technology, and innovation."
The BSC was introduced in its current form in 1992
Case Study

- 87 - © Dr. Hartwig Maly, DHBW Mannheim, International Office Lecture 2013
Strategic Management
Why the Balanced Scorecard?
Accounting Based Measures
Shareholder
value
perspective
Economic Value Added
Cash Flow Return on Investment
Corporate wide perspective
Balanced
Information based tool to enhance
management decision making and business
effectiveness
Scorecard
Finance
Process
Customer
Learning
Traditional accounting systems do not measure what is critical to be successful in today’s and tomorrow’s
competitive environment.
New broader management system based on the relevant company metrics is required. The Balanced Scorecard complements the financial measures of past performance with measures of the
drivers of future performance.
Total
shareholder return
Capital
Gain
Net
Cash Flows
=
Traditional financial accounting
measures tend not to take into
account the intangible assets of the
company
new product pipeline
process capabilities
employee skills
customer loyalty
information assets
technology
Traditional accounting measures at best report historical results
+
Case Study

- 88 - © Dr. Hartwig Maly, DHBW Mannheim, International Office Lecture 2013
Strategic Management
Outcome measures, results of past performance
Measures that drive future performance
Internal measures of critical business processes, innovation, learning and growth
Objective quantifiable outcomes
Subjective, judgmental performance drivers of the outcome measures
Balanced Across Multiple Dimensions
External measures for shareholders and customers
All directed to achieving an
integrated business strategy
Communications, informing and learning system, not a
controlling system
Vs
Vs
Vs
Why Balanced? Why Scorecard?
Case Study

- 89 - © Dr. Hartwig Maly, DHBW Mannheim, International Office Lecture 2013
Strategic Management The Balanced Scorecard is management and
communications tool
How do we look to our shareholders?
How do we continue to improve and create value?
Financial perspective
Goals Measures
Customer perspective
Goals Measures
Learning and Growth perspective
Goals Measures
Internal Business perspective
Goals Measures
How do our customers see us?
What business processes must we excel at?
Vision & Strategy
Translating Strategy into Operational Terms
Case Study

- 90 - © Dr. Hartwig Maly, DHBW Mannheim, International Office Lecture 2013
Strategic Management
Clarifying and translating the vision and strategy
clarify the vision
gaining consensus
Communicating and linking
Communications and education
Setting goals
Linking rewards to performance
Planning and target setting
setting targets
aligning strategic initiatives
allocating resources
establishing milestones
Strategic feedback and learning
articulating the shared vision
supplying strategic feedback
facilitating strategy reviews Balanced Scorecard
The emphasis is on fact based business management
BSC – A Management Tool
Case Study

- 91 - © Dr. Hartwig Maly, DHBW Mannheim, International Office Lecture 2013
Strategic Management
The Dashboard consist of 20 – 25 measures and provides a high level over-view of how the organization is performing.
BSC – Dashboard
Case Study
- 92 - © Dr. Hartwig Maly, DHBW Mannheim, International Office Lecture 2013
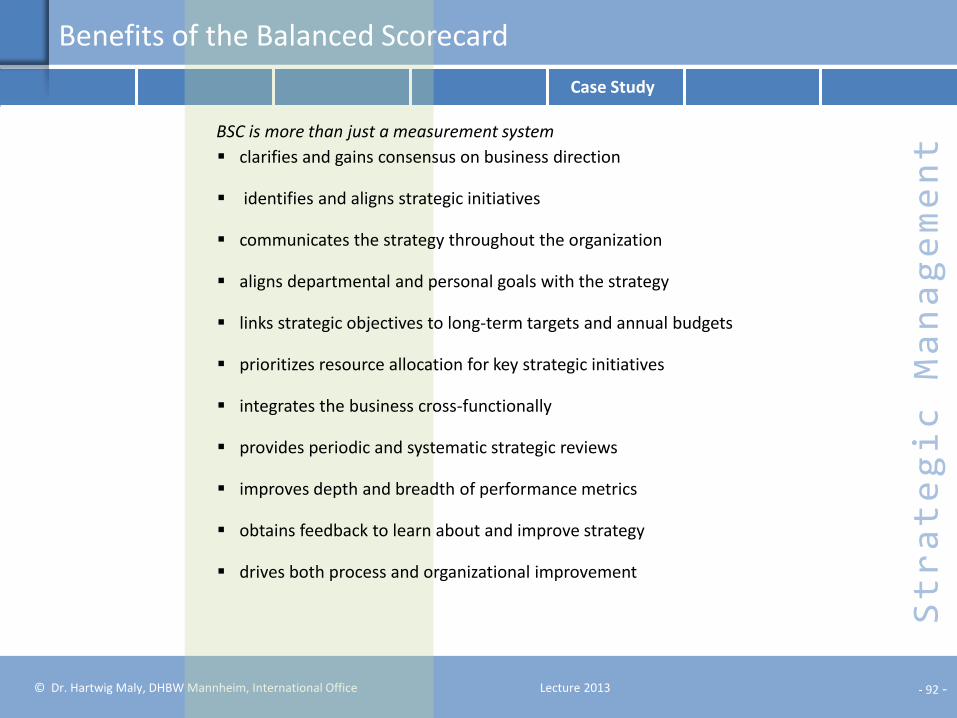
Strategic Management
clarifies and gains consensus on business direction
identifies and aligns strategic initiatives
communicates the strategy throughout the organization
aligns departmental and personal goals with the strategy
links strategic objectives to long-term targets and annual budgets
prioritizes resource allocation for key strategic initiatives
integrates the business cross-functionally
provides periodic and systematic strategic reviews
improves depth and breadth of performance metrics
obtains feedback to learn about and improve strategy
drives both process and organizational improvement
BSC is more than just a measurement system
Benefits of the Balanced Scorecard
Case Study

- 93 - © Dr. Hartwig Maly, DHBW Mannheim, International Office Lecture 2013
Strategic Management Have to be fullfilled
Knock-Out Criteria
BSC is an “Open Book Philosophy”- approach open communication policy
in the whole organisational structure is necessary
Commitment of the top management
Small number of significant “Key Performance Indicators”
Professional project team (architect, communicator)
Convincing benefit-analysis for the whole company – project makes life easier
Necessary to have lot of staying power ( > 3 years)
Convincing strategic analysis
Solution – easy to handle
Case Study

- 94 - © Dr. Hartwig Maly, DHBW Mannheim, International Office Lecture 2013
Strategic Management
Process: Production- and Logistic Management Subject: Turnaround on ground
Strategic Objectives
• Cost effectiveness • Increasing gross profit • Less aeroplanes
• Attract more customers • Stronger commitment of
customers to our comp. • Service on time • Ranking of customers
• Faster turnaround on ground
• Develop important skills • Develop support systems • Focus staff concerning
strategy
Profits and RONA
Increase of Turnover
Less Aero- planes
Finance
Customer
Attract more Customers
Service on Time
Bottom Prices
Fast Ground Turnaround
Training Ground Staff
Strategic Job: „Flugabfertiger“
Strategic System: Manpower Planning
Internal Process
Learning & Growth
S t ra t e g y M a p
Case Study

- 95 - © Dr. Hartwig Maly, DHBW Mannheim, International Office Lecture 2013
Strategic Management
Financial
Customer
Business Process
Learning and Growth
Satisfied and loyal customers lead
to increased revenues and
profitability
Improved processes lead to
improved products and services
for customers
Skilled, creative employees question
the status quo and improve the
business processes
Learning and growth of employees
is the foundation for innovation
and creativity
Balanced Scorecard Perspectives
T h e Fo u r Pe rs p e c t i ve s
There are four perspectives of the business strategy based on a defined hierarchy
Case Study III

- 96 - © Dr. Hartwig Maly, DHBW Mannheim, International Office Lecture 2013
Strategic Management The financial perspective provides focus for the objectives and
measures in the other scorecard perspectives
Risk management
Risk management usually included if it is core to the business I.e. a financial institution.
Alternatively risk is addressed as one of the business strategies if it applies to the overall business operations
Overall Goals
Overall objectives and measures focus on
return on capital employed
economic value added
sales revenue and growth
net cash flow
Specific areas of focus include:
Revenue and Growth Mix
expanding product and service offerings
reaching new customers and markets
changing the product and service mix to higher-value-added offerings
re-pricing products and services
Cost Reduction/Productivity Improvement
lower direct costs of products and services
reduce indirect costs
share common resources across business units
Asset Utilization/Investment Strategy
working capital reduction
greater utilization of asset base
using spare capacity profitably
using scarce resources more efficiently
disposing of assets with inadequate returns on their value
F i n a n c i a l Pe rs p e c t i ve
Case Study

- 97 - © Dr. Hartwig Maly, DHBW Mannheim, International Office Lecture 2013
Strategic Management
Consideration of the customer perspective follows the steps below:
1. Identify and define the market segments and customers in which the organization intends to compete
2. Choose what to do, choose what not to do
3. Once the segment has been selected decide the objectives and measures for the target segments. Objectives typically involve:
gaining market share/account share
customer acquisition
customer retention
customer satisfaction
customer profitability
4. Consider performance measures for each component of the customer value equation:
Customer value
= Product/service attributes + Image + Relationship
Functionality Quality Price Time
Customer Acquisition
The customer perspective provides the external market view
C u s t o m e r Pe rs p e c t i ve
Customer Retention
Market Share
Customer Profitability
Customer Satisfaction
Core Customer Strategies
Case Study

- 98 - © Dr. Hartwig Maly, DHBW Mannheim, International Office Lecture 2013
Strategic Management
Consideration of the internal business process perspective follows the steps below:
1.Define the business processes within the three
aspects of the business operations:
bringing new products and services to market
the efficient consistent and timely delivery of existing
products and services to customers
post sales services including warranty, maintenance
and repair services, treatment of defects and returns
2.Identify the critical business process that will make
the difference for achieving the strategy specifically enable the organization to:
deliver the value propositions that will attract and retain customers in targeted market segments
satisfy shareholder expectations of excellent financial returns
3. Identify those strategic initiatives that will significantly enhance business performance
4. Identify performance measurements for cross-functio- nal business processes that support the strategic
initiatives
Value Created
Business Process Value Equation
=
Time Cost X
Quality Service X
The business process perspective is a measure of internal efficiency and effectiveness
B u s i n e s s P ro c e s s Pe rs p e c t i ve
Case Study

- 99 - © Dr. Hartwig Maly, DHBW Mannheim, International Office Lecture 2013
Strategic Management
The learning and growth strategies and measures relate to those activities that must be performed to enable the organization to continually renew its operations. Activi- ties would include:
enhancing the skills and capabilities of the employees
using IT as an enabling technology to support busi- ness initiatives in the other three perspectives
the creation on an environment that promotes a culture of continuous improvement
the maintenance of an infrastructure to support long term growth and improvement initiatives
The strategies and performance measures concentrate
on the following areas:
people
information systems
motivation, empowerment and alignment
For an organization just to maintain its existing relative performance it must continually improve. One way of achieving this is to foster knowledge management initiatives.
Employee Retention
Employee Productivity
Staff Competencies
Results
Employee Satisfaction
Technology Infrastructure
Climate for Action
Learning and Growth Measurement Framework
Learning a growth concentrates on an organizations’ ability to remain competitive
L e a r n i n g & g ro w t h p e rs p e c t i ve
Case Study
- 100 - © Dr. Hartwig Maly, DHBW Mannheim, International Office Lecture 2013
Strategic Management
Process: Production- and Logistic Management Subject: Turnaround on ground
Strategic Objectives
• Cost effectiveness • Increasing gross profit • Less aeroplanes
• Attract more customers • Stronger commitment of customers to our comp. • Service on time • Ranking of customers
• Faster turnaround on ground • Develop important skills • Develop support systems • Focus staff concerning strategy
S t ra t e g y M a p B S C
Case Study
Profits and RONA
Increase of Turnover
Less Aero- planes
Finance
Customer
Attract more Customers
Service on Time
Bottom Prices
Fast Ground Turnaround
Training Ground Staff
Strategic Job: „Flugabfertiger“
Strategic System: Manpower Planning
Internal Process
Learning & Growth
Performance Indicator (p. 101)
- 101 - © Dr. Hartwig Maly, DHBW Mannheim, International Office Lecture 2013
Strategic Management
Financial
Customer
Internal Process
Learning & Growth
Pro
du
ctio
n-
and
Lo
gist
ic
Inn
ova
tio
n
: Cu
sto
mer
R
elat
ion
s
Pre
crib
ed b
y La
w
S t ra t e g y M a p B S C
Process 1 Process 4 Process 3 Process 2
Case Study

- 102 - © Dr. Hartwig Maly, DHBW Mannheim, International Office Lecture 2013
Strategic Management
Performance Indicator
Process:
• Equity • Turnover/ seat • Leasing costs/ aeroplane
• Regular customers • Number of customers • FAA-rating for arrival on time • Ranking of customers
• Time on ground • Departure on time • Strategic „Stand-By“ • Availability support systems • % of staff as shareholders
S t ra t e g y M a p B S C
Figure
• 30 % • 20 % • 5 %
• 70 % • 12 p.a. • Nr.1 • Nr.1
• 30 minutes • 90 % • 1-70% first year • 100 % • 100 %
Case Study
Profits and RONA
Increase of Turnover
Less Aero- planes
Finance
Customer
Attract more Customers
Service on Time
Bottom Prices
Fast Ground Turnaround
Training Ground Staff
Strategic Job: „Flugabfertiger“
Strategic System: Manpower Planning
Internal Process
Learning & Growth

- 103 - © Dr. Hartwig Maly, DHBW Mannheim, International Office Lecture 2013
Strategic Management
Financial
Customer
Internal Process
Learning & Growth
S t ra t e g y M a p B S C P l a n : M e a s u re
• 30 minutes • 90 %
Performance Indicator
• Equity • Turnover/ seat • Leasing costs/ aeroplane
• Regular customers • Number of customers • FAA-rating for arrival on time • Ranking of customers
• Time on ground • Departure on time
• Strategic „Stand-By“ • Availability support systems • % of staff as shareholders
Planned Figure
• 30 % • 20 % • 5 %
• 70 % • 12 p.a. • Nr.1 • Nr.1
• 1-70% first year • 100 % • 100 %
• Implement CRM System • QM • Customer Loyalty Program
Initiative
Budget
M€
• Optimisation Time Process
• Training Personnal • System for Planning Employment/ Deploy- ment
Case Study

- 104 - © Dr. Hartwig Maly, DHBW Mannheim, International Office Lecture 2013
Strategic Management
The Dashboard consist of 20 – 25 measures and provides a high level over-view of how the organization is performing.
B S C – D a s h b o a rd
Case Study

- 105 - © Dr. Hartwig Maly, DHBW Mannheim, International Office Lecture 2013
Strategic Management
B S C D e t a i l s - Tre n d i n d i c a t o rs
Case Study

- 106 - © Dr. Hartwig Maly, DHBW Mannheim, International Office Lecture 2013
Strategic Management
B S C – S c o re , S t a t u s a n d Tre n d ( e . g . )
Score/Status
A - B
B X 100 = Result
Formula Result/Score
Trend: Score change
Case Study

- 107 - © Dr. Hartwig Maly, DHBW Mannheim, International Office Lecture 2013
Strategic Management
S t ra t e g y M a n a ge m e n t : O rg . I n t e g ra t i o n
Risk Management Supporting the Risk Management Process: • Identification • Analysis and Assessment • Risk Handling • Risk Controlling • Evaluation of impacts on a system of strategic objectives like the BSC
Balanced Scorecard
• Strategy visualization • Connection of Strategies to Objectives, KPIs, and Initiatives • Detailed Strategy Analysis • SEM Business Content
Value Driver Tree
• Visualization of Value Drivers • Value Driver Management • Analysis of Impact and Influence • Simuation
Value Based Management
• Identification of Value Drivers • Management of external expectations • Management of internal value creation
Strategy Management Balanced Scorecard Risk Management Strategy Templates Value Driver Trees Value Based Management
Performance Measurement
Management Cockpit Measure Builder Measure Catalogs Benchmarking
Business Consolidation
Legal Consolidation
Management
Consolidation
Business Planning Modelling Planning Framework Planning-Applications Simulation
Stakeholder Relationship Management Integration of Stakeholders into
the Strategic Management Process
Investor Portal
Balanced Scorecard
• Strategy visualization • Connection of Strategies to Objectives, KPIs, and Initiatives • Detailed Strategy Analysis • SEM Business Content
Case Study

- 108 - © Dr. Hartwig Maly, DHBW Mannheim, International Office Lecture 2013
Strategic Management
Q u e st i o n
Strategic Controlling (15/ 100 pt)
Your company seems to be
back on track until your
‚Balanced Scorecard‘ looks
confusing.
i. Why? Tell your story. Remember the hierarchy of the scorecards (5)
ii. Explain BSC‘ s underlying philosophy. (5)
iii. Mention some strenth and weaknesses of BSC. (5)

- 109 - © Dr. Hartwig Maly, DHBW Mannheim, International Office Lecture 2013
Strategic Management
D r. H a r t w i g M a l y
15 Jahre Manager in internationalen Konzernen
Seit 10 Jahren selbständig als Trainer mit Schwerpunkten Führungskräfte-Nachwuchs
Kommunikation/ Konfliktmanagement
Projektmanagement
Strategisches Management
Seminare im öffentlichen Dienst Stadt Mannheim (STIRN): Projektmanagement/ Change/ Coaching Führungskräfte, seit 2006
Stadt Offenburg: Projektmanagement ab 2009
Regierungspräsidium Neustadt: Coaching, 2010
Vorlesungen zu Management-/ Führungsthemen Duale Hochschule Baden-Württemberg seit 2004
Blog: www.shapingALPHApower.wordpress.com Artikel zu Führungsthemen
Website: www.maly-seminare.de Seminare, Vorlesungen
Facebook : Shaping Alpha Power – Coaching für die Top- Talente Links zu interessanten Artikeln für Führungskräfte