Lecture 1-10: Spectrograms - UCL · UCL/PLS/SPSC2003/WEEK1-10/110920/1 Lecture 1-10: Spectrograms...
10
UCL/PLS/SPSC2003/WEEK1-10/110920/1 Lecture 1-10: Spectrograms Overview 1. Spectra of dynamic signals: like many real world signals, speech changes in quality with time. But so far the only spectral analysis we have performed has assumed that the signal is stationary: that it has constant quality. We need a new kind of analysis for dynamic signals. A suitable analogy is that we have spectral ‘snapshots’ when what we really want is a spectral ‘movie’. Just like a real movie is made up from a series of still frames, we can display the spectral properties of a changing signal through a series of spectral snapshots. 2. The spectrogram: a spectrogram is built from a sequence of spectra by stacking them together in time and by compressing the amplitude axis into a 'contour map' drawn in a grey scale. The final graph has time along the horizontal axis, frequency along the vertical axis, and the amplitude of the signal at any given time and frequency is shown as a grey level. Conventionally, black is used to signal the most energy, while white is used to signal the least. 3. Spectra of short and long waveform sections: we will get a different type of movie if we choose each of our snapshots to be of relatively short sections of the signal, as opposed to relatively long sections. This is because the spectrum of a section of speech signal that is less than one pitch period long will tend to show formant peaks; while the spectrum of a longer section encompassing several pitch periods will show the individual harmonics, see figure 1-10.1. The same effect occurs if we use a bank of bandpass filters to perform the spectral analysis, see figure 1-10.2. If each filter has a relatively wide bandwidth, then the output follows rapid changes in the input, while if each filter is relatively narrow then each filter smoothes out those changes. However wide filters do not allows us to locate the frequency components in the signal as accurately as narrow filters, see figure 1-10.3. 4. Wide and narrow-band spectrograms: if each of the spectral snapshots are of sections of about 3ms (or if we use bandpass filters of about 300Hz) then we see the individual vocal fold pulses and the ringing of the formant resonances in the spectrogram. This is called a wide-band spectrogram (for historical reasons). If each of the spectral snapshots are of sections of about 20ms (or if we use bandpass filters of about 45Hz) then we see the harmonics of the voice source, with those near formant frequencies being darker. This is called a narrow-band spectrogram. 5. Spectrograms of common signals and speech-like signals: Figures 1-10.4 shows wide and narrow spectrograms of some simple signals. Figures 1-10.5 and 1-10.6 demonstrate the filtering of a pulse train and white noise through a simple resonator in terms of the effect on the spectrograms of the signals. Reading Choose at least one from: Bordern, Harris & Raphael, Speech Science Primer (4 th edition), Chapter 7: Research Tools in Speech Science, pp209-214. Essentials of practical spectral analysis. Rosen & Howell, Signals and Systems for Speech and Hearing (1 st edition), Chapter 11: The Sound Spectrograph. Thorough description.
Transcript of Lecture 1-10: Spectrograms - UCL · UCL/PLS/SPSC2003/WEEK1-10/110920/1 Lecture 1-10: Spectrograms...
UCL/PLS/SPSC2003/WEEK1-10/110920/1
Lecture 1-10: Spectrograms
Overview
1. Spectra of dynamic signals: like many real world signals, speech changes in quality with
time. But so far the only spectral analysis we have performed has assumed that the signal
is stationary: that it has constant quality. We need a new kind of analysis for dynamic
signals. A suitable analogy is that we have spectral ‘snapshots’ when what we really want
is a spectral ‘movie’. Just like a real movie is made up from a series of still frames, we
can display the spectral properties of a changing signal through a series of spectral
snapshots.
2. The spectrogram: a spectrogram is built from a sequence of spectra by stacking them
together in time and by compressing the amplitude axis into a 'contour map' drawn in a
grey scale. The final graph has time along the horizontal axis, frequency along the
vertical axis, and the amplitude of the signal at any given time and frequency is shown as
a grey level. Conventionally, black is used to signal the most energy, while white is used
to signal the least.
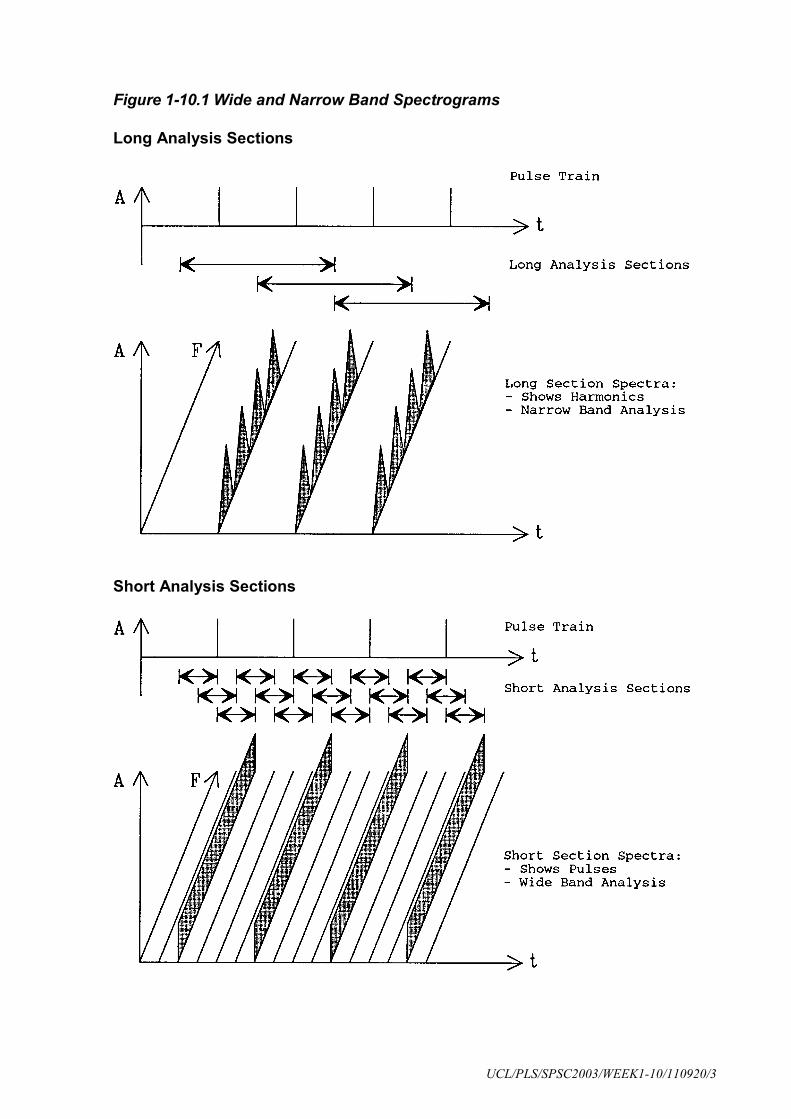
3. Spectra of short and long waveform sections: we will get a different type of movie if
we choose each of our snapshots to be of relatively short sections of the signal, as opposed
to relatively long sections. This is because the spectrum of a section of speech signal that
is less than one pitch period long will tend to show formant peaks; while the spectrum of a
longer section encompassing several pitch periods will show the individual harmonics, see
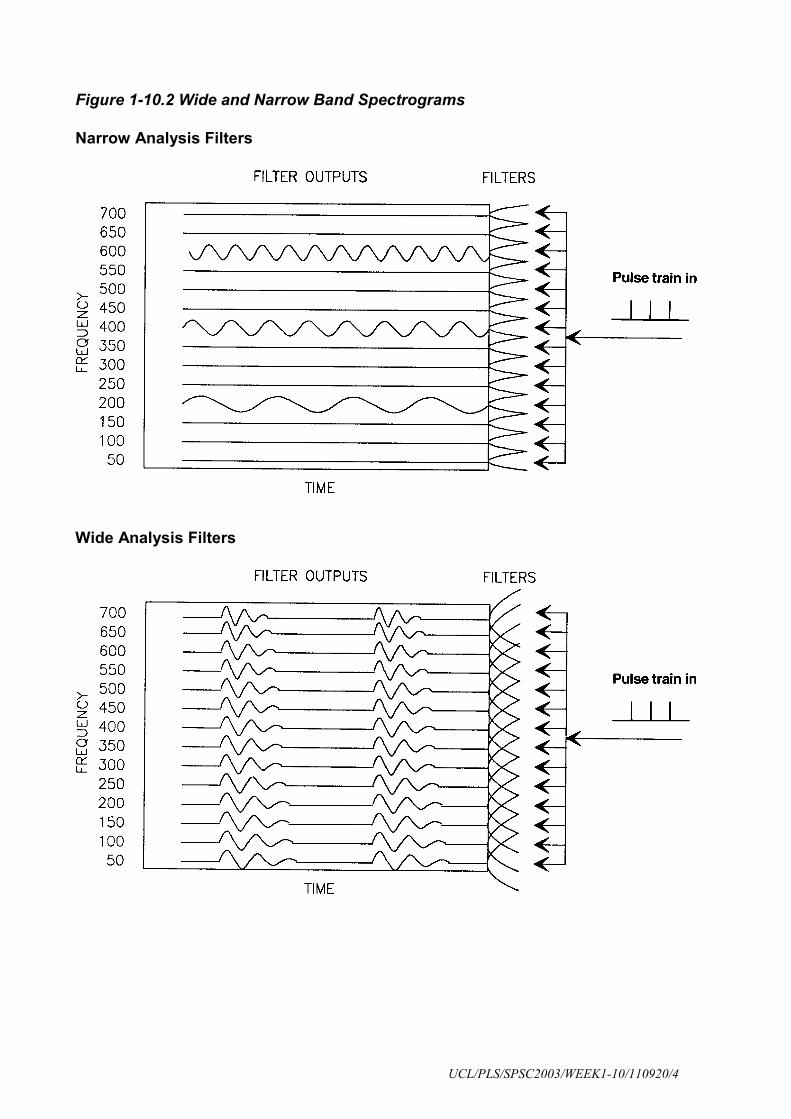
figure 1-10.1. The same effect occurs if we use a bank of bandpass filters to perform the
spectral analysis, see figure 1-10.2. If each filter has a relatively wide bandwidth, then the
output follows rapid changes in the input, while if each filter is relatively narrow then
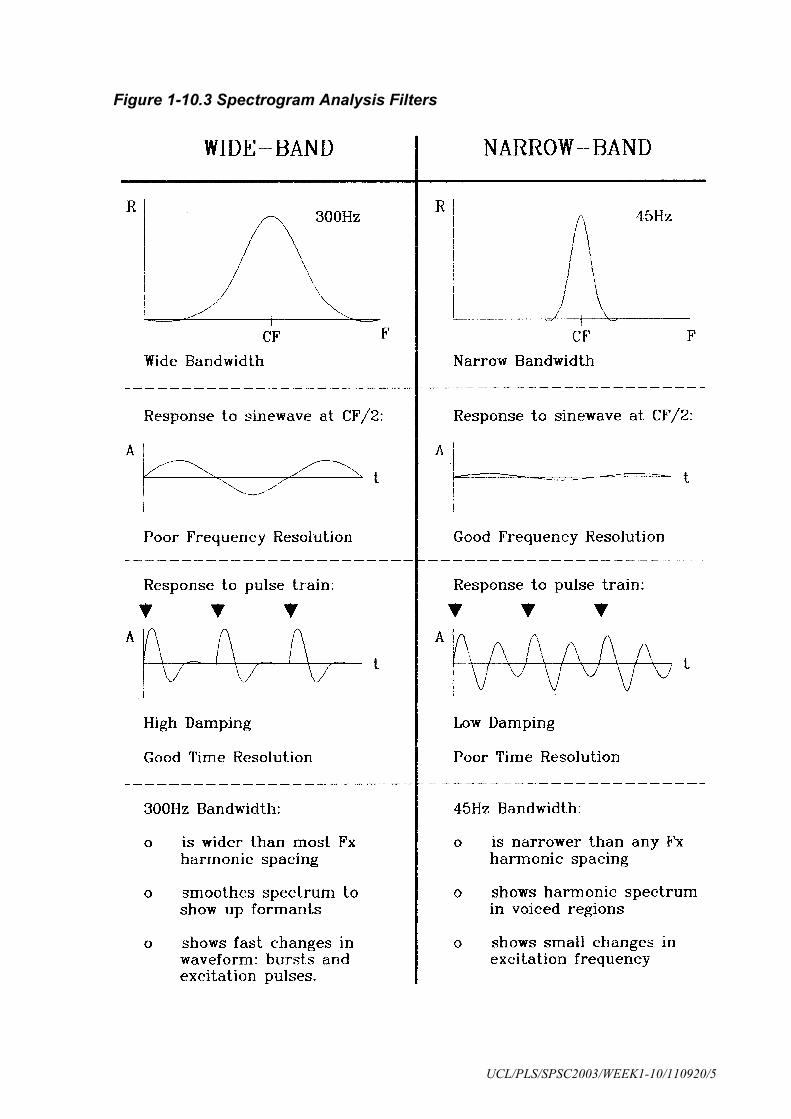
each filter smoothes out those changes. However wide filters do not allows us to locate
the frequency components in the signal as accurately as narrow filters, see figure 1-10.3.
4. Wide and narrow-band spectrograms: if each of the spectral snapshots are of sections
of about 3ms (or if we use bandpass filters of about 300Hz) then we see the individual
vocal fold pulses and the ringing of the formant resonances in the spectrogram. This is
called a wide-band spectrogram (for historical reasons). If each of the spectral snapshots
are of sections of about 20ms (or if we use bandpass filters of about 45Hz) then we see the
harmonics of the voice source, with those near formant frequencies being darker. This is
called a narrow-band spectrogram.
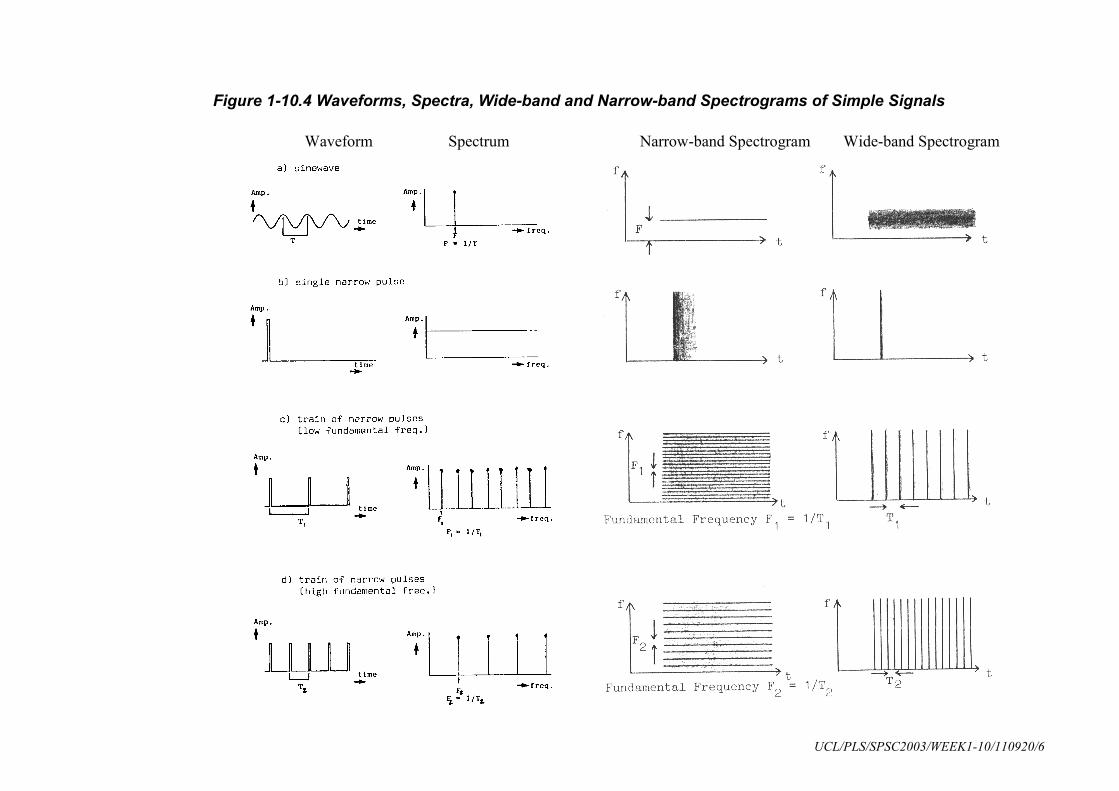
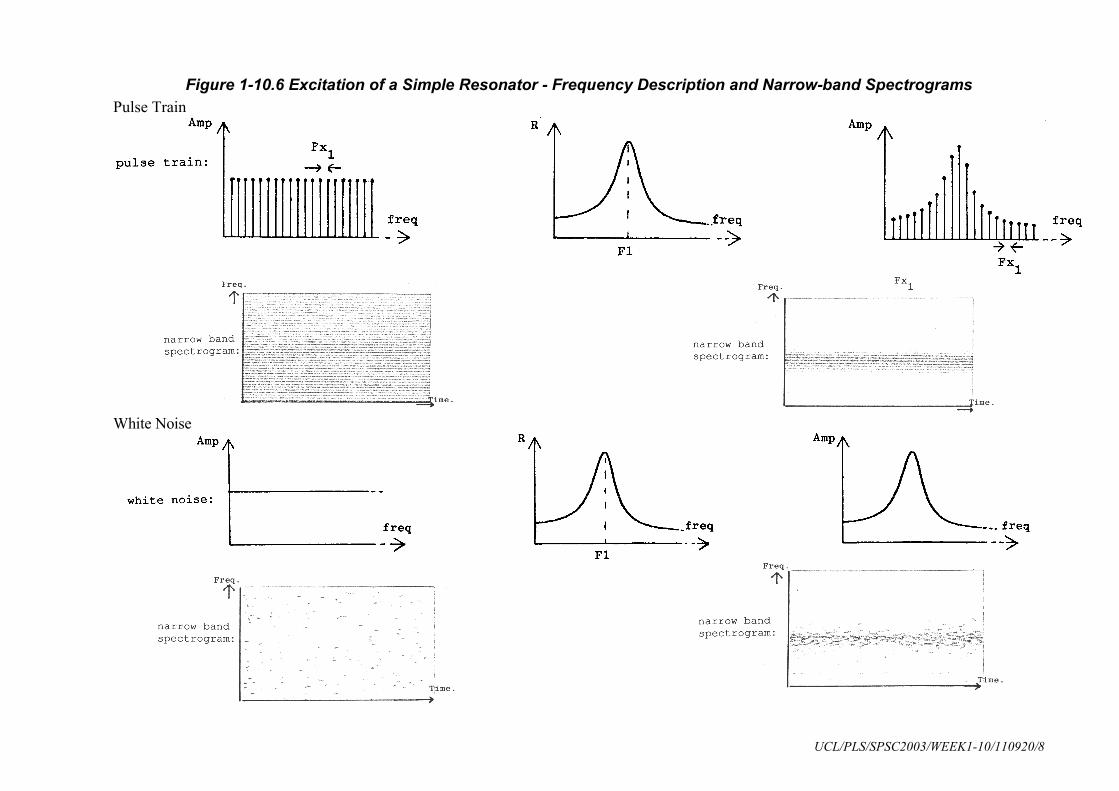
5. Spectrograms of common signals and speech-like signals: Figures 1-10.4 shows wide
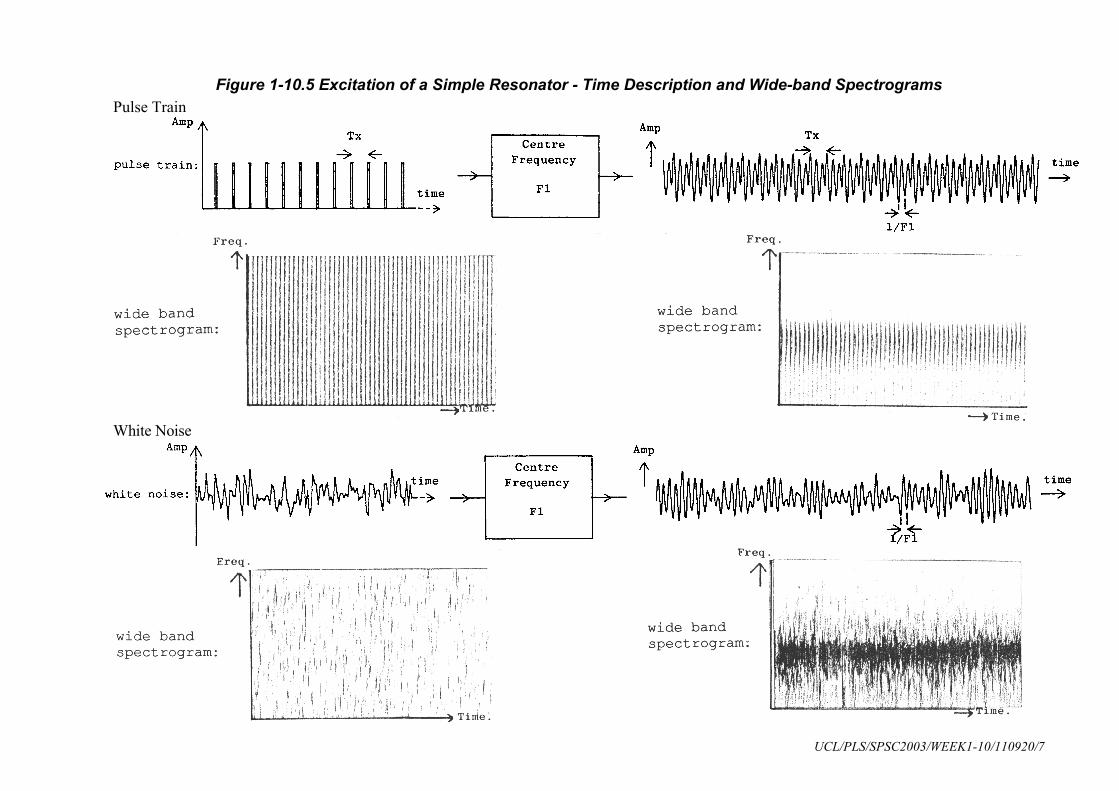
and narrow spectrograms of some simple signals. Figures 1-10.5 and 1-10.6 demonstrate
the filtering of a pulse train and white noise through a simple resonator in terms of the
effect on the spectrograms of the signals.
Reading
Choose at least one from:
� Bordern, Harris & Raphael, Speech Science Primer (4th
edition), Chapter 7: Research
Tools in Speech Science, pp209-214. Essentials of practical spectral analysis.
� Rosen & Howell, Signals and Systems for Speech and Hearing (1st edition), Chapter
11: The Sound Spectrograph. Thorough description.
UCL/PLS/SPSC2003/WEEK1-10/110920/2
Learning Objectives
You can help yourself understand and remember this week’s teaching by doing the following
activities before next week:
1. Describe in your own words what a spectrogram shows, how a spectrographic analysis
system works, and why spectrograms are particularly useful in the study of speech.
2. Practise making sketches of low-frequency and high-frequency pulse trains on wide-band
and narrow-band spectrograms.
3. Sketch a wide-band and a narrow-band spectrogram of each of a monophthongal and a
diphthongal vowel on each of a steady and a falling pitch (i.e. 8 sketches in total).
If you are unsure about any of these, make sure you ask questions in the lab or in tutorial.
Definitions
Spectrogram: Graph of the energy content of a signal expressed as function of frequency and
time. Graph of a signal in which the vertical axis is frequency, the horizontal axis is time, and
amplitude is shown on a grey-scale.
Wide-band spectrogram: A spectrogram produced using an analysis scheme which emphasises
temporal changes in the signal: with short-time spectrum calculations (about 3ms) or highly
damped analysis filters (about 300Hz).
Narrow-band spectrogram: A spectrogram produced using an analysis scheme which
emphasises frequency changes in the signal: with long-time spectrum calculations (about 20ms)
or lightly damped analysis filters (about 45Hz).
Reflections
You can improve your learning by reflecting on your understanding. Here are some
suggestions for questions related to this week’s teaching.
1. Why do we need spectrographic analysis at all?
2. Think of some other graphs that use colouring to signify a value on a third axis.
3. Why does the spectrum of a single pulse not show any harmonics?
4. How big are the analysis sections in narrow-band spectrograms compared to the size of a
pitch period?
5. How big are the analysis sections in wide-band spectrograms compared to the size of a
pitch period? Does the sex of the speaker affect this?
6. Sketch what can be seen on a wide band spectrogram of a vowel between one larynx
pulse and the next.
7. Why are formant bars darker than their surroundings on a wide band spectrogram of a
vowel?
8. On a narrow-band spectrogram, why are the darkest harmonics found near to formant
frequencies?
9. Do you think it would be possible to ‘read’ a spectrogram to find out what was said?
UCL/PLS/SPSC2003/WEEK1-10/110920/3
Figure 1-10.1 Wide and Narrow Band Spectrograms
Long Analysis Sections
Short Analysis Sections
UCL/PLS/SPSC2003/WEEK1-10/110920/4
Figure 1-10.2 Wide and Narrow Band Spectrograms
Narrow Analysis Filters
Wide Analysis Filters
UCL/PLS/SPSC2003/WEEK1-10/110920/5
Figure 1-10.3 Spectrogram Analysis Filters
UCL/PLS/SPSC2003/WEEK1-10/110920/6
Figure 1-10.4 Waveforms, Spectra, Wide-band and Narrow-band Spectrograms of Simple Signals
Waveform Spectrum Narrow-band Spectrogram Wide-band Spectrogram
UCL/PLS/SPSC2003/WEEK1-10/110920/7
Figure 1-10.5 Excitation of a Simple Resonator - Time Description and Wide-band Spectrograms
Pulse Train
White Noise
UCL/PLS/SPSC2003/WEEK1-10/110920/8
Figure 1-10.6 Excitation of a Simple Resonator - Frequency Description and Narrow-band Spectrograms
Pulse Train
White Noise
UCL/PLS/SPSC2003/WEEK1-10/110920/9
Lab 1-10: Introduction to Spectrograms
Introduction
A spectrogram is a representation of how the frequency content of a signal changes with time.
Time is displayed along the x-axis, frequency along the y-axis, and the amount of energy in
the signal at any given time and frequency is displayed as a level of grey. During regions of
silence, and at frequency regions where there is little energy, the spectrogram appears white;
dark regions indicate areas of energy - caused for example by vocal fold closures, harmonics,
or formant vibration in a speech signal.
We use two types of spectrogram for speech study: one which emphasises the frequency
aspects by using long signal sections or narrow analysis filters, and one which emphasises the
temporal aspects by using short signal sections or wide analysis filters. Narrow-band
spectrograms are convenient for investigating characteristics of the source: they show the
harmonics of the vocal fold vibration for example. Wide-band spectrograms are convenient
for investigating characteristics of the vocal tract filter: they highlight the vocal tract
resonances (formants) by showing how they continue to vibrate after a vocal fold pulse has
passed through.
Learning Objectives
• to gain familiarity with spectrographic representations of sounds
• to appreciate the differences between narrow-band and wide-band spectrograms
• to learn how features of speech sounds appear on spectrograms
• to understand how the spectrogram can lead to quantitative analysis of the source and
filter aspects of speech sounds.
Apparatus
You are provided with a program that can display a spectrogram and a spectral cross section
of a speech signal. Within the upper window you can choose to display any combination of
waveform, narrow-band and wide-band spectrograms. Within the lower window you can
display the spectrum between the cursors and an estimated vocal tract filter response.
(http://www.phon.ucl.ac.uk/resource/sfs/)
Two versions of the diphthong .`H. have been generated synthetically on a computer system.
Each comprises only two formants excited by a pulse train. The versions are:
aimono .`H. monotone - has a constant fundamental frequency
aifall .`H. falling - has a falling fundamental frequency
You can also record your own versions of .`H. and other sounds.
Method
To measure fundamental frequency from the narrow band spectrogram, find the frequency of
the 10th
harmonic and divide by 10. To measure the fundamental period from the wide band
spectrogram, zoom the display to measure the duration of 5 periods and divide by 5. To
measure formant frequencies from the wide-band spectrogram, estimate the frequency at the
centre of the main spectral peaks, or use the estimated filter frequency response.
UCL/PLS/SPSC2003/WEEK1-10/110920/10
Observations
1. Display a wide-band spectrogram of aimono.
a. Make a rough, labelled sketch showing striations, formant resonances and formant
movement. Make sure you label the axes.
b. Measure the formant frequencies at the beginning and the end.
2. Display a narrow-band spectrogram of aimono.
a. Make a rough, labelled sketch showing harmonics and varying harmonic amplitude.
b. Why does a harmonic vary in amplitude over the width of the spectrogram?
3. Display a wide-band spectrogram of aifall.
a. Compare with the sketch you made in 1a. What differences do you observe?
b. If this were a human speaking, what would be the cause of those differences?
4. Display a narrow-band spectrogram of aifall.
a. Compare with the sketch you made in 2a. What differences do you observe?
b. Measure the fundamental frequency at the beginning and the end.
5. Record your own production of .`H..
a. Measure the first three formant frequencies at the beginning and the end of the
diphthong. Compare with 1b. What is the perceptual effect of these differences?
b. Measure the fundamental frequency at the beginning and the end of your production.
Compare with 4b. What is the perceptual effect of these differences?
6. Display a wide-band spectrogram of about 6 periods at the end of aifall.
a. Sketch how the response of the formants is damped between one pulse and the next.
b. How would your sketch change if the fundamental frequency were higher?
c. How would your sketch change if the formant frequencies were higher?
d. How would your sketch change if the damping of the formants were greater?
7. Record and print a spectrogram of your own name. See if you can find the parts of the
spectrogram corresponding to elements of its pronunciation.
Concluding Remarks
Why is the narrow band spectrogram more useful when you are studying intonation, and the
wide band spectrogram more useful when you are studying vowel quality?