A deep learning approach with event-related spectral EEG data in … · 117 EEG spectrograms, we...
21
1 A deep learning approach with event-related spectral EEG data in attentional deficit 1 hyperactivity disorder 2 3 Laura Dubreuil-Vall 1,2,3,* , Giulio Ruffini 3 , Joan A. Camprodon 1 4 5 1 Department of Psychiatry, Massachusetts General Hospital, Harvard Medical School 6 Laboratory for Neuropsychiatry and Neuromodulation 7 149 13 th st. 2 nd floor. 8 Boston, MA 02129 9 10 2 Department of Psychiatry and Clinical Psychobiology, Universitat de Barcelona 11 Casanova 143 12 08036 Barcelona 13 Spain 14 15 3 Neuroelectrics Corporation 16 210 Broadway, Suite 201 17 Cambridge, MA, 02139 18 USA 19 20 *Corresponding author 21 Laura Dubreuil-Vall, M.Sc. 22 Laboratory for Neuropsychiatry and Neuromodulation 23 Department of Psychiatry 24 Massachusetts General Hospital 25 Harvard Medical School 26 149 13 th st. 2 nd floor. 27 Boston, MA 02129 28 Email: [email protected] 29 Phone: +1 617 390 6447 30 31 All rights reserved. No reuse allowed without permission. author/funder, who has granted medRxiv a license to display the preprint in perpetuity. The copyright holder for this preprint (which was not peer-reviewed) is the . https://doi.org/10.1101/19005611 doi: medRxiv preprint
Transcript of A deep learning approach with event-related spectral EEG data in … · 117 EEG spectrograms, we...
1
A deep learning approach with event-related spectral EEG data in attentional deficit 1
hyperactivity disorder 2
3
Laura Dubreuil-Vall1,2,3,*, Giulio Ruffini3, Joan A. Camprodon1 4 51Department of Psychiatry, Massachusetts General Hospital, Harvard Medical School 6Laboratory for Neuropsychiatry and Neuromodulation 7149 13th st. 2nd floor. 8Boston, MA 02129 9 102Department of Psychiatry and Clinical Psychobiology, Universitat de Barcelona 11Casanova 143 1208036 Barcelona 13Spain 14 153Neuroelectrics Corporation 16210 Broadway, Suite 201 17Cambridge, MA, 02139 18USA 19 20
*Corresponding author 21
Laura Dubreuil-Vall, M.Sc. 22Laboratory for Neuropsychiatry and Neuromodulation 23Department of Psychiatry 24Massachusetts General Hospital 25Harvard Medical School 26149 13th st. 2nd floor. 27Boston, MA 02129 28Email: [email protected] 29Phone: +1 617 390 6447 30 31
All rights reserved. No reuse allowed without permission. author/funder, who has granted medRxiv a license to display the preprint in perpetuity.
The copyright holder for this preprint (which was not peer-reviewed) is the.https://doi.org/10.1101/19005611doi: medRxiv preprint
2
Attention deficit hyperactivity disorder (ADHD) is a heterogeneous neurodevelopmental disorder that affects 5% 32
of the pediatric and adult population worldwide. The diagnosis remains essentially clinical, based on history and 33
exam, with no available biomarkers. In this paper, we describe a deep convolutional neural network (DCNN) for 34
ADHD classification derived from the time-frequency decomposition of electroencephalography data (EEG), 35
particularly of event-related potentials (ERP) during the Flanker Task collected from 20 ADHD adult patients and 36
20 healthy controls (HC). The model reaches a classification accuracy of 88%, superior to resting state EEG 37
spectrograms and with the key advantage, compared with other machine learning approaches, of avoiding the need 38
for manual selection of EEG spectral or channel features. Finally, through the use of feature visualization 39
techniques, we show that the main features exciting the DCNN nodes are a decreased power in the alpha band and 40
an increased power in the delta-theta band around 100ms for ADHD patients compared to HC, suggestive of 41
attentional and inhibition deficits, which have been previously suggested as pathophyisiological signatures of 42
ADHD. While confirmation with larger clinical samples is necessary, these results highlight the potential of this 43
methodology to develop CNS biomarkers of practical clinical utility. 44
45
All rights reserved. No reuse allowed without permission. author/funder, who has granted medRxiv a license to display the preprint in perpetuity.
The copyright holder for this preprint (which was not peer-reviewed) is the.https://doi.org/10.1101/19005611doi: medRxiv preprint

3
Introduction 46
47
Attention-deficit hyperactivity disorder (ADHD) is a neurodevelopmental disorder characterized by 48
deficits in attention, impulsivity (motor and non-motor) and executive dysfunction. It is associated with high 49
morbidity and disability1,2, and affects up to 5% of adults worldwide3-5. The diagnosis of ADHD remains 50
essentially clinical, based on history and exam. It can be supported by neuropsychological assessments, but given 51
the heterogeneous cognitive profiles in patients with ADHD, these provide a supportive, not fully diagnostic, 52
function. Significantly, there are many different conditions that present with disordered attention, impulsivity and 53
dysexecutive syndromes, and the range of normal cognitive profiles with variable strengths and weaknesses in 54
these domains is wide, often complicating the differential diagnosis. Hence, a biomarker to reduce the inherent 55
uncertainty of clinical diagnosis would be of great value. 56
57
Electroencephalographic (EEG) signals contain rich information associated with functional dynamics in the brain. 58
The use of EEG in ADHD began more than 75 years ago with Jasper et al.6 reporting an increase in the EEG 59
power of low frequencies in fronto-central areas. Since then, human electrophysiological studies using EEG 60
spectral analyses and event-related potentials (ERPs) have established relevant signatures of executive dysfunction 61
in ADHD7. In contrast to spontaneous EEG, ERPs reflect changes in the electrical activity of the brain that are 62
time-locked to the occurrence of a specific event, that is, a response to a discrete external stimulus or an internal 63
mental process8. ERPs also provide non-invasive neurophysiological measurements with high temporal resolution, 64
allowing to assess dysfunctional brain dynamics, including cognitive processes that may not be apparent at the 65
behavioral level9,10. Indeed, ERPs are commonly used clinically in neurophysiological diagnostic units to support 66
the assessment of neuropsychiatric disorders (e.g., multiple sclerosis11) and sensory disorders (e.g., screening of 67
neonates for hearing impairments12). 68
69
Artificial neural networks (ANNs) have recently become a promising application of artificial intelligence (AI) in 70
healthcare13. Machine learning, a subtype of AI, and deep learning, a specialized sub-field of machine learning, 71
have been increasingly used in clinical research with promising results. Machine learning can be described as the 72
practice of using algorithms to train a system by using large amounts of data, with the goal of giving it the ability 73
to learn how to perform a specific task, and then make an accurate classification or prediction. Deep learning is a 74
subset of machine learning algorithms that break down the tasks in smaller units (neural networks, NNs) often 75
All rights reserved. No reuse allowed without permission. author/funder, who has granted medRxiv a license to display the preprint in perpetuity.
The copyright holder for this preprint (which was not peer-reviewed) is the.https://doi.org/10.1101/19005611doi: medRxiv preprint
4
providing higher levels of accuracy. 76
77
NNs are characterized by their network architecture, defined by the anatomical layout of its connected processing 78
units, the artificial “neurons”, according to a loss or optimization function that specifies the overall goal of the 79
learning process. Connections are “trained”, or taught how to do the desired task, by using a training algorithm 80
that iteratively changes parameters of the NN such that the target function is ultimately optimized based on the 81
inputs the NN receives. There are different types of NNs with different designs and architectures derived from 82
different principles, or conceived for different purposes. The most basic ones are the feed-forward NNs (FNNs), in 83
which activity is propagated unidirectionally layer-by-layer from the input up to the output stage, with no feedback 84
connections within or between layers. We have previously used a specific type of FFNs (feed-forward 85
autoencoders) for the analysis of EEG data with promising outcomes14. Recurrent Neural Networks (RNN) are 86
another type of NN that, unlike FFNs, are based on architectures with feedback (“recurrent”) connections within or 87
between layers. In related work, we used Echo State Networks (ESNs), a particular type of RNN, to classify 88
Parkinson patients from HC using EEG time-frequency decompositions15 with successful results. The main 89
limitation of RNNs is, however, their computational cost16. In addition, one of the main critics to deep NN is their 90
“black-box” nature, i.e., the difficulty in tracing a prediction back to which features are important and 91
understanding how the network reached the final output, which will be later addressed in this study. 92
93
Previous studies have successfully classified ADHD patients from HC using machine learning techniques with 94
accuracies of more than 90%17-23, but the selection of disease-characterizing features from EEG was done 95
manually after an extensive search in the frequency or time domain. However, EEG signals exhibit non-linear 96
dynamics (chaotic signals that do not behave linearly and cannot be represented as combination of basic sub-97
signals) and non-stationarity across temporal scales (signals with a mean and variance that do not stay constant 98
over time) that cannot be studied properly using classical machine learning approaches. There is a need for tools 99
capable of capturing the rich spatiotemporal hierarchical structures hidden in these signals. In a previous study24, 100
we trained a machine learning system with pre-defined complexity metrics of time-frequency decompositions of 101
EEG data that showed statistically significant differences between REM Sleep Behavior Disorder (RBD) patients 102
and HC, indicating that such metrics may be useful for classification or scoring. While this approach is useful in 103
several domains, it would be advantageous to use methods where the relevant features are found directly by the 104
algorithms instead of pre-defining them manually. 105
All rights reserved. No reuse allowed without permission. author/funder, who has granted medRxiv a license to display the preprint in perpetuity.
The copyright holder for this preprint (which was not peer-reviewed) is the.https://doi.org/10.1101/19005611doi: medRxiv preprint
5
106
With the goal of building a discrimination system that can classify ADHD patients from HCs, here we explore a 107
deep learning approach inspired by recent successes in image classification using Deep Convolutional Neural 108
Networks (DCNNs), a particular type of NN designed to exploit compositional and translationally invariant 109
features in the data that are present in EEG, i.e., features that are recognizable even if their appearance varies in 110
some way16. These networks were originally developed to deal with image data (2D arrays) from different 111
channels or audio data25, and more recently, EEG data26,27. Similarly, here we train a DCNN with multi-channel 112
two-dimensional time-frequency maps (spectrograms or 2D time-frequency maps), representing EEG spectral 113
dynamics as images with the equivalent image depth provided by multiple EEG channels. These networks treat 114
EEG-channel data as an audio file, and our approach mimics similar uses of deep networks in that domain. 115
Specifically, we use a similar strategy as the one presented by Ruffini et al.28, but instead of using spontaneous 116
EEG spectrograms, we use ERP spectrograms (also called Event-Related Spectral perturbation, ERSP) recorded 117
during a Flanker-Eriksen Task (EFT), a well-established experimental task to assess sustained attention, conflict 118
monitoring and response inhibition. Our assumption is that relevant qualities of ERP data are contained in 119
compositional features embedded in this time-frequency representation. Particularly, we expect that DCNNs may 120
be able to efficiently learn to identify features in the time-frequency domain associated to event-related bursting 121
across frequency bands that may help separate classes, similar to what is known as “bump analysis”29. For 122
comparison purposes, we also trained a RNN based on Long Short-Term Memory (LSTM) networks, which can 123
learn long sequences of data but require higher computational demands, and a Shallow Neural Network (SNN) as 124
a baseline, a more basic type of network with only one layer. We also compared the performance of the ERSP data 125
with a dataset of spontaneous EEG data recorded while the participants were at resting state. Lastly, we propose 126
the utilization of deep learning visualization techniques for the mechanistic interpretation of results, particularly 127
the method popularly known as DeepDream30. This is important to identify pathophysiological features driving the 128
translational and clinical value of the application, and for the optimized further development and acceptance of 129
such techniques in the clinical domain, where black-box approaches have been extensively criticized. 130
131
Methods 132
Participants 133
A total of 40 participants including 20 healthy adults (10 males, 10 females) and 20 ADHD adult patients (10 134
males, 10 females) participated in the present study (Table 1). The inclusion criteria for ADHD patients consisted 135
All rights reserved. No reuse allowed without permission. author/funder, who has granted medRxiv a license to display the preprint in perpetuity.
The copyright holder for this preprint (which was not peer-reviewed) is the.https://doi.org/10.1101/19005611doi: medRxiv preprint

6
of a diagnosis of ADHD made by a board-certified clinician according to the Diagnostic and Statistical Manual of 136
Mental Disorders, Fifth Edition (DSM-5)31. Symptom profiles and severity were assessed with the Adult ADHD 137
Self-Report Scale (ASRS-v1.1)32. Patients were either off stimulant medications or, if undergoing treatment with 138
stimulants, were asked to discontinue two days prior to the experiment, under a physician-guided protocol, and 139
allowed to resume afterwards. Psychiatric comorbidities were allowed as long as ADHD was the primary 140
diagnosis. Psychosis, bipolar disorder, substance use disorder and neurological conditions were exclusion criteria. 141
Healthy participants were included if they did not have any psychiatric or neurologic condition and were not 142
taking any psychoactive medications. All participants gave informed and written consent for participation. The 143
study was approved by the Partners HealthCare System’s Institutional Review Board and all experiments were 144
performed in accordance with relevant guidelines and regulations at Massachusetts General Hospital. 145
Table 1. Participant characteristics
ADHD (n=20) HC (n=20) Significance
Demographic mean (SD)* mean (SD)* p value (T test)
Age 43.85 (14.78) 29.90 (10.77) 0.0006
Females 10 (50%) 10 (50%) 0.5
Baseline Scores
ASRS 62.6 (9.17) 36.47 (11.33) <0.0001
Current medications – N (%)
No medication 11 (55%)
Adderall 2 (15%)
Vyvanse 2 (10%)
Concerta 1 (5%)
Verapamil 1 (5%)
Aspirin 1 (5%)
Levothyroxine 1 (5%)
Modafinil 1 (5%) Abbreviations. SD: Standard Deviation 146(*) All figures are mean (Standard Deviation) unless otherwise specified. 147 148
Experimental Task: Eriksen-Flanker task (EFT) 149
Each patient underwent three identical experimental sessions separated by 1-2 weeks in which they performed the 150
Eriksen-Flanker task (EFT) (Figure 1) while EEG data was recorded. The EFT is a classic behavioral paradigm in 151
which subjects must attend and respond to the direction of a central arrow that is surrounded (“flanked”) by 152
distracting stimuli. The flanking arrows can either have the same (congruent trials) or opposing (incongruent trials) 153
orientation as the central one. Participants are instructed to press the left or right arrow buttons in a keyboard 154
following the direction of the central arrow, ignoring the flankers. In this study there were a total of 140 trials, and 155
each subject had a different, fully random sequence of congruent and incongruent trials, with 2 congruent trials for 156
All rights reserved. No reuse allowed without permission. author/funder, who has granted medRxiv a license to display the preprint in perpetuity.
The copyright holder for this preprint (which was not peer-reviewed) is the.https://doi.org/10.1101/19005611doi: medRxiv preprint
7
each incongruent trial, in order to build a tendency towards the prepotent congruent responses and thus increase 157
the difficulty of conflict detection in incongruent trials. Only incongruent trials were used for classification 158
purposes, as they are the ones that most elicit the conflict-related ERP components that characterize the executive 159
function subtasks of selective attention, inhibition and cognitive control33, primarily impaired in ADHD. The 160
accuracy (percentage of correct/incorrect responses) and the reaction time (RT) were measured for each trial, 161
while also recording EEG data during the task. RT of single trials was introduced into a Generalized Linear Model 162
with Mixed Effects (GLMM) with a Gamma distribution, with Group as a fixed factor (ADHD/HC) and Subject 163
ID as a random intercept. Accuracy was also modeled using a generalized logistic regression model with mixed 164
effects and a binomial distribution. 165
166
167
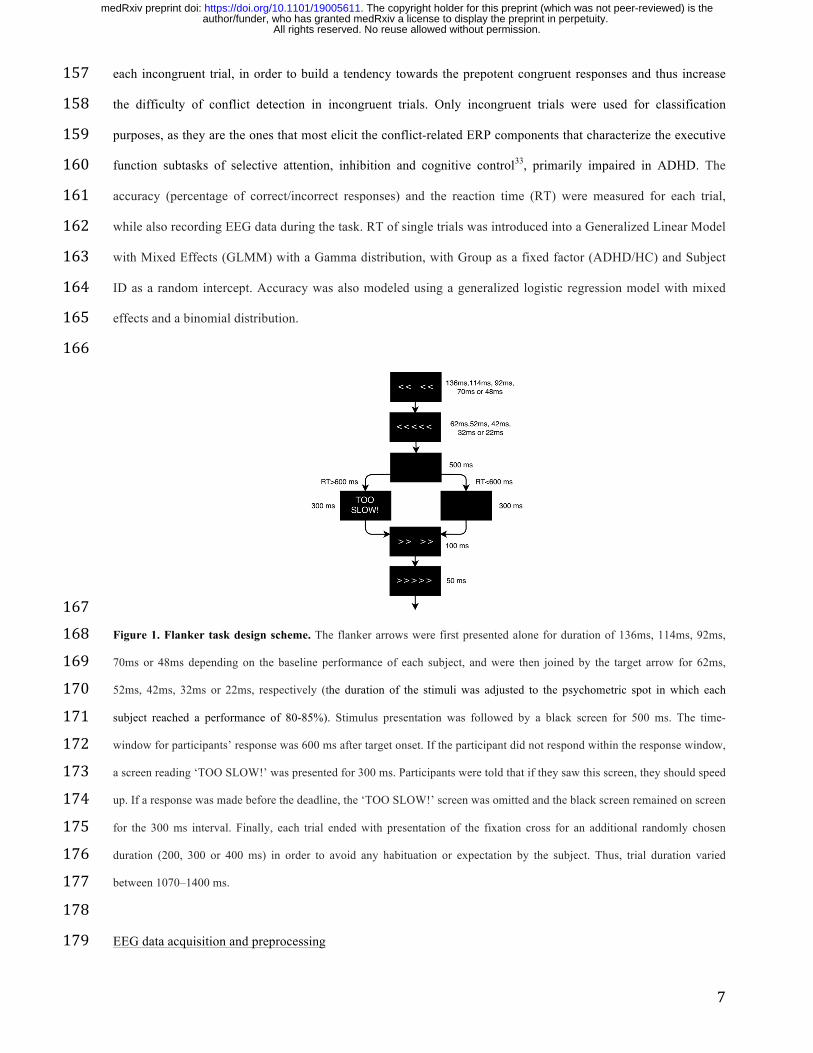
Figure 1. Flanker task design scheme. The flanker arrows were first presented alone for duration of 136ms, 114ms, 92ms, 168
70ms or 48ms depending on the baseline performance of each subject, and were then joined by the target arrow for 62ms, 169
52ms, 42ms, 32ms or 22ms, respectively (the duration of the stimuli was adjusted to the psychometric spot in which each 170
subject reached a performance of 80-85%). Stimulus presentation was followed by a black screen for 500 ms. The time-171
window for participants’ response was 600 ms after target onset. If the participant did not respond within the response window, 172
a screen reading ‘TOO SLOW!’ was presented for 300 ms. Participants were told that if they saw this screen, they should speed 173
up. If a response was made before the deadline, the ‘TOO SLOW!’ screen was omitted and the black screen remained on screen 174
for the 300 ms interval. Finally, each trial ended with presentation of the fixation cross for an additional randomly chosen 175
duration (200, 300 or 400 ms) in order to avoid any habituation or expectation by the subject. Thus, trial duration varied 176
between 1070–1400 ms. 177
178
EEG data acquisition and preprocessing 179
All rights reserved. No reuse allowed without permission. author/funder, who has granted medRxiv a license to display the preprint in perpetuity.
The copyright holder for this preprint (which was not peer-reviewed) is the.https://doi.org/10.1101/19005611doi: medRxiv preprint
8
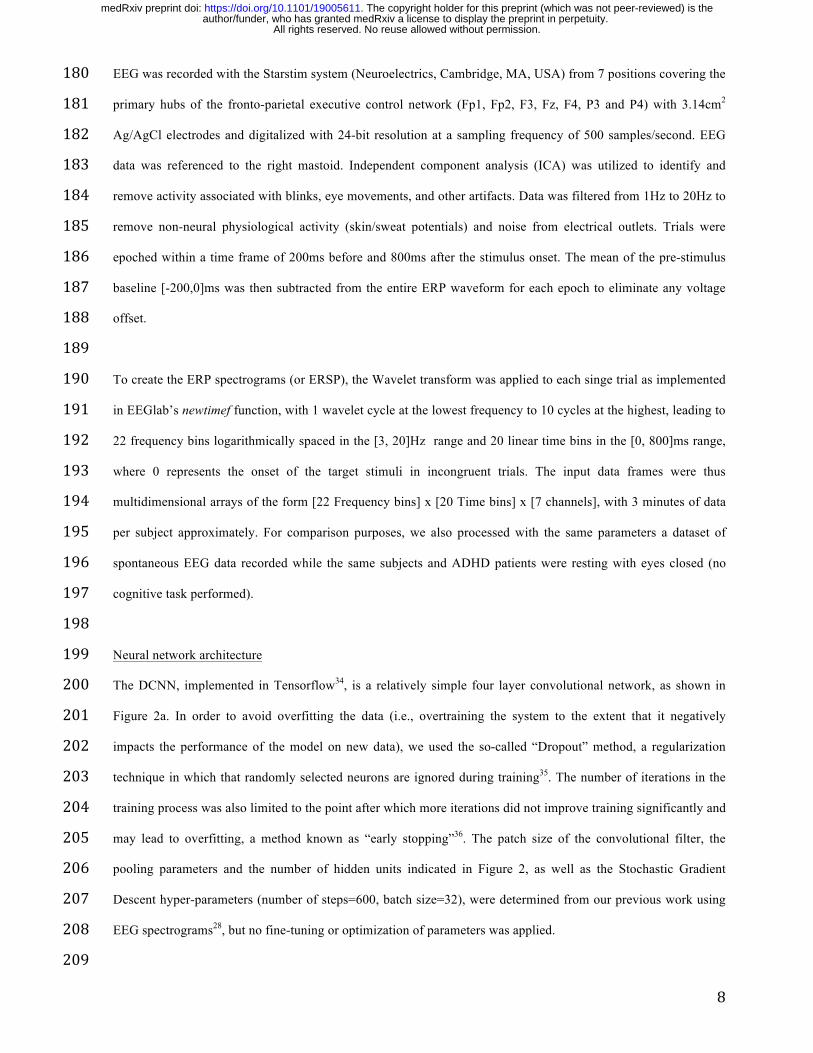
EEG was recorded with the Starstim system (Neuroelectrics, Cambridge, MA, USA) from 7 positions covering the 180
primary hubs of the fronto-parietal executive control network (Fp1, Fp2, F3, Fz, F4, P3 and P4) with 3.14cm2 181
Ag/AgCl electrodes and digitalized with 24-bit resolution at a sampling frequency of 500 samples/second. EEG 182
data was referenced to the right mastoid. Independent component analysis (ICA) was utilized to identify and 183
remove activity associated with blinks, eye movements, and other artifacts. Data was filtered from 1Hz to 20Hz to 184
remove non-neural physiological activity (skin/sweat potentials) and noise from electrical outlets. Trials were 185
epoched within a time frame of 200ms before and 800ms after the stimulus onset. The mean of the pre-stimulus 186
baseline [-200,0]ms was then subtracted from the entire ERP waveform for each epoch to eliminate any voltage 187
offset. 188
189
To create the ERP spectrograms (or ERSP), the Wavelet transform was applied to each singe trial as implemented 190
in EEGlab’s newtimef function, with 1 wavelet cycle at the lowest frequency to 10 cycles at the highest, leading to 191
22 frequency bins logarithmically spaced in the [3, 20]Hz range and 20 linear time bins in the [0, 800]ms range, 192
where 0 represents the onset of the target stimuli in incongruent trials. The input data frames were thus 193
multidimensional arrays of the form [22 Frequency bins] x [20 Time bins] x [7 channels], with 3 minutes of data 194
per subject approximately. For comparison purposes, we also processed with the same parameters a dataset of 195
spontaneous EEG data recorded while the same subjects and ADHD patients were resting with eyes closed (no 196
cognitive task performed). 197
198
Neural network architecture 199
The DCNN, implemented in Tensorflow34, is a relatively simple four layer convolutional network, as shown in 200
Figure 2a. In order to avoid overfitting the data (i.e., overtraining the system to the extent that it negatively 201
impacts the performance of the model on new data), we used the so-called “Dropout” method, a regularization 202
technique in which that randomly selected neurons are ignored during training35. The number of iterations in the 203
training process was also limited to the point after which more iterations did not improve training significantly and 204
may lead to overfitting, a method known as “early stopping”36. The patch size of the convolutional filter, the 205
pooling parameters and the number of hidden units indicated in Figure 2, as well as the Stochastic Gradient 206
Descent hyper-parameters (number of steps=600, batch size=32), were determined from our previous work using 207
EEG spectrograms28, but no fine-tuning or optimization of parameters was applied. 208
209
All rights reserved. No reuse allowed without permission. author/funder, who has granted medRxiv a license to display the preprint in perpetuity.
The copyright holder for this preprint (which was not peer-reviewed) is the.https://doi.org/10.1101/19005611doi: medRxiv preprint
9
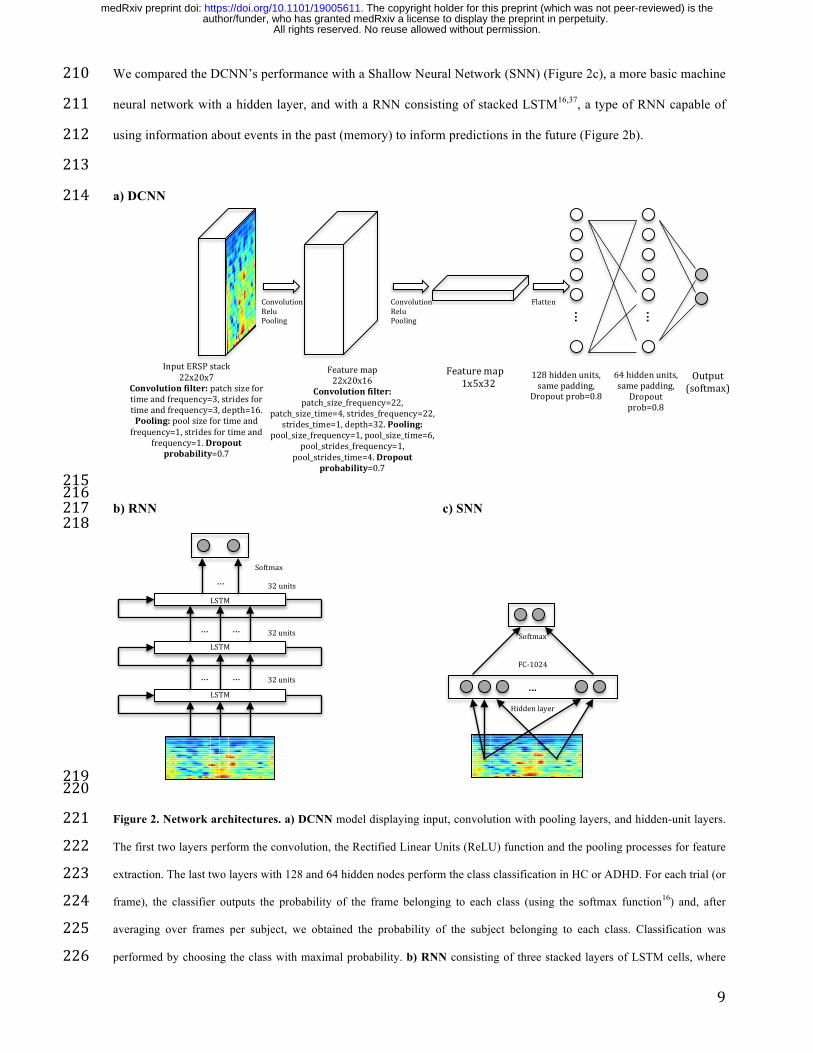
We compared the DCNN’s performance with a Shallow Neural Network (SNN) (Figure 2c), a more basic machine 210
neural network with a hidden layer, and with a RNN consisting of stacked LSTM16,37, a type of RNN capable of 211
using information about events in the past (memory) to inform predictions in the future (Figure 2b). 212
213
a) DCNN 214
215 216b) RNN c) SNN 217 218
219 220
Figure 2. Network architectures. a) DCNN model displaying input, convolution with pooling layers, and hidden-unit layers. 221
The first two layers perform the convolution, the Rectified Linear Units (ReLU) function and the pooling processes for feature 222
extraction. The last two layers with 128 and 64 hidden nodes perform the class classification in HC or ADHD. For each trial (or 223
frame), the classifier outputs the probability of the frame belonging to each class (using the softmax function16) and, after 224
averaging over frames per subject, we obtained the probability of the subject belonging to each class. Classification was 225
performed by choosing the class with maximal probability. b) RNN consisting of three stacked layers of LSTM cells, where 226
Featuremap22x20x16
Convolutionfilter:patch_size_frequency=22,
patch_size_time=4,strides_frequency=22,strides_time=1,depth=32.Pooling:
pool_size_frequency=1,pool_size_time=6,pool_strides_frequency=1,
pool_strides_time=4.Dropoutprobability=0.7
Featuremap1x5x32
…
128hiddenunits,samepadding,
Dropoutprob=0.8
…
64hiddenunits,samepadding,Dropoutprob=0.8
Output(softmax)
ConvolutionReluPooling
ConvolutionReluPooling
Flatten
InputERSPstack22x20x7
Convolutionfilter:patchsizefortimeandfrequency=3,stridesfortimeandfrequency=3,depth=16.Pooling:poolsizefortimeandfrequency=1,stridesfortimeand
frequency=1.Dropoutprobability=0.7
LSTM
LSTM
LSTM
…
……
……
Softmax
32units
32units
32units
Softmax
FC-1024
...
Hiddenlayer
All rights reserved. No reuse allowed without permission. author/funder, who has granted medRxiv a license to display the preprint in perpetuity.
The copyright holder for this preprint (which was not peer-reviewed) is the.https://doi.org/10.1101/19005611doi: medRxiv preprint
10
each cell uses as input the outputs of the previous one. Each cell used 32 hidden units, and dropout was used to regularize it. c) 227
SNN architecture used for comparison with one layer of 1024 units. 228
229
Performance assessment 230
The performance metrics assessed for each architecture were accuracy (probability of good a classification) and 231
area under the curve (AUC)38. Classification performance was validated using the leave-pair out cross-validation 232
(LPO), a method for model selection and performance assessment of deep learning algorithms that consists of 233
training the network N=20x20=400 times (all possible combinations of pairing 1 HC with 1 ADHD), holding one 234
sample from each group out from the training set at a time, and measuring the performance using the held out pair 235
as a test set38. 236
237
To account for the significant differences in age between the ADHD and HC groups, we applied the Inverse 238
Probability Weighting (IPW) method39, which assigns different weights to the subjects in the training process 239
according to their propensity score40. The IPW method lead to the same performance without adjustment in all 240
architectures, thus ruling out the effect of age as a confounding factor. 241
242
Feature visualization 243
Once the network was trained, it was used to find out what type of inputs optimally excite the output nodes using a 244
method popularly known as “DeepDream”, which refers to the generation of synthetic images that produce desired 245
activations in a trained deep network by exaggerating small features within them30. The algorithm maximizes a 246
particular class score using gradient descent, starting from a null or random noise image. In particular, we 247
computed the DeepDream spectrograms averaged over N=400 experiments by maximizing the output logits after 248
30 iterations in steps of 1, initializing with different random images (seeds). 249
250
Results 251
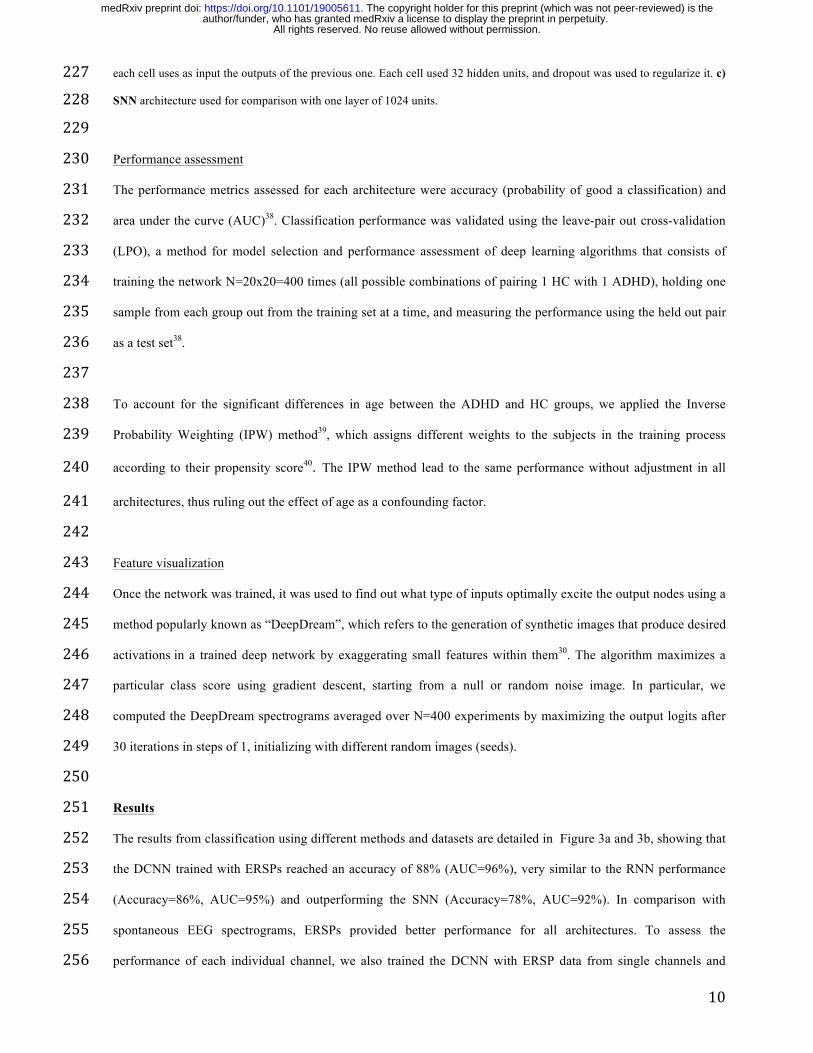
The results from classification using different methods and datasets are detailed in Figure 3a and 3b, showing that 252
the DCNN trained with ERSPs reached an accuracy of 88% (AUC=96%), very similar to the RNN performance 253
(Accuracy=86%, AUC=95%) and outperforming the SNN (Accuracy=78%, AUC=92%). In comparison with 254
spontaneous EEG spectrograms, ERSPs provided better performance for all architectures. To assess the 255
performance of each individual channel, we also trained the DCNN with ERSP data from single channels and 256
All rights reserved. No reuse allowed without permission. author/funder, who has granted medRxiv a license to display the preprint in perpetuity.
The copyright holder for this preprint (which was not peer-reviewed) is the.https://doi.org/10.1101/19005611doi: medRxiv preprint
11
found that frontal (F3, Fz and F4) and parietal electrodes (P3, P4) provide the best performance compared to 257
frontopolar (Fp1, Fp2) electrodes (Figure 3c and 3d). 258
259
260Figure 3. Performance assessment. Neural networks accuracy (a) and AUC (b) with ERSP and spontaneous EEG data. 261
Electrode accuracy (c) and AUC (d) in a DCNN trained with ERSP data from single channels. Error bars indicate mean square 262
error. 263
264
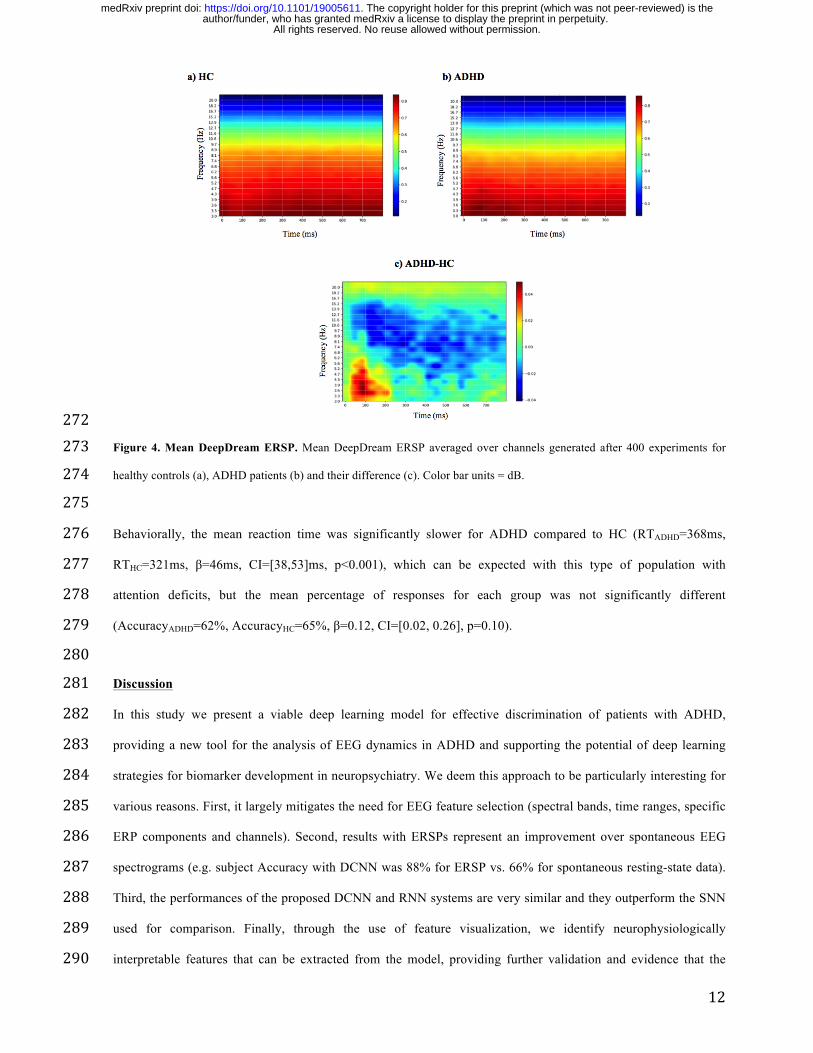
The mean DeepDream ERSP averaged over channels can be seen in Figure 4 (see Table S1 for individual 265
channels). The difference between groups reveals that the main feature that optimally excites the network nodes is 266
an increased power for the ADHD group in the delta-theta band (3-7 Hz) around 100 ms and a decreased power in 267
the alpha band (7-12 Hz) along the entire time course, with a residual decrease in theta and beta. Note that the 268
patterns shown in the DeepDream ERSP are very similar to the patterns of the ERSP computed from the real data 269
(Table S1), thus showing that the network is actually learning real neurophysiologically identifiable differences 270
between groups. 271
All rights reserved. No reuse allowed without permission. author/funder, who has granted medRxiv a license to display the preprint in perpetuity.
The copyright holder for this preprint (which was not peer-reviewed) is the.https://doi.org/10.1101/19005611doi: medRxiv preprint
12
272Figure 4. Mean DeepDream ERSP. Mean DeepDream ERSP averaged over channels generated after 400 experiments for 273
healthy controls (a), ADHD patients (b) and their difference (c). Color bar units = dB. 274
275
Behaviorally, the mean reaction time was significantly slower for ADHD compared to HC (RTADHD=368ms, 276
RTHC=321ms, β=46ms, CI=[38,53]ms, p<0.001), which can be expected with this type of population with 277
attention deficits, but the mean percentage of responses for each group was not significantly different 278
(AccuracyADHD=62%, AccuracyHC=65%, β=0.12, CI=[0.02, 0.26], p=0.10). 279
280
Discussion 281
In this study we present a viable deep learning model for effective discrimination of patients with ADHD, 282
providing a new tool for the analysis of EEG dynamics in ADHD and supporting the potential of deep learning 283
strategies for biomarker development in neuropsychiatry. We deem this approach to be particularly interesting for 284
various reasons. First, it largely mitigates the need for EEG feature selection (spectral bands, time ranges, specific 285
ERP components and channels). Second, results with ERSPs represent an improvement over spontaneous EEG 286
spectrograms (e.g. subject Accuracy with DCNN was 88% for ERSP vs. 66% for spontaneous resting-state data). 287
Third, the performances of the proposed DCNN and RNN systems are very similar and they outperform the SNN 288
used for comparison. Finally, through the use of feature visualization, we identify neurophysiologically 289
interpretable features that can be extracted from the model, providing further validation and evidence that the 290
All rights reserved. No reuse allowed without permission. author/funder, who has granted medRxiv a license to display the preprint in perpetuity.
The copyright holder for this preprint (which was not peer-reviewed) is the.https://doi.org/10.1101/19005611doi: medRxiv preprint
13
network performance is not driven by noise or artifact signals in the data and providing a mechanistic model with 291
added value to understand pathophysiology. 292
293
The higher accuracy provided by DCNN and RNN compared to SNN proves that the complex deep approaches 294
with more layers and units provide better performance than more shallow networks. The similar performance of 295
DCNN compared to RNN shows, however, that the higher computational demands of RNN do not provide better 296
performance than the DCNN approaches, thus proving DCNN as a more efficient method than RNN. 297
298
The fact that ERSP data provide better performance than spontaneous EEG data with all architectures also shows 299
that event-related data from a highly yield task that elicits the primary executive functions impaired in ADHD is a 300
better predictor than spontaneous EEG data recorded while the participants are at resting state. 301
302
Finally, through the use of feature visualization we show that the main spectral features picked up by the DCNN 303
nodes are a decrease in alpha activity over the entire time course and an increased delta-theta activity around 100 304
ms for ADHD patients compared to HC. There is evidence that an increased alpha activity (or alpha Event-Related 305
Synchronization, ERS) in conflict and inhibitory tasks is related with an improved inhibition of the prepotent 306
response, reflecting a top-down inhibitory control process41. Therefore, we interpret the decrease in alpha power in 307
ADHD as a deficit in cognitive control. On the other hand, the increased delta-theta activity is localized to 100ms 308
and is probably related to the increase in N100 amplitude in the time domain (Table S1). N100 is a visual sensory 309
evoked potential that is thought to index sensory analysis of simple stimulus features and whose amplitude is 310
influenced by selective attention42. The increased delta-theta power in that latency suggests that ADHD patients 311
manifest specific alterations in the process of early selection of visual task stimuli43. Given that there were no 312
significant differences in the percentage of correct responses between ADHD and HC, we interpret this as a 313
compensation strategy to offset inhibitory deficits by shifting more attention to the task44,45. 314
315
Note that the DeepDream spectrograms generated for Fp1 and Fp2 are substantially different and provide lower 316
performance that the other positions (F3, F4, Fz, P3, P4), which may be explained by the lower signal quality of 317
frontopolar positions due to blinks, muscle artefacts and sweat. The lower performance of F3 and P3 electrodes 318
compared to F4 and P4 may also be related to the lower power scale in their DeepDream spectrogram, respectively 319
All rights reserved. No reuse allowed without permission. author/funder, who has granted medRxiv a license to display the preprint in perpetuity.
The copyright holder for this preprint (which was not peer-reviewed) is the.https://doi.org/10.1101/19005611doi: medRxiv preprint
14
(Table S1). This may suggest the existence of inter-hemispheric differences in the features driving the 320
discrimination between ADHD and HC. 321
322Similar studies have explored the application of deep learning to EEG signals. For example, DCNNs have been 323
used for epilepsy prediction and monitoring46, mental workload classification47 and motor imagery classification48-50. 324
Deep neural networks have also shown convincing results in classifying psychiatric disorders such as dementia51 325
and ADHD52-57, mostly with MRI data. To our knowledge, this is the first study using a deep learning approach 326
with EEG event-related spectral data to discriminate adult ADHD patients from HC with no prior selection of 327
EEG features and the combination with feature visualization techniques to provide further mechanistic evidence of 328
the underlying pathophysiology driving the classification. This is particularly important, as it not only allows to 329
develop clinical tools but also to delineate pathological signatures and disease mechanisms. 330
331
One of the limitations of this study is the relatively small size of the dataset, with the consequent limitation on the 332
network due to susceptibility to overfitting. Although “early stopping” and regularization should mitigate this 333
issue, further improvements could be achieved with bigger datasets. Another limitation is the age difference 334
between the two groups. While the mean ages are well after the period of brain maturation when myelination and 335
ADHD symptoms are still changing, and well before a geriatric threshold when other type of biological changes 336
(including normal aging) may affect cognition, we addressed this possible confounder using Inverse Probability 337
Weighting. The age difference was an artifact caused by the fact that the two cohorts were recruited prospectively 338
for independent studies (though at the same time and with the same exact protocol and hardware) and then 339
analyzed together retrospectively to address the proposed questions, hence the lack of appropriately age-matched 340
controls. Future prospective validation studies should use larger cohorts and randomize age-matched controls. 341
342
It is also worth mentioning that, although the current work considerably eliminates the need for manual extraction 343
of features, it is still focused on classification during high yield incongruent trials of a specific task. While this 344
requires a priori knowledge constrains, if validated with higher definition EEG and bigger datasets, it may be a 345
helpful diagnostic and biomarker development strategy (i.e. choosing high yield events of a high yield task) with 346
practical future procedural advantages (i.e. it would be easy to implement it in clinical settings with currently 347
existing tools, such as tasks for neuropsychological assessments and standard EEG for electrophysiological 348
diagnosis). 349
350
All rights reserved. No reuse allowed without permission. author/funder, who has granted medRxiv a license to display the preprint in perpetuity.
The copyright holder for this preprint (which was not peer-reviewed) is the.https://doi.org/10.1101/19005611doi: medRxiv preprint

15
Our findings may also have several implications from the clinical perspective by bringing new information to 351
inform the clinician’s decisions. Although the networks in this study have been trained with a small dataset of 40 352subjects, if validated with bigger datasets this approach could be used to support the diagnosis of ADHD on a 353
single-patient basis. The fact that the current networks have been trained with low-resolution EEG datasets (7 354channels) of short duration (3 minutes) would make it easy to implement them not only in an EEG clinical unit, 355but possibly by an outpatient clinician, eliminating the need to get longer or higher quality data with sophisticated 356
and clinically unpractical EEG systems. However, even if these deep learning systems are properly validated in the 357future, clinicians should view their output as statistical predictions, not as a ground truth, and they should judge 358whether the prediction applies to that specific patient and decide if additional data or expertise is needed to inform 359
that decision. 360
361
Future work should include the exploration of this approach with larger datasets as well as a more systematic study 362
of network architecture and regularization schemes. This includes the use of deeper architectures, improved data 363
augmentation methods, alternative data segmentation and normalization schemes. With regards to data 364
preprocessing, we should consider improved spectral estimation using more advanced techniques such as state-365
space estimation and multitapering58, and the use of cortical or scalp-mapped EEG data prior creation of 366
spectrograms. 367
368
Finally, we note that we make no attempt to fully-optimize our architecture in this study. In particular, no fine-369
tuning of hyper-parameters has been carried out using a validation set approach, a task we reserve for future work 370
with larger datasets. Our aim was to validate the idea that deep learning approaches can provide value for the 371
analysis of time-frequency representations of EEG, and particularly ERSP data, for the effective discrimination of 372
ADHD. 373
374
Data availability 375
The datasets generated and analyzed during the current study are available from the senior author (JAC) on 376
reasonable request. 377
378
Acknowledgements 379
This research was partly supported by NIH grants (RO1 MH112737, R21 DA042271, R21 AG056958 and R21 380
MH113018) and the Louis V. Gerstner III Research Scholar Award to JAC. 381
All rights reserved. No reuse allowed without permission. author/funder, who has granted medRxiv a license to display the preprint in perpetuity.
The copyright holder for this preprint (which was not peer-reviewed) is the.https://doi.org/10.1101/19005611doi: medRxiv preprint
16
382
Author contributions 383
LD contributed with the processing of the data, the implementation of the deep learning systems, and the writing 384
of the article. GR contributed with the conception and design of the deep learning systems and the revision of the 385
manuscript. JC contributed with the conception and design of the study, the supervision of data acquisition and the 386
findings, and the critical revision of the manuscript. All authors gave the approval to the final version of the 387
manuscript to be published. 388
389
Competing Interests 390
LDV is an employee at Neuroelectrics and a PhD student in the Camprodon Lab. GR is a co-founder of 391
Neuroelectrics, a company that manufactures the EEG device used in this study. JAC is a member of the scientific 392
advisory board for Apex Neuroscience Inc. 393
394References 395 3961 Shamay-Tsoory, S. G. & Aharon-Peretz, J. Dissociable prefrontal networks for cognitive and affective 397
theory of mind: a lesion study. Neuropsychologia 45, 3054-3067, 398
doi:10.1016/j.neuropsychologia.2007.05.021 (2007). 399
2 Biederman, J. et al. Functional impairments in adults with self-reports of diagnosed ADHD: A controlled 400
study of 1001 adults in the community. The Journal of clinical psychiatry 67, 524-540 (2006). 401
3 Fayyad, J. et al. Cross-national prevalence and correlates of adult attention-deficit hyperactivity disorder. 402
The British journal of psychiatry : the journal of mental science 190, 402-409, 403
doi:10.1192/bjp.bp.106.034389 (2007). 404
4 Kessler, R. C. et al. The prevalence and correlates of adult ADHD in the United States: results from the 405
National Comorbidity Survey Replication. The American journal of psychiatry 163, 716-723, 406
doi:10.1176/ajp.2006.163.4.716 (2006). 407
5 Polanczyk, G., de Lima, M. S., Horta, B. L., Biederman, J. & Rohde, L. A. The worldwide prevalence of 408
ADHD: a systematic review and metaregression analysis. The American journal of psychiatry 164, 942-409
948, doi:10.1176/ajp.2007.164.6.942 (2007). 410
6 Jasper, H. H., Solomon, P. & Bradley, C. Electroencephalographic analyses of behavior problem 411
children. American Journal of Psychiatry 95, 641-658, doi:10.1176/ajp.95.3.641 (1938). 412
All rights reserved. No reuse allowed without permission. author/funder, who has granted medRxiv a license to display the preprint in perpetuity.
The copyright holder for this preprint (which was not peer-reviewed) is the.https://doi.org/10.1101/19005611doi: medRxiv preprint
17
7 Lenartowicz, A. & Loo, S. K. Use of EEG to Diagnose ADHD. Current psychiatry reports 16, 498, 413
doi:10.1007/s11920-014-0498-0 (2014). 414
8 Fabiani, M., Gratton, G. & Federmeier, K. D. in Handbook of psychophysiology, 3rd ed. 85-119 415
(Cambridge University Press, 2007). 416
9 Sanei, S. & Chambers, J. A. EEG Signal Processing. (John Wiley & Sons Ltd, 2013). 417
10 Woodman, G. F. A brief introduction to the use of event-related potentials in studies of perception and 418
attention. Attention, perception & psychophysics 72, 2031-2046, doi:10.3758/app.72.8.2031 (2010). 419
11 Pokryszko-Dragan, A. et al. Event-related potentials and cognitive performance in multiple sclerosis 420
patients with fatigue. Neurological sciences : official journal of the Italian Neurological Society and of 421
the Italian Society of Clinical Neurophysiology 37, 1545-1556, doi:10.1007/s10072-016-2622-x (2016). 422
12 Paulraj, M. P., Subramaniam, K., Yaccob, S. B., Adom, A. H. & Hema, C. R. Auditory evoked potential 423
response and hearing loss: a review. The open biomedical engineering journal 9, 17-24, 424
doi:10.2174/1874120701509010017 (2015). 425
13 Durstewitz, D., Koppe, G. & Meyer-Lindenberg, A. Deep neural networks in psychiatry. Molecular 426
Psychiatry, doi:10.1038/s41380-019-0365-9 (2019). 427
14 Kroupi, E. et al. in HBP Student Conference - Transdisciplinary Research Linking Neuroscience, Brain 428
Medicine and Computer Science (Viena, Austria, 2017). 429
15 Ruffini, G., Ibañez, D., Castellano, M., Dunne, S. & Soria-Frisch, A. EEG-driven RNN Classification for 430
Prognosis of Neurodegeneration in At-Risk Patients. Artificial Neural Networks and Machine Learning – 431
ICANN 2016, 306-313 (2016). 432
16 Goodfellow, I., Bengio, Y. & Courville, A. Deep Learning. (MIT Press, 2016). 433
17 Mueller, A., Candrian, G., Kropotov, J. D., Ponomarev, V. A. & Baschera, G. M. Classification of 434
ADHD patients on the basis of independent ERP components using a machine learning system. Nonlinear 435
Biomedical Physics 4, S1, doi:10.1186/1753-4631-4-s1-s1 (2010). 436
18 Tenev, A. et al. Machine learning approach for classification of ADHD adults. International journal of 437
psychophysiology : official journal of the International Organization of Psychophysiology 93, 162-166, 438
doi:10.1016/j.ijpsycho.2013.01.008 (2014). 439
19 Jahanshahloo, H. R., Shamsi, M., Ghasemi, E. & Kouhi, A. Automated and ERP-Based Diagnosis of 440
Attention-Deficit Hyperactivity Disorder in Children. Journal of Medical Signals and Sensors 7, 26-32 441
(2017). 442
All rights reserved. No reuse allowed without permission. author/funder, who has granted medRxiv a license to display the preprint in perpetuity.
The copyright holder for this preprint (which was not peer-reviewed) is the.https://doi.org/10.1101/19005611doi: medRxiv preprint

18
20 Nazhvani, A. D., Boostani, R., Afrasiabi, S. & Sadatnezhad, K. Classification of ADHD and BMD 443
patients using visual evoked potential. Clinical neurology and neurosurgery 115, 2329-2335, 444
doi:10.1016/j.clineuro.2013.08.009 (2013). 445
21 Sadatnezhad, K., Boostani, R. & Ghanizadeh, A. Classification of BMD and ADHD patients using their 446
EEG signals. Expert Systems with Applications 38, 1956-1963, 447
doi:https://doi.org/10.1016/j.eswa.2010.07.128 (2011). 448
22 Ahmadlou, M. & Adeli, H. Wavelet-synchronization methodology: a new approach for EEG-based 449
diagnosis of ADHD. Clinical EEG and neuroscience 41, 1-10, doi:10.1177/155005941004100103 450
(2010). 451
23 Abibullaev, B. & An, J. Decision support algorithm for diagnosis of ADHD using 452
electroencephalograms. Journal of medical systems 36, 2675-2688, doi:10.1007/s10916-011-9742-x 453
(2012). 454
24 Ruffini, G. et al. Algorithmic complexity of EEG for prognosis of neurodegeneration in idiopathic rapid 455
eye movement behavior disorder (RBD). bioRxiv (2018). 456
25 Oord, A. v. d., Dieleman, S. & Schrauwen, B. in Proceedings of the 26th International Conference on 457
Neural Information Processing Systems - Volume 2 2643-2651 (Curran Associates Inc., Lake Tahoe, 458
Nevada, 2013). 459
26 Tsinalis, O., M. Matthews, P., Guo, Y. & Zafeiriou, S. Automatic Sleep Stage Scoring with Single-460
Channel EEG Using Convolutional Neural Networks. (2016). 461
27 Vilamala, A., Madsen, K. H. & Hansen, L. K. Deep Convolutional Neural Networks for Interpretable 462
Analysis of EEG Sleep Stage Scoring. 2017 International workshop on Machine Learning for signal 463
processing (2017). 464
28 Ruffini, G. et al. Deep Learning With EEG Spectrograms in Rapid Eye Movement Behavior Disorder. 465
Frontiers in neurology 10, 806 (2019). 466
29 Dauwels, J., Vialatte, F., Musha, T. & Cichocki, A. A comparative study of synchrony measures for the 467
early diagnosis of Alzheimer's disease based on EEG. NeuroImage 49, 668-693, 468
doi:https://doi.org/10.1016/j.neuroimage.2009.06.056 (2010). 469
30 Alexander, M., Christopher, O. & Mike, T. Inceptionism: Going Deeper into Neural Networks. Google 470
Research Blog (2015). 471
All rights reserved. No reuse allowed without permission. author/funder, who has granted medRxiv a license to display the preprint in perpetuity.
The copyright holder for this preprint (which was not peer-reviewed) is the.https://doi.org/10.1101/19005611doi: medRxiv preprint
19
31 American-Psychiatric-Association. The Diagnostic and Statistical Manual of Mental Disorders. 5th 472
Edition edn, (American Psychiatric Publishing, 2013). 473
32 Kessler, R. C. et al. The World Health Organization Adult ADHD Self-Report Scale (ASRS): a short 474
screening scale for use in the general population. Psychol Med 35, 245-256 (2005). 475
33 Kopp, B., Rist, F. & Mattler, U. N200 in the Flanker task as a neurobehavioral tool for investigating 476
executive control. Psychophysiology 33, 282-294 (1996). 477
34 Abadi, M. et al. in Proceedings of the 12th USENIX conference on Operating Systems Design and 478
Implementation 265-283 (USENIX Association, Savannah, GA, USA, 2016). 479
35 Srivastava, N., Hinton, G., Krizhevsky, A., Sutskever, I. & Salakhutdinov, R. Dropout: A Simple Way to 480
Prevent Neural Networks from Overfitting. Journal of Machine Learning Research 15, 1929-1958 481
(2014). 482
36 Prechelt, L. in Neural Networks: Tricks of the Trade (eds Genevieve B. Orr & Klaus-Robert Müller) 483
55-69 (Springer Berlin Heidelberg, 1998). 484
37 Hochreiter, S. & Schmidhuber, J. Long Short-Term Memory. Neural Computation 9, 1735-1780, 485
doi:10.1162/neco.1997.9.8.1735 (1997). 486
38 Antti, A., Tapio, P., Willem, W., Bernard De, B. & Tapio, S. 3-13 (PMLR, 2009). 487
39 Linn, K. A., Gaonkar, B., Doshi, J., Davatzikos, C. & Shinohara, R. T. Addressing Confounding in 488
Predictive Models with an Application to Neuroimaging. The international journal of biostatistics 12, 31-489
44, doi:10.1515/ijb-2015-0030 (2016). 490
40 Austin, P. C. An Introduction to Propensity Score Methods for Reducing the Effects of Confounding in 491
Observational Studies. Multivariate behavioral research 46, 399-424, 492
doi:10.1080/00273171.2011.568786 (2011). 493
41 Klimesch, W., Sauseng, P. & Hanslmayr, S. EEG alpha oscillations: The inhibition–timing hypothesis. 494
Brain Research Reviews 53, 63-88, doi:https://doi.org/10.1016/j.brainresrev.2006.06.003 495
(2007). 496
42 Rugg, M. D., Milner, A. D., Lines, C. R. & Phalp, R. Modulation of visual event-related potentials by 497
spatial and non-spatial visual selective attention. Neuropsychologia 25, 85-96 (1987). 498
43 Yordanova, J., Heinrich, H., Kolev, V. & Rothenberger, A. Increased event-related theta activity as a 499
psychophysiological marker of comorbidity in children with tics and attention-deficit/hyperactivity 500
All rights reserved. No reuse allowed without permission. author/funder, who has granted medRxiv a license to display the preprint in perpetuity.
The copyright holder for this preprint (which was not peer-reviewed) is the.https://doi.org/10.1101/19005611doi: medRxiv preprint

20
disorders. NeuroImage 32, 940-955, 501
doi:https://doi.org/10.1016/j.neuroimage.2006.03.056 (2006). 502
44 Broyd, S. J. et al. The effect of methylphenidate on response inhibition and the event-related potential of 503
children with attention deficit/hyperactivity disorder. International journal of psychophysiology : official 504
journal of the International Organization of Psychophysiology 58, 47-58, 505
doi:10.1016/j.ijpsycho.2005.03.008 (2005). 506
45 Prox, V., Dietrich, D. E., Zhang, Y., Emrich, H. M. & Ohlmeier, M. D. Attentional processing in adults 507
with ADHD as reflected by event-related potentials. Neuroscience Letters 419, 236-241 (2007). 508
46 Liang, J., Lu, R., Zhang, C. & Wang, F. in IEEE International Conference on Healthcare Informatics 509
(ICHI) 184-191 (2016). 510
47 Ma, T. et al. The extraction of motion-onset VEP BCI features based on deep learning and compressed 511
sensing. J Neurosci Methods 275, 80-92, doi:10.1016/j.jneumeth.2016.11.002 (2017). 512
48 Bashivan, P., Rish, I., Yeasin, M. & Codella, N. Learning Representations from EEG with Deep 513
Recurrent-Convolutional Neural Networks. (2015). 514
49 Tabar, Y. R. & Halici, U. A novel deep learning approach for classification of EEG motor imagery 515
signals. J Neural Eng 14, 016003, doi:10.1088/1741-2560/14/1/016003 (2017). 516
50 An, X., Kuang, D., Guo, X., Zhao, Y. & He, L. in Intelligent Computing in Bioinformatics. (eds De-517
Shuang Huang, Kyungsook Han, & Michael Gromiha) 203-210 (Springer International Publishing). 518
51 Vieira, S., Pinaya, W. H. & Mechelli, A. Using deep learning to investigate the neuroimaging correlates 519
of psychiatric and neurological disorders: Methods and applications. Neurosci Biobehav Rev 74, 58-75, 520
doi:10.1016/j.neubiorev.2017.01.002 (2017). 521
52 Deshpande, G., Wang, P., Rangaprakash, D. & Wilamowski, B. Fully Connected Cascade Artificial 522
Neural Network Architecture for Attention Deficit Hyperactivity Disorder Classification From Functional 523
Magnetic Resonance Imaging Data. IEEE transactions on cybernetics 45, 2668-2679, 524
doi:10.1109/tcyb.2014.2379621 (2015). 525
53 Han, X., Zhong, Y., He, L., Yu, P. S. & Zhang, L. in Brain Informatics and Health. (eds Yike Guo et al.) 526
156-166 (Springer International Publishing). 527
54 Hao, A. J., He, B. L. & Yin, C. H. in 2015 IET International Conference on Biomedical Image and Signal 528
Processing (ICBISP 2015). 1-6. 529
55 Kuang, D. & He, L. in 2014 International Conference on Cloud Computing and Big Data. 27-32. 530
All rights reserved. No reuse allowed without permission. author/funder, who has granted medRxiv a license to display the preprint in perpetuity.
The copyright holder for this preprint (which was not peer-reviewed) is the.https://doi.org/10.1101/19005611doi: medRxiv preprint

21
56 Kuang, D., Guo, X., An, X., Zhao, Y. & He, L. in Intelligent Computing in Bioinformatics. (eds De-531
Shuang Huang, Kyungsook Han, & Michael Gromiha) 225-232 (Springer International Publishing). 532
57 Zou, L., Zheng, J., Miao, C., Mckeown, M. J. & Wang, Z. J. 3D CNN Based Automatic Diagnosis of 533
Attention Deficit Hyperactivity Disorder Using Functional and Structural MRI. IEEE Access 5, 23626-534
23636, doi:10.1109/ACCESS.2017.2762703 (2017). 535
58 Kim, S.-E., Behr, M. K., Ba, D. & Brown, E. N. State-space multitaper time-frequency analysis. 536
Proceedings of the National Academy of Sciences 115, E5, doi:10.1073/pnas.1702877115 (2018). 537
538
All rights reserved. No reuse allowed without permission. author/funder, who has granted medRxiv a license to display the preprint in perpetuity.
The copyright holder for this preprint (which was not peer-reviewed) is the.https://doi.org/10.1101/19005611doi: medRxiv preprint