Least Developed Countries (LDCs) -...
2
Least Developed Countries (LDCs) Population In 2015, the population of LDCs was 954 million—13% of the world’s total. This share will increase until 2050, when 20% of the world’s population will live in LDCs. The population in LDCs is expected to double between 2010 and 2050. In the same time period, the total world population is expected to grow by only 33%. Economy In 2014, the LDCs averaged a per capita GDP of only USD 952. That is less than 9% of the world average. LDC economies grew at a rate of 5.6% in 2014—up from 5.26% in 2013. GDP growth for LDCs is projected to fall to 3.9% in 2015. Debt stock as a percentage of GNI in LDCs stood at 28% in 2013, up from 27% in 2012, and 5 percentage points higher than in all developing countries. Domestic resource mobilisation in LDCs continues to be behind the world average. Government revenue (excluding grants) as a percentage of GDP stood at 16.3%, as opposed to the world average of 18%. Savings in LDCs remain far behind the aggregate for all developing countries. In 2013, they amounted to 20% of GDP in LDCs as opposed to 30% in all developing countries. Productive Capacity The share of manufacturing in LDC economies is 12%, compared to 20% in all developing countries. LDCs lag behind the world in terms of access to electricity, telephone services and Internet usage, despite making substantial progress. Trade In 2015, the combined exports of all 48 LDCs made up 0.937% of worldwide exports. Although a small percentage, it is nearly double the figure in 2001. Primary commodities dominate LDC exports, making up 77% of total LDC exports in 2013. This is up from 69% in 2001. The difference between African and Asian LDCs is quite large: primary commodities amount to 93% of total exports in African LDCs and 40% in Asian LDCs. Angola alone is responsible for more than 40% of LDCs’ total primary commodity exports. Poverty 51% of the population in LDCs lives on less than $1.25 per day. It is estimated that 24% – 210 million people – live with hunger in LDCs. Education According to the latest national figures, 19 million children of primary school age in LDCs are not enrolled in primary education. In 2013, the pupil-teacher ratio in primary education in LDCs was 41 students per teacher as opposed to 27 students per teacher in all developing countries. In secondary education the ratio stood at 26 pupils per teacher in LDCs and 19 in all developing countries. $952 $4,291 $10,739 $38,423 $- $20,000 $40,000 LDCs All Developing Countries World OECD Members GDP per capita in current US dollars, 34 64 9 12 81 90 31 20 85 97 41 16 - 50 100 150 Access to electricity (% of population) Mobile cellular subscriptions per 100 people Internet users per 100 people Manufacturing, value added (% of GDP) World All Developing Countries LDCs Africa: 34 Asia and the Pacific: 13 The Americas: 1 48 Countries 17 Landlocked 9 Small Islands
Transcript of Least Developed Countries (LDCs) -...
Least Developed Countries (LDCs)
Population
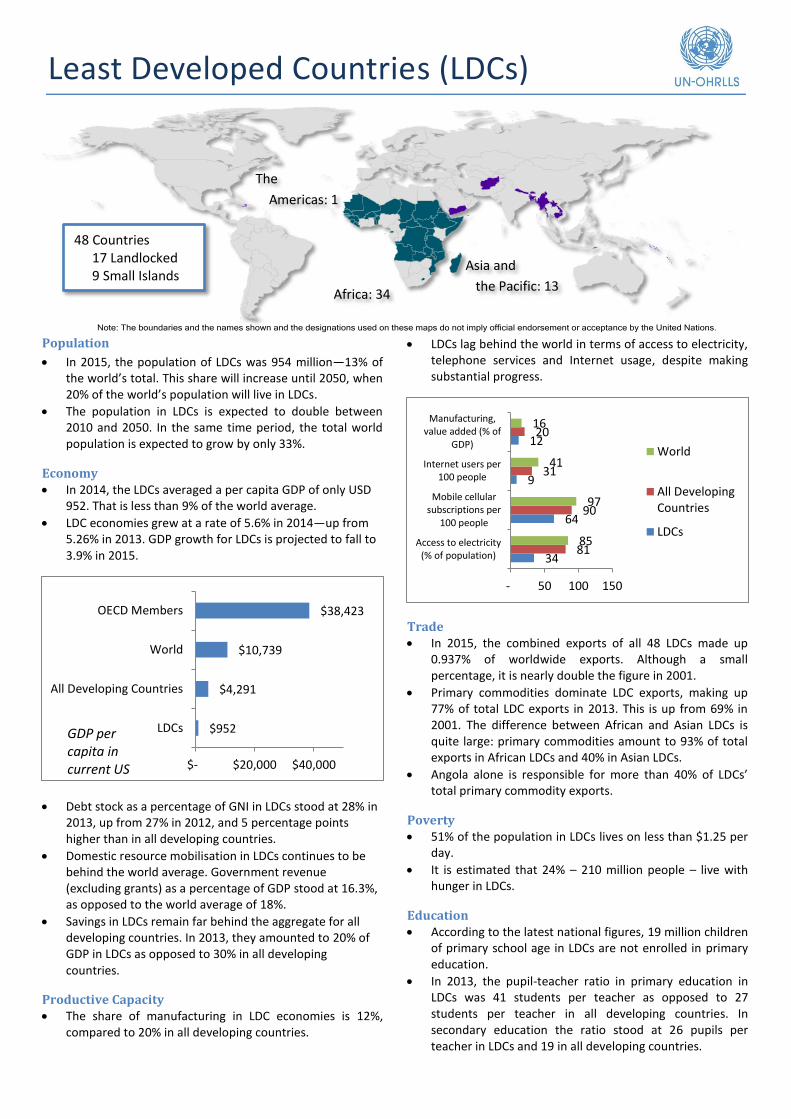
In 2015, the population of LDCs was 954 million—13% of the world’s total. This share will increase until 2050, when 20% of the world’s population will live in LDCs.
The population in LDCs is expected to double between 2010 and 2050. In the same time period, the total world population is expected to grow by only 33%.
Economy In 2014, the LDCs averaged a per capita GDP of only USD
952. That is less than 9% of the world average.
LDC economies grew at a rate of 5.6% in 2014—up from 5.26% in 2013. GDP growth for LDCs is projected to fall to 3.9% in 2015.
Debt stock as a percentage of GNI in LDCs stood at 28% in 2013, up from 27% in 2012, and 5 percentage points higher than in all developing countries.
Domestic resource mobilisation in LDCs continues to be behind the world average. Government revenue (excluding grants) as a percentage of GDP stood at 16.3%, as opposed to the world average of 18%.
Savings in LDCs remain far behind the aggregate for all developing countries. In 2013, they amounted to 20% of GDP in LDCs as opposed to 30% in all developing countries.
Productive Capacity The share of manufacturing in LDC economies is 12%,
compared to 20% in all developing countries.
LDCs lag behind the world in terms of access to electricity, telephone services and Internet usage, despite making substantial progress.
Trade In 2015, the combined exports of all 48 LDCs made up
0.937% of worldwide exports. Although a small percentage, it is nearly double the figure in 2001.
Primary commodities dominate LDC exports, making up 77% of total LDC exports in 2013. This is up from 69% in 2001. The difference between African and Asian LDCs is quite large: primary commodities amount to 93% of total exports in African LDCs and 40% in Asian LDCs.
Angola alone is responsible for more than 40% of LDCs’ total primary commodity exports.
Poverty 51% of the population in LDCs lives on less than $1.25 per
day.
It is estimated that 24% – 210 million people – live with hunger in LDCs.
Education According to the latest national figures, 19 million children
of primary school age in LDCs are not enrolled in primary education.
In 2013, the pupil-teacher ratio in primary education in LDCs was 41 students per teacher as opposed to 27 students per teacher in all developing countries. In secondary education the ratio stood at 26 pupils per teacher in LDCs and 19 in all developing countries.
$952
$4,291
$10,739
$38,423
$- $20,000 $40,000
LDCs
All Developing Countries
World
OECD Members
GDP per capita in current US dollars, 2014
34
64
9
12
81
90
31
20
85
97
41
16
- 50 100 150
Access to electricity(% of population)
Mobile cellularsubscriptions per
100 people
Internet users per100 people
Manufacturing,value added (% of
GDP)World
All DevelopingCountries
LDCs
Africa: 34
Asia and
the Pacific: 13
The
Americas: 1
48 Countries 17 Landlocked 9 Small Islands
Least Developed Countries (LDCs)
Sources: UN Population Division estimates; World Development Indicators (World Bank); UNCTAD Merchandise Trade Matrix; UNESCO Institute for Statistics; Inter-agency Group for Child Mortality Estimation (IGME); UNAIDS estimates; WHO/UNICEF Joint Monitoring Programme (JMP) for Water Supply and Sanitation; OECD DAC International Development Statistics. Updated July 2015
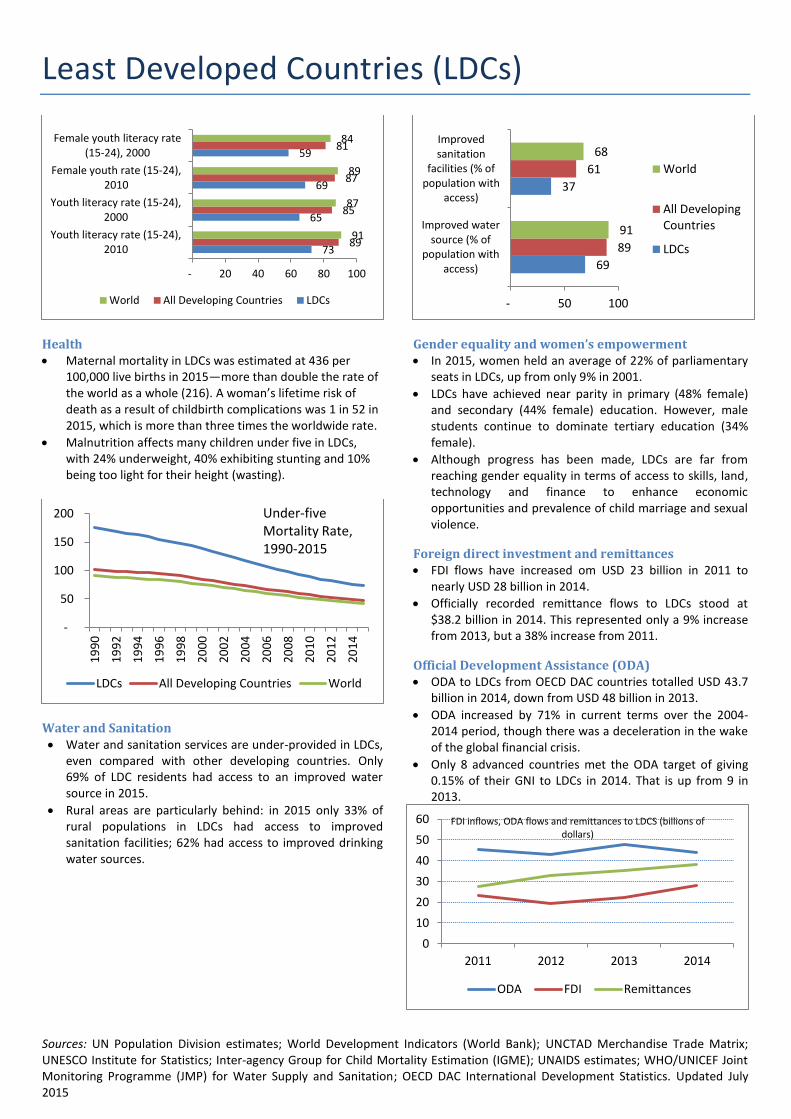
Health Maternal mortality in LDCs was estimated at 436 per
100,000 live births in 2015—more than double the rate of the world as a whole (216). A woman’s lifetime risk of death as a result of childbirth complications was 1 in 52 in 2015, which is more than three times the worldwide rate.
Malnutrition affects many children under five in LDCs, with 24% underweight, 40% exhibiting stunting and 10% being too light for their height (wasting).
Water and Sanitation Water and sanitation services are under-provided in LDCs,
even compared with other developing countries. Only 69% of LDC residents had access to an improved water source in 2015.
Rural areas are particularly behind: in 2015 only 33% of rural populations in LDCs had access to improved sanitation facilities; 62% had access to improved drinking water sources.
Gender equality and women’s empowerment In 2015, women held an average of 22% of parliamentary
seats in LDCs, up from only 9% in 2001.
LDCs have achieved near parity in primary (48% female) and secondary (44% female) education. However, male students continue to dominate tertiary education (34% female).
Although progress has been made, LDCs are far from reaching gender equality in terms of access to skills, land, technology and finance to enhance economic opportunities and prevalence of child marriage and sexual violence.
Foreign direct investment and remittances FDI flows have increased om USD 23 billion in 2011 to
nearly USD 28 billion in 2014.
Officially recorded remittance flows to LDCs stood at $38.2 billion in 2014. This represented only a 9% increase from 2013, but a 38% increase from 2011.
Official Development Assistance (ODA) ODA to LDCs from OECD DAC countries totalled USD 43.7
billion in 2014, down from USD 48 billion in 2013.
ODA increased by 71% in current terms over the 2004-2014 period, though there was a deceleration in the wake of the global financial crisis.
Only 8 advanced countries met the ODA target of giving 0.15% of their GNI to LDCs in 2014. That is up from 9 in 2013.
73
65
69
59
89
85
87
81
91
87
89
84
- 20 40 60 80 100
Youth literacy rate (15-24),2010
Youth literacy rate (15-24),2000
Female youth rate (15-24),2010
Female youth literacy rate(15-24), 2000
World All Developing Countries LDCs
-
50
100
150
200
19
90
19
92
19
94
19
96
19
98
20
00
20
02
20
04
20
06
20
08
20
10
20
12
20
14
LDCs All Developing Countries World
Under-five Mortality Rate, 1990-2015
69
37
89
61
91
68
- 50 100
Improved watersource (% of
population withaccess)
Improvedsanitation
facilities (% ofpopulation with
access)
World
All DevelopingCountries
LDCs
0
10
20
30
40
50
60
2011 2012 2013 2014
FDI inflows, ODA flows and remittances to LDCS (billions of dollars)
ODA FDI Remittances