Switzerland Internet in the least developed...
128
Thematic report ITU Development LDCs and small island developing states ICTs, LDCs and the SDGs Achieving universal and affordable Internet in the least developed countries In Partnership with
Transcript of Switzerland Internet in the least developed...
Thematic report ITU Development LDCs and small island
developing states
ICTs, LDCs and the SDGs
Achieving universal and affordable Internet in the least developed countries
In Partnership with
Printed in SwitzerlandGeneva, 2018
International Telecommunication Union
Telecommunication Development Bureau
Place des Nations
CH-1211 Geneva 20
Switzerland
www.itu.int
ICTs
, LD
Cs
and
the
SDG
s: A
chie
ving
uni
vers
al a
nd a
fford
able
Inte
rnet
in th
e le
ast d
evel
op
ed c
oun
trie
s N
ove
mb
er 2
017
ISBN 978-92-61-25461-2
9 7 8 9 2 6 1 2 5 4 6 1 2


ICTs, LDCs and the SDGsAchieving universal and
affordable Internet in the least developed countries

© ITU 2018
All rights reserved. No part of this publication may be reproduced, by any means whatsoever, without the prior written permission of ITU.
Please consider the environment before printing this report.
AcknowledgementsThe present report was prepared by ITU experts Lishan Adam and Michael Minges, under the direction of the Least Developed Countries, Small Island Developing States & Emergency Telecommunication (LSE) Division of the ITU Telecommunication Development Bureau (BDT), in cooperation with the UN Office of the High Representative for the Least Developed Countries, Landlocked Developing Countries and Small Island Developing States (UN-OHRLLS).
ISBN
978-92-61-25451-3 (paper version)
978-92-61-25461-2 (electronic version)
978-92-61-25471-1 (EPUB version)
978-92-61-25481-0 (Mobi version)
978-92-61-25691-3 (USB)

iii
It is our pleasure to present to you this special report on ICTs, LDCs and the SDGs: Achieving universal and affordable Internet in the least developed countries (LDCs).
Today, there is a clear recognition of the importance of information and communication technologies (ICTs) for the LDCs. The 2030 Agenda for Sustainable Development recognizes that “the spread of information and communications technology and global interconnectedness has great potential to accelerate human progress, to bridge the digital divide and to develop knowledge societies”. The im-portance of ICTs is further enshrined in SDG Target 9.c, where the international community commits to “significantly increase access to information and communications technology and strive to provide universal and affordable access to the Internet in least developed countries by 2020”. This target illustrates the centrality of ICT infrastructure in enabling countries to become integrated into the information society and fully harness its development potentials. Broadband Internet, in particular, can help countries to leap-frog in various areas, including education, health, government services, and trade. ICT services can also deliver innovative services and applications and trigger new business opportunities.
Similarly, the Istanbul Programme of Action (IPoA) for the Least Developed Countries for the decade 2011-2020, adopted by the Fourth UN Conference on the Least Developed Countries in 2011, recog-nizes ICT networks as an infrastructure priority on a par with water, electricity, and transport.
This report provides insights into the great strides that LDCs have made in regard to information and communication technology access, and the opportunities that ICTs offer in addressing severe structural impediments to sustainable development in this group of countries.
By the end of 2017, the number of mobile-cellular subscriptions is expected to increase to about 700 million, with a penetration of 70 per cent. Currently, more than four out of five people in the LDCs have access to a mobile-cellular network. ICTs have led to significant development outcomes in LDCs, in particular in the areas of financial inclusion, poverty reduction and improved health.
This report shows that LDCs have also made great progress towards achieving universal access to and affordability of the Internet. Several LDCs are also on track to largely achieve SDG Target 9.c by 2020. In 2016, close to 60 per cent of the population in LDCs was covered by a mobile broadband network and, in a growing number of LDCs, mobile broadband services have become relatively affordable.
At the same time the report highlights some variations among the LDCs. It documents differentiated economic, demographic and social features and development challenges across LDCs, including those that are also land-locked developing countries (LLDCs) or small island developing states (SIDS). The report provides specific recommendations in areas including regulation and public-private partner-ships, building on successful experiences in LDCs.
Another key finding is that, at current growth rates, less than one-quarter of the population in LDCs will be online by 2020. The key barrier is the lack of the skills needed to use the Internet. Governments are therefore encouraged to adopt strategic ICT sector plans on building skills and enhancing collab-oration with the education sector. This finding highlights the importance for policy makers to address broader socio-economic challenges that lie outside the ICT ecosystem, such as educational levels, but also gender equality.
Foreword

iv
In line with the spirit of more integrated and collaborative approaches in implementing the 2030 Agenda for Sustainable Development, the International Telecommunication Union (ITU) and the UN Office of the High Representative for the Least Developed Countries, Landlocked Developing Countries and Small Island Developing States (UN-OHRLLS), are working in close cooperation with other United Nations agencies and partners to ensure universal access in LDCs, LLDCs, and SIDS. We believe that producing this report and disseminating its findings is a good illustration of such efforts.
We hope that this report provides many useful insights and sheds light on efforts towards achieving the full potential of ICTs for the SDGs and leaving no one behind.
Fekitamoeloa Katoa 'Utoikamanu Under-Secretary-General and High
Representative for the Least Developed Countries, Landlocked Developing
Countries and Small Island Developing States
(UN-OHRLLS)
Brahima Sanou
Director Telecommunication Development
Bureau (BDT) International Telecommunication Union

v
Acknowledgements ii
Foreword iii
1 Introduction 11.1 The Least Developed Countries (LDCs) 21.2 Broadband Internet for the LDCs 41.3 SDG Target 9.c and the Internet 71.4 Digital gaps between LDCs and the rest of the world 10
1.4.1 The connectivity gap 101.4.2 The affordability gap 131.4.3 The socio-economic gap 141.4.4 Roadmap to the rest of the report 15
2 Expanding supply-side infrastructure 172.1 Local access networks 18
2.1.1 Mobile 182.1.2 Broadband 222.1.3 Quality 262.1.4 Electricity 27
2.2 National and regional backbones 292.2.1 National backbones 292.2.2 Regional and cross-border connections 332.2.3 International connectivity 34
2.3 The “Invisible Mile” 372.3.1 Moving to the fifth generation of regulation 382.3.2 Spectrum management 412.3.3 Infrastructure sharing, data protection and cybersecurity 422.3.4 Universal service funds 43
2.4 Conclusions 43
3 Sustaining the Internet ecosystem 453.1 The underappreciated ccTLD 463.2 The critical role of data centres 523.3 IXPs: Beyond exchanging traffic 553.4 Conclusions 59
4 Making the Internet affordable 624.1 Rethinking affordability 624.2 How much data is enough? 704.3 Zero-rated services and OTT: Supplements or artificial sweeteners? 724.4 Competition and pricing 764.5 Conclusions 80
5 Skills for using the Internet 825.1 Digital literacy 825.2 The power of secondary education 825.3 Digital literacy for the masses 865.4 Conclusions 89
Table of Contents

vi
6 Progress towards achieving SDG Target 9.c 906.1 Leap-frogging 956.2 Recommendations 96
References 100
Annex 1 102Basic Indicators, 2016 102Infrastructure Access Indicators, 2016 104Infrastructure Backbone Indicators, 2016 106Core Internet Infrastructure Indicators, 2016 108Affordability Indicators, 2016 110Skills Indicators 112The three dimensions of SDG Target 9.c (Access, Affordability and Skills) and Internet
Uptake 114

vii
List of Tables, Figures and Boxes
TablesTable 1.1: LDCs by ITU region and income grouping 4Table 2.1: Preparation of households with a mobile phone (in %) broken down by urban/rural households, latest available survey (2012-2016), LDCs 21Table 2.2: Submarine cables in Africa 36Table 2.3: LDCs by generation of regulation 38Table 3.1: LDCs with active IXP, 2017 56Table 6.1: Top performers by category 93Table 6.2: Performance across three dimensions of Internet use: access, affordability and skills 93Table 6.3: Experienced strategic private investors in Bangladesh and Myanmar 94
FiguresFigure 1.1: Key components that will drive the achievement of SDG Target 9.c to provide universal and affordable access to the Internet in least developed countries by 2020. 2Figure 1.2: Map of LDCs according to ITU regional classification 3The Pink Phones project in Cambodia empowers female farmers 6Figure 1.3: Internet use and proportion of population not online by country, 2017, LDCs 8Figure 1.4: ICT penetration levels by level of development, 2017 10Figure 1.5: Route metres of fibre and microwave backbone per capita by region, 2016 12Figure 1.6: Share of total international Internet bandwidth and International Internet bandwidth per inhabitant, by region 13Figure 1.7: Progress towards the target of making broadband affordable, 2016 13Figure 1.8: Fixed- and mobile broadband prices 2016, and mobile broadband prices 2013-2016 14Figure 1.9: Proportion of individuals using the Internet by gender 2016, and Internet user gender gap 2013 and 2017 15Figure 1.10: Demand- and supply-side measures to increase Internet use 16Figure 2.1: The different miles of ICT infrastructure 17Figure 2.2: Mobile cellular subscriptions (per 100 inhabitants) 18Figure 2.3: 2G Mobile coverage (% of population), LDCs 20Figure 2.4: Availability of 3G network and 3G coverage (% of population), LDCs 23Figure 2.5: Average webpage load time (seconds), first quarter 2016, LDCs 27Figure 2.6: Access to electricity 28Figure 2.7: Price of electricity, 2016 28Figure 2.8: Generations of regulation 38Figure 2.9: LDCs with a universal service fund and percentage of funds disbursed in African LDCs 43Figure 3.1: The virtuous cycle of local Internet infrastructure 45Figure 3.2: ccTLD processing model 46Figure 3.3: LDCs: Distribution of ccTLDs (left) and central governments using ccTLD (right), 2017 48Figure 3.4: Relation between ccTLD registrations and Internet users 48Figure 3.5: Marketing the .SN ccTLD in Senegal, 2017 49Figure 3.6: Small businesses online web presence in selected economies (left) and reasons for not having a website, 2015 (right) 50Figure 3.7: Tanzania: ccTLD registrations (left) and estimated impact from additional local web hosting (right) 51Figure 3.8: Impact of local hosting in Rwanda 51Figure 3.9: Lao PDR Energy Efficient Datacenter (LEED) compared to conventional data

viii
centre 54Figure 3.10: IXPs in LDCs 56Figure 3.11: Fibre-optic submarine cables landing and planned in Djibouti 59Figure 3.12: Fundamental Internet infrastructure in LDCs, June 2017 60Figure 4.1: ITU prepaid mobile broadband price basket (at least 500 MB per month), 2016 63Figure 4.2: Relation between mobile broadband basket and Internet usage, 2015, LDCs 63Figure 4.3: Seven strata of Zambian households 64Figure 4.4: Communications as percentage of household expenditure and MTN data bundles available 65Figure 4.5: MTN Zambia hourly, daily and weekly plans, June 2017 66Figure 4.6: Main reason for selecting a mobile provider and barriers to household Internet access, Zambia, 2015 66Figure 4.7: Zambia, Internet use by education and age, 2015 67Figure 4.8: Mobile Internet bundles in the LDCs, 2017 67Figure 4.9: MTN, Mobile data usage per month (left) and relation between mobile data usage per month and mobile broadband price basket 71Figure 4.10: Fixed and mobile prices in Bhutan (left) and Bangladesh (right), US$, 2017 72Figure 4.11: OTT versus mobile network in Senegal, 2017 73Figure 4.12: OTT in Cambodia and Africa 74Figure 4.13: Facebook Free Basics and m.wikipedia, June 2017 75Figure 4.14: Impact of competition on mobile broadband prices and bundles 76Figure 4.15: 2017 Affordability Drivers Index (ADI) 77Figure 5.1: Barriers to Internet use in Malawi (left) and Zambia (right) 82Figure 5.2: Internet use and level of education in Bangladesh (left) and Malawi (right) 83Figure 5.3: Internet use, ages 15-24 for men and women in Lao PDR (left), and in selected economies (right) 84Figure 5.4: Relation between education indicators and Internet use, LDCs 85Figure 5.5: Secondary Gross Enrolment Ratio 85Figure 5.6: Rwanda Internet supply and demand (left) and proportion of population that is digitally literate and projected to be computer literate (right) 87Figure 6.1: Projections for mobile 3G coverage, mobile broadband prices, secondary school enrolment and Internet use, LDCs 91Figure 6.2: The three drivers of Internet use 91Figure 6.3: The three dimensions of Internet use 94Figure 6.4: Leap-frogging 96
BoxesBox 1-1: ICTs and the SDGs – Target 9.c recognizes the importance of the Internet for the LDCs 1Box 1-2: The least developed countries and the ICT Development Index 11Box 2-1: Competition, privatization and strong operators in Mali 19Box 2-2: Timor-Leste: Three is better than one 19Box 2-3: PPPs for 4G in Rwanda 24Box 2-4: Comparing fixed- to mobile-broadband networks 25Box 2-5: National backbone development in Senegal 30Box.2-6: Tanzania's ICT Broadband Backbone for National and Regional Connectivity 31Box 2-7: Burundi Backbone System (BBS) 33Box 2-8: The six sea-facing LDCs without submarine connectivity 35Box 2-9: Winning formulas for fixed- and mobile-broadband markets 40Box 3-1: The economics of "free" hosting 52Box 3-2: Development of a Cloud Computing Strategy in Ethiopia 53Box 3-3: From a development project to a growing IXP: Bangladesh Internet Exchange 58Box 3-4: Help for the formation of technical Internet skills: The case of Myanmar 61Box 4-1: Cellphones in Cambodia: Smartphones, electricity and Khmer 68

ix
Box 4-2: Number of hours of work to pay for a mobile Internet bundle 69Box 4-3: Redefining affordability and setting a new target: “1 for 2” to achieve SDG Target 9.c 70Box 4-4: Taking on OTT in Bangladesh 74Box 4-5: Hijacking zero-rated services in Angola 76Box 4-6: Ticking all the right regulatory boxes but still relatively high prices: The case of Uganda 78Box 4-7: Gauging polices affecting Internet affordability in Mozambique 79Box 4-8: Mobile affordability in Haiti 80Box 5-1: Use of universal service funds for school connectivity in Uganda 88Box 5-2: With smartphones does local content become more important than digital literacy? 89


ICTs, LDCs and the SDGs
1
1 IntroductionInformation and communication technologies (ICTs) bring great benefits for people, governments, and the private sector. Access to the Internet, in particular, unlocks new development opportunities by opening up new communication channels, providing access to information and services, increasing productivity and fostering innovation. ICTs and Internet access are key building blocks of the digital economy, and have been recognized as important drivers to achieve the Sustainable Development Goals (SDGs) (Box 1-1).
Box 1-1: ICTs and the SDGs – Target 9.c recognizes the importance of the Internet for the LDCs
In September 2015, the 2030 Agenda for Sustainable Development (UN, 2015) was agreed at the United Nations Sustainable Development Summit. This new framework for international cooperation to promote sustainable development between 2015 and 2030 is composed of 17 new Sustainable Development Goals (SDGs), 169 targets, and some 230 indicators.
While none of the goals is specifically about ICTs, several targets refer to digital technology. The 2030 Agenda for Sustainable Development also recognizes that “The spread of informa-tion and communications technology and global interconnectedness has great potential to accelerate human progress, to bridge the digital divide and to develop knowledge societies".
Sustainable Development Goal 9, which concerns industrialization, innovation and infra-structure, recognizes the importance of ICTs and establishes Target 9.c, to “significantly in-crease access to information and communications technology and strive to provide universal and affordable access to the Internet in least developed countries by 2020” (UN, 2015).
SDG Target 9.c on universal and affordable access to the Internet in the LDCs, has three key features (Figure 1.1). First, it explicitly refers to least developed countries (LDCs) as the target group. Second, it states that the access should be universal and affordable. This means that all citizens should have access to the infrastructure for using the Internet and the cost should be within their economic means. Third, it explicitly identifies the Internet as the ICT of interest. This is important because the use of the Internet, unlike mobile phones, requires a certain level of skills.
The official indicator selected to track SDG Target 9.c is the “proportion of population covered by a mobile network, by technology”. The indicator, which is defined as “the percentage of inhabitants living within range of a mobile-cellular signal, irrespective of whether or not they are mobile phone

2
ICTs, LDCs and the SDGs
subscribers or users” (ITU, 2015), reflects the infrastructure availability aspect of the target since it measures the possibility of subscribing to and using mobile cellular services. By including the break-down “by technology”, the indicator is flexible in terms of technological development. It can apply to basic narrowband mobile networks (2G) as well as mobile broadband networks (3G and 4G) and emerging 5G networks.1 The other two aspects of the target (affordability and skills) also need to be measured and this report identifies several relevant indicators in that regard.
This chapter provides an overview of the LDC classification and the economies that make up the group. It compares LDCs to other groups in terms of connectivity and the affordability of services. In addition to supply-side issues, the chapter also reviews demand-side aspects outside the ICT ecosys-tem, including socio-economic inequalities, and in particular digital and analogue skills, which remain critical factors if LDCs are to achieve Target 9.c.
1.1 The Least Developed Countries (LDCs)
The LDCs comprise 47 developing countries that suffer from severe structural impediments to sustain-able development. They are highly vulnerable to economic and environmental shocks and have low levels of human development.2 LDCs have a combined population of 979 million people, representing 13 per cent of the world's inhabitants in 2016. According to the ITU regional classification used in this report, three fifths (28) of the LDCs are located in Africa, a dozen are in Asia and the Pacific, six are in the Arab States and one is in the Americas (Figure 1.2 and Table 1.1).3
Although the 47 LDCs share many similarities and face related development challenges, there are major differences within the group, in particular in terms of their population, geography, and eco-nomic development (Table 1.1 and Annex 1, Basic Indicators 2016). Population size will also have an important impact on development since very small markets tend to have a narrow resource base, depriving them of the benefits of economies of scale and making them dependent on external and
1 For more on 5G see: “ITU Agrees on Key 5G Performance Requirements for IMT-2020.” Press Release, 23 February 2017. http:// www. itu. int: 80/ en/ mediacentre/ Pages/ 2017- PR04. aspx
2 For more on the exact criteria used to identify LDCs see: https:// www. un. org/ development/ desa/ dpad/ least- developed- country- category/ ldc- criteria. html
3 For the UN-OHRLLS geographical classification of LDCs, see: http:// unohrlls. org/ about- ldcs/
Figure 1.1: Key components that will drive the achievement of SDG Target 9.c to provide universal andaffordableaccesstotheInternetinleastdevelopedcountriesby2020.
Source: ITU.

3
ICTs, LDCs and the SDGs
remote markets, with high export/import costs. This is the case, for example, in Tuvalu, which has about 10 000 inhabitants, and Kiribati, home to some 100 000 inhabitants, but also in Comoros, Djibouti, and Bhutan, with populations of the order of 1 million. Seventeen LDCs are land-locked developing countries (LLDCs), nine are small island developing states (SIDS). LLDCs lack direct access to the sea, which often makes international connectivity more expensive, while many SIDS have nu-merous islands and some are very small and have few inhabitants. Some LDCs are very rural, while others have large, sparsely populated land areas, which makes the rollout of terrestrial communication infrastructure more difficult.
Gross National Income (GNI) per capita is a consideration for inclusion in the LDCs. The 2015 review of the LDC inclusion threshold was set at US$ 1 035. The LDC criteria go beyond income (GNI per capita) and include human assets and economic vulnerability.
The LDC category should be differentiated from the World Bank's low-income category. All of the low-income economies are LDCs (except for the People’s Democratic Republic of Korea and Zimbabwe). Over a third of LDCs are classified as lower-middle income, and Tuvalu is classified as upper-middle income. The majority of LDCs in the Arab States and Asia-Pacific are lower-middle-income economies. The differences in income among the LDCs have implications for Internet affordability as well as skills, since higher levels of income often translate into greater investment in educational systems, and consequently higher levels of education.
South Sudan was the last country to join the group of LDCs in 2012. Equatorial Guinea graduated from the category of LDCs in June 2017. It was the fifth country to graduate since the inception of the category in 1971, following Botswana (1994), Cabo Verde (2007), Maldives (2011) and Samoa (2014). Both Vanuatu and Angola are scheduled to graduate in 2020 and 2021, respectively.
Figure1.2:MapofLDCsaccordingtoITUregionalclassification

4
ICTs, LDCs and the SDGs
Table 1.1: LDCs by ITU region and income grouping
Africa Americas Arab States Asia & Pacific
Non-LLDC or SIDS
Angola†
Benin
Dem. Rep. of the Congo
Eritrea
Gambia
Guinea
Liberia
Madagascar
Mozambique
Senegal
Sierra Leone
Togo
Tanzania
Djibouti†
Mauritania†
Somalia
Sudan†
Yemen†
Bangladesh†
Cambodia†
Myanmar†
LLDCs Burkina Faso
Burundi
Central Afr. Rep.
Chad
Ethiopia
Lesotho
Malawi
Mali
Niger
Rwanda
South Sudan
Uganda
Zambia†
Afghanistan
Bhutan†
Lao PDR†
Nepal
SIDS Guinea-Bissau
S. Tomé and Principe†
Haiti Comoros Kiribati†
Solomon Is.†
Timor-Leste†
Tuvalu‡
Vanuatu†
Note: All low income except † lower middle income, ‡ upper middle income. Source: Adapted from UN-OHRLLS and World Bank and based on ITU regions.
Countries with the LDCs status benefit from special assistance and support measures, for example in the area of trade and through development financing and assistance, debt relief, and technical assistance. The United Nations has mainstreamed the needs of LDCs in its activities and programmes, and the UN Office of the High Representative for Least Developed Countries, Landlocked Developing Countries and Small Island Developing States (UN-OHRLLS) provides special support to the LDCs.
1.2 Broadband Internet for the LDCs
There is a clear recognition of the importance of ICTs in the least developed countries. The Istanbul Programme of Action (IPoA) 2011-2020, adopted by the Fourth UN Conference on the Least Developed Countries, held in Istanbul in 2011 with the aim of helping LDCs to achieve sustainable development, recognizes ICTs as an infrastructure priority on a par with water, electricity, and transport. The IPoA includes a call to "significantly increase access to telecommunication services and strive to provide 100 per cent access to the Internet by 2020" (UN, 2011). It also calls for the creation of a Technology Bank for the LDCs, which was also reaffirmed in the 2030 Agenda. This technology bank for the LDCs was officially established on 23 December 2016, through the adoption of the UN General Assembly Resolution A/71/L.52. In addition, ITU’s Membership recognized the importance of ICTs for LDCs by adopting specific targets for the LDCs in its Connect 2020 Agenda (ITU, 2014) . Target 2, on inclusive-ness, includes specific targets on household access to ICTs, Internet use, and affordability in the LDCs.

5
ICTs, LDCs and the SDGs
ICTs have brought LDCs a tremendous amount of support for tackling development challenges such as financial inclusion, poverty reduction and improved health. Most have been primarily based on basic, low-bandwidth mobile cellular technologies.
The world’s most vulnerable countries have witnessed impressive growth in terms of second genera-tion (2G) mobile cellular network deployment, services and uptake, and falling prices. As of 2016, 2G mobile telephony covered 88 per cent of people living in the LDCs, and it is estimated that penetration will be 70 subscriptions per 100 persons by the end of 2017. Access to mobile networks and services has opened up new opportunities for development in such areas as farming, health, and banking, and has driven the development of new businesses and business models.
One successful example is mobile money, which has spread to many LDCs, helping the unbanked to move from financial exclusion to inclusion. One of the most well-known examples is M-Pesa, launched in 2007 by Safaricom in Kenya, and which today is available in the Democratic Republic of the Congo (DRC), Tanzania, Mozambique, and Lesotho.4 LDCs have also adopted other operator-led mobile money services such as Orange Money, MTN Mobile Money and Tigo Cash, and in a few countries there are bank-led mobile wallets.
Made for basic-feature phones, mobile money services are based on a simple text system that allows users without bank accounts to make and receive payments. Mobile money represents real oppor-tunities for people and small businesses, and has been shown to have long-term effects on poverty reduction, gender equality and employment opportunities, and to reduce inequalities (SDGs 1, 5, 8, and 10) (GSMA, 2017). Mobile money services have opened up new business models and services for governments, businesses and consumers, including in the area of micro-insurance, agriculture and transportation. Development agencies can make conditional cash transfers to mobile money accounts, reducing costs and increasing security.5 Mobile money is also facilitating the deployment of off-grid solar energy in several LDCs by allowing users to make micropayments for repaying the cost of solar panels.6
Another area where ICTs have had an impact in LDCs is agriculture (World Bank, 2017). Mobile phones have helped to increase agricultural productivity and address specific challenges faced by farmers, including female farmers. Cambodia’s Pink Phone project helps women using mobile technologies to exchange ideas and expertise and to access agricultural resources. By tackling socio-cultural practices that limit women’s ownership of mobile devices, the project also enables women to buy bigger plots of land, sell more vegetables, save money, and make improvements to their homes.
4 Monks, Kieron. 2017. “How M-Pesa Changed Banking in Africa.” CNN, February 24. http:// www. cnn. com/ 2017/ 02/ 21/ africa/ mpesa- 10th- anniversary/ index. html
5 Aker, Jenny C., Rachid Boumnijel, Amanda McClelland, and Niall Tierney. 2016. “Payment Mechanisms and Antipoverty Programs: Evidence from a Mobile Money Cash Transfer Experiment in Niger.” Economic Development and Cultural Change 65 (1): 1–37. doi: 10. 1086/ 687578.
6 McKibben, Bill. 2017. “The Race to Solar-Power Africa.” The New Yorker, June 19. http:// www. newyorker. com/ magazine/ 2017/ 06/ 26/ the- race- to- solar- power- africa

6
ICTs, LDCs and the SDGs
The Pink Phones project in Cambodia empowers female farmers
Source: Simon Rawles/Oxfam from www. theguardian. com
In Mali, Coprokazan, a women’s cooperative for the production of shea butter, uses the potential of ICTs, including solar-powered computers, accounting software and video and photos, to deliver training, improve their shea butter quality and increase sales.
Bangladesh’s Kisan Call Centres (KCCs) enable farmers to call a toll-free number to receive real-time advice on farming issues related to livestock, prices and agriculture production, in their local language. The service, which was launched by the Ministry of Agriculture in 2004, also provides information by SMS.7 In Senegal, MLouma is a virtual agricultural platform that enables farmers and investors to obtain real-time information on the price, location and availability of farm products, via a website or using their mobile phone.8 In Niger, expansion of mobile cellular networks has resulted in grain traders using cellphones to reduce search costs, thereby decreasing information asymmetries and improving consumer and trader welfare.9
Health is another area where mobile services have had important development impacts. Innovative applications have helped to provide citizens with critical health information, remind people to take their medication, or provide access to health-related services. In Malawi, Airtel 321 provides infor-mation on maternal and child nutrition, in the local language and via mobile phone. In Tanzania, The Registration Insolvency and Trusteeship Agency (RITA) and mobile operator Tigo, together with UNICEF and local governments, have developed an SMS-based application that makes the birth registration process more efficient, cost-effective and accessible for parents. Since its launch in 2013, the appli-cation has registered nearly 1.5 million children and has been scaled across seven regions. During the Ebola crisis in western Africa, mHero, a mobile phone-based communication system, used basic text messages (SMS) to connect ministries of health and health workers in Guinea, Liberia and Sierra Leone, enabling them to coordinate relief efforts.10.
There are many such examples from LDCs in areas including education, community development and the empowerment of women. What the most successful mobile services and applications have in common is that they are basic, often using voice or SMS services, which are affordable, easy to use, require little bandwidth, and work with feature phones over the 2G network. The Internet can
7 See http:// mkisan. gov. in/ aboutkcc. aspx 8 See https:// www. mlouma. com/ index/ quisommesnous 9 Aker, Jenny C. 2010. “Information from Markets Near and Far: Mobile Phones and Agricultural Markets in Niger.” American
Economic Journal: Applied Economics 2 (3): 46–59. doi: 10. 1257/ app. 2. 3. 46.10 See https:// www. intrahealth. org/ vital/ mhero- story

7
ICTs, LDCs and the SDGs
be accessed over 2G networks, but only at narrowband speeds (i.e., < 256 kbps) using technologies such as GPRS and EDGE. It also requires an Internet-enabled phone.
While the examples cited above show how digital technologies have helped to improve people’s lives, broadband applications and services delivered through the Internet could do even more. Indeed, it can be argued that the people facing the greatest development challenges require the latest and best technologies to provide them with services that are otherwise not available.
In the area of education, for example, many universities offer massive open online courses (MOOCs) to provide quality education, at low cost, to anyone. However, there are few examples of these courses boosting educational levels for people from LDCs and enabling the poorest and most vulnerable to benefit from the opportunity they offer. The fact is that apart from high-speed Internet access, learners need relatively good ICT skills, as well as language skills. Several studies have shown that most people who have successfully finished a MOOC course already had a degree before. Given the low Internet access and literacy rates in LDCs, it is not surprising that so far, few LDCs seem to be benefiting.11
Similarly, those most in need of basic and advanced health services (for example, people living in rural areas) often do not have access to them because health clinics are concentrated in urban areas and because of the lack of medical staff. Tele-medicine and other real-time diagnostic support can link health institutions and medical practitioners in different geographic locations, enabling them to share medical expertise and knowledge. E-health can also be used to train health professionals through online learning, to track diseases and to facilitate health promotion (WHO, 2016). New cloud-based digital health models are emerging in a number of countries and are providing better services at lower cost.
The lack of high-speed connectivity in LDCs remains an obstacle to some of the most promising broadband applications for education, health, and other sectors. Most LDCs face great challenges in making broadband Internet access available and affordable for all.
1.3 SDG Target 9.c and the Internet
SDG Target 9.c explicitly refers to providing universal and affordable access to the Internet in least developed countries by 2020. As noted previously, the tracking indicator adopted for this target is the proportion of the population within range of a mobile signal. To this could be added an affordability indicator relevant for LDCs, such as the price of a mobile broadband subscription as a percentage of income. It could be argued that if LDCs have reached appropriate thresholds for these two supply-side indicators – 100 per cent mobile broadband coverage and prices less than 5 per cent of average per capita income - then they have created the necessary preconditions for Internet use and achieved the target.
There is also, however, a demand-side aspect to this Target since using the Internet requires a certain level of skills. An indicator such as educational attainment might track this. Indeed, this is critical, since while some LDCs have reached a high level of accomplishment with regard to supply-side indicators, they lag in terms of Internet use, which suggests that other factors are at play, and not just broadband coverage and affordability.
It is important to understand current levels and trends with regard to the outcome of SDG Target 9.c, that is, higher levels of Internet use, to see where the LDCs stand and the potential for achieving a high level of Internet use by 2020. One challenge is the limited number of Internet use surveys carried out in the LDCs, necessitating a certain degree of estimation.
In contrast to relatively high mobile subscription penetration, Internet access remains low in the LDCs. It is estimated that by the end of 2017, only 172 million of the nearly 1 billion people living in the LDCs will be using the Internet, corresponding to a usage rate of about 17.5 per cent (Figure 1.3, left). This
11 http:// centaur. reading. ac. uk/ 32452/ 1/ In- depth_ 33_ 1. pdf

8
ICTs, LDCs and the SDGs
was an increase compared to 2010, when Internet penetration was just 4 per cent. However, progress is very slow, with an increase of less than two percentage points between 2016 and 2017. At that rate, it will take over 15 years for the LDCs to get over half their citizens online. It is estimated that over 800 million people in the LDCs are not online, and the five most populated countries (Bangladesh, Ethiopia, DRC, Tanzania and Myanmar) account for almost half that number (Figure 1.3, right). It is estimated that 30 per cent of young people (15-24 years old) in LDCs are using the Internet, and that 35 per cent of all individuals using the Internet in LDCs are young people (ITU, 2017a).
There is a great variation between LDCs in terms of estimated Internet use, from less than 2 per cent of the population to over 40 per cent. Despite the overall low level of Internet use for the group as whole, a few LDCs, mainly in Asia, are forging ahead. Their experiences have one factor in common: meaningful competition in the Internet provision market is driving mobile broadband prices very low and greatly expanding coverage. Some of these countries also have successful programmes connecting schools to the Internet, which has driven Internet use among youth.
Despite adopting the Internet cautiously, Bhutan has witnessed a substantial growth due to wide-spread use of mobile Internet in recent years. Internet subscriptions in the country rose over 300 per cent between 2010 and 2015, from 13 to 59 per 100 people. Mobile broadband accounted for 90 per cent of all Internet subscriptions in 2015 and a 3G or 4G network covered around 80 per cent of the population in 2016. The market is relatively competitive, with three Internet Service Providers (ISPs) for a population of less than 800 000. This has impacted tariffs, and the country has the lowest relative price for a monthly prepaid basket of 500 MB, which costs just 0.84 per cent of average per capita income. Unlike many other LDCs, electricity in Bhutan is not a problem: the mountainous king-dom has abundant hydro-electric power and exports electricity. The price of electricity is 5.7 US cents per kWh, the fourth lowest in the LDCs. Despite its relatively high Internet use among LDCs, Bhutan does not do particularly well in terms of educational attainment indicators. The literacy rate in 2012 was 63 per cent among the population 6 years and above, the same as the LDC average. While the proportion of those 25 years and older with some secondary education is 26 per cent for the LDCs as a group, in Bhutan it is less than half that, at 10 per cent. However, it is making up for the lag with a secondary gross enrolment ratio of 88 per cent compared to just 44 per cent in the LDCs. A related factor is the connection of almost all secondary schools to the Internet and an extensive network of some 200 community centres providing free Internet access where the public can go to for basic computer lessons as well as advanced courses.12
12 https:// www. pressreader. com/ bhutan/ bhutan- times/ 20151025/ 281565174619195
Figure1.3:Internetuseandproportionofpopulationnotonlinebycountry,2017,LDCs
Note: For Internet use data by country, see Annex 1, The three Dimensions of SDG Target 9.c. Source: ITU.

9
ICTs, LDCs and the SDGs
Cambodia has one of the more competitive mobile Internet markets among LDCs, with six active oper-ators. It was also one of the first LDCs to launch mobile broadband when 3G networks were launched in 2007. Its proximity to China has resulted in the availability of inexpensive Chinese handsets. These factors have combined to make Cambodia the LDC with the lowest prepaid mobile broadband prices, just one US dollar a month for a 500 MB package. At the same time, there has been continuous re-search to adapt devices to the Khmer script, increasing acceptance among users. Literacy is high at 77 per cent, compared to the LDC average of 63 per cent. In 2009, an agreement was reached between the Ministry of Education and one of the country's telecom operators to provide Internet access in all schools with electricity, which was accomplished in 2011.13 The agreement was renewed in 2015, providing free broadband access to around 1 million students and teachers for five years as part of the operator's corporate social responsibility initiatives.14 According to one survey, by 2016, 37 per cent of the population used the Internet, close to the developing country average.15
Myanmar is a prime example of a country leap-frogging in ICT development. The telecommunication market was opened to competition in 2014, when licences were granted to two strong companies with extensive experience of operating in developing countries - Norwegian operator Telenor and Qatar's OOREDOO. They both launched 3G mobile broadband from the start and offered attractive packages for smartphones. The results have been impressive: mobile broadband covered over one fifth of the population by 2014 and 100 per cent by 2016. Prices dropped dramatically, with a monthly 500 MB prepaid package costing just 2.5 per cent of average per capita income in 2016. Most new subscribers have gone over to advanced handsets, with smartphone penetration of over 80 per cent.16 These factors, combined with a literacy rate of 93 per cent, resulted in Internet use skyrocketing from 4 per cent of the population in 201217 to 25 per cent by 2016.
Sao Tome and Principe is estimated to have the highest level of Internet use among African LDCs. The twin island nation has a land area of less than 1 000 km, is the third smallest among the LDCs, and has the sixth highest population density in the LDC group. This makes it relatively easier to install infrastructure and 3G mobile broadband, which was launched only in 2012 and now covers over 90 per cent of the population. The transformational event was the connection in 2012 to the Africa Coast to Europe (ACE) undersea fibre-optic cable. Previously the country had relied on costly satellite links. Following connection to the ACE, use of international Internet bandwidth increased over 15-fold and Internet use grew by 67 per cent.18 Another significant event was the launch of competition in 2015. This had a significant impact on prices, and in 2015 the price of a monthly 500 MB prepaid mobile broadband basket was 3.3 per cent of average per capita income. In terms of “soft” factors, the coun-try has a young population, with half the population under the age of twenty. Secondary education enrolment is high, at 85 per cent of the relevant school-age population. Young people have flocked to the Internet, with usage of 38 per cent among those aged 15-24 years in 2014. One factor in this has been a high level of Internet connectivity in schools, which dates back to 2009 corporate social responsibility initiatives by the incumbent operator.19 Some of the funds received from the second operator’s licence are being used to provide tablets for secondary students.20 One challenge is the
13 http:// english. hvct. edu. vn/ education- ministry- viettel- extend- school- internet- project. aspx? tabid= 466& a= 790& pid= 1114 MetFone. 2016. “Education Minister Hails MetFone’s Move to Expand Internet Access to More Schools.” Press Release,
July 8. http:// www. metfone. com. kh/ en/ news/ event/ education- minister- hails- metfone’s- move- to- expand- internet- access- to- more- schools
15 Kimchhoy Phong, Lihol Srou, and Javier Solá. 2016. Mobile Phones and Internet Use in Cambodia 2016. The Asia Foundation, USAID and the Open Institute.
16 Voda, Wayan. 2015. “Wow! Myanmar Is Going Straight to Smartphones.” ICT Works. September 30. http:// www. ictworks. org/ 2015/ 09/ 30/ wow- myanmar- is- going- straight- to- smartphones/
17 https:// www. bbg. gov/ wp- content/ media/ 2012/ 09/ gallup- burma- brief. pdf18 d'Alva, Emery. 2015. “Broadband Costing and Pricing – The Case of Sao Tome and Principe.” presented at the ITU-D
Regional Economic and Financial Forum of Telecommunications / ICTs for Africa, Sao Tome and Principe, February 3. https:// www. itu. int/ en/ ITU- D/ Regulatory- Market/ Documents/ Events/ 2015/ Sao_ Tome/ Session%206 _d’Alva_ revised. pdf
19 http:// www. telanon. info/ sociedade/ 2009/ 06/ 16/ 1452/ cst- e- o- governo- lancaram- campanha- de- internet- nas- escolas- secundarias/
20 http:// www. afap. st/ phocadownloadpap/ CAB2_ STP_ AM_ nov%202014 %20_ PROJECTO%20 CENTRAL%20 AFRICAN%20 BACKBONE. pdf

10
ICTs, LDCs and the SDGs
need to tackle the gender gap among young people in terms of Internet use: in 2014, 32 per cent of young women aged 15-24 were online, compared to 43 per cent of young men in that age group.21
1.4 Digital gaps between LDCs and the rest of the world
This section highlights the gaps between LDCs and the rest of the world in order to illustrate the magnitude of the challenge of providing universal access to the Internet by 2020.
1.4.1 Theconnectivitygap
Mobile-cellular penetration has reached over 70 per cent in the LDCs, highlighting the great success that mobile networks and services have had in connecting not only urban, better educated and wealthier groups, but also people in previously unconnected and rural areas. Mobile-broadband penetration is also increasing in the LDCs, where it stood at just above one fifth of the population in 2017. However, this must be compared to figures of close to 50 per cent globally and 90 per cent in the developed countries.
Most people in the LDCs still do not - or do not fully benefit from the rapid expansion of digital tech-nology and the opportunities it offers. ITU data reveal substantial differences in connectivity and access between LDCs and the rest of the world, especially in terms of high-speed broadband access and Internet use (Figure 1.4).
Developing countries, and in particular the LDCs, lag behind developed countries in terms of fixed-broadband penetration, household access to ICTs and Internet uptake. Globally, 3.9 billion people, more than half the world’s total population, are still offline and the majority of these people are from the world’s most vulnerable countries, the LDCs, LLDCs and SIDS. Almost a fifth of the offline population - over 800 million people - live in the LDCs.
Figure1.4:ICTpenetrationlevelsbylevelofdevelopment,2017
Note:ITUestimates. Source:ITU,2016.
21 National Institute of Statistics, 2016. Sao Tome and Principe Multiple Indicator Cluster Survey 2014, Final Report.

11
ICTs, LDCs and the SDGs
Differences between the LDCs and the rest of the world are highlighted in international benchmarks such as the ITU’s ICT Development Index (IDI), where LDCs rank at the bottom of the list (Box 1-2).
Box 1-2: The least developed countries and the ICT Development Index
The 2016 ICT Development Index (IDI) published by the ITU is a composite index that combines 11 indicators for ICT access, use and skills into one benchmarking measure to highlight progress for 175 economies. Comparison of the rankings suggests that LDCs are not catching up fast enough in terms of ICT development. All of the lowest ranked 27 countries are LDCs. The highest-ranked LDC is Bhutan, in 117th place. This is of particular concern, given the potential role of ICTs in facilitating sustainable development.
The table below compares the IDI performance of LDCs with that of developed countries, developing countries and the global average in the period 2015-16. The overall performance of LDCs during this period follows the trend of the previous period (2010-15), remaining below that of the higher- and middle-income developing countries. The LDCs average improvement in their IDI value was 0.16 points between 2015 and 2016, compared to 0.22 points for all developing countries (including LDCs) and 0.24 points for developing countries other than LDCs.
Source:ITU,2016.
National backbone infrastructure and international Internet connectivity are critical building blocks for driving broadband demand, access and use. Growth in broadband subscriptions is accompanied by continuous growth in national backbone capacities and international Internet bandwidth. Indeed, without growth in the deployment of backbone infrastructure, service providers are unable to expand their markets to previously underserved regions and deliver high-speed and high-quality services to customers.
Data on the deployment of ICT transmission capacity shows that by the end of 2016, a total of more than 10 billion km of optical fibre and microwave backbone transmission networks from 378 opera-tors was available worldwide. While these data do not cover all operators or countries, they highlight the considerable expansion of and investment in international backbone infrastructure. At the same time, major differences exist among regions and countries. As highlighted in Figure 1.5, route metres of optical fibre and microwave backbone network per capita remain below 1 in the Arab States and Africa; they are highest in Europe. Tracking the population living within a range of 10, 25 and 50 km of an operational fibre transmission network also provides a measure of access. Populations living more than 50 km from a network are considered to be out of reach. In 2016, about 20 per cent of Africa’s population lived within a range of 10 km; 36.3 per cent lived out of reach.
The amount of international Internet bandwidth available in a country or region provides important insights into the quality and speed of networks and is another key indicator of countries’ readiness to become information societies. International Internet bandwidth is a key building block for delivering data-intensive applications and services through high-speed networks. While national optical fibre transmission networks constitute essential infrastructure for access to high-speed networks, infor-mation on bandwidth is also required to gauge the actual quality and speed available.

12
ICTs, LDCs and the SDGs
Over the past decade, total international Internet bandwidth has climbed sharply, from around 32 000 Gbps in 2008 to 250 000 Gbps in 2016. This strong growth reflects the significant investment that has been made in backbone infrastructure - in particular in important submarine cable projects - in all parts of the world. The growth in international bandwidth has been strong in all regions. The developing country share of total international bandwidth increased from around 11 per cent in 2005 to almost 40 per cent in 2015. Europe leads by far, accounting for more than 40 per cent of total international Internet bandwidth in 2015; in the same year, Africa’s share was less than 3 per cent (Figure 1.6, left).
The availability of international bandwidth differs widely across regions and countries. Bandwidth per inhabitant has increased significantly over the past decade, and yet there are huge differences between developed and developing regions; there is almost three times as much international band-width per inhabitant (140 kbps versus 53 kbps) available in the former than in the latter (Figure 1.6, right). International Internet bandwidth per inhabitant remains particularly low in the LDCs, suggesting that the lack of international connectivity remains a major bottleneck in the Internet infrastructure of these countries.
Figure1.5:Routemetresoffibreandmicrowavebackbonepercapitabyregion,2016
Note:ForcountrydataseeAnnex1,InfrastructureBackboneIndicators,2016. Source: ITU.

13
ICTs, LDCs and the SDGs
Figure1.6:ShareoftotalinternationalInternetbandwidthandInternationalInternetbandwidthper inhabitant, by region
Note:ForcountrydataseeAnnex1,InfrastructureBackboneIndicators,2016. Source:ITU,2017a.
1.4.2 Theaffordabilitygap
In 2010, the Broadband Commission for Sustainable Development, an initiative led by ITU and UNESCO to increase awareness of the importance of broadband for achieving international development goals, identified four specific ICT targets, on broadband strategies, affordability, connectivity, and use. Target 2 is about making broadband affordable: “By 2015, entry-level broadband services should be made affordable (less than 5% of average monthly income) in developing countries through adequate reg-ulation and market forces” (Broadband Commission for Sustainable Development, 2015). By the end of 2016 this target, based on a 1 GB data plan, had been achieved for mobile broadband affordability in all developed and in 73 developing countries, but in only five LDCs (Figure 1.7).
Figure1.7:Progresstowardsthetargetofmakingbroadbandaffordable,2016
Note:BasedonQ42016dataavailablefor169countries.Pricesarebasedonentry-levelplanswithaminimumdataallowanceof 1 GB per month. Source: ITU.
14
ICTs, LDCs and the SDGs
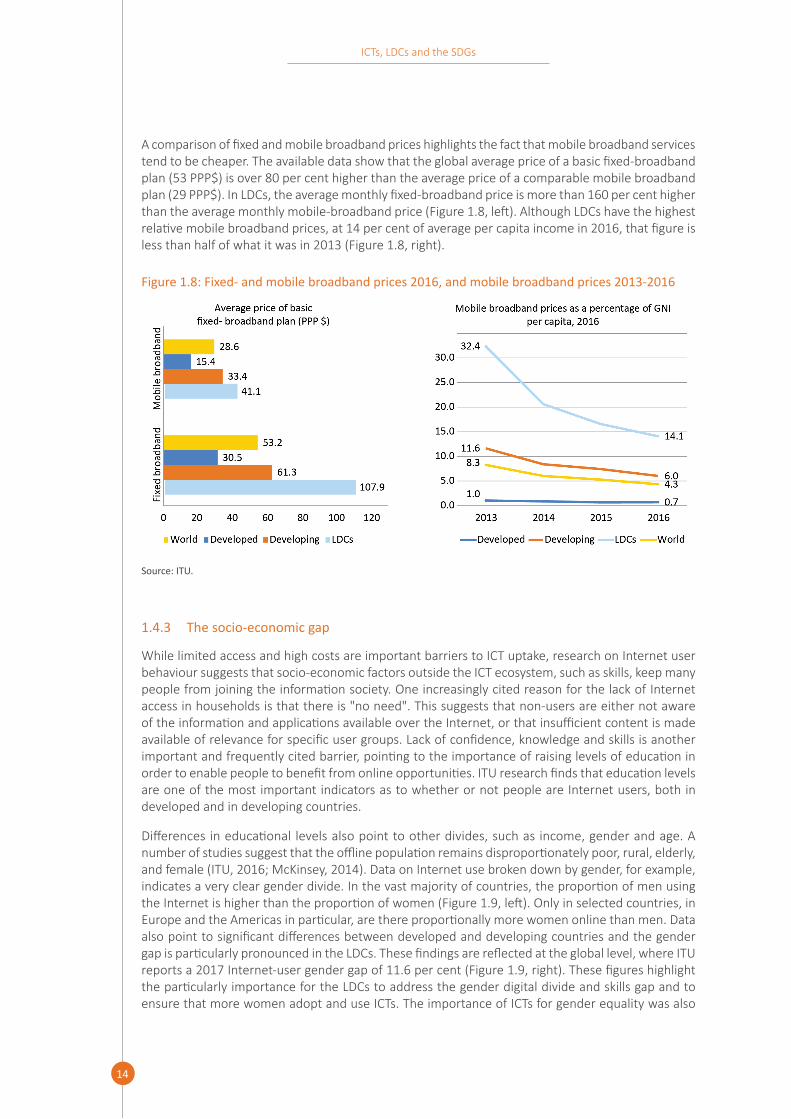
A comparison of fixed and mobile broadband prices highlights the fact that mobile broadband services tend to be cheaper. The available data show that the global average price of a basic fixed-broadband plan (53 PPP$) is over 80 per cent higher than the average price of a comparable mobile broadband plan (29 PPP$). In LDCs, the average monthly fixed-broadband price is more than 160 per cent higher than the average monthly mobile-broadband price (Figure 1.8, left). Although LDCs have the highest relative mobile broadband prices, at 14 per cent of average per capita income in 2016, that figure is less than half of what it was in 2013 (Figure 1.8, right).
Figure1.8:Fixed-andmobilebroadbandprices2016,andmobilebroadbandprices2013-2016
Source: ITU.
1.4.3 The socio-economic gap
While limited access and high costs are important barriers to ICT uptake, research on Internet user behaviour suggests that socio-economic factors outside the ICT ecosystem, such as skills, keep many people from joining the information society. One increasingly cited reason for the lack of Internet access in households is that there is "no need". This suggests that non-users are either not aware of the information and applications available over the Internet, or that insufficient content is made available of relevance for specific user groups. Lack of confidence, knowledge and skills is another important and frequently cited barrier, pointing to the importance of raising levels of education in order to enable people to benefit from online opportunities. ITU research finds that education levels are one of the most important indicators as to whether or not people are Internet users, both in developed and in developing countries.
Differences in educational levels also point to other divides, such as income, gender and age. A number of studies suggest that the offline population remains disproportionately poor, rural, elderly, and female (ITU, 2016; McKinsey, 2014). Data on Internet use broken down by gender, for example, indicates a very clear gender divide. In the vast majority of countries, the proportion of men using the Internet is higher than the proportion of women (Figure 1.9, left). Only in selected countries, in Europe and the Americas in particular, are there proportionally more women online than men. Data also point to significant differences between developed and developing countries and the gender gap is particularly pronounced in the LDCs. These findings are reflected at the global level, where ITU reports a 2017 Internet-user gender gap of 11.6 per cent (Figure 1.9, right). These figures highlight the particularly importance for the LDCs to address the gender digital divide and skills gap and to ensure that more women adopt and use ICTs. The importance of ICTs for gender equality was also

15
ICTs, LDCs and the SDGs
recognized by the 2030 Agenda, which underlined the need to “Enhance the use of enabling tech-nology, in particular information and communications technology, to promote the empowerment of women” (SDG Goal 5.b).
Figure1.9:ProportionofindividualsusingtheInternetbygender2016,andInternetusergendergap2013and2017
Notes:ThegendergaprepresentsthedifferencebetweenInternetuserpenetrationratesamongfemalescomparedtothoseofmales, expressed as a percentage. Source:ITU,2017a.
Differences in levels of education and school enrolment are important factors in explaining why more men than women use the Internet. Some countries in which more women than men are Internet users are also countries that do well in terms of the gender parity index (GPI), which measures the relative proportions of girls and boys enrolled in school. The high proportion of women in the labour force also reflect gender equality in these countries.
ITU research also finds that within the online population, important differences exist in terms of the types of online activity engaged in by Internet users. Education levels seem to influence the type of activity in which users engage, with implications for their potential gains. Many Internet users, in particular those with lower levels of education and income, make very limited use of the Internet and are not able to exploit its full potential. In developing countries, the Internet is still used mainly for communication and entertainment purposes. In developed countries, citizens use the Internet to a greater degree for reading newspapers, magazines, and books, interacting with government, and performing banking and e-commerce services (ITU, 2016).
1.4.4 Roadmap to the rest of the report
This chapter has highlighted the rapid growth seen in LDCs in terms of ICT access and use, and the evolution towards the promise of a global information society that delivers new opportunities for development to everyone. Despite the progress, however, major differences continue to exist be-tween LDCs and the rest of the world in ICT access, use, and affordability, in particular in terms of broadband Internet access and use.
A recently published ITU discussion paper identifies barriers to greater ICT uptake and use. The paper states that “the key reasons for people not using the Internet are structural inequalities in income

16
ICTs, LDCs and the SDGs
and education as well as the lack of infrastructure, relevant online content and services and high relative costs of access and usage.” (ITU, 2017b). It provides an overview of possible measures that could help to increase the number of Internet users, both from the demand and the supply side. These include measures such as creating and developing local content in local languages; addressing issues of cultural and social acceptance; providing training; and making women a special focus group. On the supply side, suggested measures include developing large-scale cost-effective rural solutions to expand networks, and building fixed infrastructure to support the digital economy (Figure 1.10).
Figure1.10:Demand-andsupply-sidemeasurestoincreaseInternetuse
Source:ITU,2017b.
The other chapters of this report take a more detailed look at key factors for achieving SDG Target 9.c. Chapter two, Expanding supply side infrastructure, assesses local access to the Internet, national backbones and international capacity as well as related issues such as competition, public-private partnerships and regulatory environments in LDCs. Chapter 3, Sustaining the Internet ecosystem, con-siders how to make the Internet sustainable in the LDCs and looks at the fundamental components that store and exchange data: Internet exchanges, data centres and cloud computing and hosting services. Chapter 4, Making the Internet affordable, considers affordability from a range of angles such as benchmarking Internet prices, the ways in which operators adapt pricing schemes to low-income groups, data consumption patterns and zero-rated access. Demand-side issues, specifically digital literacy, are the topic of Chapter 5, Skills for using the Internet, which looks at the capacity to use the Internet in the LDCs and the extent to which a shortage of skills is inhibiting greater diffusion. The final chapter reviews the level of progress made by LDCs towards achievement of SDG Target 9.c, forecasts where LDCs will stand with regard to the goal's deadline of 2020, and concludes with recom-mendations for accelerating progress to achieve universal access to and affordability of the Internet.
Specific LDCs are highlighted in a number of boxes describing developments in particular areas relating to infrastructure, affordability, skills and sustaining the Internet.

17
ICTs, LDCs and the SDGs
2 Expanding supply-side infrastructureAccess to ICTs in the least developed countries (LDCs) is influenced by a range of exogenous factors such as land area, population density, location and governance, as well as endogenous factors relating to regulatory issues such competition, spectrum, infrastructure sharing and universal service. This chapter assesses ICT infrastructure and related issues such as competition, public-private partnerships and regulatory environments in LDCs.
The World Bank provides a useful framework for the ICT value chain stretching from the point at which the Internet enters a country (the “first mile”), passing through that country (the “middle mile”), and finally reaching the end user (the “last mile”) (Figure 2.1) (World Bank, 2016). The first mile refers to international connectivity. The middle mile refers to national backbones and associated elements such as data centres and Internet exchanges (discussed in Chapter 3). The last mile refers to local access networks that reach the end user. There are also elements complementing infrastructure roll-out referred to as the hidden mile. These constitute regulatory issues such as infrastructure sharing, frequency management, licensing frameworks and universal service.
This chapter compares the LDCs in terms of their last mile (local access networks), in particular broadband Internet access. It outlines regulatory, policy, institutional and other factors that underlie ICT sector growth in LDCs. It assesses the middle mile covering both national and regional backbone networks. Finally, it examines the first mile (international connectivity) and associated regulatory challenges facing LDCs, in particular the land-locked and small island LDCs.
Figure2.1:ThedifferentmilesofICTinfrastructure
Source: Tim Kelly, How the WDR16 Policy Framework is applied in the Union of Comoros.

18
ICTs, LDCs and the SDGs
2.1 Local access networks
Access networks represent the most visible component of infrastructure to the end users, consisting of fixed and wireless services provided to end users.
2.1.1 Mobile
The uptake of GSM 2G mobile services in the LDCs has been phenomenal. Mobile penetration in terms of number of subscriptions was 33 per cent in 2010 and reached 70 per cent in 2017 (Figure 2.2, left). Although there has been slower growth in recent years, this is partly due to disconnections from SIM card registration programmes and a reduced need for multiple accounts as the price of calling across networks has fallen. Six LDCs (Cambodia, Gambia, Lesotho, Mali, Nepal and Timor-Leste) had more mobile subscriptions than people in 2016 (Figure 2.2, right). The spread of 2G mobile networks has not only enabled voice communications for millions of people living in the LDCs but also triggered the development of applications such as mobile money and agricultural and health text messaging services. 2G mobile networks also support Internet access albeit at very limited narrowband speeds of less than 256 kbps.
Figure2.2:Mobilecellularsubscriptions(per100inhabitants)
Note:ForcountrydataseeAnnex1,InfrastructureAccessIndicators,2016. Source: ITU.
Growth in mobile access has been driven by the prepaid model, which fits the economic circumstances of the LDCs. Another driver has been competition, although the quality varies. Some LDCs that have been able to attract strong operators have often witnessed stronger growth (Box 2-1). Furthermore, the idea that market size limits the potential for competition has not been the case in LDCs with smaller populations (Box 2-2).

19
ICTs, LDCs and the SDGs
Box2-1:Competition,privatizationandstrongoperatorsinMali
Mobile subscription penetration surpassed the number of people in Mali in 2013. Given that mobile penetration can be misleading, as one person can have multiple SIM cards or lapsed accounts, it is also useful to look at demand-side statistics such as the proportion of households with a mobile phone. Here too, Mali is a leader, as one of only six LDCs in which at least nine out of ten households have a mobile phone. In 2015, 90 per cent of Malian households had a mobile phone, without a very wide gap between urban homes (98 per cent) and rural homes (88 per cent).1
Mobile growth has been driven by sector reforms taking place over the last decade. The incumbent telecom operator SOTELMA was privatized in 2009, when a 51 per cent stake was sold to Maroc Telecom. SOTELMA was the sole operator until Orange Mali launched its services in 2003 after winning a fixed-line, mobile, and Internet services licence. Orange Mali is 70 per cent owned by Orange France managed through its subsidiary Sonatel, an operator in neighbouring Senegal. Orange has been aggressive in expanding the network, partly because it has direct access to submarine cable via Senegal.
The privatization of SOTELMA injected a fresh energy, leading to fierce competition with Orange. Despite a duopoly and Orange's high market share, the mobile market has grown tremendously with ongoing promotions and steadily falling prices. A key reason is the strength and experience of the operators.
1 Programme National de Lutte contre le Paludisme (PNLP), Institut National de la Statistique (INSTAT), INFO-STAT, Institut National de la Recherche en Santé Publique (INRSP) et ICF International, 2016. Enquête sur les Indicateurs du Paludisme au Mali (EIPM) 2015.
Box2-2:Timor-Leste:Threeisbetterthanone
When Timor-Leste became independent on 20 May 2002, it did not have a GSM mobile network. Timor Telecom (TT), a subsidiary of Portugal Telecom, was granted a 15-year exclusive licence and launched a mobile service in the new country in March 2003. Although over half the population had a mobile subscription by 2011, the government decided that competition was essential to widen coverage and lower prices. An agreement was reached with TT to end its monopoly earlier than planned. A tender was subsequently launched for two mobile licences. In 2013 the two new operators, Viet Namese-owned Viettel (operating as Telemor) and Indonesian-owned Telin (operating as Telkomcel), launched their respective mobile offerings. A year later mobile subscription penetration exceeded the population. The amazing impact of competition refutes the often held view that small island developing States have limited market sizes that cannot sustain competition.
Increasing access to 2G GSM mobile networks in the LDCs is reflected by the increased proportion of the population that can receive a signal (Figure 2.3, left). This rose from 71 per cent in 2010 to 88 per cent in 2016, up 17 percentage points. Growth has been flat for the last few years, suggesting that there are bottlenecks in raising coverage another 12 points to achieve ubiquity. One challenge is the high cost of rolling out services in the remaining largely remote rural areas where roads are scarce, grid electricity rare and incomes low. There is a lack of commercial interest in rolling out infrastructure in these areas and they are likely to require some kind of public/universal service support.
Six LDCs (Bangladesh, Benin, Cambodia, Guinea, Myanmar and Rwanda) have achieved virtually com-plete coverage, with over 99 per cent of their populations able to receive a 2G mobile signal. Almost

20
ICTs, LDCs and the SDGs
half the LDCs have reached a high level of coverage of between 90 and 99 per cent. Another 20 per cent are on their way, with coverage reaching between 75 and 90 per cent. One-fifth of LDCs have 2G coverage of less than 75 per cent of the population (Figure 2.3, right).
Figure2.3:2GMobilecoverage(%ofpopulation),LDCs
Note:ForcountrydataseeAnnex1,InfrastructureAccessIndicators,2016. Source: ITU.
The LDCs performing poorly in terms of mobile subscription penetration are all in Africa, namely, Eritrea, the Central African Republic, South Sudan, Djibouti, and the Democratic Republic of the Congo, and are characterized by having either no competition or weak governance. Djibouti and Eritrea have just one state-owned operator providing a mobile service. The Central African Republic, Democratic Republic of the Congo, and South Sudan, suffer from unstable governance and rank 3rd, 7th and 1st in the world in terms of fragility.22 However, a lack of competition and fragility is not necessarily a guar-antee of the worst performance. Somalia is ranked 2nd for fragility and Ethiopia has no competition, but both countries have mobile subscription penetration of over 50 per cent. In these cases, other factors have helped to offset the liabilities. Somalia has a vibrant and competitive mobile sector, and in Ethiopia, the Government has invested significant resources in telecommunications.
Mobile subscription penetration does not provide a precise figure of actual take-up. As noted above, some LDCs have more subscriptions than people, even though not everyone has a subscription, be-cause of multiple SIM cards and lapsed subscriptions. For example, mobile subscription penetration in Chad was 44 per cent in 2016 compared to a figure of only 28 per cent for unique subscribers.23
Household surveys offer an important insight into mobile access and are able to disaggregate own-ership by rural and urban location. Household surveys were carried out in all but four LDCs between 2012 and 2016. Based on the latest available surveys, the proportion of households with a mobile phone is 71 per cent in the LDCs, a slightly higher proportion than subscription penetration. Six LDCs have reached the threshold towards universality, with the proportion of households with a mobile
22 See the "Fragile States Index" at: http:// fundforpeace. org/ fsi/ data/ 23 Lopez Calix, Jose, and Michel Rogy. 2017. Enabling the Digital Revolution in Sub-Saharan Africa : What Role for Policy
Reforms? AFCW3 Economic Update. World Bank. http:// documents. worldbank. org/ curated/ en/ 822981493749732711/ Enabling- the- digital- revolution- in- Sub- Saharan- Africa- what- role- for- policy- reforms
21
ICTs, LDCs and the SDGs
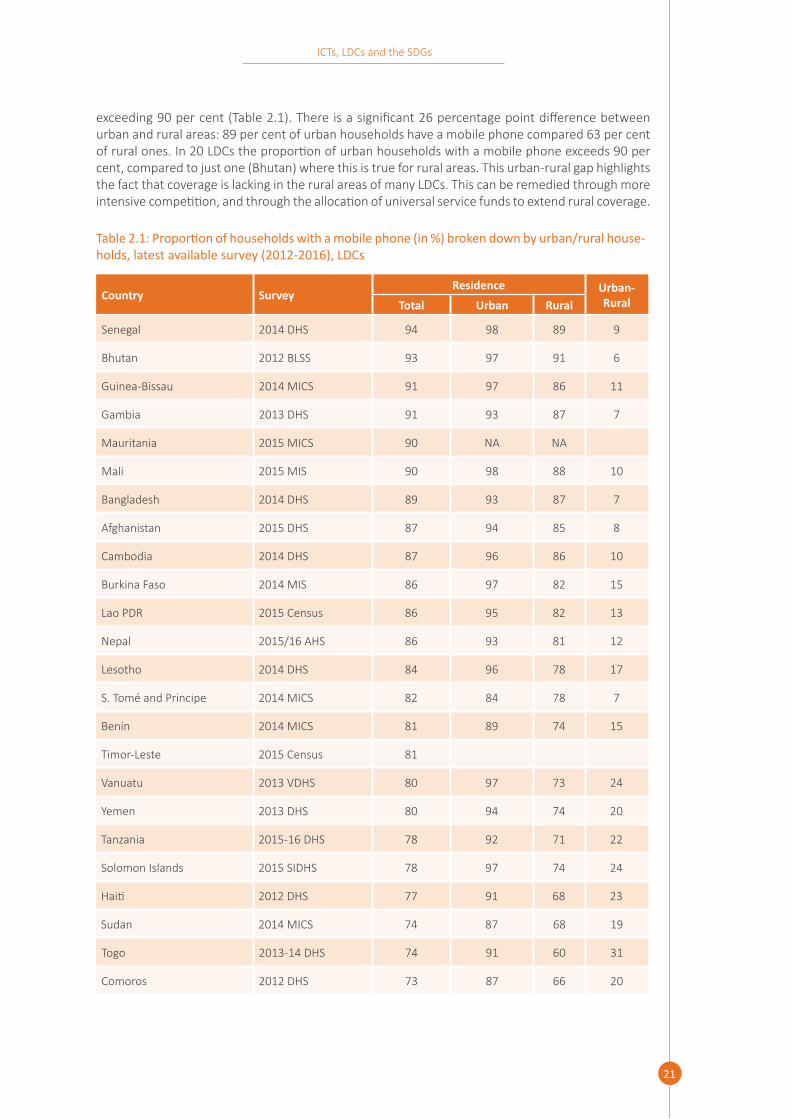
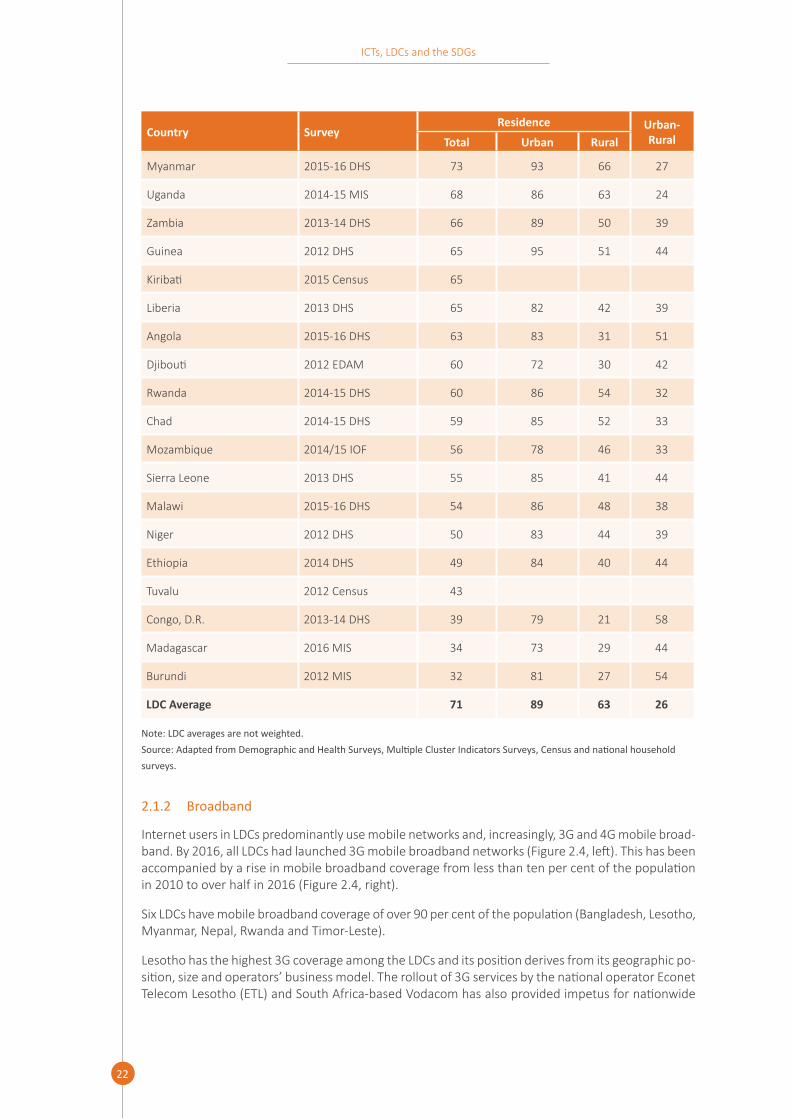
exceeding 90 per cent (Table 2.1). There is a significant 26 percentage point difference between urban and rural areas: 89 per cent of urban households have a mobile phone compared 63 per cent of rural ones. In 20 LDCs the proportion of urban households with a mobile phone exceeds 90 per cent, compared to just one (Bhutan) where this is true for rural areas. This urban-rural gap highlights the fact that coverage is lacking in the rural areas of many LDCs. This can be remedied through more intensive competition, and through the allocation of universal service funds to extend rural coverage.
Table2.1:Proportionofhouseholdswithamobilephone(in%)brokendownbyurban/ruralhouse-holds,latestavailablesurvey(2012-2016),LDCs
Country SurveyResidence Urban-
RuralTotal Urban Rural
Senegal 2014 DHS 94 98 89 9
Bhutan 2012 BLSS 93 97 91 6
Guinea-Bissau 2014 MICS 91 97 86 11
Gambia 2013 DHS 91 93 87 7
Mauritania 2015 MICS 90 NA NA
Mali 2015 MIS 90 98 88 10
Bangladesh 2014 DHS 89 93 87 7
Afghanistan 2015 DHS 87 94 85 8
Cambodia 2014 DHS 87 96 86 10
Burkina Faso 2014 MIS 86 97 82 15
Lao PDR 2015 Census 86 95 82 13
Nepal 2015/16 AHS 86 93 81 12
Lesotho 2014 DHS 84 96 78 17
S. Tomé and Principe 2014 MICS 82 84 78 7
Benin 2014 MICS 81 89 74 15
Timor-Leste 2015 Census 81
Vanuatu 2013 VDHS 80 97 73 24
Yemen 2013 DHS 80 94 74 20
Tanzania 2015-16 DHS 78 92 71 22
Solomon Islands 2015 SIDHS 78 97 74 24
Haiti 2012 DHS 77 91 68 23
Sudan 2014 MICS 74 87 68 19
Togo 2013-14 DHS 74 91 60 31
Comoros 2012 DHS 73 87 66 20
22
ICTs, LDCs and the SDGs
Country SurveyResidence Urban-
RuralTotal Urban Rural
Myanmar 2015-16 DHS 73 93 66 27
Uganda 2014-15 MIS 68 86 63 24
Zambia 2013-14 DHS 66 89 50 39
Guinea 2012 DHS 65 95 51 44
Kiribati 2015 Census 65
Liberia 2013 DHS 65 82 42 39
Angola 2015-16 DHS 63 83 31 51
Djibouti 2012 EDAM 60 72 30 42
Rwanda 2014-15 DHS 60 86 54 32
Chad 2014-15 DHS 59 85 52 33
Mozambique 2014/15 IOF 56 78 46 33
Sierra Leone 2013 DHS 55 85 41 44
Malawi 2015-16 DHS 54 86 48 38
Niger 2012 DHS 50 83 44 39
Ethiopia 2014 DHS 49 84 40 44
Tuvalu 2012 Census 43
Congo, D.R. 2013-14 DHS 39 79 21 58
Madagascar 2016 MIS 34 73 29 44
Burundi 2012 MIS 32 81 27 54
LDC Average 71 89 63 26
Note: LDC averages are not weighted. Source:AdaptedfromDemographicandHealthSurveys,MultipleClusterIndicatorsSurveys,Censusandnationalhouseholdsurveys.
2.1.2 Broadband
Internet users in LDCs predominantly use mobile networks and, increasingly, 3G and 4G mobile broad-band. By 2016, all LDCs had launched 3G mobile broadband networks (Figure 2.4, left). This has been accompanied by a rise in mobile broadband coverage from less than ten per cent of the population in 2010 to over half in 2016 (Figure 2.4, right).
Six LDCs have mobile broadband coverage of over 90 per cent of the population (Bangladesh, Lesotho, Myanmar, Nepal, Rwanda and Timor-Leste).
Lesotho has the highest 3G coverage among the LDCs and its position derives from its geographic po-sition, size and operators’ business model. The rollout of 3G services by the national operator Econet Telecom Lesotho (ETL) and South Africa-based Vodacom has also provided impetus for nationwide

23
ICTs, LDCs and the SDGs
signal coverage which boosted usage. Mobile broadband penetration stood at 37 per cent in 2016.24 Vodacom was the first operator to introduce mobile broadband services in the country, based on high-speed packet access (HSPA) technology. In parallel, the company has rolled out a WiMAX network. Several other Internet service providers have also rolled out their own wireless infrastructure, which has improved overall wireless networking and raised the country’s Internet profile.
Fourth generation (4G) Long Term Evolution (LTE) services can be a transformational game changer for LDCs. LTE-Advanced provides theoretical download speeds of 1 Gbps, some 12 times faster than the most advanced 3G+ network. Given the widespread penetration of wireless technologies throughout the LDCs, LTE is the logical next step and provides a solid platform for the data-intensive applications that could hugely impact social and economic development in the world's most vulnerable nations. By the end of 2016, 32 LDCs had commercially deployed 4G/LTE networks. Although coverage is limited mainly to urban areas in most LDCs, it is growing rapidly. Some of these countries, such as Rwanda and Senegal, have established targets, with Rwanda aiming for 95 per cent coverage by 2018 and Senegal looking to have 90 per cent of the population covered by 2025.
The allocation of the 700/800 MHz-band spectrum freed up by the migration from analogue to digital broadcasting (the so-called “digital dividend”) has emerged as an important tool for promoting the deployment of 4G LTE, with its high propagation, is ideally suited to rural areas. A number of LDCs, including Bhutan, Cambodia, Comoros, Malawi, Rwanda, Tanzania, Uganda and Vanuatu, have allo-cated the band for LTE.
Some operators are delaying the launch of 4G services in the hope of getting the most out of 3G investments, while in some countries, reserve prices for auctions have been set high, dampening investor interest.
The case of Rwanda (described in Box 2-3) shows that governments can play an important role in the deployment of mobile broadband networks through public-private partnerships. The model allows for fast deployment of a broadband network and helps LDCs leverage the national backbone for extending access to the Internet to underserved areas.
24 ITU, Lesotho Country Profile, https:// www. itu. int/ net4/ itu- d/ icteye/ CountryProfileReport. aspx? countryID= 137
Figure2.4:Availabilityof3Gnetworkand3Gcoverage(%ofpopulation),LDCs
Note: Right chart based on simple average. Source: ITU.

24
ICTs, LDCs and the SDGs
Box 2-3: PPPs for 4G in Rwanda
In November 2014, Rwanda launched a 4G LTE network through a public-private partnership (PPP) agreement between the Government of Rwanda and Korea Telecom (KT). The PPP model was used to address the Government's wish to rapidly deploy the highest-speed mobile broadband throughout the country. With a share of 49 per cent, the Government contributed its national fibrefibre backbone network, national data centre, spectrum holdings and wholesale licence (valued at US$130 million) to the 25-year joint venture KTRN (Korea Telecom Rwanda Network). KT will contribute US$140 million through the construction of a 4G LTE network and other investments.1 KTRN will build the network and act as a wholesaler selling capacity to existing mobile operators and ISPs.2 The 4G network has a target of 95 per cent population coverage by 2018, with coverage standing at 64 per cent in March 2017.3 The unique 4G approach won a global award for innovation in business models in 2015.4
1 Bigabo, Patrick. 2014. “Rwanda contracts Nokia Networks to run LTE network.” KT Press, September 5. http:// ktpress. rw/ 2014/ 09/ rwanda- contracts- nokia- networks- to- run- lte- network/
2 For more on the technical details behind the 4G network see: Nokia. 2014. “Rwanda to get its first commercial LTE network with managed services.” Press Release, September 4. http:// www. nokia. com/ en_ int/ news/ releases/ 2014/ 09/ 04/ rwanda- to- get- its- first- commercial- lte- network- with- managed- services
3 RURA. 2017. Statistics and Tariff Information in Telecom, Media and Postal Service as of the First Quarter 2017.
4 "Rwanda 4G LTE project scoops Global Telecom Business Innovation Award". News, 15 May 2015. http:// www. gov. rw/ news_ detail/? tx_ ttnews%5 Btt_ news%5 D= 1193& cHash= 20a177278a02e615b7520cdf478759dc
Fixed broadband penetration is very low in LDCs. In sub-Saharan Africa, the overwhelming majority of LDCs have a fixed broadband penetration of less than 1 per cent. Two LDCs among the Arab States (Djibouti and Yemen) have fixed broadband penetration of more than 1 per cent. There are four Asia-Pacific LDCs (Bangladesh, Bhutan, Tuvalu and Vanuatu) where fixed broadband penetration is greater than 1 per cent. The highest penetration among all LDCs is in Tuvalu, where fixed broadband reaches ten per cent of the population.
There are several reasons for the dearth of wired broadband in LDCs. Wired broadband is generally much more costly than mobile broadband, is often available only in rural areas, and the market is frequently not very competitive, all of which discourage demand. Significant investment is required to expand or upgrade wired networks. A number of incumbent operators that either monopolize or have a significant market share of the wired broadband market are financially strapped and cannot afford the required investment. In other cases, incumbents have mobile subsidiaries and prefer to focus their investments in that area. However, wired broadband can be an attractive alternative to mobile broadband, particularly if it is unmetered or has high usage caps. Another attraction is the potential for significantly higher speeds than those available in most LDC mobile broadband networks.
Despite low fixed broadband penetration, operators in many LDCs are rolling out fibre optic access to accommodate large businesses and government users. A few are targeting a larger mass market. Liquid Telecom, who purchased the assets of the defunct incumbent Rwanda Telecom, is spending US$ 35 million to deploy a fibre-optic network in the capital that will pass more than 15 000 homes and provide speeds of up to 100 Mbps.25 Bangladesh Telecommunication Company Limited (BTCL), the state-owned incumbent in Bangladesh, has been upgrading its copper network to optical fibre through the Telecommunication Network Development Project which began in 2009. Wired broadband
25 Rwanda Focus (Kigali). 2015. “Rwanda: Liquid Telecom Launches Very Fast Internet in Kigali,” October 27. http:// allafrica. com/ stories/ 201510271356. html

25
ICTs, LDCs and the SDGs
subscriptions have increased nearly 300 per cent since 2012, reaching 4.6 million active subscribers in June 2017.26 It is notable that both Liquid Telecom Rwanda and BTCL do not provide a mobile ser-vice, so there is a focus on expansion and upgrade of their wired networks.
Box2-4:Comparingfixed-tomobile-broadbandnetworks
LDCs rely almost exclusively on mobile broadband networks to deliver high-speed Internet access to end users, including many businesses. The question of how mobile broadband networks compare to wired broadband networks is an important one, especially as mobile broadband technologies evolve. Operators are already talking about the launch of 5G, the next generation of mobile networks.
LTE mobile broadband networks promise theoretical speeds comparable to those of the copper and coaxial cables used by DSL and cable operators. Nonetheless, their speed or “latency” (the amount of time it takes for a data packet to traverse a network, which affects the quality of a connection) is inferior to that of optical fibre broadband networks. This means that wired broadband access networks continue to provide a more reliable and often cheaper option for streaming videos, gaming and downloading large files. Furthermore, mobile-broadband services are often linked to usage caps, while fixed-broadband offers are frequently unlimited.
5G networks will address some of these issues and promise to reduce latency. Nonetheless, because spectrum is a limited resource, used not only by mobile operators but also, for example, for broadcasting and satellite services, the effective capacity that mobile networks can deliver is also limited. The number of users on the same mobile network will continue to impact speeds as well as the quality of service. Operators are looking into ways of optimizing services, including by increasing the amount of spectrum and by using complementary network technologies to offload data.
These differences between wired and mobile broadband networks highlight two issues that need to be taken into account, especially in LDCs, where many users only have access to mobile networks. First, it is important for regulators to create the right regulatory environment and incentives that will allow operators to launch the latest generation of high-speed mobile broadband networks, including by making the necessary spectrum available. Second, it is important to take advantage of technological advances and innovations that allow adaptation of and improvements to existing networks. Small cells (low-powered cellular radio access nodes), for example, can increase capacity (and speed) in densely populated areas. Satellite networks can also be used to expand services to rural and remote areas.
At the same time, developing countries need to continue to invest in wired infrastructure, both in terms of national backbone and international connectivity. Mobile broadband users can benefit from high-speed services only if the necessary backbone infrastructure is in place. By reducing the distance between end-users and the backbone infrastructure, mobile-broadband networks can be optimized. This will significantly increase the speed and the quality of mobile-broadband services and allow the delivery of more data-intensive services and applications, including in rural and remote areas.
26 http:// www. btrc. gov. bd/ telco/ internet
26
ICTs, LDCs and the SDGs
2.1.3 Quality
Access to broadband matters, but it has to be available with adequate speed. Slow download and upload speeds not only translate into lost economic opportunities, but also make resources such as video applications and other data-intensive services virtually unusable, thus leading to missed social and economic development opportunities. Network quality serves as an indicator of capacity constraints on domestic and international backbones. The more expensive the route, the smaller the capacity that is likely to be provisioned, and thus the lower the quality and speed. The number of users on a particular network (“contention ratio”) is another factor. Typically, speeds are lower than advertised and quality of service is even lower when the networks are contested among multiple users (see also Box 2.4).
There are no comprehensive data on network speeds in LDCs. The available country data suggest that network speeds tend to be very low. In LDCs, the large majority of entry-level broadband plans are at speeds below 1 Mbit/s. Only 7 per cent of fixed-broadband subscriptions were advertised at speeds above 10 Mbit/s in LDCs in 2015.27
Insufficient bandwidth is often characterized by slow load time of webpages. This problem is par-ticularly acute in land-locked LDCs that rely on neighbouring countries for international transit. A 2016 Akamai survey shows that Ethiopia and Uganda had the highest average load times for mobile broadband in the world, at 8.3 and 7.8 seconds respectively (Figure 2.5). Afghanistan, a land-locked LDC in Asia, had the second slowest load time in the world for fixed broadband at 6.6 seconds.
On other hand, some LDCs do astoundingly well. Cambodia, along with Sweden, had the fastest fixed broadband average load times in the world, at 1.7 seconds. Cambodia has three companies provid-ing national backbone access, is connected to two submarine cables, and has a couple of Internet Exchange Points; all these factors enhance performance and reduce latency. The most surprising finding is that land-locked Lao PDR had the fastest mobile average page load time in the world, at 1.3 seconds. The country has an earlier history with mobile broadband compared to most LDCs. 3G was launched in 2008, with the deployment of the first 3G network. UNITEL and Lao Telecom launched 4G/LTE in 2015.28
Akamai refers to the difference between fixed and mobile broadband average load times as the “mo-bile penalty”. This is premised on the assumption that fixed broadband networks have traditionally been faster than mobile ones. In Cambodia, for example, it takes 1.5 times longer for pages to load over mobile networks compared to fixed ones. On the other hand, in six of the 15 LDCs with data, average load times were faster in mobile networks, while in Angola, Haiti and Tanzania there was no difference. This highlights the need for upgrading fixed broadband networks in LDCs.
27 ITU, 201628 Akamai. 2016. State of the Internet Quarter 1 2016 Report.

27
ICTs, LDCs and the SDGs
Figure2.5:Averagewebpageloadtime(seconds),firstquarter2016,LDCs
Note:Sortedbylowestfixednetworkloadtime. Source:AdaptedfromAkamai.2016.State of the Internet Quarter 1 2016 Report.
The improvement of network speed requires efforts to ensure that all elements of the value chain of the broadband network, including international connectivity, national backbones and local access networks, are sufficiently provisioned and synchronized with one other. Efforts are also needed to build human capacity with the necessary engineering skills that localize traffic and ensure efficient routing and network optimization.
2.1.4 Electricity
Access to reliable electricity is a major constraint in LDCs. Only 39 per cent of the population has access to electricity in these countries (simple average) (Figure 2.6). Electricity is needed for a range of activities, from recharging devices to powering mobile base stations. The lack of electricity results in higher costs due to the use of diesel generators for to power telecommunication equipment. In some circumstances, users in rural areas have mobile phones but have to travel to recharge them, which is costly and time consuming. In Malawi, many rural users obtain a phone before they have a place to charge it, and in 2012 it was estimated that US$12 million a year could be saved through better phone charging options.29 The presence of electricity is not only crucial for powering up the ICT sector, but can also be leveraged through the use of fibreoptical fibre owned by utility companies to extend national backbones.
Some LDCs fare better than others when it comes to electricity. Bhutan has the highest level of access to electricity and generates more than its own national needs. Other countries that have substantial potential include Ethiopia and Nepal. The latter has developed less than 2 per cent of its hydropower potential. The Grand Ethiopian Renaissance Dam on the Blue Nile is the largest hydroelectric plant in Africa and will double the country's electrical capacity.30
29 GSMA. 2012. TNM – Malawi – Feasibility Study. https:// www. gsma. com/ mobilefordevelopment/ wp- content/ uploads/ 2013/ 02/ TNM- Feasibility- Study. pdf
30 Jean Kumagai. 2016. "The Grand Ethiopian Renaissance Dam Gets Set to Open." IEEE Spectrum, 30 December. http:// spectrum. ieee. org/ energy/ policy/ the- grand- ethiopian- renaissance- dam- gets- set- to- open

28
ICTs, LDCs and the SDGs
Figure 2.6: Access to electricity
Source: Adapted from World Bank.
The cost of electricity is a major challenge for some LDCs since it adds to the cost of powering net-works, raising the cost of Internet access. Here too, there are major differences among the LDCs (Figure 2.7). Those with the lowest prices tend to be those with hydroelectric resources. The ones with the highest prices are often SIDS.
Figure2.7:Priceofelectricity,2016
Source: Adapted from World Bank Doing Business.
Potential abounds in LDCs to harness the power of off-grid energy. Most of Africa, for example, has around 325 days of strong sunlight a year, delivering, on average more than 6 kWh of energy per square metre per day.31 There are a range of projects, including a “Pico Hydro” project owned
31 David J. Grimshaw and Sian Lewis, Solar Power for the poor, SciDev, http:// www. scidev. net/ global/ energy/ feature/ solar- power- for- the- poor- facts- and- figures- 1. html

29
ICTs, LDCs and the SDGs
by families in Lao PDR32 and solar power solutions aimed at LDCs in Africa, for expanding access to electricity in off-grid rural areas.33
2.2 Nationalandregionalbackbones
Backbones are an essential and critical component of broadband infrastructure in LDCs. Backbones are high-capacity inter-province links used by operators to connect different service areas, to deliver traffic to national aggregation points such as IXPs (see Chapter 3), and to connect to borders and/or submarine cable landing stations for onward international connectivity.
2.2.1 Nationalbackbones
A substantial fraction of the cost of deploying national fibre-optic backbone infrastructure resides in the associated civil works, making the initial capital cost of building backbone networks very high. There are also requirements to obtain permissions for rights of way, which take time. The high sunk cost and delays in rolling out broadband means that the barriers to entry are high, but regardless of the barriers to entry, most countries recognize that national backbones are critical infrastructure. Consequently, there has in recent years been increasing attention to the rollout of fibre backbone as the primary transmission infrastructure in LDCs. While wireless backbones based on microwave or satellite offer faster rollout at lower cost, optical fibre backbones provide future-proof capacity that can handle large volumes of traffic generated by applications such as online education, telemedicine and videoconferencing. Nevertheless, there will be places where the cost of extending fibre is too high and where satellite remains important as a means of reaching extremely dispersed populations, such as those scattered in island LDCs/SIDS as well as remote areas in large LDCs.
Countries with large land areas and low population density face a considerable challenge in extending backbones to underserved areas. LDCs in Africa, especially those of large geographic area, generally have limited national backbones, followed by small island developing states in the Caribbean and Asia. LDCs that have the highest level of access to the backbone within a 10 km radius include Comoros, Gambia, Djibouti, Rwanda and Bangladesh. The first four are small countries with high population density. Bangladesh, despite its large land area, is one of the most densely populated LDCs. The rest of the LDCs have a large proportion of the population living more than 25 kilometres away from the fibre backbone network.
The backbone situation in the Asian land-locked LDCs is not too different from the African countries. Bhutan and Lao PDR have made significant progress in wiring their territories. Efforts are underway in Bhutan to upgrade the national backbone. Afghanistan remains one of the least connected countries in the Asia and Pacific region.
Haiti in the Caribbean has also seen significant advances in the backbone network, following the partial acquisition of the incumbent, Natcom, by Viettel Global of Viet Nam. Natcom has recently rolled out 6 000 km of optical fibre across the territory.
In spite of the progress made, extending fibre backbones to rural and underserved areas remains a key priority for LDCs, and they have pursued a variety of strategies for achieving this. Some, such as Senegal (Box 2.5) have left it to large incumbents with the resources to undertake the large invest-ment required. This can result in an extensive backbone network, particularly if the incumbent is a subsidiary of a large telecom group with operations in neighbouring countries. However, it can also result in dominant control of the national backbone, and in the absence of an obligation to offer open cost-based access to other operators, may lead to high wholesale prices which are then passed on to consumers.
32 http:// www. sciencedirect. com/ science/ article/ pii/ S096014811200149833 McKibben, Bill. 2017. “The Race to Solar-Power Africa.” The New Yorker, June 19. http:// www. newyorker. com/ magazine/
2017/ 06/ 26/ the- race- to- solar- power- africa.
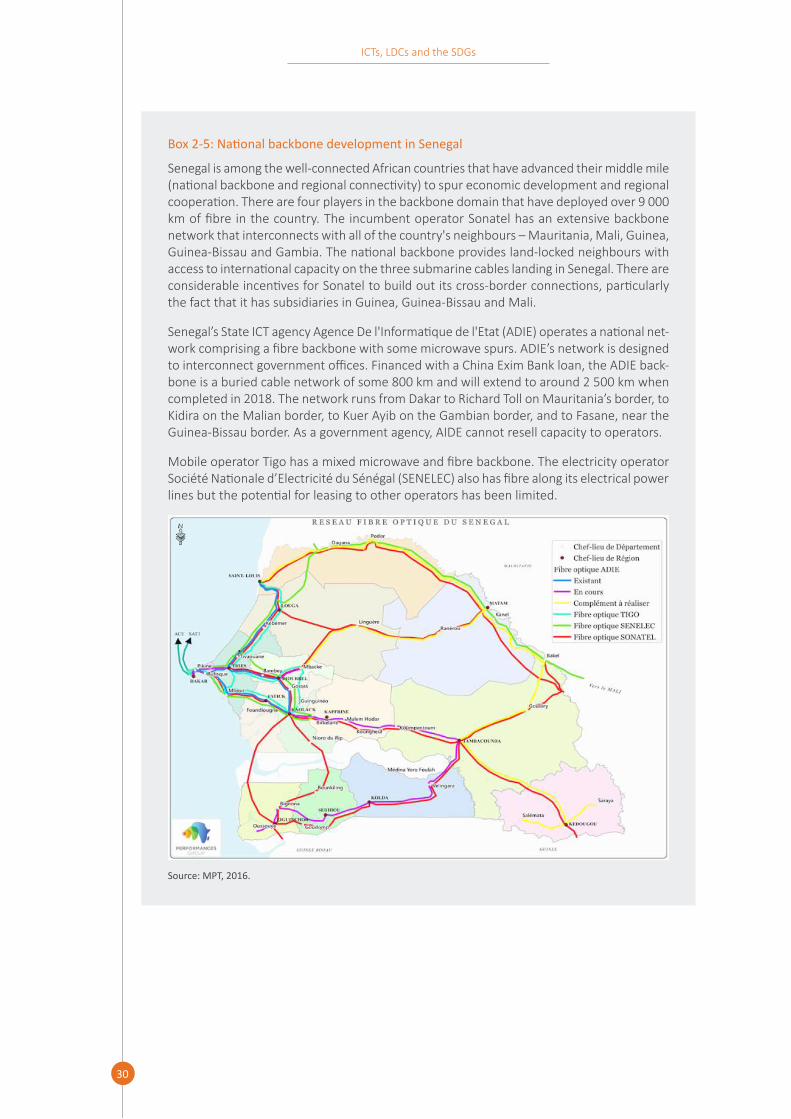
30
ICTs, LDCs and the SDGs
Box2-5:NationalbackbonedevelopmentinSenegal
Senegal is among the well-connected African countries that have advanced their middle mile (national backbone and regional connectivity) to spur economic development and regional cooperation. There are four players in the backbone domain that have deployed over 9 000 km of fibre in the country. The incumbent operator Sonatel has an extensive backbone network that interconnects with all of the country's neighbours – Mauritania, Mali, Guinea, Guinea-Bissau and Gambia. The national backbone provides land-locked neighbours with access to international capacity on the three submarine cables landing in Senegal. There are considerable incentives for Sonatel to build out its cross-border connections, particularly the fact that it has subsidiaries in Guinea, Guinea-Bissau and Mali.
Senegal’s State ICT agency Agence De l'Informatique de l'Etat (ADIE) operates a national net-work comprising a fibre backbone with some microwave spurs. ADIE’s network is designed to interconnect government offices. Financed with a China Exim Bank loan, the ADIE back-bone is a buried cable network of some 800 km and will extend to around 2 500 km when completed in 2018. The network runs from Dakar to Richard Toll on Mauritania’s border, to Kidira on the Malian border, to Kuer Ayib on the Gambian border, and to Fasane, near the Guinea-Bissau border. As a government agency, AIDE cannot resell capacity to operators.
Mobile operator Tigo has a mixed microwave and fibre backbone. The electricity operator Société Nationale d’Electricité du Sénégal (SENELEC) also has fibre along its electrical power lines but the potential for leasing to other operators has been limited.
Source:MPT,2016.

31
ICTs, LDCs and the SDGs
Governments have also made efforts to extend backbone networks. In land-locked Bhutan, the National Broadband Master Plan Implementation Project (NBMP) led to the connection of all Dzongkhags (sec-ond level administrative units in Bhutan, equivalent to a province). The Government owns the network spanning some 3 300 kilometres and leases fibre to telecommunication operators and ISPs free of charge. The network extends to the Indian border from where Bhutan's Internet traffic is routed to undersea fibre optic cables. Some African LDC governments are financing national backbones using vendor credit with favorable loan terms from the Chinese Export and Import Bank. Ethiopia, for ex-ample, has spent a significant portion of a US$ 1.5 billion vendor credit for state-owned Ethio Telecom to expand its backbone network, which now reaches key border crossings for access to submarine cables in Djibouti, Kenya and Sudan.34 Tanzania borrowed US$ 170 million from the Chinese Export Import Bank in two phases to build its National ICT Broadband Backbone (NICTBB).35 The Government of Tanzania has also collaborated with the private sector to build the backbone network as well as leveraging fibre in the electricity utility network (Box 2-6).
Box.2-6:Tanzania'sICTBroadbandBackboneforNationalandRegionalConnectivity
As part of its national ICT policy, the Government of Tanzania made a decision to construct a nationwide fibre-optic network called the National ICT Broadband Backbone (NICTBB). The Government spent US$ 200 million to finance the project.
The NICTBB did not only build a new fibre-optic segment but also consolidated existing cables from providers such as the Tanzania Electric Supply Company Limited (TANESCO). The construction of the first phase, which included 2 088 km from TANESCO and 2 161 km of new fibre, was completed in 2009. This has created points of presence at regional and district headquarters as well cross-border connections for all neighbouring countries. The second phase, consisting of 3 623 km of new fibre that connected the southern and western ring, was completed in 2012.
34 https:// www. researchictafrica. net/ publications/ Evidence_ for_ ICT_ Policy_ Action/ Policy_ Paper_ 3_-_ Understanding_ what_ is_ happening_ in_ ICT_ in_ Ethiopia. pdf
35 http:// china. aiddata. org/ projects/ 23142

32
ICTs, LDCs and the SDGs
Box.2-6:Tanzania'sICTBroadbandBackboneforNationalandRegionalConnectivity(cont.)
The NICTBB was built on the open access principle and encouraged competitive pricing and the delivery of a high quality of service to national and regional operators. Sea-facing Tanzania now serves neighbouring land-locked LDCs, including Burundi, Rwanda, Malawi and Zambia, by extending access to its submarine cables through the NICTBB infrastructure – and in the process, fulfilling its aspiration to be a regional ICT hub.
Source: ITU adopted from http:// www. nictbb. co. tz/

33
ICTs, LDCs and the SDGs
The private sector remains the major actor in the development of national and regional backbones. In Africa, mobile groups such as Orange, MTN, Vodacom and Airtel, have been rolling out national backbones to support mobile communications and broadband Internet services. Regulators have been encouraging infrastructure sharing in countries where the private sector leads the effort. Where the economic efficiencies of aggregating backbone have been considered, LDCs like Burundi have created a Special Purpose Vehicle (SPV) whereby operators create an entity to serve as the wholesale infrastructure provider (Box 2-7).
Box 2-7: Burundi Backbone System (BBS)
The Burundi Backbone System (BBS) is a partnership between different players for the pur-pose of sharing a national backbone on an “open access” basis. It is a joint venture between the Government of Burundi and four telecom operators (Ucom Burundi, Africell Tempo, and Onatel) and an Internet Service Provider (CBINET). The project involved the creation of a 1 250 km fibre-optic backbone connecting all 17 provinces and access to the international submarine cable landing points in Mombasa and Dar es Salaam. The World Bank provided the Government with a grant to help finance the project.
The BBS was launched in 2013. Its current members include Natel, Africell, Econet-Leo, CBINET, Spidernet and Martha Hotel. The BBS manages the Burundi backbone and ensures access to the landing stations of sub-marine fibre-optic cables via Tanzania and through Rwanda, onward to Kenya and through Uganda. It leases fibre-optic connections to oper-ators and member companies and connects a government network known as Comgov to the Internet. BBS is the main network provider for the Burundi Research and Education Network (BERNet).
The creation of BBS, the completion of a national backbone network and the availability of relatively competitive access to international submarine cables has been crucial for provid-ing a high-capacity network with low costs compared to traditional satellite connections. At the same time, the BBS formation indicates that public and private partnerships are not the “magic bullet” for connectivity and not fully embraced by the private sector. BBS, for example, was not embraced by Vittel, a new operator, which decided to roll out its own national 3G network without using the national backbone.1
Source: http:// www. bbs. bi/ .
1 Delloite and Association for Progressive Communication, Unlocking broadband for all: Broadband infrastructure sharing policies and strategies in emerging markets, https:// www. apc. org/ sites/ default/ files/ Unlocking%20 broadband%20 for%20 all%20 Full%20 report_ 1. pdf
2.2.2 Regionalandcross-borderconnections
Land-locked LDCs are dependent on cross-border connections to neighbours and transit through those countries in order to access international capacity at submarine cable landing stations. Typically, cross-border connectivity is negotiated between operators in neighbouring countries, with some in-tervention from the respective regulatory bodies. Navigating through the requirements and different regulations is usually not straightforward.
At a policy level, cross-border interconnection is considered important for regional economic inte-gration. In Africa, this has been promoted through regional economic communities such as the East African Community (EAC), the Southern African Development Community (SADC) and the Economic Community of West African States (ECOWAS). Initiatives include the SADC Region Information Infrastructure (SRII), Intelcom II in ECOWAS, and the East African Backbone System (EABS) in the

34
ICTs, LDCs and the SDGs
EAC. The New Partnership for African Development (NEPAD) and the Programme for Infrastructure Development in Africa (PIDA) have also been active in promoting cross-border interconnection and leveraging transport corridors and electricity networks for rolling out regional fibre-optic networks.
In Asia, cooperation has taken place within Asian Development Bank initiatives such as the Greater Mekong SubregionInformation Superhighway Network (GMS-ISN) programme that covers Cambodia, China, Lao PDR, Myanmar, Thailand and Viet Nam.36 A similar effort in South Asia is coordinated within the framework of the South Asia Sub-regional Economic Cooperation (SASEC) Information Highway Project, which aims to enhance connectivity between Bangladesh, India, Bhutan and Nepal.37
In addition to regional inter-governmental efforts, several mobile network operators have linked their national backbones where they share common borders. For example, Orange and Maroc Telecom have been active in extending cross-border connectivity to their subsidiaries across Africa.
Wholesalers such as Phase 3 Telecom in West Africa and Liquid Telecom in eastern and southern Africa are also playing a growing role in the development of the African regional backbone. These independent companies provide wholesale open access to their networks and, since they typically do not have retail operations, have little incentive to charge significantly above cost prices. Phase 3 collaborated with ECOWAS as part of the Intelcom II initiative. It leverages power transmission infra-structure in the region for a 7 000 km aerial fibre network to build out backbones and cross-border connections in Benin, Nigeria and Togo.38 Liquid Telecom's 50 000 km fibre network stretches from the north of Uganda to South Africa and includes the East Africa Fibre Ring, the first regional ring on the continent.39 It can also seamlessly connect clients, whether land-locked or not, to five main submarine cable systems. Liquid operates in Botswana, DR Congo, Kenya, Lesotho, Rwanda, South Africa, Uganda, Zambia and Zimbabwe. Wholesalers such as Liquid Telecom and Phase 3 have been instrumental in negotiating rights of way, transit fees, and other costs, thus bringing down the overall cost of interconnecting countries.
2.2.3 Internationalconnectivity
The availability of international connectivity varies among the LDCs. There are 30 LDCs with access to the sea, making it possible to establish landing stations to connect with international submarine cables. All but six coastal LDCs (Box 2-8) have now established connections to international submarine cables. The 16 land-locked LDCs are often at a disadvantage, depending on the distance between submarine cables and their territories and the transit charges levied by coastal countries. All except South Sudan, which does not have cross-border fibre connectivity with its neighbours, have at least one cross-border route for access to submarine cables.
36 https:// www. adb. org/ news/ mekong- countries- plan- information- superhighway37 https:// www. adb. org/ news/ four- south- asian- countries- agree- ict- connectivity38 http:// www. phase3telecom. com39 https:// www. liquidtelecom. com/ about- us/ network- map. html
35
ICTs, LDCs and the SDGs
Box2-8:Thesixsea-facingLDCswithoutsubmarineconnectivity
There are six sea-facing LDCs without a submarine cable landing station (two in Africa and four in the Pacific). Guinea-Bissau recently signed an agreement with the World Bank to obtain access to the Africa Coast to Europe (ACE) cable, a project that should be completed by early 2019.1 Although Eritrea had opportunities to connect to submarine cables on Africa’s east coast, it declined to do so and is the only coastal LDC without a landing station. In May 2017, a project providing a US$ 20 million World Bank grant for Kiribati to establish submarine connectivity was approved.2 A project to connect the Solomon Islands to submarine cable was approved several years ago but has been delayed. A construction contract was finally signed in July 2017 and the cable is scheduled to enter service in 2018.3 Timor-Leste is committed to obtaining access to submarine cable, the stumbling block being which specific option to choose. Possible options include linking up to the submarine cable on the other half of the island it shares with Indonesia, or using a new cable connecting to Australia.4 In Tuvalu, consideration is being given to a submarine cable linking it to Samoa.5
1 http:// af. reuters. com/ article/ investingNews/ idAFKBN1A50MU- OZABS2 http:// www. worldbank. org/ en/ news/ press- release/ 2017/ 06/ 01/ remote- pacific- regions- set- for- broadband-
internet- under- new- world- bank- projects3 http:// www. huawei. com/ en/ news/ 2017/ 7/ HuaweiMarine- Submarine- Cable- Solomon4 https:// macauhub. com. mo/ 2015/ 03/ 17/ timor- leste- studies- proposals- for- a- fibre- optic- connection- to-
indonesia- or- australia/ 5 http:// sobserver. ws/ en/ 27_ 04_ 2017/ local/ 19390/ Tuvalu%25 E2%2580 %2599s- Deputy- PM- on- fact- finding-
mission. htm
The number of submarine cables has increased over the last decade, benefiting LDCs. In Africa the deployment of submarine cables has intensified since 2009. Previously, apart from satellite, the SAT3/ SAFE cable was the only option for connecting Africa to the rest of the world, and the only LDCs connected were Angola, Benin and Senegal. A number of cables have been launched since then, dramatically increasing international Internet capacity and creating strong incentives for the expansion of regional and national backbones (see Table 2.2). The jump in capacity has sharply reduced prices for international capacity.
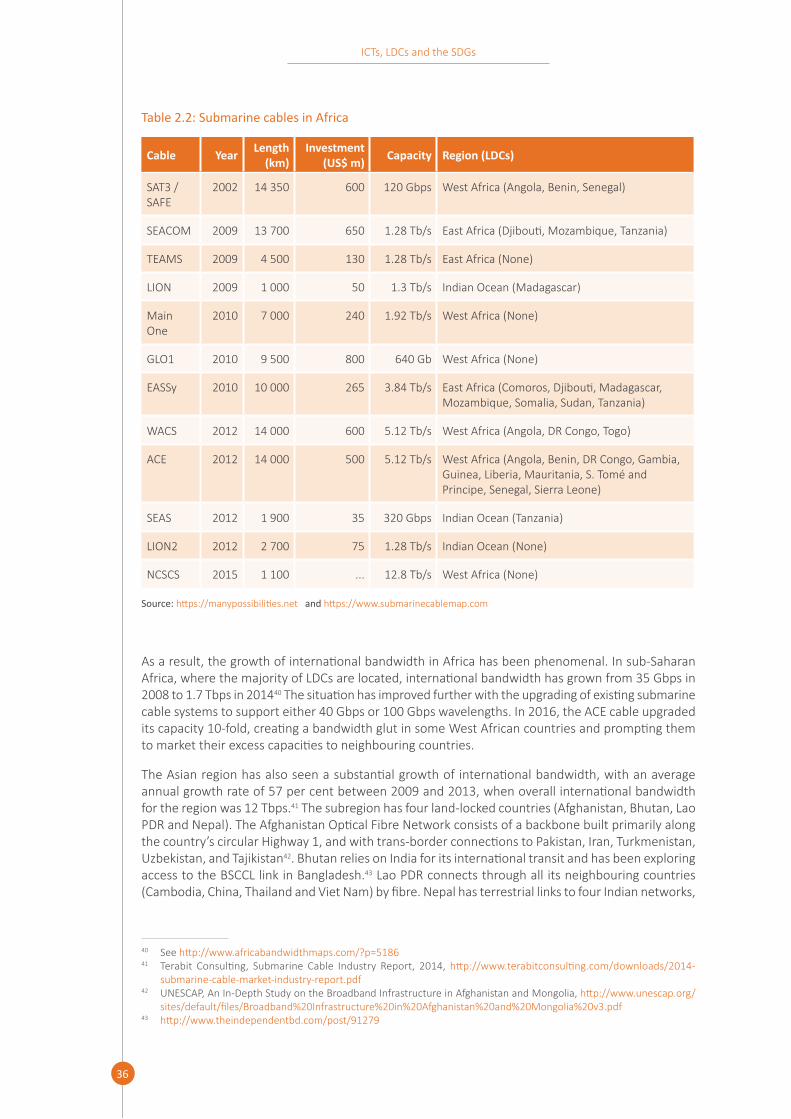
36
ICTs, LDCs and the SDGs
Table 2.2: Submarine cables in Africa
Cable Year Length (km)
Investment (US$ m) Capacity Region (LDCs)
SAT3 /SAFE
2002 14 350 600 120 Gbps West Africa (Angola, Benin, Senegal)
SEACOM 2009 13 700 650 1.28 Tb/s East Africa (Djibouti, Mozambique, Tanzania)
TEAMS 2009 4 500 130 1.28 Tb/s East Africa (None)
LION 2009 1 000 50 1.3 Tb/s Indian Ocean (Madagascar)
Main One
2010 7 000 240 1.92 Tb/s West Africa (None)
GLO1 2010 9 500 800 640 Gb West Africa (None)
EASSy 2010 10 000 265 3.84 Tb/s East Africa (Comoros, Djibouti, Madagascar, Mozambique, Somalia, Sudan, Tanzania)
WACS 2012 14 000 600 5.12 Tb/s West Africa (Angola, DR Congo, Togo)
ACE 2012 14 000 500 5.12 Tb/s West Africa (Angola, Benin, DR Congo, Gambia, Guinea, Liberia, Mauritania, S. Tomé and Principe, Senegal, Sierra Leone)
SEAS 2012 1 900 35 320 Gbps Indian Ocean (Tanzania)
LION2 2012 2 700 75 1.28 Tb/s Indian Ocean (None)
NCSCS 2015 1 100 ... 12.8 Tb/s West Africa (None)
Source: https:// manypossibilities. net and https:// www. submarinecablemap. com
As a result, the growth of international bandwidth in Africa has been phenomenal. In sub-Saharan Africa, where the majority of LDCs are located, international bandwidth has grown from 35 Gbps in 2008 to 1.7 Tbps in 201440 The situation has improved further with the upgrading of existing submarine cable systems to support either 40 Gbps or 100 Gbps wavelengths. In 2016, the ACE cable upgraded its capacity 10-fold, creating a bandwidth glut in some West African countries and prompting them to market their excess capacities to neighbouring countries.
The Asian region has also seen a substantial growth of international bandwidth, with an average annual growth rate of 57 per cent between 2009 and 2013, when overall international bandwidth for the region was 12 Tbps.41 The subregion has four land-locked countries (Afghanistan, Bhutan, Lao PDR and Nepal). The Afghanistan Optical Fibre Network consists of a backbone built primarily along the country’s circular Highway 1, and with trans-border connections to Pakistan, Iran, Turkmenistan, Uzbekistan, and Tajikistan42. Bhutan relies on India for its international transit and has been exploring access to the BSCCL link in Bangladesh.43 Lao PDR connects through all its neighbouring countries (Cambodia, China, Thailand and Viet Nam) by fibre. Nepal has terrestrial links to four Indian networks,
40 See http:// www. africabandwidthmaps. com/? p= 5186 41 Terabit Consulting, Submarine Cable Industry Report, 2014, http:// www. terabitconsulting. com/ downloads/ 2014-
submarine- cable- market- industry- report. pdf42 UNESCAP, An In-Depth Study on the Broadband Infrastructure in Afghanistan and Mongolia, http:// www. unescap. org/
sites/ default/ files/ Broadband%20 Infrastructure%20 in%20 Afghanistan%20 and%20 Mongolia%20 v3. pdf 43 http:// www. theindependentbd. com/ post/ 91279

37
ICTs, LDCs and the SDGs
and is also establishing a link to China under the sponsorship of the South Asia Subregional Economic Cooperation (SASEC) Information Highway Project.44
Cambodia is the most connected LDC in the Asia Pacific region in terms of international connectivity. Apart from a recent connection to the Malaysia-Cambodia-Thailand (MCT) Submarine Cable System, which landed in 2017, it is linked to the Asia-America Gateway (AAG) cable and the Asia-Africa-Europe-1 (AAE-1) cable.45 Myanmar is connected through three links: the SEA-ME-WE 3 submarine cable, a terrestrial link to Thailand, and a terrestrial link to China. A new Myanmar – Malaysia - Thailand International Connection cable (MYTHIC) is also expected to provide an extra 300 Gbps of bandwidth.46
In the Arab States, Yemen connects through submarine cables and a terrestrial fibre-optic cable linking to Saudi Arabia. TeleYemen concluded a US$ 36 million agreement in May 2005 to connect to FLAG Telecom’s Falcon fibre-optic submarine cable. Another submarine cable, built in 1994 and owned by a consortium of TeleYemen, DjibTel and TaTa Communications, connects Aden to Djibouti City. TeleYemen has also invested in the South East Asia - Middle East - Western Europe-5 (SEA-ME-WE5) submarine cable. However, political upheaval has devastated much of the infrastructure, making the country one of the least connected in the Arab States.47
Despite the progress that has been made, Asian nations experience some of the highest rates of Internet downtime in the world owing to their dependence on a handful of submarine cables. Up to 90 per cent of international capacity purchased on submarine cables in Asia is unprotected, and customers are desperate for terrestrial redundancy options, but affordable, coherent terrestrial solu-tions are rare.48
In the Americas, Haiti connects to the FibraLink international cable that links to Jamaica and the Dominican Republic, and to another cable that goes through the Caribbean islands with a link to the Bahamas Domestic Submarine Network (BDSN). However, broadband access is concentrated largely in the capital Port-au-Prince and a few major towns, so the great majority of the population has not benefited from the international connection.49
The very small populations scattered over a huge area makes international connectivity a challenge for LDCs in the Pacific. Vanuatu is currently the only Pacific Island LDC connected to undersea fibre-optic cable. The 1 259-kilometre Interchange Cable Network 1 (ICN1) linking Vanuatu to Fiji was completed in January 2014. With ICN1, traffic is sent to Fiji where it is transferred to the Southern Cross cable and routed to Australia or the United States. Other Pacific Islands rely on satellite connections for international Internet traffic, although there are initiatives in all of them to gain direct access to submarine cables (Box 2-8).
2.3 The “Invisible Mile”
There is no single model for LDCs to boost connectivity, but progress to date points to the importance of competition, public interventions when needed, open access, infrastructure sharing, and private investment in the first, middle and last miles. Policy failures, such as market concentration, troubled privatization, excessive taxation, and monopoly control over international gateways, remain the prin-cipal bottlenecks impeding broadband development in the LDCs. Competition in the mobile market is
44 UNESCAP, An In Depth Study to on the Broadband Infrastructure in South and West Asia, http:// www. unescap. org/ sites/ default/ files/ Broadband%20 Infrastructure%20 in%20 South%20 and%20 West%20 Asia%20 (draft)_ 0. pdf
45 http:// www. phnompenhpost. com/ business/ third- undersea- cable- plug- kingdom- data- fast- lane46 http:// frontiermyanmar. net/ en/ myanmars- connectivity- catch- up47 World Bank, The Republic of Yemen, Unlocking the Potential for Economic Growth, https:// openknowledge. worldbank.
org/ bitstream/ handle/ 10986/ 23660/ Yemen00Republi00for0economic0growth. pdf? sequence= 1 48 Michael Ruddy, Improving Regional Connectivity with the Asian Information Superhighway, presentation, http:// www.
unescap. org/ sites/ default/ files/ 20160401%20 Bangkok%20 ESCAP%20 -%20 Terabit%20 Consulting%20 Presentation. pdf49 Pentalis Koutroumpis, The benefit of government digitization and improved mobile access in Haiti, http:// www.
copenhagenconsensus. com/ sites/ default/ files/ broadband_ koutroumpis_-_ english- ilovepdf- compressed. pdf

38
ICTs, LDCs and the SDGs
often highly concentrated, and other ingredients such as infrastructure sharing are underdeveloped. Access to ICTs in the land-locked LDCs is further constrained by trans-border regulatory issues.
2.3.1 Movingtothefifthgenerationofregulation
The ICT ITU Regulatory Tracker tracks the transition of countries through five generations of regulation (Figure 2.8).50 It covers the early stage of regulation, where a government acts as policy maker, regu-lator and sector player, progressing towards a fully competitive environment in which regulators work with other sectors in harmonizing regulation across the entire ICT ecosystem to ensure systematic use of information and communication technologies in key sectors like health, education and trade.
Figure2.8:Generationsofregulation
Source: ITU.
Most LDCs are located within the first or second generation of regulation (Table 2.3). Fifteen have graduated to the third generation. Uganda is the only LDC that has crossed to the fourth generation, and none is in the fifth.
Table2.3:LDCsbygenerationofregulation
LDCs in G1 LDCs in G2 LDCs in G3 LDCs in G4
Chad, Djibouti, Eritrea, Ethiopia, Kiribati, Lao PDR, Niger,
Solomon Islands, Somalia, Timor-Leste,
Yemen
Angola, Benin, Bhutan, Burundi, Central African
Republic, Comoros, Guinea, Guinea-Bissau,
Haiti, Liberia, Madagascar, Mozambique, Myanmar, Nepal, Rwanda, S. Tomé & Principe, Sierra Leone,
Togo
Afghanistan, Bangladesh, Burkina Faso, Cambodia,
Congo (Dem. Rep.), Gambia, Lesotho, Malawi, Mali, Mauritania, Senegal, Sudan, Tanzania, Vanuatu,
Zambia
Uganda
Source: ITU.
50 https:// www. itu. int/ en/ ITU- D/ Regulatory- Market/ Pages/ Outlook/ 2017. aspx

39
ICTs, LDCs and the SDGs
The ICT Regulatory Tracker indicates that the steps countries need to take very much depend on their situation in terms of regulatory development. Countries in the first generation need to create an enabling environment for investment and innovation in the broadband market. This includes lib-eralization of the sector, privatization of state-owned national incumbent operators, and separation between policy, regulator and sector operation functions, with a view to encouraging competition and foreign direct investment, and promoting universal access, innovation, content delivery and consumer protection.
The trajectory of regulatory development in LDCs aligns well with the advances that countries have made in introducing competition and promoting public-private partnerships that have paved the way for the expansion of access and use of affordable ICT services. Most of the countries that have attained third-generation regulation, such as Cambodia, Lesotho, Mali, Senegal, Sudan, Tanzania and Vanuatu, are leaders in the mobile broadband market. Most regulators in developed countries have already achieved a fifth generation, whereby they promote collaborative regulation across the different sectors that oversee ICT sector development, including those involved in digital financial inclusions, competition, consumer protection, data protection and legal services. However, no LDC has yet reached the fifth generation and built the capability to partner, collaborate and share information in order to address common challenges across sectors including access, interoperability, security, privacy, data integrity, trust, quality of service and pricing.
Progress in some countries suggests that LDCs can move through the regulatory development ladder faster if governments make concerted efforts. The ITU Regulatory Tracker indicates that Vanuatu has seen the most dynamic development in terms of advancing regulation over the last ten years. Since the creation of the Telecommunications and Radiocommunications Regulator in 2008 and the adop-tion of the Telecommunications and Radiocommunications Regulation Act 2009, the ICT sector of this Pacific island has been liberalized and various core regulations have been implemented, ranging from interconnection, through scarce resource management, to technology neutrality.51 The regulator is addressing issues such as universal access and consumer protection. The experience of Vanuatu indicates that effective sector regulation should not only address competition in the broadband supply chain, but should also include broader policy issues such as managing spectrum and taxation of ICT products and cybersecurity.
51 ITU, Global ICT Regulatory Outlook 2017

40
ICTs, LDCs and the SDGs
Box2-9:Winningformulasforfixed-andmobile-broadbandmarkets
It is widely recognized that good regulation is key for the development of vibrant digital economies. Based on evidence produced using the ICT Regulatory Tracker, the choice of regulatory interventions appears to be equally important in promoting market growth.
There are many areas that require regulatory oversight, and the focus on these might be significantly different across countries. Analysis using the ICT Regulatory Tracker demon-strates, however, that a handful of key regulations can unlock the potential of an ICT market, turning it into a mass market in a short period of time. ITU analysis shows that a “recipe for success” based on six policy and regulatory measures has helped 58 countries to achieve 75 per cent mobile broadband penetration. Furthermore, their markets have skyrocketed: penetration was 70 per cent higher than the world average in 2015, and is significantly out-pacing most other countries (see Box Figure 2.9, left). Although there are multiple factors at work, regulation has made a significant difference for these countries.
With regard to fixed-broadband services, by adopting a similar recipe for success comprising five measures, 40 countries have achieved a considerably higher level of fixed-broadband service adoption (see box Figure 2.9, right). The average fixed-broadband penetration of countries deploying the five measures was 26 per cent in 2015, 15 percentage points higher than the global average of 11 per cent. Although it is difficult statistically to establish direct causality, this nevertheless implies that regulation can facilitate market growth.
Winning formulas: regulatory recipes for successful ICT adoption
41
ICTs, LDCs and the SDGs
Box2-9:Winningformulasforfixedandmobile-broadbandmarkets(cont.)
Winning formula for mobile broadband Winning formula for fixed broadband
1 Competition in mobile broadband 1 Competition in DSL/cable
2 Competition in international gateways 2 Fixed number portability enabled (implemented, available to consumers)
3 Mobile number portability enabled (implemented, available to consumers)
3 Infrastructure sharing/co-location and site sharing for fixed mandated
4 Spectrum band migration allowed 4 Converged licensing framework in place
5 Infrastructure sharing for mobile operators permitted, including MVNOs
5 National broadband plan adopted
6 National broadband plan adopted
Source:ITU(2017b),GlobalICTRegulatoryOutlook.
2.3.2 Spectrum management
Access to spectrum is a key factor influencing wireless broadband developments in the LDCs. Demand for spectrum is growing with the increasing adoption of mobile services, the expansion to new market segments such as the Internet of Things (IoT), and continuous technological innovations. Regulatory frameworks that promote effective management and allocation of radio-frequency spectrum are critical.
Another key spectrum issue is ensuring that the digital dividend spectrum freed up through transition from analogue to digital broadcasting is available for mobile and broadband wireless services. Across the world, two digital dividend bands have been identified for mobile broadband: the 800 MHz band (790–862 MHz) in ITU Region 1 (Europe and Africa); and the 700 MHz band (698–806 MHz) in the rest of the world. These lower frequency bands are very relevant for LDCs that have large rural areas, since the bands have wider coverage and hence lower investment costs. Using 700 MHz or 800 MHz spectrum has helped several operators to launch LTE services faster. Efforts are therefore needed in LDCs to ensure that these bands are allocated swiftly.
Data on the quality of spectrum management in the LDCs are patchy, but it is evident that most countries have initiated programmes to establish national radio-frequency tables, allocated spec-trum for different uses, and initiated spectrum monitoring activities. While some countries have developed policies that support proactive spectrum use, others remain in a traditional “command and control” mode with regard to spectrum allocation. Another concern of many LDCs is the difficulty of elaborating methods for the calculation of fees for the use of radio-frequency spectrum. The ITU Guidelines provide relevant information for determining spectrum prices and preparing spectrum fee schedules.52 However, the different economic and market conditions and diverse technical factors that underlie spectrum fees make other forms of capacity building, including on the job training and experience sharing, crucial.
Regardless of the situation, LDCs need to embark on spectrum management techniques that respond to technological development and user needs.
52 ITU, 2016, Guidelines for the Review of Spectrum Pricing Methodologies and the Preparation of Spectrum Schedules, https:// www. itu. int/ en/ ITU- D/ Spectrum- Broadcasting/ Documents/ Publications/ Guidelines_ SpectrumFees_ Final_ E. pdf

42
ICTs, LDCs and the SDGs
2.3.3 Infrastructuresharing,dataprotectionandcybersecurity
Regulation on rights of way, access to network facilities, and infrastructure sharing, are important tools that facilitate the deployment of broadband infrastructure. The promotion of consumer data protection and cybersecurity is also increasingly important.
Data on regulations pertaining to rights of ways in LDCs are not readily available and should ideally be collected and shared so that experiences can be shared among countries. Anecdotal evidence suggests that operators encounter barriers when deploying infrastructure. In Tanzania and Uganda, for example, the regulations clarifying the jurisdictions for granting rights of way, coordinating among agencies, and compensation for access to and use of rights of way, are not well defined and this holds back efficient passive infrastructure sharing.53
Infrastructure sharing, which occurs at different levels, optimizes scarce resources and facilitates investment in costly projects such as national backbones. Passive infrastructure, including towers, shelters, air conditioning equipment, diesel electric generators, batteries, electrical power supply, technical premises and easements and pylons, can be shared among operators, as well as electronic infrastructure including base tower stations, microwave radio equipment, switches, antennas and transceivers for signal processing and transmission. Another aspect of sharing involves building, operating and maintaining a common infrastructure through a jointly used infrastructure provider. Furthermore, sharing can take place for telecommunication infrastructure assets that are housed, or jointly constructed, with other linear infrastructures such as railways, waterways, pipelines or elec-tricity distribution lines, to exploit potential synergies in the construction, operation and maintenance of different linear infrastructures.54
The extent to which LDCs promote passive and active infrastructure sharing varies considerably. However, there is a general consensus among the LDCs that sharing should be encouraged to pro-mote economies of scale, reduce negative network externalities (such as electromagnetic radiation emanating from cellular network towers) and benefit from coordination between telecom and utility providers through “dig once” policies. The ITU Regulatory Tracker indicates that infrastructure sharing is mandated in two-thirds of the LDCs (30 countries) and collocation and site sharing is mandated in about half.
Progress in cybersecurity is improving, but generally still patchy in LDCs. The Global Cybersecurity Index (GCI) measures and ranks countries’ commitment to information security. It uses five indica-tors, namely, legal measures, technical measures, organizational measures, capacity building and international cooperation. The Index indicates that only a few LDCs have achieved an acceptable level of development in this area.55 The overwhelming majority of LDCs (42) fall into an initiating stage of making cybersecurity commitments. Lao PDR, Rwanda, Senegal, Tanzania and Uganda are the only LDCs that have graduated to the next maturing stage as a result of their initiatives in policy, institutional frameworks and capabilities.
In the 2017 GCI, Rwanda was the top ranked LDC and 36th globally. The country scores highly in the organizational pillar and has a cybersecurity policy addressing both the public and private sector. It is also committed to developing a stronger cybersecurity industry. Uganda is second among the LDCs and 50th globally, and has made progress on the policy side through the adoption of cybersecurity legis-lation and developing capabilities by building a home grown industry. Bangladesh ranks third among the LDCs and 53rd in the world. It has established a Computer Emergency Response Team (CERT) that conducts professional training to raise capabilities for combating cyberincidents. In addition,
53 East African Communication Organization, 2012, Report of the ECAO Infrastructure Sharing, http:// www. eaco. int/ docs/ Reports/ Report_ of_ the_ EACO_ Infrastructure_ Sharing_ Task_ Force. pdf
54 Jose Marino Garcia and Tim Kelly, The Economics and Policy Implications of Infrastructure Sharing and Mutualisation in Africa, http:// pubdocs. worldbank. org/ en/ 533261452529900341/ WDR16- BP- Infrastructure- Mutualisation- Garcia. pdf
55 ITU, Global Cybersecurity Index 2017, https:// www. itu. int/ dms_ pub/ itu- d/ opb/ str/ D- STR- GCI. 01- 2017- R1- PDF- E. pdf

43
ICTs, LDCs and the SDGs
numerous public sector professionals are certified under internationally recognized cybersecurity certification programmes.
2.3.4 Universal service funds
A number of LDCs have created special funds generally financed by obligatory contributions from telecommunication operators. The first were created in 1999, and by 2016, 20 LDCs had a universal service fund (Figure 2.9, left). Of those, the majority are in African LDCs. In principle, most universal service funds have the mandate of developing ICTs in underserved and remote communities. This ranges from infrastructure provision and deployment of ICTs in schools to subsidizing network expan-sion and training. However, in practice, their performance has been mixed, with some yet to disperse funds despite having substantial balances.56 For example, in eleven African LDCs with a fund, only 21 per cent of the money has been disbursed and only three countries had disbursed funds (Figure 2.9, right). This is unfortunate considering the large gap in access between urban and rural areas in most LDCs. Consumers lose, given that operators pass on their universal service fund payment in the form of higher prices. There are some examples of successful use of the funds. In Bhutan, universal service funds have been used to extend mobile coverage to remote rural areas; in Lesotho they have been used to establish and support the Internet Exchange Point; and in Uganda, almost all public secondary schools have been provided with Internet access using the funds.
Figure 2.9: LDCs with a universal service fund and percentage of funds disbursed in African LDCs
Source: Adapted from ITU and GSMA.
2.4 Conclusions
The analysis in this chapter indicates that the LDCs have made progress in extending ICTs, in partic-ular in promoting access to mobile services. One-quarter of LDCs are still in the first generation of regulation, which has slowed progress in broadband network development.
International access in LDCs is characterized by underutilization of bandwidth in some coastal coun-tries, especially in Africa, and high transit costs for land-locked LDCs. Regional approaches, like those adopted by the West African Telecommunications Conference (WATC) in negotiating transit costs
56 GSMA. 2014. Sub-Saharan Africa– Universal Service Fund study. https:// www. gsma. com/ publicpolicy/ wp- content/ uploads/ 2012/ 03/ Sub- Saharan_ Africa_ USF- Full_ Report- English. pdf

44
ICTs, LDCs and the SDGs
incurred by land-locked countries, can help to reduce fee.57 Countries that have not liberalized inter-national gateways need to do so in order to lower cost. Ideally, apart from satellite connections, all LDCs should have at least two optical-fibre cable entry points to international networks owned by different operators so as to increase security and redundancy.
The development of the national and regional backbone entails substantial investments that can only be financed through the mobilization of private capital and/or by encouraging public-private partner-ships. Policy-makers need to provide consistent leadership accompanied by well thought-out national broadband plans. Regulators should have comprehensive information on broadband infrastructure and a national infrastructure atlas to facilitate decision-making on infrastructure deployment and maintenance. This highlights the need for better data to track these developments.
Backbone networks also require further market liberalization, open access, measures to encourage infrastructure sharing, and requirements for all major infrastructure providers (such as roads, railway, pipelines and energy distribution) to include provision for optical fibre in their network development. They can also be improved by setting up Internet exchange points and creating local caches for fre-quently used content (see Chapter 4). Government policy frameworks should also be harmonized to facilitate fast and cost-effective frameworks for right of way permits and access to ducts, poles, masts and buildings.
Government policies should encourage the provision of last-mile connectivity by permitting compet-ing facilities, especially for intermodal competition (between cable, fibre-optic, wireless and digital subscriber lines). Regulatory capacity in the area of spectrum management needs to be improved to ensure that regulators respond to the growing demands of spectrum management and setting appropriate spectrum fees. Regulators should play an active role in liberalizing the market for spec-trum resale, lowering the cost of spectrum acquisition and reviewing spectrum allocation, trading and assignment rules on an ongoing basis and taking technological advancement, consumer needs and global best practices into consideration.
There is also a need for ongoing review of legal and regulatory frameworks through comparison, learning and international benchmarking. The collection of data and its analysis and availability on a regular basis will not only improve transparency, planning and evaluation of targets, but are es-sential for international benchmarking. LDCs need to step up the availability of supply-side data and devise mechanisms to gather demand-side data, such as household ICT usage data, by integrating ICT elements in the regular social, economic and demographic surveys and investing in standalone ICT surveys.
57 ITU, 2013, Study on International Connectivity in Sub-Saharan Africa, https:// www. itu. int/ en/ ITU- D/ Regulatory- Market/ Documents/ IIC_ Africa_ Final- en. pdf

45
ICTs, LDCs and the SDGs
3 Sustaining the Internet ecosystem A sustainable Internet ecosystem is necessary if LDCs are to successfully harness digital technology for enhancing social and economic development. This chapter looks at the fundamental components that store and exchange data within a nation: Internet exchanges, data centres and cloud comput-ing and hosting services. This digital infrastructure remains largely hidden from most people but is indispensable for enabling Internet applications, services and online content for citizens, businesses and governments.
Core Internet infrastructure plays a fundamental role for LDCs in developing a vibrant and sustainable digital economy. The elements of core Internet infrastructure — Internet Exchange Points (IXPs), country top-level domain names (ccTLDs), web hosting and data centres — are inextricably linked (Figure 3.1). Three strategic components need to be present domestically to ensure that the Internet continues to operate in an LDC in the event of disruption to international connectivity: a root name server;58 the ccTLD name server; and an IXP. This core infrastructure enables all other parts of the Internet to function, generating direct jobs and developing skills that are essential for ensuring the sustainability of the Internet in the country.59
Figure 3.1: The virtuous cycle of local Internet infrastructure
Source: ITU.
Core national Internet infrastructure has significant economic implications. If the ccTLD is not man-aged locally, money accrues to overseas registrars and web hosting companies. If there is no IXP, then data will be exchanged overseas, requiring costly Internet bandwidth. If the capacity of national data centres is limited, storage and cloud computing applications will be located abroad, adding to the need and subsequent costs of international bandwidth as well as increasing dependency on external networks over which there is no control.
58 For more about root servers see: https:// www. netnod. se/ i- root/ what- are- root- name- servers59 In the Netherlands, it is estimated that one-quarter Gross Domestic Product (GDP) is dependent on data centers and
cloud and hosting providers. See: Alaerds et al. 2017. The Foundations of our Digital Economy. https:// www. dhpa. nl/ wp- content/ uploads/ 2017/ 04/ Foundations_ Digital_ Economy. pdf

46
ICTs, LDCs and the SDGs
3.1 The underappreciated ccTLD
Few LDCs have been successful in harnessing the potential of their country domain name for devel-oping the local Internet ecosystem. This section reviews domain name developments among LDCs. It explores the important benefits that can accrue for LDCs by bundling domain names with local web hosting to build up the national Internet ecosystem, develop skills and generate employment.
National domains are known as country code top-level domains (ccTLDs). The ccTLD utilizes the International Organization for Standardization (ISO) two-letter standard for country codes.60 The Internet Assigned Names and Numbers (ICANN) Corporation recognizes government responsibility for their ccTLD. 61 This was not the case in the early days of the Internet, when an assortment of groups had control over a number of LDC ccTLDs. Most have since been delegated to the respective government but there are still a few unresolved issues.62
Managing a ccTLD includes appointing a registry for the domain, which implements government pol-icies. The registry either processes registration requests for ccTLD names itself ("2R" model: registry and registrant) or outsources the task to registrars ("3R" model: registry – registrars - registrants). The registry defines the policy for second-level domains (e.g., .co, .go, etc.) as well as the names that can and cannot be used (e.g., trademarks, controversial names, etc.). If outsourced, the registry also establishes the wholesale price for registrars. The registry is normally responsible for maintaining the ccTLD database and associated name server.
Figure 3.2: ccTLD processing model
Source: ITU.
Tuvalu has the good fortune to have the popular acronym TV (short for “television”) as its ccTLD. In 1998, DotTV, a tech startup from the United States, paid the Tuvaluan government US$ 50 million for the rights to the TV ccTLD for a dozen years.63 When the contract expired in 2001, another company took over arranging to pay Tuvalu US$ 2.2 million a year plus 5 per cent of revenue exceeding US$ 20 million for 15 years. Verisign, a large web address company, is now the sole registry operator for TV through 2021. It paid Tuvalu US$ 5 million in 2015 in registry fees64, a sum equal to 15 per cent of the country's Gross Domestic Product.65 Today there are over half a million TV domains generating an estimated US$ 22 million a year.
60 See Country Codes - ISO 3166" at: https:// www. iso. org/ iso- 3166- country- codes. html61 A list of the contact points for each ccTLD is available here: https:// www. iana. org/ domains/ root/ db62 For example despite South Sudan becoming independent in 2011, its ccTLD (.SS) has yet to be assigned.63 Samantha Beech. 2016. "The island nation of Tuvalu is being kept afloat by its domain name." News Corp. Australia
Network, 7 March. http:// www. news. com. au/ technology/ the- island- nation- of- tuvalu- is- being- kept- afloat- by- its- domain- name/ news- story/ 9af6c78e14c071013ddd7fa9ac64aa7f
64 Verisign. 2016. Form 10-K. https:// investor. verisign. com/ secfiling. cfm? filingid= 1014473- 16- 86& cik65 "IMF Executive Board Concludes 2016 Article IV Consultation with Tuvalu." Press Release, 4 October 2016. http:// www.
imf. org/ en/ News/ Articles/ 2016/ 10/ 04/ PR16445- Tuvalu- IMF- Executive- Board- Concludes- 2016- Article- IV- Consultation

47
ICTs, LDCs and the SDGs
Few other LDCs have such a catchy domain name as Tuvalu. Lao PDR's ccTLD is LA typically reminis-cent of the large city in southern California. The Laotian government has had an agreement since 2002 with a registrar to market LA primarily as a domain name for Los Angeles.66 With around 40,000 domains, LA is generating an estimated US$2 million a year in registration fees.67 Only a few hundred are in Lao PDR and in January 2017, the government regained full control of the ccTLD to promote it for domestic use.68
Surprisingly, the LDC with the largest number of ccTLD registrations is the Central African Republic. Its ccTLD, CF, has no memorable association with anything and the country has one of the lowest rates of Internet use among LDCs (an estimated 4 per cent of the population in 2015). The reason for its popularity is that it is free. The country's historical telephone operator, the Société Centrafricaine de Télécommunications (SOCATEL), has assigned CF to a Dutch company called Freenom, which states:
"The Dot CF Registry acknowledges that .CF domains can have an important social impact on the lives of the people in the Central African Republic and abroad. The mission of both SOCATEL and the Dot CF Registry is to increase the use of Internet in the Central African Republic and the awareness of the Central African Republic in the world. Dot CF directly funds SOCATEL's efforts to improve the population's access to internet."69
Given the opaque nature of the agreement it is difficult to understand how the Central African Republic benefits, particularly since the domain name is available for free. The Government does not have a central website portal. Freenom also has the rights to the ccTLD for Mali (ML), whose domain name can also be obtained for free. This explains why these domains account for such a high propor-tion of registered domain names in the LDCs (Figure 3.3, left). Freenom makes money by monetizing the domain when it expires by selling residual traffic to advertisers as well as providing web hosting.70 One of the risks of free domain names is that they attract registrants engaging in malicious behaviour. The Anti-Phishing Working Group has found that CF and ML ranked in the top ten of “phishing” TLDs.71
Other LDCs have free ccTLDs. The registry for Nepal (NP) provides free domain names but companies must be registered in Nepal in order to obtain one. In Burkina Faso, there is a one-time payment for a lifetime ccTLD. Certain second-level domains are often free or managed by a specific entity. For example, in many LDCs, responsibility for the second-level domain used for public agencies (e.g., .GOV) is often managed by a government agency.
There were 1.9 million ccTLDs registered in LDCs in June 2017, or 2 per cent of the world total. This must be put in the context of the population of the LDC group, which accounts for 13 per cent of the world total. LDCs are thus much under-represented in the ccTLD space.
The ccTLD is popular with many LDC governments and almost three-quarters use it for their central government portal (Figure 3.3, right). Distinguishing the website as a government portal through a second-level domain (e.g., .gov, .go or .gouv) is present on 60 per cent of LDC portals. Nine LDCs use a generic top-level domain for their central government portal (e.g., .com, .org), which suggests a problem using their ccTLD such as a delegation dispute or the registry being hosted abroad.72 Four LDCs (Central African Republic, Guinea-Bissau, Haiti and Somalia) do not have a central government website.
66 https:// www. la67 That is assuming the regular one-year registration fee of US$50. However, some premium names such as "surfers.la"
cost much more. See: https:// www. la/ e/ premiums/ 68 "LANIC Officially Takes Over Dot.La Domain Suffix." The Laotian Times, 24 January 2017. https:// laotiantimes. com/ 2017/
01/ 24/ lanic- officially- takes- dot- la- domain/ 69 See " About Dot CF" at: http:// www. dot. cf/ en/ aboutdotcf. html70 "Freenom Closes $3M in Series A Funding." Business Wire, 16 December 2013. https:// venturebeat. com/ 2013/ 12/ 16/
freenom- closes- 3m- in- series- a- funding/ 71 APWG. 2017. Phishing Activity Trends Report, 4th Quarter 2016. https:// docs. apwg. org/ reports/ apwg_ trends_ report_
q4_ 2016. pdf72 Burundi, Eritrea, Lao PDR, Sao Tome and Principe, Sierra Leone, South Sudan, Togo and Tuvalu.
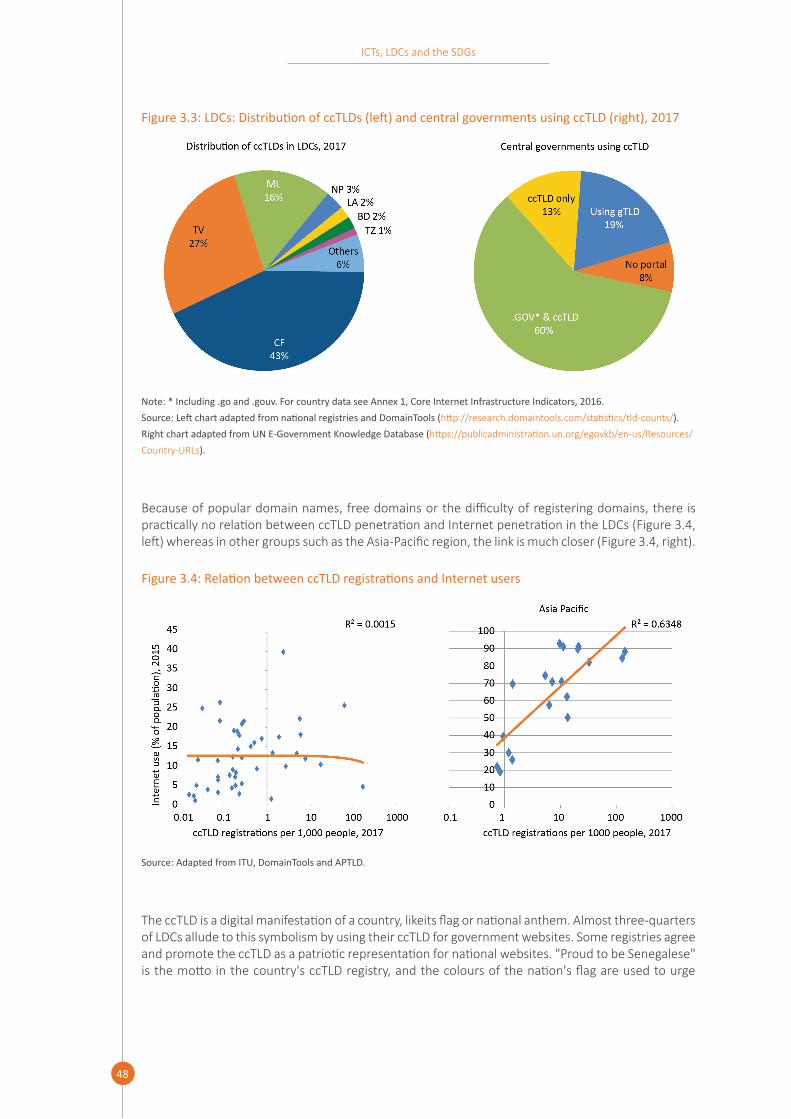
48
ICTs, LDCs and the SDGs
Figure3.3:LDCs:DistributionofccTLDs(left)andcentralgovernmentsusingccTLD(right),2017
Note:*Including.goand.gouv.ForcountrydataseeAnnex1,CoreInternetInfrastructureIndicators,2016. Source:LeftchartadaptedfromnationalregistriesandDomainTools(http:// research. domaintools. com/ statistics/ tld- counts/ ). Right chart adapted from UN E-Government Knowledge Database (https:// publicadministration. un. org/ egovkb/ en- us/ Resources/ Country- URLs).
Because of popular domain names, free domains or the difficulty of registering domains, there is practically no relation between ccTLD penetration and Internet penetration in the LDCs (Figure 3.4, left) whereas in other groups such as the Asia-Pacific region, the link is much closer (Figure 3.4, right).
Figure3.4:RelationbetweenccTLDregistrationsandInternetusers
Source: Adapted from ITU, DomainTools and APTLD.
The ccTLD is a digital manifestation of a country, likeits flag or national anthem. Almost three-quarters of LDCs allude to this symbolism by using their ccTLD for government websites. Some registries agree and promote the ccTLD as a patriotic representation for national websites. "Proud to be Senegalese" is the motto in the country's ccTLD registry, and the colours of the nation's flag are used to urge

49
ICTs, LDCs and the SDGs
companies to use the SN domain to promote their businesses (see Figure 3.5).73 Businesses in Senegal are offered a lower price compared to those overseas and both national and foreign registrars have been appointed.
Figure3.5:Marketingthe.SNccTLDinSenegal,2017
Source: http:// www. nic. sn
The ccTLD by itself is not of much use unless it is linked to a website. This synergy generates an op-portunity to grow the domestic web hosting industry while at the same time creating local content. The African Union recognizes this interaction and, in its support of efforts to develop local content, suggests that efforts are needed to:
"... bring back Africa's Internet Content to Africa by working with content developers, hosting service providers and country code top level domain names (CcTLD), to locally host Africa's internet content that is currently hosted outside Africa."74
There is considerable untapped potential for getting LDC businesses an online presence or repatriating their website from overseas. A website provides a distinctive and professional window in cyberspace. A survey of small businesses in seven countries found that the most preferred method for ensuring an online presence was a website (Figure 3.6, left) and 57 per cent of these businesses either had a website or planned to build one. Several reasons were provided for not having a website which will need to be overcome if local hosting is to be a success (Figure 3.6, right). It should be noted that many businesses want a website even though it is not an online shop and does not generate revenue from digital advertising. A study of Dutch businesses found that almost three-quarters had a website with a passive presence purely as a marketing platform to provide contact and other information about the enterprise.75
In Tanzania, the largest users of the .tz domain are companies (Figure 3.7, left). Given that few are going to get a domain name without web hosting, it makes sense to offer registration with local web hosting. The TZ registry does this by linking registration to local companies that can both register the domain and provide a web-hosting package.76 According to the World Bank, less than one-quarter of Tanzanian companies had a website in 2013.77 If this figure could be lifted to the level of the small
73 http:// www. nic. sn74 See "The African Internet Exchange System (AXIS) Project" at: https:// www. au. int/ web/ sites/ default/ files/ documents/
32509- doc- axis- brochure_ pida_- january_ 2017. pdf75 Statistics Netherlands. 2016. Measuring the internet economy in The Netherlands: a big data analysis. https:// www. cbs.
nl/ nl- nl/ achtergrond/ 2016/ 41/ measuring- the- internet- economy- in- the- netherlands76 https:// www. tznic. or. tz/ index. php/ en/ 77 See "Enterprise Surveys - Tanzania (2013)" at: http:// www. enterprisesurveys. org/ data/ exploreeconomies/ 2013/ tanzania

50
ICTs, LDCs and the SDGs
business survey mentioned earlier (57 per cent) it would generate around US$ 200 000 from annual domain name sales and some US$ 1.9 million for annual web hosting fees for local businesses (Figure 3.7, right).78 Although the figure may not appear large, in the context of Tanzania it is quite significant. There were 26 companies in mainland Tanzania operating in the information services activities indus-try in 2015. The additional domain and website revenues are equivalent to US$ 81 000 per business or US$ 18 000 per worker (based on the average of 4.4 employees per Tanzanian business). This is more than 20 times Tanzania's 2015 per capita income (US$ 879).79
Apart from the potential financial gains, sound ccTLD management can also contribute to Internet trust encouraging more businesses to go online. This includes efficient and transparent policies con-cerning eligibility for registrations, local presence requirements, naming structure of second-level domains, public access to ccTLD registration information, and trademark policy. Good practice can reduce fraud, intellectual property violation and cyber-squatting.
78 Prices are based on the price of registering a TZ domain and monthly webhosting fees for a "Soho" package. See: http:// www. extremewebtechnologies. com. Data on the number of registered business in mainland Tanzania are available from: National Bureau of Statistics. 2016. Statistical Business Register Report 2014/2015 Tanzania Mainland. http:// www. nbs. go. tz/ nbs/ takwimu/ Br/ 2014_ 15_ SBR. pdf
79 http:// data. worldbank. org/ indicator/ NY. GDP. PCAP. CD
Figure3.6:Smallbusinessesonlinewebpresenceinselectedeconomies(left)andreasonsfornothavingawebsite,2015(right)
Note:BasedonasurveyofbusinesseswithfiveorlessemployeesinAustralia,Brazil,Canada,India,Turkey,UnitedKingdomandUnited States. Source:GoDaddy&RedshiftResearch."SmallBusinessSurvey2015."https:// www. godaddy. com/ garage/ wp- content/ uploads/ 2015/ 09/ GoDaddy- Global- Small- Business- Report- 2015. pdf.

51
ICTs, LDCs and the SDGs
Figure3.7:Tanzania:ccTLDregistrations(left)andestimatedimpactfromadditionallocalwebhost-ing (right)
Source:AdaptedfromtzNIC(leftchart)andITUanalysis(rightchart).
A major reason to host domestically is that performance will be better for local users, particularly if there is an IXP. The Rwanda Information and Communication Technology Association (RICTA) has been promoting this through an initiative to repatriate 1 000 websites currently hosted abroad.80 An analysis of the programme found that quality improved as latency fell, and 113 companies changed their hosting from abroad to Rwanda (Figure 3.8). Also important was greater visitor engagement, with more page views and return visits resulting the enhanced performance. Web hosting employees felt their skills had improved as a result of technical requirements to manage additional websites. For the economic impact of “free” hosting abroad, see Box 3-1.
Figure3.8:ImpactoflocalhostinginRwanda
Source:AdaptedfromInternetSociety,2017.
80 RICTA. 2015. "Growing The Rwandan Internet Content Hosted In Rwanda (1k Websites)." http:// ricta. org. rw/ IMG/ pdf/ 1kwebsites_ project_ finalversion. pdf

52
ICTs, LDCs and the SDGs
Box3-1:Theeconomicsof"free"hosting
Some development practitioners argue that "free" hosting and other cloud services (e.g., e-mail, office applications, and so on) provided by large foreign Internet companies benefit developing countries owing to the absence of costs. This has driven many businesses in LDCs to use these services in the absence or at the expense of local ones. However, there is a price. Users are in effect giving away their personal data in exchange for a free service that generates a considerable amount of money for the provider through advertising. The inter-esting question is what the user's data is worth. From the users’ perspective, this might be what they would be willing to pay for a social network service without advertising. However, there is no market for personal data that could establish a price such as exist for stocks, commodities and many other products and services.1 Furthermore, not only does "free" overseas hosting impact the local website market in LDCs, it also affects the development of national digital advertising industries.
1 For more on pricing and personal see: "Data is Giving Rise to a New Economy." 2017. The Economist, 6 May.
Domain registries can play an active role in fostering Internet development through various initiatives. The Somali registry SONIC distinguishes between local and international registrants and provides a lower price for the former when registering through a domestic registry:81 a Somali registrant pays US$ 15 per year, whereas an international registrant pays US$ 62.82 SONIC has a number of other initiatives to drive the local Internet ecosystem. It manages .GOV e-mail and provides hosting for the Government and domains free of charge for academic institutions (.edu.so) and students (.me.so).83
Registries in other countries support LDCs with training and software related to ccTLD management. The Czech domain registry CZ.NIC provides free open-source software (Free Registry for ENUM and Domains, FRED) for running a ccTLD.84 FRED is being used in 11 countries around the world, includ-ing four LDCs (Angola, Malawi, Tanzania and Togo). The World Intellectual Property Organization (WIPO) supports ccTLD registries in legal areas including best practices and the Uniform Domain-Name Dispute Resolution Policy adopted by a number of countries including around a dozen LDCs.85
3.2 Thecriticalroleofdatacentres
Data centres (climate-controlled facilities for storing computerized information and remote services such as "cloud" services86) are critical for the development of the ICT ecosystem in LDCs. As applica-tions and services move to the cloud, the demand for data centres is growing. Data centres reduce the necessity of sending traffic abroad, not only saving on expensive international bandwidth but also enhancing data sovereignty over sensitive information. Data centres are essential for the standard-ization and interexchange of diverse government data sets across different ministries, and vital for digital businesses that want to host locally or are seeking locations for IXPs and ccTLD name servers.
This combination of increasing data use, cloud computing (Box 3-2) and data sovereignty, coupled with innovative miniaturization and prefabrication-based manufacturing techniques, is driving the
81 http:// www. nic. so/ policies/ 82 https:// www. sostec. so/ billing/ domain- names. php83 http:// www. nic. so/ achievements/ 84 https:// fred. nic. cz/ page/ 672/ introducing- fred/ #85 http:// www. wipo. int/ amc/ en/ domains/ cctld/ 86 Cloud computing is a way of delivering applications, services or content remotely to end users, rather than requiring
them to hold data, software or applications on their own devices. See: UNCTAD. 2013. Information Economy Report: "The Cloud Economy and Developing Countries". http:// unctad. org/ en/ pages/ newsdetails. aspx? OriginalVersionID= 665

53
ICTs, LDCs and the SDGs
growth in data centre deployment in many LDCs. Data centres are becoming cheaper, more adapt-able to harsh climates and quicker to deploy and scale up. These advances are helping to overcome socio-economic and geographic challenges which in the past limited deployment of data centres in many LDCs (see example of Ethiopia, Box 3-2).
Box3-2:DevelopmentofaCloudComputingStrategyinEthiopia
Despite the country’s low level of broadband penetration, the Ethiopian Government has taken a step in developing a cloud computing strategy and begun to put in place the core components of its ecosystem, including an Integrated Government Data Centre and training a “critical mass” of experts in cloud computing. The National Cloud Computing Strategy, which is referred to as “Seeding the Cloud”, promotes “learning by doing” and focuses on:1
• Creating an institutional framework for supporting cloud computing. The framework will be based on strengthening existing institutions and creating a cloud computing centre of excellence in the country.
• Improving awareness and knowledge exchange on cloud computing.
• Creating guidelines on cloud security, privacy and data location to be adopted by public institutions.
• Transforming the ICT procurement system in order to migrate from traditional asset-based acquisition to recurrent purchase of service.
• Nurturing the overall cloud ecosystem in the country, in particular broadband offerings, human skills, research and development, and local ICT-sector capability.
• Evaluating and experimenting with cloud services to ensure that risks and benefits are well-understood.
• Establish a government cloud and Appstore to facilitate reuse of applications.
1 Ministry of Communication and Information Technology, Ethiopia. 2014. “Seed the Cloud”: National Cloud Computing Policy, Strategy and Implementation Roadmap. http:// www. osh- et. com/ Portals/ 0/ National%20 Cloud%20 Computing%20 Policy,%20 Strategy%20 and%20 Roadmap%20 V2. 0. pdf
Prefabrication in particular is contributing to a rise in data centre deployments in LDCs. In Chad, mobile operator Millicom launched the country's first data centre in June 2016. The US$ 6 million 374m2 facility was manufactured in Sweden and designed to withstand the climate in N'Djamena, Chad's capital and one of the hottest cities in the world with average daily temperatures of around 40°C.87 The Swedish company that built the facility has deployed prefabricated data centres in Angola, Ethiopia, Mozambique and Myanmar.
One challenge with data centres is that they tend to consume a lot of energy to keep all the comput-ers and storage devices cool. This is problematic for LDCs situated in hot climate zones. Electricity costs vary greatly within the group, and around three-fifths of LDCs have electricity prices above the world average, particularly those that are also Small Island Developing States (SIDS) (See Section 2.1.4). Many are also prone to frequent electrical outages, requiring data centres to have costly and environmentally unfriendly backup diesel generators.
Energy-efficient and environmentally friendly data centres that are ideally suited to LDCs are now be-ing developed. Lao PDR recently inaugurated an "eco datacenter” using state-of-the-art energy-saving technology. The "Lao PDR Energy Efficient Datacenter" (LEED) was built in Japan and shipped in its own
87 "Flexenclosure builds Chad’s first data centre for Millicom." Press Release, 30 May 2016. http:// www. flexenclosure. com/ flexenclosure- builds- chads- first- data- centre- for- millicom/

54
ICTs, LDCs and the SDGs
container. It took seven months to construct, around one-third of the time needed for a conventional data centre. LEED uses 40 per cent less energy and reduces carbon dioxide emissions by around the same amount compared to traditional data centres (Figure 3.9).88 The US$ 850,000 data centre will support government applications enabling users to move off webmail to a more secure network.89
Figure3.9:LaoPDREnergyEfficientDatacenter(LEED)comparedtoconventionaldatacentre
Note:PUEmeasurestheproportionoftotalelectricalconsumptionforthedatacentretothecomputerequipmentconsump-tion.APUEof1isideal.Referencereferstoatraditionaldatacentre. Source:AdaptedfromNewEnergyandIndustrialTechnologyDevelopmentOrganization.
LDCs with low electricity prices, such as Ethiopia and Zambia, are blessed with significant energy po-tential, primarily hydroelectric. Zambia has the lowest electricity prices among the LDCs. This has been due to harnessing the hydroelectric potential of the Zambezi River. Recent drought has lowered water levels, affecting electricity production, and solar power is being considered to make up the shortfall.90 Meanwhile China provided funding for a US$ 75 million national data centre in Lusaka, which was launched in early 2017.91 It is supported by two smaller data centres for backup and disaster recovery.
Large IT companies often seek locations with chilly weather and cheap renewable energy to build their data centres.92 Some LDCs could potentially be locations for international data centres. Mountainous Bhutan has among the lowest electricity prices in the LDC group owing to its abundant hydropower and year-round cool climate.93 In 2017, the government launched its first data centre in Thimpu TechPark.94
Some LDCs are looking to attract international businesses that want to build their own data centres. Vanuatu, which acquired an undersea fibre-optic connection to the global Internet in 2014, is looking to unleash this abundant Internet bandwidth by attracting overseas investment. Foreign businesses
88 "'Lao PDR Energy Efficient Datacenter Project' Cloud Datacenter Using Joint Crediting Mechanism Starts Demonstration Operations." Press Release, 30 November 2016. http:// www. iij. ad. jp/ en/ news/ pressrelease/ 2016/ 1130. html
89 "Laos Gets $850,000 Containerized Data Center." The Laotian Times, 28 December 2016. https:// laotiantimes. com/ 2016/ 12/ 28/ laos- gets- 850000- containerized- data- center/
90 Lynsey Chuttel. 2016. "Zambia plans to have sub-Saharan Africa’s cheapest solar power." Quartz, June 7. https:// qz. com/ 700187/ with- hydropower- running- dry- zambia- turns- to- the- sun/
91 Sebastian Moss. 2017. "Huawei's $75m Zambian data center readies for launch." Data Centre Dynamics, 3 February. http:// www. datacenterdynamics. com/ content- tracks/ colo- cloud/ huaweis- 75m- zambian- data- center- readies- for- launch/ 97755. fullarticle
92 For example some of Google's large data centers are in cool northern climes such as Ireland and Finland: https:// www. google. com/ about/ datacenters/ inside/ locations/ index. html
93 http:// www. dcs. bt/ index. html94 Sebastian Moss. 2017. "The Kingdom of Bhutan opens first government data center." Data Centre Dynamics, 27 March.
http:// www. datacenterdynamics. com/ content- tracks/ colo- cloud/ the- kingdom- of- bhutan- opens- first- government- data- center/ 98052. fullarticle

55
ICTs, LDCs and the SDGs
can build their own pod-like data centre for around US$ 250 000 and it can be ready in three months.95 Djibouti is exploiting its connection to almost a dozen undersea cables by offering data centre colo-cation for companies using the cables.96
Apart from energy, another challenge is the need to consolidate the often scattered small data centres (so-called “data rooms”) and build energy-efficient data centres that meet key industry standards (along with disaster-recovery centres). Such data centres are costly and often beyond the means of many governments and the private sector in LDCs. One solution is public-private partnerships, an approach under consideration in Uganda.
3.3 IXPs:Beyondexchangingtraffic
Internet Exchange Points (IXPs) exchange locally-destined Internet traffic among Internet Service Providers (ISPs), saving on the cost of international bandwidth and improving the speed at which local content is delivered to users. As noted previously, IXPs can keep the national Internet up and running even if international connectivity is disrupted, as long as top-level domain-name servers are hosted in the country. IXPs have benefits for LDCs beyond their core activity that can help to root and sustain the Internet. IXPs can attract other actors besides ISPs, such as content providers and government services, broadening the local ecosystem. The management of IXPs raises the level of technical ICT skills in LDCs.
Despite the benefits of IXPs, fewer than half of LDCs have one (Figure 3.10) and even among those that do, some are not functioning to their full potential. One factor influencing the viability of an IXP is the degree of competition in the Internet market. There is little need for an IXP when there are two or fewer ISPs operating in a country. In more congested markets, incumbent operators that dominate international Internet gateways are reluctant to participate in IXPs since they benefit if other ISPs have to use their IP transit facilities.97
One measure of the size, diversity and likely level of competition in the Internet market is the number of Autonomous System Numbers (ASNs). These are assigned to ISPs as well as other entities such as wholesalers, governments, educational institutions and content providers that need to route traffic over the Internet. The more entities with ASNs, the greater the likely demand for IXPs. Hardly any LDCs have an IXP if there are fewer than ten ASNs assigned to the country. Some two dozen LDCs have fewer than ten ASNs each, and over 80 per cent of ASNs assigned to LDCs are in those with an IXP. Bangladesh has the largest number of ASNs, with 533 in June 2017 or 40 per cent of the LDC total. Unsurprisingly, its IXP is the biggest, handling more traffic than any other LDC IXP (Box 3-3).
95 "Data center offers 'more than just storage'." China Daily, 1 June 2015. http:// www. chinadaily. com. cn/ world/ 2015- 06/ 01/ content_ 20981306. htm
96 http:// www. djiboutidatacenter. com/ en/ home97 For example, in Senegal, ISPs have not been able to reach agreement on peering traffic for a number of years although it
is expected that an IXP will launch in the near future. See: France-IX. 2014. Senegalese Internet Exchange Point (SENIX). https:// www. franceix. net/ media/ cms_ page_ media/ 841/ SENIX. pdf`

56
ICTs, LDCs and the SDGs
Figure3.10:IXPsinLDCs
Note: Some LDCs have more than one IXP (i.e., Angola, Cambodia and Tanzania). For country data see Annex 1, Core Internet InfrastructureIndicators,2016. Source: Adapted from Packet Clearing House (www. pch. net).
Table3.1:LDCswithactiveIXP,2017
Country City IXP Participants
Angola Luanda ANGONIX 16
Angola Luanda Angola Internet Exchange 12
Bangladesh Dhaka Bangladesh Internet Exchange 31
Benin Cotonou Benin IX 6
Burkina Faso Ouagadougou Burkina Faso IXP 8
Burundi Bujumbura BurundiX Internet Exchange Point 1
Cambodia Phnom Penh Cambodian Network Exchange 27
Cambodia Phnom Penh HTN-Cambodia Internet Exchange 13
Congo, D.R. Kinshasa Kinshasa Internet Exchange 11
Gambia Serrekunda Serrekunda Internet Exchange Point 14
Haiti Port au Prince AHTIC Internet Exchange Point 9
Lao PDR Vientiane Lao National Internet Center 7
Lesotho Maseru Lesotho Internet Exchange Point 0
Liberia Monrovia Liberia Internet Exchange Point 6
Madagascar Antananarivo Madagascar Global Internet Exchange (MGIX) 4
Malawi Blantyre Malawi IXP 36

57
ICTs, LDCs and the SDGs
Country City IXP Participants
Mozambique Maputo Mozambique Internet Exchange 17
Nepal Kathmandu Nepal Internet Exchange (NPIX) 30
Rwanda Kigali Rwanda Internet exchange 15
Sudan Khartoum Sudan Internet Exchange Point 7
Tanzania Dar es Salaam Tanzania Internet Exchange (TIX) 35
Tanzania Arusha Arusha Internet Exchange Point 6
Tanzania Mwanza Mwanza Internet Exchange Point 4
Timor-Leste Dili Timor-Leste Internet Exchange 3
Uganda Kampala Uganda Internet Exchange 26
Vanuatu Port Vila Vanuatu Internet Exchange 6
Zambia Lusaka Zambia Internet Exchange Point 13
Source: Adapted from Packet Clearing House (www. pch. net).
Although an LDC may have an IXP, it may not be fully exploited because of a lack of cooperation, limited resources, or other factors. These are likely to have scarce traffic and may be more symbolic than practical. On the other hand, those that are functioning well tend to have a high level of traffic exchange. The Rwanda Internet Exchange (RINEX) was launched in mid-2004.98 It is managed by RICTA and has a dozen participants. Traffic is growing, with peak traffic rising from 1.2 Gbps in May 2016 to 2.1 Mbps by May 2017, an increase of 67 per cent. RINEX peak traffic is significant, amounting to over 20 per cent of the country’s international Internet bandwidth.
IXPs also vary in terms of the range of services and member diversity. From Afghanistan or Zambia, the Google search engine and its other properties such as YouTube are typically the most visited sites in many LDCs and can be a major drain on international bandwidth. 99 Google allows IXPs that meet certain requirements, particularly a specific minimum traffic threshold, to install “cache” software keeping popular content stored on the exchange to reduce the need for international bandwidth and improve performance.100 There are 22 LDCs with a Google cache. Sometimes the caches are located on IXPs, while in countries with no IXPs the cache is generally located on the servers of the leading ISP. In competitive markets, this gives a performance advantage to ISPs that have the Google cache unless they have agreed to share.
98 http:// rinex. org. rw99 In both Afghanistan and Zambia, the three most popular are all Google properties. See: http:// www. alexa. com/ topsites/
countries/ AF100 https:// www. google. com/ maps/ d/ viewer? mid= 18FeuDz0xtVnpvLiFz9HsPk7ZTDg& hl= en_ US& ll=- 3. 81666561775622e-
14%2 C10. 318399000000056& z= 1

58
ICTs, LDCs and the SDGs
Box 3-3: From a development project to a growing IXP: Bangladesh Internet Exchange
The Bangladesh Internet Exchange (BDIX) was created in 2004 when some pioneering ISPs linked their networks together to exchange traffic locally with the intention of increasing speed and quality of service and reducing costs by avoiding international transit for local traffic.
The ISPs were convinced of the benefits of an IXP but needed to find the technical know-how and financial support to set up and manage it. BDIX could count on the support of several national and international technical specialists and received its initial technical equipment (switches, routers, and so on) from the United Nations Development Programme (UNDP).
It grew from ten ISPs in 2004 to a diverse membership of more than 75 organizations in 2016. Mobile operators and content providers are now peering, and BDIX is also hosting Root Servers, VeriSign TLD servers, PCH looking glass, etc.
BDIX has been operating as a not-for-profit IXP since its inception. BDIX is a Layer 2 Internet Exchange point (each network provides its own router and traffic is exchanged via an Ethernet switch) and supports both IPv4 and IPv6. Network operators have the choice be-tween 100 Mbps, 1 Gbps and 10 Gbps ports to connect to the IXP. Members pay a one-time contribution per port and a monthly fee, which depends on the port size.
The traffic at BDIX increased year after year. The average traffic in 2009 was 50 Mbps. By 2015, average traffic had increased to 5 200 Mbps, and reached 9 470 Mbps in May 2017.
In June 2014, BDIX received a licence from the Bangladesh Telecommunication Regulatory Commission (BTRC) to operate as a national Internet exchange. BDIX is expecting to grow as more ISPs and telecommunication operators join. Work is under way to open a second Point of Presence (PoP) outside the capital Dhaka.
Source:AdaptedfromInternetGovernanceForum.2017.Contributing to the success and continued development of Internet exchange points (IXPs). http:// www. intgovforum. org/ multilingual/ index. php? q= filedepot_ download/ 3408/ 442.
In addition to ISPs, a growing number of other kinds of organizations are joining IXPs because of the improved performance. The Uganda Internet Exchange Point has 26 participants, including the National Research and Education Network, allowing teachers, students and researchers to exchange information quickly amongst themselves; wholesale backbone operators wishing to offer end-to-end peering to their customers; and the Uganda Revenue Authority, to enable faster access to online tax filing.101 This growing diversity of IXP members increases local content and drives greater use as per-formance is improved. One benefit of the diverse base of users is that it enhances IXP sustainability and, in LDCs without an IXP, facilitates lobbying in favour of creating one. The best way to stimulate this diversity is neutral and community-oriented management of the IXP with multiple stakeholders. The IXP needs persuasive lobbying skills to convince different groups about the benefits of exchanging traffic.
In LDCs such as Djibouti, where there is a single Internet access provider, there has been little need for a national IXP since there are no other ISPs to exchange traffic with. Djibouti is notable for its strategic geographic location next to the Bab-el-Mandeb Straits, a key passage point for fibre-optic submarine cable networks between Asia, the Middle East and Europe (Figure 3.11). A dozen cables already land or are planned to land in Djibouti, making it an ideal place to interexchange traffic.102 To support that need, the Djibouti Internet Exchange (DjIX) was launched in 2016. 103 Located just metres from the
101 https:// www. uixp. co. ug/ networks102 http:// www. submarinecablemap. com/ #/ landing- point/ djibouti- city- djibouti103 http:// www. djiboutidatacenter. com/ en/ page/ djibouti- ix- djix

59
ICTs, LDCs and the SDGs
cable landing station and housed in state-of-the-art data centre, DjIX provides a platform for large carriers to exchange traffic destined for the East Africa region, reducing latency, increasing speeds and lowering costs for both operators and downstream users. Three other LDCs situated nearby (Eritrea, Somalia and Yemen) have so far not been able to exploit the close proximity of submarine cable networks, as Djibouti has done, but could try to enter into negotiations.
Figure3.11:Fibre-opticsubmarinecableslandingandplannedinDjibouti
Source: Adapted from TeleGeography.
The East African Communications Organization is promoting the connection of national IXPs to form a regional IXP.104 Its EAIXP task force has proposed interconnecting the region's five IXPs: Kenya Internet Exchange Point (KIXP), Tanzania Internet Exchange Point (TIX), Rwanda Internet Exchange Point (RINEX), Uganda Internet Exchange Point (UIXP) and Burundi Internet Exchange Point (BurundiX). The benefits would include savings on the cost of international circuits outside East Africa; improved quality from lower latency and packet loss; regional data sovereignty; and better cybersecurity co-ordination. EAXIP would lower costs for users and enhance the regional web hosting market. The initiative calls for each IXP to connect via fibre to at least two other IXPs initially, and eventually to all the others, in order to create a mesh network. The African Union is supporting the project as part of an initiative to create regional IXPs in the continent's regional economic communities.
Regional Internet associations play an important role in providing training for IXP staff, thereby deep-ening sustainability of the Internet in LDCs. In 2015 APNIC, the Internet number registry for the Asia-Pacific Region, provided 77 courses for over 2 000 people from countries including Myanmar and Timor-Leste.105 Similarly, the African Internet number registry AFRNIC offers free workshops targeting managers, network engineers and system administrators.106 Training includes IPv6, IP addresses and routing, and has been conducted on site in a number of African LDCs.107
3.4 Conclusions
LDCs have come a long way and are catching up with an Internet that started in developed countries and where they were highly disadvantaged in terms of control over their ccTLDs and their ability to host a root server. Limited Internet markets meant that LDCs became highly reliant on foreign countries for content, hosting and data storage. Access to these services required international con-nectivity, another area in which they were disadvantaged since they had to pay the full cost of links. This meant that LDCs were subsidizing users abroad in order to surf content in their own country. Although the absolute number of users concerned was not great, it included sizeable diasporas, as well as researchers, tourists and others. Another factor that has held back the development of core
104 See "East African Internet Exchange Point (EAIXP) Project Document at: http:// www. eaco. int/ docs/ congress/ EAIXP_ PROJECT_ PROPOSAL. pdf
105 Lisa Corness. 2016. "APNIC Training: 2015 in review." APNIC, 20 January. https:// blog. apnic. net/ 2016/ 01/ 20/ apnic- training- 2015- in- review/ #infographic
106 https:// www. afrinic. net/ en/ services/ training107 http:// learn. afrinic. net/ en/ about- us/ where- we- ve- been#

60
ICTs, LDCs and the SDGs
Internet infrastructure in LDCs has been the phenomenal spread of mobile communications. The rapid take-up of wireless technologies initially diverted attention from the Internet because most cellphone use involved voice calls, text messaging or mobile money. While there was some Internet use from mobiles, it was based largely on narrowband technologies. Only now, with the arrival of 3G and now 4G networks combined with smartphones, is broadband mobile Internet beginning to take off in LDCs. The growth in mobile data is increasing the pressure to create resilient core Internet infrastructure.
LDCs are making steady progress towards developing their key national Internet infrastructure. As noted at the beginning of this chapter, three critical components are essential for resiliency and for ensuring that the Internet stays up and running in the event that international connectivity is disrupt-ed: a root name server, a ccTLD name server, and an IXP.
Almost one-third of LDCs have the fundamental infrastructure in place. The 14 nations in question are on the path towards a high level of Internet resiliency and sustainability (Figure 3.12). Another 11 have two of the key components; some are markets with two or fewer ISPs with no IXP and would otherwise be considered to have sustainable networks. Eleven other LDCs have only one IXP in place while a dozen do not have any of the key components operating in their country.
Figure3.12:FundamentalInternetinfrastructureinLDCs,June2017
Note:SeeAnnex1,CoreInternetInfrastructureIndicators,2016forcountrydata. Source: ITU based on various sources.
There has never been a better time for an LDC to enhance its core national Internet infrastructure. With the right policy push, there is no reason why most LDCs could not achieve the three require-ments for Internet sustainability. Some LDCs have recognized their ccTLD as an essential resource and understand the important link between domain names and domestic web hosting. This needs to be appreciated by other LDCs. There are various resources to help LDCs master the skills needed for managing their ccTLD, and free open-source software is available for ccTLD operations.
Prefabrication, modularization and scaling are making data centres more affordable. This provides an opportunity for LDCs to leap-frog to energy-efficient and environmentally friendly data centres. This is essential for driving government services and cloud computing applications in these countries.
For LDCs still lacking elements of critical national Internet infrastructure, support is available. Many IXPs in the LDCs have been created with the assistance of development partners such as ITU and UNDP. The African Union's African Internet Exchange System (AXIS) project has funded deployment
61
ICTs, LDCs and the SDGs
of IXPs throughout the region in collaboration with the Internet Society. These and other institutions stand ready to provide assistance, financial, technical or both, for LDCs to establish IXPs. Both APNIC and AFRNIC have been instrumental in helping LDCs to obtain root name servers. APNIC's root server project has provided technical and financial support for the installation of root servers in Bangladesh, Bhutan and Cambodia.108 AFRNIC's Root server copy project has led to their deployment in Angola, Rwanda and Zambia.109
APNIC and AFRINIC, along with other bodies, have also been at the forefront of assisting LDCs in their regions with training to deploy and manage national Internet infrastructure (Box 3-4).
Given the importance of national Internet infrastructure for performance, resiliency and sustainability, one achievable goal is to ensure that the necessary components are available in all LDCs. As already mentioned, support for this is widely available and all that is needed is the political will to make it happen.
Box3-4:HelpfortheformationoftechnicalInternetskills:ThecaseofMyanmar
The international community has stepped in to assist Myanmar with developing its techni-cal skills for managing the Internet following liberalization of the country's ICT sector. Two licences were awarded to foreign-backed ventures for mobile networks in 2013. This was followed by a policy of unlimited ISP licences and a national broadband plan.
APNIC has provided training to the Telecommunication Department (PTD) in Internet re-source management, routing, IPv6 and ccTLD management, through a one-week in country workshop. Almost 50 PTD participants learned how to manage IP address and AS number delegation. ICANN provided training on managing the .MM domain.1
Help to strengthen the capacity of the University of Computer Studies in Yangon has been instrumental in promoting technical skills training in Myanmar.2 This includes assistance from Japan, to establish a training institute,3 and from India, for the Centre for Enhancement of Information Technology Skills.4 The University of Oregon has provided training on creating a campus-wide Internet network with the goal that it should evolve into a National Research and Education Network for Myanmar.5
1 https:// blog. apnic. net/ 2015/ 09/ 17/ myanmars- ict- ministry- opens- door- for- internet- infrastructure- development/
2 http:// www. internet2. edu/ presentations/ tip2013/ 20130116- Htoon- MyanmarNetworkUpdate. pdf3 https:// www. jica. go. jp/ myanmar/ english/ activities/ activity09. html4 http:// itip. moe- st. gov. mm/? page_ id= 85 https:// nsrc. org/ workshops/ 2013/ nsrc- myanmar- nren/
108 https:// www. apnic. net/ community/ support/ root- servers/ 109 https:// www. google. com/ maps/ d/ viewer? ll=- 6. 8109183978717045%2 C39. 26535100000001& spn= 0. 039076%2 C0.
066047& msa= 0& mid= 16RX19IST2KOFD2Mm3QNNHVJh2R4& z= 14
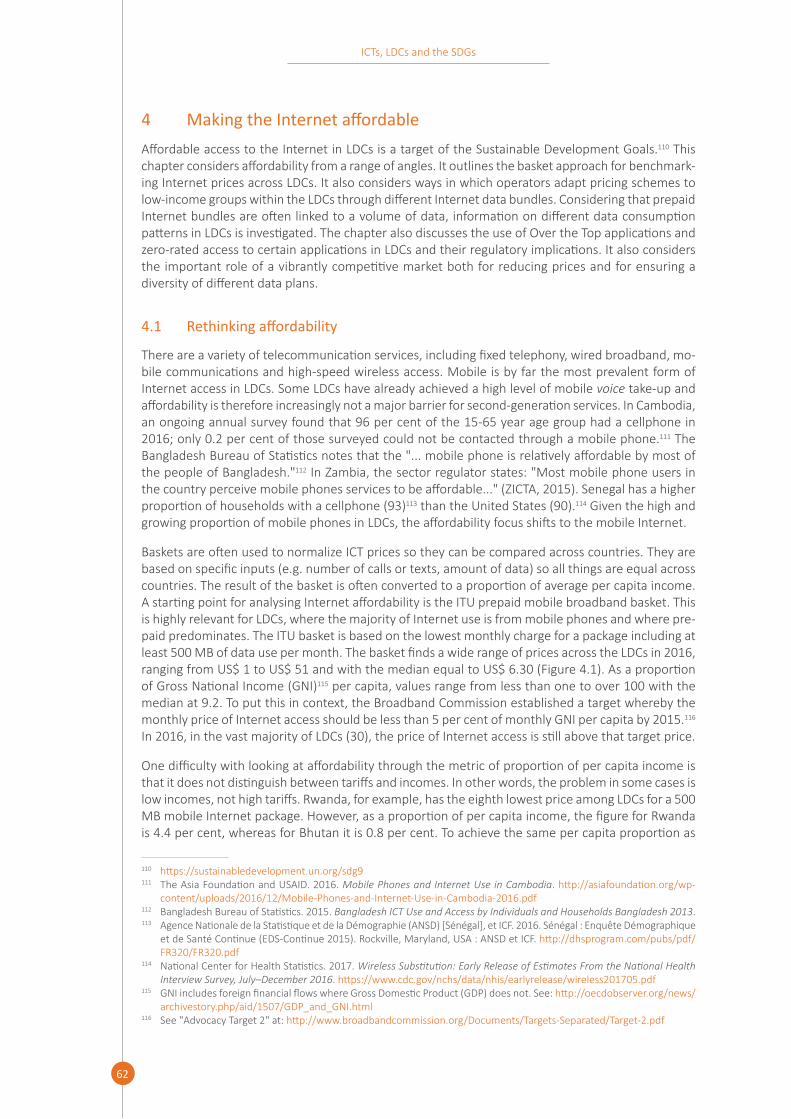
62
ICTs, LDCs and the SDGs
4 MakingtheInternetaffordableAffordable access to the Internet in LDCs is a target of the Sustainable Development Goals.110 This chapter considers affordability from a range of angles. It outlines the basket approach for benchmark-ing Internet prices across LDCs. It also considers ways in which operators adapt pricing schemes to low-income groups within the LDCs through different Internet data bundles. Considering that prepaid Internet bundles are often linked to a volume of data, information on different data consumption patterns in LDCs is investigated. The chapter also discusses the use of Over the Top applications and zero-rated access to certain applications in LDCs and their regulatory implications. It also considers the important role of a vibrantly competitive market both for reducing prices and for ensuring a diversity of different data plans.
4.1 Rethinkingaffordability
There are a variety of telecommunication services, including fixed telephony, wired broadband, mo-bile communications and high-speed wireless access. Mobile is by far the most prevalent form of Internet access in LDCs. Some LDCs have already achieved a high level of mobile voice take-up and affordability is therefore increasingly not a major barrier for second-generation services. In Cambodia, an ongoing annual survey found that 96 per cent of the 15-65 year age group had a cellphone in 2016; only 0.2 per cent of those surveyed could not be contacted through a mobile phone.111 The Bangladesh Bureau of Statistics notes that the "... mobile phone is relatively affordable by most of the people of Bangladesh."112 In Zambia, the sector regulator states: "Most mobile phone users in the country perceive mobile phones services to be affordable..." (ZICTA, 2015). Senegal has a higher proportion of households with a cellphone (93)113 than the United States (90).114 Given the high and growing proportion of mobile phones in LDCs, the affordability focus shifts to the mobile Internet.
Baskets are often used to normalize ICT prices so they can be compared across countries. They are based on specific inputs (e.g. number of calls or texts, amount of data) so all things are equal across countries. The result of the basket is often converted to a proportion of average per capita income. A starting point for analysing Internet affordability is the ITU prepaid mobile broadband basket. This is highly relevant for LDCs, where the majority of Internet use is from mobile phones and where pre-paid predominates. The ITU basket is based on the lowest monthly charge for a package including at least 500 MB of data use per month. The basket finds a wide range of prices across the LDCs in 2016, ranging from US$ 1 to US$ 51 and with the median equal to US$ 6.30 (Figure 4.1). As a proportion of Gross National Income (GNI)115 per capita, values range from less than one to over 100 with the median at 9.2. To put this in context, the Broadband Commission established a target whereby the monthly price of Internet access should be less than 5 per cent of monthly GNI per capita by 2015.116 In 2016, in the vast majority of LDCs (30), the price of Internet access is still above that target price.
One difficulty with looking at affordability through the metric of proportion of per capita income is that it does not distinguish between tariffs and incomes. In other words, the problem in some cases is low incomes, not high tariffs. Rwanda, for example, has the eighth lowest price among LDCs for a 500 MB mobile Internet package. However, as a proportion of per capita income, the figure for Rwanda is 4.4 per cent, whereas for Bhutan it is 0.8 per cent. To achieve the same per capita proportion as
110 https:// sustainabledevelopment. un. org/ sdg9111 The Asia Foundation and USAID. 2016. Mobile Phones and Internet Use in Cambodia. http:// asiafoundation. org/ wp-
content/ uploads/ 2016/ 12/ Mobile- Phones- and- Internet- Use- in- Cambodia- 2016. pdf112 Bangladesh Bureau of Statistics. 2015. Bangladesh ICT Use and Access by Individuals and Households Bangladesh 2013.113 Agence Nationale de la Statistique et de la Démographie (ANSD) [Sénégal], et ICF. 2016. Sénégal : Enquete Démographique
et de Santé Continue (EDS-Continue 2015). Rockville, Maryland, USA : ANSD et ICF. http:// dhsprogram. com/ pubs/ pdf/ FR320/ FR320. pdf
114 National Center for Health Statistics. 2017. Wireless Substitution: Early Release of Estimates From the National Health Interview Survey, July–December 2016. https:// www. cdc. gov/ nchs/ data/ nhis/ earlyrelease/ wireless201705. pdf
115 GNI includes foreign financial flows where Gross Domestic Product (GDP) does not. See: http:// oecdobserver. org/ news/ archivestory. php/ aid/ 1507/ GDP_ and_ GNI. html
116 See "Advocacy Target 2" at: http:// www. broadbandcommission. org/ Documents/ Targets- Separated/ Target- 2. pdf

63
ICTs, LDCs and the SDGs
Bhutan, Rwanda would either need to reduce the price to US$ 0.47— a price which operators prob-ably cannot afford to offer — or its GNI per capita would have to increase by over three times. This would take over 20 years at current growth rates.
The focus on affordability implies that it is a principal factor in determining take-up of a service. It is therefore useful to compare mobile Internet basket prices in the LDCs to Internet penetration (Figure 4.2). There is some relationship between mobile Internet prices as a proportion of per capita income and Internet use but it is not particularly strong (R2=0.47). Given the low coefficient of deter-mination, there are other factors at play influencing Internet take-up, such as availability and skills.
Figure4.2:RelationbetweenmobilebroadbandbasketandInternetusage,2015,LDCs
Note:GNIreferstoGrossNationalIncome. Source: Adapted from ITU.
Figure4.1:ITUprepaidmobilebroadbandpricebasket(atleast500MBpermonth),2016
Note:Referstoplanoflargestmobileoperator(bysubscriptions).LDCsforwhichtariffdatawasnotavailablearenotincluded.ForcountrydataseeAnnex1,AffordabilityIndicators,2016. Source: ITU.

64
ICTs, LDCs and the SDGs
Zambia has a wealth of expenditure statistics making it a useful country for the purpose of analysing the issue of Internet affordability more deeply. The ITU mobile broadband basket found the price for 500 MB in Zambia to be US$ 9.7 (80 Zambian Kwacha (ZMK)) in 2016 and affordability to be 7.8 per cent of monthly GNI per capita. It is useful to contrast that with actual expenditures and usage in the country. According to a national survey, 84 per cent of mobile users spend 15 ZMK (US$ 1.74) or less per week on the service, or 60 ZMK (US $6.95) per month (ZICTA, 2015). Furthermore, MTN report-ed that average monthly data usage for its customers in Zambia was 217 MB in 2016.117 The closest bundle MTN offers in that range is 300 MB for 61.50 ZMK (US$ 5.96), quite close to what surveyed users reported spending per month.
According to the 2015 Living Conditions Monitoring Survey,118 communications accounted for an av-erage of 3.4 per cent of household expenditure in Zambia, or K54 (US$ 6.25) per month (Figure 4.4, left).119 This varies by the type of household and its location. Households were divided into seven strata for the survey moving beyond simple urban and rural divisions to provide a high degree of analytical granularity (Figure 4.3). The cost of housing in a neighbourhood is used to disaggregate urban areas with low cost below the average, medium cost around the average, and high cost above the average. This would generally map to income levels.
Figure 4.3: Seven strata of Zambian households
Note: Figure in parenthesis refers to share of total Zambian households. Source:AdaptedfromZambianCentralStatisticalOffice.
While a small-scale agricultural household spends US$ 1.46 per month on communications, house-holds in an urban area with high-cost housing spend US$ 31.59. Only three types of households spend more on communications per month than the price of a 500 MB mobile Internet bundle: large-scale agricultural, medium-cost, and high-cost.
117 MTN. 2016 Data sheets. https:// www. mtn. com/ en/ investors/ financial- reporting/ annual- results/ Pages/ default. aspx118 Central Statistical Office (CSO). 2016. 2015 Living Conditions Monitoring Survey (LCMS) Report. http:// 154. 73. 235. 186:
8080/ jspui/ bitstream/ 123456789/ 518/ 1/ LCMS%202015 %20Summary%20 Report. pdf119 Communications expenditure includes spending on mobile phone airtime, landline service charges, Internet and postal
expenses. To simplify the analysis, it is assumed communications expenditure would be on mobile Internet because voice and text messages could be used with Over the Top (OTT) apps. It does raise the interesting point about how consumers decide to divide communications expenditures between traditional voice and Internet but that is beyond the scope of the analysis in this chapter.
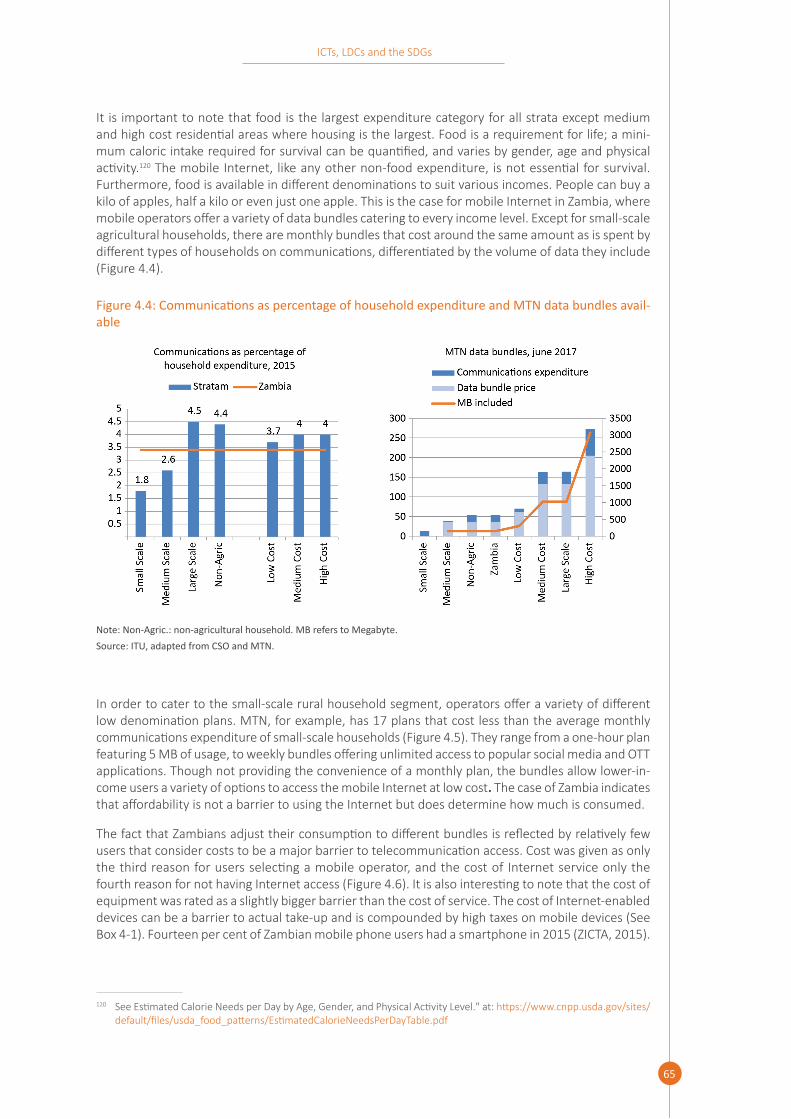
65
ICTs, LDCs and the SDGs
It is important to note that food is the largest expenditure category for all strata except medium and high cost residential areas where housing is the largest. Food is a requirement for life; a mini-mum caloric intake required for survival can be quantified, and varies by gender, age and physical activity.120 The mobile Internet, like any other non-food expenditure, is not essential for survival. Furthermore, food is available in different denominations to suit various incomes. People can buy a kilo of apples, half a kilo or even just one apple. This is the case for mobile Internet in Zambia, where mobile operators offer a variety of data bundles catering to every income level. Except for small-scale agricultural households, there are monthly bundles that cost around the same amount as is spent by different types of households on communications, differentiated by the volume of data they include (Figure 4.4).
Figure4.4:CommunicationsaspercentageofhouseholdexpenditureandMTNdatabundlesavail-able
Note: Non-Agric.: non-agricultural household. MB refers to Megabyte. Source: ITU, adapted from CSO and MTN.
In order to cater to the small-scale rural household segment, operators offer a variety of different low denomination plans. MTN, for example, has 17 plans that cost less than the average monthly communications expenditure of small-scale households (Figure 4.5). They range from a one-hour plan featuring 5 MB of usage, to weekly bundles offering unlimited access to popular social media and OTT applications. Though not providing the convenience of a monthly plan, the bundles allow lower-in-come users a variety of options to access the mobile Internet at low cost. The case of Zambia indicates that affordability is not a barrier to using the Internet but does determine how much is consumed.
The fact that Zambians adjust their consumption to different bundles is reflected by relatively few users that consider costs to be a major barrier to telecommunication access. Cost was given as only the third reason for users selecting a mobile operator, and the cost of Internet service only the fourth reason for not having Internet access (Figure 4.6). It is also interesting to note that the cost of equipment was rated as a slightly bigger barrier than the cost of service. The cost of Internet-enabled devices can be a barrier to actual take-up and is compounded by high taxes on mobile devices (See Box 4-1). Fourteen per cent of Zambian mobile phone users had a smartphone in 2015 (ZICTA, 2015).
120 See Estimated Calorie Needs per Day by Age, Gender, and Physical Activity Level." at: https:// www. cnpp. usda. gov/ sites/ default/ files/ usda_ food_ patterns/ EstimatedCalorieNeedsPerDayTable. pdf

66
ICTs, LDCs and the SDGs
Figure4.6:MainreasonforselectingamobileproviderandbarrierstohouseholdInternetaccess,Zambia,2015
Source:AdaptedfromZICTA,2015.
The major reason for people in Zambia not using the Internet is not the cost but lack of knowledge or skills to use the Internet, or not needing to use it. This in turn is tied to age and education (Figure 4.7).
Figure4.5:MTNZambiahourly,dailyandweeklyplans,June2017
Note:Plansneedtobeconsumedduringthespecifiedperiod(i.e.,hour,day,weekornightandweekend.Forexample,a5MBhourplanneedstobeconsumedin60minutes.AdailyFacebookplanmeansthatusershaveunlimitedaccesstotheapplica-tionforoneday.*=Unlimitedaccessfortheperiodspecified.†WhatsApp,TwitterandFacebook.‡Sunday12am-11:59pm(24hours).~Night12am-5am(5hours).Actualspendoncommunications(%)referstotheaveragemonthlyexpenditureperhouseholdoncommunicationsinZambiain2015(3.4%). Source: Adapted from http:// www. mtnzambia. com/ en/ products/ bundles/ Pages/ data- bundles. aspx.

67
ICTs, LDCs and the SDGs
Figure4.7:Zambia,Internetusebyeducationandage,2015
Source:AdaptedfromZICTA,2015.
The practice of offering a variety of Internet bundles is not restricted to Zambia. Almost all LDCs offer different Internet bundles catering to various income situations (Figure 4.8). The bundles include hourly, daily, nightly, weekend, weekly and bi-weekly plans. Some of the hourly, nightly, daily and weekend plans offer unlimited usage. Similarly, a number of LDC mobile operators offer unlimited access to popular social media and Over the Top applications (see below) for a certain period. On average, there are 11 different Internet bundles available in the LDCs, including variety with monthly plans where on average there are six different bundles available. This variety goes far towards making at least some degree of Internet access affordable. See also Box 4-2.
Figure4.8:MobileInternetbundlesintheLDCs,2017
Note:Basedonthelargestmobileoperator(bysubscriptions)inthe45LDCswheredatawasavailable.TheleftchartshowshowmanyLDCshaveaspecifictimebundle.Forexample,sixLDCshaveanhourlyplan.Therightchartshowstheaveragenumberofplanspertimebundle.Forexample,thereare1.8differenthourlyplansinLDCsthatoffersuchaplanand5.6differentmonthlyplans. Source: ITU.

68
ICTs, LDCs and the SDGs
Box 4-1: Cellphones in Cambodia: Smartphones, electricity and Khmer
Mobile Internet baskets focus on the price of the service. However, an Internet-device is a prerequisite for using the service. The price of smartphones has been dropping, especially Android models.1 Nevertheless, the price of a device can be a barrier in some LDCs, partic-ularly when onerous import duties and other taxes are added. According to GSMA, handset taxes as a proportion of the handset price averaged 23 per cent around the world, about the same average as in the LDCs (GSMA, 2015). However, the taxes are more onerous in LDCs, where they account for a larger share of per capita income. Data for LDCs included in the GSMA study show that handset taxes range from 0 to 40 per cent of the cost (see Box chart 4.1).
Box4.1Figure:Handsettax/Handsetcost,selectedLDCs,2015
Source: Adapted from GSMA.
Cambodia has been making steady progress towards the adoption of smartphones. The country has the second lowest taxes on handsets among the LDCs, which has an important impact on the price. By 2016, almost half of Cambodians had a smartphone. One reason for the rapid growth is the ability to display the Khmer script: over 90 per cent of smart-phones have Khmer, compared to 66 per cent of regular cellphones. The lowest price for a smartphone from one of the Cambodian mobile operators is US$ 40, equivalent to 4 per cent of average per capita income. This does not seem to be particularly burdensome, given that Cambodia has the cheapest mobile broadband price among the LDCs at just US$ 1 per month. What seems to be more of a problem is finding a place to charge the smartphone. Only two-thirds of Cambodian households have electricity, with almost a quarter of the remaining households relying on batteries. To overcome that barrier, the new smartphone comes with eight weeks of free recharging at the vendor's shops.
1 Loe Mirani. 2014. "$30 smartphones are here—and they’re getting better every day" Quartz, 18 December. https:// qz. com/ 314285/ 30- smartphones- are- here- and- theyre- getting- better- every- day/
69
ICTs, LDCs and the SDGs
Box 4-2: Number of hours of work to pay for a mobile Internet bundle
Jana, a mobile advertising company, has a different take on mobile Internet affordability.1 Rather than looking at the mobile Internet price as a proportion of per capita income, it considers how many hours a person receiving the statutory minimum wage in a country needs to work in order to pay for 500 MB. This report has calculated the result for several LDCs that have the requisite data and compared the result to the proportion of per capita income indicator (see chart below). In general, there is a relationship for the LDCs according to which the proportion of per capita income is less than 5 per cent. In Vanuatu, where the mobile Internet basket is 3 per cent of per capita income, a person receiving the minimum wage would have to work for five hours to pay for the bundle. There are some divergences. In Comoros, the basket is 17 per cent of per capita income, equivalent to around two days (16 hours) of work at the minimum wage. In Mauritania, it would take around one and half week’s wages to pay for a 500 MB basket.
The minimum wage index provides an insight into the possible implications of mobile Internet affordability for the lowest-paid workers. One challenge is that in some LDCs, minimum wag-es have not been updated for years so it is unlikely they are representative of the current situation.2 In others, there can be a range of minimum wages depending on the sector.3
BoxChart4.2:Hoursofworkatminimumwageneededtopayfor500MBofmobileInternet,2015
Source: Adapted from http:// www. wageindicator. org/ main/ salary/ minimum- wage.
1 Jana. "The Data Trap, Revisited." 10 April 2017. http:// blog. jana. com/ blog/ the- data- trap- revisited2 This is the case in Rwanda where minimum wages have not changed sine 1974. See: http:// www. wageindicator.
org/ main/ salary/ minimum- wage/ rwanda3 See "Minimum Wages in Tanzania with effect from 01-07-2013" at: http:// www. wageindicator. org/ main/
salary/ minimum- wage/ tanzania

70
ICTs, LDCs and the SDGs
4.2 How much data is enough?
Mobile Internet prices vary according to the volume of data included and the time over which it is consumed. There is little empirical research on how data use varies among countries and different groups of users. Better understanding of this issue could shed light on the impacts of volume/time-based prices for the development of digital businesses and the tipping point between using mobile broadband (which typically has data caps) and wired broadband.
A number of sector regulators in the LDCs collect data on usage of voice and text messaging, but none appear to publish statistics on data use, which is arguably at least as important as voice minutes and SMS. Mobile groups operating in several LDCs are starting to release data on mobile data usage. One caveat is that methodologies differ. It is often not clear whether mobile data usage refers to all mobile subscriptions, just mobile data subscriptions, or smartphone users. Nor is it clear whether it means just downloaded data or also includes uploads. Without exact definitions, it is problematic to compare different operators' figures on mobile data.
Mobile group MTN publishes mobile data per user per month statistics (Figure 4.9, left).121 The group operates across almost a dozen LDCs, so the statistics provide a partial insight into national data usage. Usage varies widely, from 361 MB/user/month in Sudan to just 54 MB/user/month in Guinea-Bissau. The average amount is just over 200 MB/user/month, significantly less than the 500 MB used in the ITU mobile broadband basket and five times less than the amount proposed by the Association for Affordable Internet (Box 4-3).
Box4-3:Redefiningaffordabilityandsettinganewtarget:“1for2”toachieveSDGTarget9.c
Achieving the global goal for universal, affordable Internet access by 2020 (SDG Target 9.c) means that we must work toward a more ambitious affordability target that will enable ac-cess for all income groups — not just the top few. Changing the way we define affordability has the power to enable more inclusive access and close the digital divide. For this reason, the Association for Affordable Internet (A4AI) proposes setting and working toward a new affordability target: 1 GB of mobile broadband data priced at 2per cent or less of average monthly income.
Source: http:// a4ai. org/ 1for2- affordability- target/
It is notable that comparing mobile broadband tariffs as a proportion of per capita income to data usage has a stronger link (R2=0.55) (Figure 4.9, right), than to Internet penetration, reinforcing the fact that affordability is a barrier, not to Internet take-up but rather to using it. Nevertheless, it is still not an extremely strong link, again suggesting that factors other than service price are at play in determining mobile data usage. For example, one factor is the availability of unlimited bundles. This is one reason why Sudan comes top in the ranking. In Sudan, “unlimited use” mobile bundles are available, with the price distinction being speed rather than the amount of data.122 Other net-work-related factors that explain differing data consumption include the spread of smartphones and coverage of mobile broadband networks.
121 MTN. 2016 Data sheets. https:// www. mtn. com/ en/ investors/ financial- reporting/ annual- results/ Pages/ default. aspx122 See "Mobile Internet" at: https:// www. mtn. sd/ home/ content/ mobile- internet

71
ICTs, LDCs and the SDGs
Figure4.9:MTN,Mobiledatausagepermonth(left)andrelationbetweenmobiledatausagepermonth and mobile broadband price basket
Note:MB:Megabyte.GNIreferstoGrossNationalIncome. Source: Adapted from MTN and ITU.
One relevant question is: how much data is enough? Some applications such as video consume a significant amount of data. If the videos are educational (e.g. teaching farmers about new crop tech-niques or online courses for students), the data usage has significant social and economic impacts. Even entertainment can be income-generating for LDCs. Senegalese DJs are earning revenues from digital advertising owing to their large online fan base.123 YouTube is estimated to account for 20 per cent of international bandwidth in that country124 and besides Deezer, is the only legal online music service in Senegal.125
Mobile operators in practically all LDCs offer numerous types of data bundles based on time and amount of data included to cater to a variety of different data consumption circumstances. Some users manage to get free or cheaper Internet, for example by locating a free Wi-Fi hot spot. Almost a quarter of mobile Internet users in Bangladesh use Wi-Fi (AFAI, 2016). Innovation hubs throughout the LDCs are packed with startups attracted by free Wi-Fi.126 Mobile operators are catering to users who need more data with various types of unlimited bundles. Smart in Cambodia offers a “night owl” package; between the hours of 1 am and 5 am, users can get 1 GB for US 10 cents.127 Telemor in Timor-Leste has a US$ 1 bundle offering unlimited access to the Internet for one day.128 Airtel in Rwanda has a daily student bundle that includes over eight times the data compared to the regular plan and includes unlimited access to WhatsApp.129
The quest for more data could help to boost wired broadband penetration in LDCs. Wired broad-band is typically priced by speed rather than data volume so there is a “sweet spot” at which wired
123 Hackel, Jessica. 2013. "Headlines in Rhyme: A Case Study on Le Journal Rappé as an Agent of Senegalese Sociopolitical Change". Independent Study Project (ISP) Collection. Paper 1682. http:// digitalcollections. sit. edu/ isp_ collection/ 1682
124 Charlotte Idrac, Patricia Blettery and Frédéric Charpentier. 2016. "Les jeunes Sénégalais à l'assaut de YouTube." RFI, 29 January. http:// www. rfi. fr/ afrique/ 20160113- senegal- youtube- videos- buzz- sandale- man
125 See "Legal Music Services" at: http:// www. pro- music. org/ legal- music- services- african- middle- east. php126 Jonathan Kalan. 2013. "African youth hungry for connectivity". Africa Renewal, May. http:// www. un. org/ africarenewal/
magazine/ may- 2013/ african- youth- hungry- connectivity127 See "LateNightOwl" at: https:// www. smart. com. kh/ services/ add- services/ latenightowl128 See "Internet 3G" at: http:// www. telemor. tl/ service- detail/ internet- 3g. html129 See "Data Plans" at: http:// africa. airtel. com/ wps/ wcm/ connect/ AfricaRevamp/ rwanda/ home/ personal/ internet/ 3G/
data- plans

72
ICTs, LDCs and the SDGs
would make sense particularly those with small home offices or SMEs. Bhutan Telecom provides both fixed and mobile broadband, and prices each by the amount of data consumed but with different volume caps. After 15 GB per month, wired broadband is cheaper (Figure 4.10, left). Bangladesh Telecommunication Company Limited (BTCL), which does not offer mobile services, prices wired broadband by speed with no data caps. Beyond 5 GB per month, wired broadband is a more attractive cost proposition (Figure 4.10, right).
Figure4.10:FixedandmobilepricesinBhutan(left)andBangladesh(right),US$,2017
Note:ConvertedtoUS$using2016annualaverageexchangerates.InBhutan,wiredspeedsarebasedonthefastestavailablefor where the subscribers resides. In Bangladesh, wired speeds are for the 1 Mbps ADSL package. Source: Adapted from Bhutan Telecom, BTCL and Grameenphone.
4.3 Zero-ratedservicesandOTT:Supplementsorartificialsweeteners?
Special pricing arrangements for mobile Internet applications could address affordability constraints in LDCs. Such arrangements might include:
1. Apps that are free for all to use but consume mobile data. This includes so-called “Over the Top” (OTT) applications such as Skype and WhatsApp that offer "free” voice, video and messaging but incur data usage charges.
2. Unlimited access to specific apps such as WhatsApp for a certain period (e.g., one hour, one day, one week, one month) at a set price.
3. Apps that are free to use and do not consume mobile data. These include so called "zero-rated services" such as Free Basics by Facebook and Wiki Zero.
These different situations pose thought-provoking questions as to whether they encourage new Internet users in LDCs and whether they favour some apps over others affecting net neutrality.
OTT applications are replacements for services that telecommunication operators have long been offering over telephone networks, such as voice calls and messaging. OTT services are popular be-cause they are free in the sense that there is no charge for their use, although customers will incur data usage charges. However, data usage charges are far lower than for similar services offered by a mobile operator (Figure 4.11 shows the example of Senegal.) Because of these radically lower costs, OTT seems particularly relevant for LDCs. On the other hand, access to these services alone will restrict users to very specific services and applications, and will not provide access to the open Internet and its benefits.

73
ICTs, LDCs and the SDGs
Figure4.11:OTTversusmobilenetworkinSenegal,2017
Note:ThechartsshowhowmanySkypeminutesandWhatAppmessagescanbesentfor20MBofdata(thecheapestbundleavailable)whichcostsFCFA100(US$0.17at2016annualaverageexchangerate).TheMobilefiguresrefertothepriceoftheequivalentamountofinternationalminutesandtextmessagessentusingamobileprepaidcalllingplan.Theinternationalmin-utes refer to Zone 1. Source: Adapted from Orange Senegal, https:// arstechnica. com/ gadgets/ 2010/ 07/ dont- worry- about- saving- minutes- with- skype- think- data- use/ and http:// triphackr. com/ how- whatsapp- can- save- you- money- traveling/ .
The impact of OTT on telecommunication operators comes from competing with traditional revenue sources such as voice calls and messaging. One challenge with understanding the impact of the OTT market is a lack of clear metrics. Nevertheless, there is considerable circumstantial evidence to suggest that the impact is significant. For example, a survey of Cambodian mobile users found that one-fifth used Facebook Messenger as a substitute for instant messaging. Twelve per cent used LINE, an app similar to WhatsApp, and a smaller percentage used a variety of other OTT apps (Figure 4.12, left). Another perspective on the use of OTTs is how much traffic they are generating. According to one report, WhatsApp, Skype and Viber accounted for around 10 per cent of upstream peak-time Internet traffic in Africa (home to 33 of the 47 LDCs) (Figure 4.12, right).130
The danger for LDCs is that, if carriers cannot offset the loss of revenues from OTT, there may be less money available for the future investment needed to handle rapid increases in data traffic.131 The West African telecommunication operator Sonatel estimates that between 2016 and 2020, its losses from OTT in the international segment will be FCFA 256 billion (US$ 432 million) in Senegal, FCFA 164 billion (US$ 277 million) in Mali, FCFA 78.5 billion (US$ 132 million) in Guinea and FCFA 11.7 billion (US$ 20 million) in Guinea-Bissau.132 It also estimates that taxes paid to the government and dividends for its shareholders will fall by FCFA 243 billion (US$ 410 million).
130 Sandvine. 2016. Global Internet Phenomena: Africa, Asia-Pacific and Middle East. https:// www. sandvine. com/ trends/ global- internet- phenomena/
131 The ITU has created a study group to examine this issue. See: http:// www. itu. int/ en/ ITU- T/ studygroups/ 2013- 2016/ 03/ Pages/ ott. aspx
132 Birago Diene Moctar Beye. 2015. "The impact of OTT on telecommunication services provided by operators in Senegal." http:// wholesalesolutions. orange. com/ content/ download/ 47961/ 1369504/ version/ 1/ file/ OTT+in+Senegal_ Birago+Beye. pdf

74
ICTs, LDCs and the SDGs
LDC telecom operators have developed several responses to OTT. Some may try to block OTT ser-vices, although this is contrary to the principle of net neutrality.133 Some have argued for regulating OTTs as telecommunication service operators. Others have accepted the inevitability of OTT and offer special unlimited bundles to certain OTT apps, so they at least are increasing their data us-age revenue. Another strategy is to bundle free calls or messages into mobile prepaid plans. Some, such as Grameenphone in Bangladesh, are developing their own OTT products (Box 4-4). Many are diversifying by seizing new opportunities in areas such as mobile money, cloud computing and the Internet of Things (IoT).
Box 4-4: Taking on OTT in Bangladesh
Grameenphone in Bangladesh launched WowBox in May 2015.1 It allows users who down-load the app free access without any data charges. WowBox also provides 20 MB free for users every week. Content offered includes news, games, sports, music, horoscopes, jokes and competitions. Users can also receive "tokens" (reward points) that can be used to pur-chase offers on the app. WowBox had 5 million users within 16 months of its launch and is the most downloaded application in Bangladesh. Interestingly, around a fifth of daily users also purchase a data bundle while within the app.2
1 Cisco. 2016. "Telenor Grameenphone WowBox". http:// www. cisco. com/ c/ en/ us/ solutions/ collateral/ service- provider/ vni- service- adoption- forecast/ case- study- telenor- grameenphone. pdf
2 Telenor. 2015. "WowBox reaches 1.5 million users." https:// www. telenor. com/ wowbox- reaches- 1- 5- million- users/
Zero-rated services aim to overcome affordability challenges by providing access to certain content without applying the user's data cap. Firms such as Facebook have worked with operators to provide access to their services, mainly in developing economies. Providers of zero-rated services argue that
133 The Dutch government ruled that operators could not charge users extra for using OTT services, block access to the service or throttle user speeds. See: "Net neutrality enshrined in Dutch law". The Guardian, 22 June 2011. https:// www. theguardian. com/ technology/ 2011/ jun/ 23/ netherlands- enshrines- net- neutrality- law
Figure 4.12: OTT in Cambodia and Africa
Source:AdaptedfromAsiaFoundationandSandvine.

75
ICTs, LDCs and the SDGs
users will eventually start paying for data services.134 One example is the Free Basics app135 that oper-ates on Android and offers access to Facebook as well as some other websites such as Accuweather and Bing and local sites for health and employment. Free Basics is available in 21 LDCs (Figure 4.13, left). Wikipedia has a similar arrangement with m-wikipedia, although take-up in LDCs is much lower, with the service available in seven of them (Figure 4.13, right).
Figure4.13:FacebookFreeBasicsandm.wikipedia,June2017
Source: Adapted from https:// info. internet. org/ en/ story/ where- weve- launched/ and https:// wikimediafoundation. org/ wiki/ Mobile_ partnerships.
In February 2016, the Telecom Regulatory Authority of India (TRAI) issued a regulation prohibiting the use of what it called discriminatory tariffs for data services. TRAI based its decision on "... the principles of Net Neutrality seeking to ensure that consumers get unhindered and non-discriminatory access to the internet. These Regulations intend to make data tariffs for access to the Internet to be content agnostic."136 Several other countries have also banned zero-rated services, including Chile, Peru, Israel, Brazil and Egypt. Zero-rated services also give an advantage to large companies to the detriment of local startups. As one report notes: "Ironically, if zero-rated services were available when large Internet companies were startups, it is unlikely they would have scaled to the size they are now."137
It is important to note that cost is not the only (or even, in many countries, the main) barrier to Internet access. Users often cite reasons such as the absence of need or lack of skills for not using the Internet, so it is not clear to what extent zero-rated services get new users online. As one report puts it: "Even with a zero-rated service, the user must still have a device and an active account with the operator that offers the zero-rated service. This raises the question of whether zero-rated services can bring people online who had not previously used the Internet" (A4AI, 2016). The report looked at the impact of mobile data apps across eight developing countries and found that 88 per cent of users had already accessed the Internet before using a zero-rated plan. It also noted that the plans enable
134 "Once people understand the internet and are engaged, we help our partners sustain these new users—over 50per cent of people who use Internet.org pay for data and access the broader internet within 30 days." See "Mobile Operator Partnership Program" at: https:// info. internet. org/ en/ story/ mobile- operator- partnership- program/
135 Josh Constine. 2016. "Facebook has connected 40M people with Internet.org".TechCrunch, 2 November. https:// techcrunch. com/ 2016/ 11/ 02/ omnipresent/
136 "TRAI releases the Prohibition of Discriminatory Tariffs for Data Services Regulations, 2016". Press Release, 8 February 2016. http:// www. trai. gov. in/ notifications/ press- release/ trai- releases- prohibition- discriminatory- tariffs- data- services
137 ITU. 2016. A review of Micro, Small and Medium Enterprises in the ICT Sector. http:// www. itu. int/ en/ mediacentre/ Pages/ 2016- PR48. aspx

76
ICTs, LDCs and the SDGs
most users to remain online rather than get online for the first time. This seems to be confirmed by users in Angola who have been getting around the walled garden of zero-rated services by planting hidden videos and music in Wikipedia articles that can be shared with others (Box 4-5).
Box 4-5: Hijacking zero-rated services in Angola
Wikipedia and Facebook have given Angolans free access to their websites, but not to the rest of the Internet. Angolans have started hiding pirated movies and music in Wikipedia articles and linking to them on closed Facebook groups, creating a free and clandestine file-sharing network in a country where mobile Internet data is extremely expensive.
Source:Koebler,Jason.2016.“Angola’sWikipediaPiratesAreExposingtheProblemsWithDigi-tal Colonialism.” Vice Motherboard. March 23. https:// motherboard. vice. com/ en_ us/ article/ nz7eyg/ wikipedia- zero- facebook- free- basics- angola- pirates- zero- rating.
4.4 Competitionandpricing
The strongest influence on mobile Internet prices is competition. The existence of a competitive mobile market is fundamental, as is the intensity of competition. Regulatory steps to create a more competitive mobile market will align prices more closely with costs and enhance affordability.
Comoros is another good and recent example of the impact of competition on mobile broadband pricing. Mobile services had been a monopoly of Comoros Telecom until late 2016, when Telma, an operator from Madagascar, launched operations as the second mobile operator. This resulted in Comoros Telecom dropping its price 30 per cent from the pre-competition period (Figure 4.14, left). While affordability improved in Comoros, the availability of a diversity of data bundles to cater to dif-ferent data requirements lags behind other more intensely competitive markets. For example, Telemor in Timor-Leste operates in a three-operator market and has 18 different data bundles, compared to the eight offered by Telma Comoros in a duopoly market (Figure 4.14, right).
Figure4.14:Impactofcompetitiononmobilebroadbandpricesandbundles
Source: Adapted from Comoros Telecom, Telma Comoros and Telemor.

77
ICTs, LDCs and the SDGs
The Association for Affordable Internet (A4AI) publishes an Affordability Drivers Index (ADI) for various countries based on factors including the policy and regulatory environment that helps to make the Internet more affordable.138 Eighteen LDCs are included in the index (Figure 4.15). The top-ranked is Rwanda, reflecting an enlightened policy and regulatory environment. However, the scores do not always reflect low prices. For example, Cambodia has the cheapest mobile broadband prices in the group but only ranks twelfth among LDCs in ADI terms. While Cambodia may not fulfil all requirements for an ideal regulatory environment, it has one of the most competitive markets in the LDC group, with six operators. On the other hand, Uganda is ranked third in the ADI but a 500 MB monthly bundle costs over ten per cent of average per capita income (see Box 4-6). It should also be noted that some of the indicators in the ADI are based on perception surveys, which appear to differ from the actual reality on the ground. A textbook regulatory environment also costs money and is typically funded by operators through various taxes, contributions and fees, which are passed on to consumers. The case of Mozambique offers insights into A4AI's policy considerations (Box 4-7).
Figure4.15:2017AffordabilityDriversIndex(ADI)
Source: Adapted from A4AI and ITU.
138 A4AI. 2017. Affordability Report. http:// a4ai. org/ affordability- report/ report/ 2017

78
ICTs, LDCs and the SDGs
Box4-6:Tickingalltherightregulatoryboxesbutstillrelativelyhighprices:ThecaseofUganda
Uganda has one of the most competitive mobile markets in Africa, with eight operators. However, this has not translated into low prices. In 2016, a monthly price for a 500 MB mobile broadband bundle was double the ITU Broadband Commission’s target of 5 per cent of per capita Gross National Income (GNI).
One reason is that, although there are many operators, the market is highly concentrated around three operators which account for over 90 per cent of subscriptions. Of the eight operators, none has yet to achieve full 2G coverage. And although 4G has been launched, coverage is limited. Even 3G coverage is relatively low, with MTN, the market leader, re-porting that its 3G signal reached only a quarter of the population in 2016, compared to 92 per cent in neighbouring Rwanda.1 The low mobile broadband coverage limits the potential demand, which influences prices.
As a land-locked country, Uganda depends on Kenya and Tanzania for access to submarine cables, and it could be argued that this increases overall network prices. However, Rwanda is also land-locked but its mobile broadband price is less than half that of Uganda’s. The major difference between Rwanda and Uganda is geography. Rwanda has a smaller land area, is more urban and has a higher population density compared to Uganda, all of which make it easier to extend mobile broadband coverage. Another factor adding to higher mobile broadband prices in Uganda is a sector-specific service tax of 9 per cent. When combined with VAT, this adds 27 per cent to the cost of Internet access over a mobile network.
In an effort to improve access to underserved communities, Uganda has developed a uni-versal access policy supported by a Rural Communications Development Fund (RCDF). The next phase of RCDF is expected to extend the fibre-optic backbone network in underserved areas and lower data costs on the national fibre-optic backbone. With additional high-speed backhaul infrastructure in place, it should become cheaper to extend mobile broadband coverage into more rural zones. This in turn should increase demand, resulting in lower mobile broadband prices.
1 Figure for Uganda from MTN Group Limited. 2017. Integrated report for the year ended 31 December 2016. Figure for Rwanda from RURA. 2017. Statistics and Tariff Information in Telecom, Media and Postal Service as of the Fourth Quarter 2016.

79
ICTs, LDCs and the SDGs
Box4-7:GaugingpolicesaffectingInternetaffordabilityinMozambique
The Association for Affordable Internet (A4AI) carried out a 2017 review on the status of five key policies affecting Internet pricing in Mozambique.
Policy and regulation for competition
Mozambique has previously relied on a service and technology-based licensing regime. However, a new telecommunications law, published in June 2016, acknowledges the con-vergence of technologies and calls for a technology-neutral and simplified licensing regime based on the regulation of scarce resources.
Broadband policy
Mozambique’s broadband strategy does not include targets or time-bound interventions for reducing broadband costs or increasing penetration, and has not been updated since it was introduced in 2006. The Ministry of Transport and Communications has publicly referred to a revised national strategy for broadband, but this document remains under development.
Since 2007, Mozambique has operated a universal service fund (USAF), funded by opera-tor contributions of 1 per cent of the preceding year’s gross revenue, for the purpose of implementing projects to expand Internet access and promote digital skills and content development. These projects are intended to prioritize underserved areas, but details of the publicly supported projects and their impact are not publicly available. Device costs remain a significant barrier to access in Mozambique, and the USAF needs to consider ways of subsidizing access to devices as one option for supporting access and use. Mozambique’s new telecommunications law updates provisions for universal service, which will allow for improved efforts to support community telecentres and other public access solutions.
Infrastructure sharing
The 2016 telecommunications law stipulates the need for updated infrastructure sharing regulations to cover rights of way facilitation and incentives for sharing, among other mea-sures. In collaboration with the A4AI-Mozambique Coalition, the INCM (the sector regula-tor) has developed and is finalizing new proposed infrastructure sharing regulations which should be approved in 2017.
Spectrum policy
Mozambique has been delayed in implementing its plans for digital migration, after which more frequencies will become available for mobile broadband use across the country. Despite this delay and the failed attempt with the Digital Dividend spectrum auction (800 MHz), the Mozambique market is, comparatively speaking, in a better situation. Unlike other markets, there is no spectrum crisis and if needed, the unsold Digital Dividend spectrum could be sold at a reasonable price in line with market expectations.
Source:AssociationforAffordableInternetAccess.Mozambique Affordability Report Highlights 2017.
80
ICTs, LDCs and the SDGs
4.5 Conclusions
LDCs need to distinguish between the impact of affordability in terms of getting people online and its impact in terms of the amount of data they can consume. Data from some countries suggest that affordability is not the key obstacle to getting people online for the first time, and barriers are instead often related to a lack of awareness and skills. Affordability has a bigger impact on the amount of data people already online can consume. A more competitive mobile Internet market is the main way to lower prices via regulatory actions such as infrastructure sharing, open and cost-based access to wholesale facilities, liberal spectrum policy, and promotion of IXPs. These actions will lead to falling prices and a variety of bundles to suit different economic circumstances. Taxes and other sector-spe-cific charges need to be examined for their impact on affordability.139 Public Internet facilities located in schools, libraries and community centres also help to make the Internet affordable or even free. There are also coping strategies than can help poor households in LDCs with affordability challenges (Box 4-8). Policy regarding OTT and zero-rated services needs to be considered against the backdrop of net neutrality. One consideration for local content is zero-rated access to all domestic websites. This would also help the development of local content, which can attract more people to use the Internet.
Box4-8:MobileaffordabilityinHaiti
Various coping strategies can help the poor with the cost of mobile services and mobile platforms can also facilitate this. One common strategy is the reuse of handsets through distribution to relatives. The cost of a cellphone is a barrier in Haiti. A survey found that 80 per cent of non-subscribers cited affordability as the top reason for not having mobile services. Of those, 69 per cent said that the main reason was the cost of the handset, while for 11 per cent it was the service cost.1 One method of overcoming this problem is to sub-sidize handsets. When Digicel entered the mobile market in 2006, it subsidized handsets at half their cost.2
1 Barberousse, Guillaume et. al. 2009. "Les impacts économiques et sociaux de la téléphonie mobile: étude de cas en Haiti." Secteur Prive &Developpement. http:// www. madamicrofinance. mg/ cnmf/ data/ Numero- 4- Revue- SPD- La- telephonie- mobile- dans- les- pays- en- developpement- quels- impacts- economiques- et- sociaux. pdf
2 BearingPoint. 2012. "Impact Study of the Arrival of a New Mobile Phone Operator in Haiti". Digiworld Economic Journal. http:// repec. idate. org/ RePEc/ idt/ journl/ CS8608/ CS86_ HUET_ et_ al. pdf
139 GSMA. 2017. Taxing Mobile Connectivity in Sub-Saharan Africa: A Review of Mobile Sector Taxation and Its Impact on Digital Inclusion. https:// www. gsma. com/ mobilefordevelopment/ programme/ connected- society/ taxing- mobile- connectivity- sub- saharan- africa- review- mobile- sector- taxation- impact- digital- inclusion
81
ICTs, LDCs and the SDGs
Box4-8:MobileaffordabilityinHaiti(cont.)
Another way of dealing with affordability is mobile money. Humanitarian organizations were desperate to assist poverty stricken Haitians especially after a devastating earthquake in 2010. A US$ 10 million prize offered by the Bill and Melinda Gates Foundation and USAID expedited the launch of mobile money in the country.1 It led to the deployment of mobile money services later that year, creating a cheaper and safer option for distributing cash to poor families. Today, Haiti accounts for 40 per cent of the world’s cash deployment pro-grammes that use mobile money platforms.2 One aid organization used to distribute printed food vouchers but since the introduction of mobile money has been providing an inexpensive handset loaded with US$ 40 worth of cash.3 Remittances sent by family members and mobile airtime cash transfers help the country’s poor. Text messaging was leveraged to generate US$ 40 million for those affected by the earthquake.4 The use of electronic vouchers for purchasing airtime has lowered affordability barriers by enabling operators to offer low-de-nomination recharges. Users can purchase 50 MB of Internet for 9 HTG (14 US cents).
Despite these initiatives, affordability barriers continue to be a challenge for rural house-holds, almost one-third of which did not have a mobile phone in 2012, compared to less than one in ten in urban areas.5 Access is not a key issue, as only 5 per cent of the population is not covered by a mobile service.
1 USAID. 2010. Gates Foundation and USAID Announce Innovative Fund to Incentivize Mobile Money Services in Haiti. Press Release, 8 June. https:// www. usaid. gov/ news- information/ press- releases/ gates- foundation- and- usaid- announce- innovative- fund- incentivize
2 See "Haiti Mobile Money" at: https:// www. gsma. com/ mobilefordevelopment/ wp- content/ uploads/ 2012/ 05/ Haiti- Mobile- Money. pdf
3 Jason Beaubien. 2011. "In Haiti, Cellphones Serve As Debit Cards." NPR, 30 January. http:// www. npr. org/ 2011/ 01/ 30/ 133305663/ in- haiti- cell- phones- serve- as- debit- cards
4 James Eberhard. 2010. "How mGive Used Texting to Raise $40 Million for Haiti." CBS News, 15 April.http:// www. cbsnews. com/ news/ how- mgive- used- texting- to- raise- 40- million- for- haiti/
5 Cayemittes et al. 2013. Enquête Mortalité, Morbidité et Utilisation des Services, Haïti, 2012. https:// dhsprogram. com/ pubs/ pdf/ FR273/ FR273. pdf
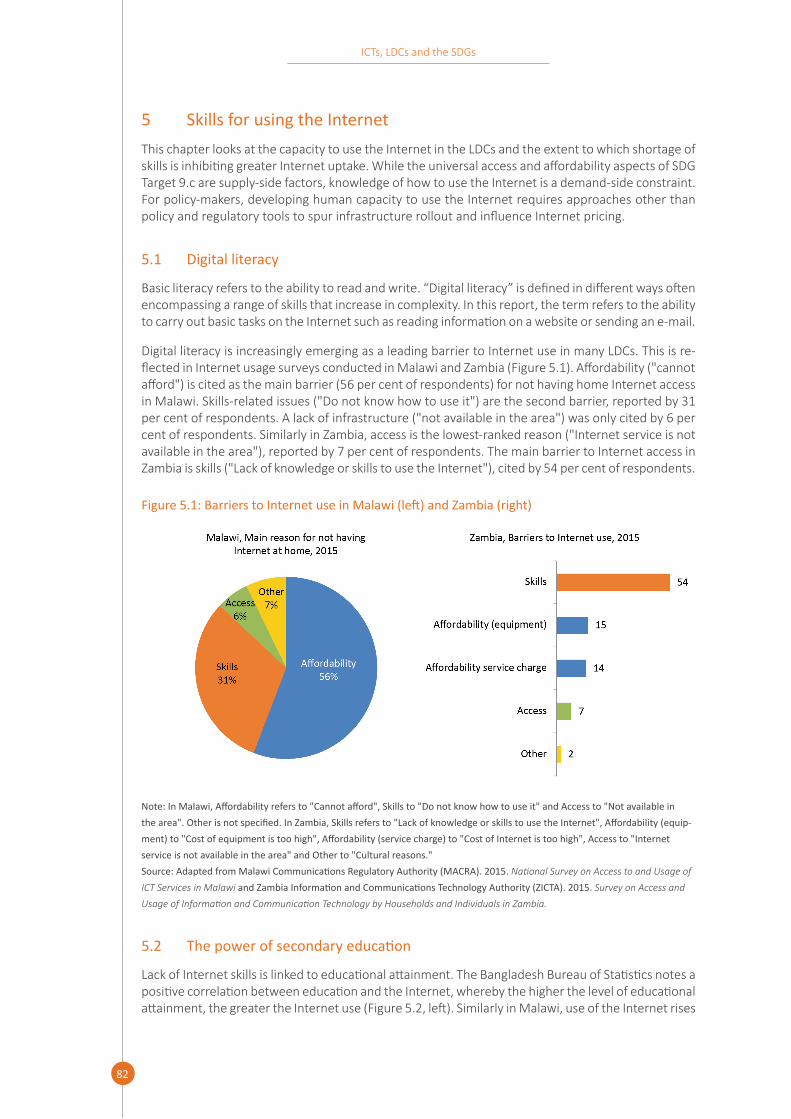
82
ICTs, LDCs and the SDGs
5 Skills for using the InternetThis chapter looks at the capacity to use the Internet in the LDCs and the extent to which shortage of skills is inhibiting greater Internet uptake. While the universal access and affordability aspects of SDG Target 9.c are supply-side factors, knowledge of how to use the Internet is a demand-side constraint. For policy-makers, developing human capacity to use the Internet requires approaches other than policy and regulatory tools to spur infrastructure rollout and influence Internet pricing.
5.1 Digital literacy
Basic literacy refers to the ability to read and write. “Digital literacy” is defined in different ways often encompassing a range of skills that increase in complexity. In this report, the term refers to the ability to carry out basic tasks on the Internet such as reading information on a website or sending an e-mail.
Digital literacy is increasingly emerging as a leading barrier to Internet use in many LDCs. This is re-flected in Internet usage surveys conducted in Malawi and Zambia (Figure 5.1). Affordability ("cannot afford") is cited as the main barrier (56 per cent of respondents) for not having home Internet access in Malawi. Skills-related issues ("Do not know how to use it") are the second barrier, reported by 31 per cent of respondents. A lack of infrastructure ("not available in the area") was only cited by 6 per cent of respondents. Similarly in Zambia, access is the lowest-ranked reason ("Internet service is not available in the area"), reported by 7 per cent of respondents. The main barrier to Internet access in Zambia is skills ("Lack of knowledge or skills to use the Internet"), cited by 54 per cent of respondents.
Figure5.1:BarrierstoInternetuseinMalawi(left)andZambia(right)
Note:InMalawi,Affordabilityrefersto"Cannotafford",Skillsto"Donotknowhowtouseit"andAccessto"Notavailableinthearea".Otherisnotspecified.InZambia,Skillsrefersto"LackofknowledgeorskillstousetheInternet",Affordability(equip-ment)to"Costofequipmentistoohigh",Affordability(servicecharge)to"CostofInternetistoohigh",Accessto"Internetserviceisnotavailableinthearea"andOtherto"Culturalreasons." Source:AdaptedfromMalawiCommunicationsRegulatoryAuthority(MACRA).2015.National Survey on Access to and Usage of ICT Services in MalawiandZambiaInformationandCommunicationsTechnologyAuthority(ZICTA).2015.Survey on Access and Usage of Information and Communication Technology by Households and Individuals in Zambia.
5.2 Thepowerofsecondaryeducation
Lack of Internet skills is linked to educational attainment. The Bangladesh Bureau of Statistics notes a positive correlation between education and the Internet, whereby the higher the level of educational attainment, the greater the Internet use (Figure 5.2, left). Similarly in Malawi, use of the Internet rises

83
ICTs, LDCs and the SDGs
sharply in line with educational attainment (Figure 5.2, right). Significantly, the national average for Internet use in both countries is exceeded only once users have at least an upper secondary education. The roughly similar levels of Internet use in Bangladesh and Malawi for those with higher secondary and tertiary education is notable. The same observation has also been made for other developing countries and for developed countries, and ITU research shows that “the level of education is one of the most important indicators of whether or not people are Internet users” (ITU, 2016). Apart from the fact that people are get better educated as they move up the education ladder and thus better able to use the Internet, higher-level education facilities are more likely to have access to the Internet than at lower levels. Tasks at higher levels of education are also more linked to the use of ICTs (e.g., more research, etc.) than in lower levels.
Figure5.2:InternetuseandlevelofeducationinBangladesh(left)andMalawi(right)
Source:AdaptedfromBangladeshBureauofStatistics(BBS).2015.ICT Use and Access by Individuals and Households Bangladesh 2013andMalawiCommunicationsRegulatoryAuthority(MACRA).2015.National Survey on Access to and Usage of ICT Services in Malawi.
Data from UNICEF Multiple Indicator Cluster Surveys (MICS)140 reinforce the finding that Internet use is strongly linked to education levels. The data further illustrate that education is a more significant factor in Internet use than age. For example, UNICEF data for Lao PDR show that there is significant jump in Internet use among those aged 15-24 years once upper secondary education is attainted (Figure 5.3, left). The Lao PDR data also show that as educational attainment grows, the gap between female and male Internet use narrows. For example, once an upper secondary education is reached, the difference in the relative proportions of Internet users between men and women drops to 1.1. However, surveys for other LDCs suggest that Lao PDR is an exception, with quite pronounced differ-ences in Internet use between genders (Figure 5.3, right). This is most likely because those countries with the greatest gender gap also have the greatest gender education gap (men have better and/or higher education). More efforts need to be devoted to eliminating this gender digital divide and ensure that the universality aspect of SDG Target 9.c is achieved.
There is little doubt that Internet use is strongly linked to education. As the examples from Malawi and Zambia show, a lack of Internet skills is a leading reason why people do not use it. Internet sur-veys from Bangladesh and Malawi show that Internet use rises with educational attainment. This is confirmed by surveys on youth Internet use, which suggest that educational attainment is a bigger factor in explaining Internet use than age itself.
The strong link between education and Internet use should be supported by a statistical relationship. One challenge is to select an appropriate unit of analysis, as there are a variety of indicators related
140 http:// mics. unicef. org/ surveys

84
ICTs, LDCs and the SDGs
to education such as literacy, levels of school attainment, years of schooling and secondary school enrolment. Each of these has been plotted to determine which has the closest relationship to Internet use in the LDCs (Figure 5.4). The results show that secondary school enrolment has by far the highest explanatory power for Internet use.
Given the relationship between secondary education and Internet use, enrolment needs to be en-couraged. Although gross secondary enrolment in the LDCs has been growing, in 2015 it stood at just 48 per cent, well below the world average of 76 per cent (Figure 5.5). Sao Tome and Principe is one of just four LDCs where secondary gross enrolment exceeds the world average (the others are Bhutan, Timor-Leste and Tuvalu). Sao Tome and Principe provides an example of rapidly leap-frogging secondary education enrolment to above world levels. The Government developed a plan outlining strategies for the education sector with the objective of providing 12 years of free education for all children. It had already achieved universal primary enrolment, with a significant number of children going on to secondary schools. This is manifested by an increase of almost 50 percentage points in gross secondary education enrolment between 2003 and 2016. This increase was stimulated by government prioritization of the education sector, establishing the preconditions through an increase in resources: the proportion of public expenditure for education increased from 2.7 per cent of GDP in 2002 to 8.8 per cent by 2010.141 There has been ongoing computerization of secondary schools through corporate social responsibility programmes and investment from proceeds of a telecommu-nication licence award. Today almost all secondary schools have broadband Internet access. Sao Tome and Principe has the second highest Internet penetration among youth compared to other African countries for which similar data are available, and the country has the best gender parity in youth Internet use and the highest Internet user penetration among African LDCs.
Digital literacy has a strong link to SDG Goal 4: "Ensure inclusive and equitable quality education and promote lifelong learning opportunities for all"142 SDG 4 has a number of targets that are essential for enhancing Internet use, such as ensuring free secondary education by 2030 and relevant tracking indicators such as the proportion of young people and adults with information and communications technology (ICT) skills and the proportion of schools with Internet access. This suggests that there
141 World Bank. 2013. Sao Tome and Principe - Second Phase of Quality Education for All Project. Washington DC: World Bank. http:// documents. worldbank. org/ curated/ en/ 479301468304184173/ Sao- Tome- and- Principe- Second- Phase- of- Quality- Education- for- All- Project
142 http:// www. un. org/ sustainabledevelopment/ education/
Figure5.3:Internetuse,ages15-24formenandwomeninLaoPDR(left),andinselectedecon-omies (right)
Source:AdaptedfromUNICEFMultipleIndicatorClusterSurveys(MICS).

85
ICTs, LDCs and the SDGs
Figure5.4:RelationbetweeneducationindicatorsandInternetuse,LDCs
Note:Internetuseisshownontheyaxis.Dataisthemostrecentavailable.ForcountrydataseeAnnex1,SkillsIndicators,2016. Source: Adapted from ITU and UNDP.
Figure5.5:SecondaryGrossEnrolmentRatio
Source:UNESCOInstituteofStatistics.

86
ICTs, LDCs and the SDGs
is scope for fruitful collaboration between policy-makers in the ICT and education sectors to work closely and leverage mutual resources to improve digital skills.
5.3 Digital literacy for the masses
Data from Rwanda illustrate how supply- and demand-side factors can be combined to identify con-straints in Internet use (Figure 5.6, left). By early 2017, 92 per cent of the population was covered by the latest 3G mobile broadband technologies, so access is not a significant barrier.143 In terms of affordability, Rwanda boasts the eighth cheapest mobile Internet among LDCs, at US$ 2.54 for 500 MB per month according to the ITU basket. Although absolute prices are extremely low, incomes in the country are also low. Assuming that people would only be willing to pay less than 5 per cent per month of their total consumption expenditure for Internet access, Internet would be affordable for only 32 per cent of Rwandan households.144 In 2014, however, take-up of the Internet (including through mobile phones) among Rwandan households was only 9 per cent, or 23 percentage points lower than for households that could actually afford it, and Internet penetration in the country re-mains low.145 This is closely tied to the computer literacy rate in the country, which in 2014 was 8.4 per cent of the population aged 15 years and older.146
The Government of Rwanda recognizes that lack of digital literacy is a major obstacle to its aspiration to become a “Smart Nation”. In early 2017, it launched the Digital Ambassador Program (DAP), which will train 5 000 young people and post them to all the country’s 30 districts in order to provide digital skills training for 5 million Rwandans over a four-year period.147 The DAP is a partnership between the Ministry of ICT, the Canadian NGO Digital Opportunity Trust (DOT)148 and the World Economic Forum’s Internet for All initiative.149 DAP would require each trainer to teach 250 people a year, which seems realistic in the light of current experience.150 If successful, it will dramatically boost Rwanda's digital literacy to 85 per cent of the population (Figure 5.6, right) and give Internet penetration in the country a strong boost.
Another approach to digital literacy is through training at public Internet facilities, particularly in South Asian LDCs. Bangladesh has deployed the Union Information Service Centers (UISC) in all 4 498 of its Unions, the country's lowest administrative division. Inaugurated in November 2010 and operated by a team of two entrepreneurs including at least one woman, the UISC offers Internet access, training and other services such as mobile recharges. By 2011, some 3 million people, mainly in rural areas, were making use of the UISCs.151 Bhutan has deployed around 200 community centres throughout the country offering free Internet access and training.
Many LDCs have adopted ICT strategies in which human capacity development is a key objective. In order to achieve this, at least some resources should be devoted to increasing school enrolment.
143 Narrowband 2G networks, which can be used to access the Internet using GPRS and EDGE technologies, covered 99.9per cent of the Rwandan population in March 2017 while 3.5G mobile networks covered 93.1per cent and 4G/LTE networks covered 64%. See Rwanda Utilities Regulatory Authority (RURA). 2017. Statistics and Tariff Information in Telecom, Media and Postal Service as of the First Quarter 2017.
144 This is a speculative assumption, since as discussed earlier service charges are more of a barrier to usage than initial Internet use. MTN Rwanda offers 15 different daily, weekly and monthly Internet bundles including a daily 50 MB package for Rwf 200 (US ¢ 2.4).
145 See National Institute of Statistics of Rwanda. "Main indicators report - Results of EICV 4."146 Ibid.147 Wong, Alex. 2017. “Rwanda’s Digital Ambassadors Are Boosting Computer Literacy.” World Economic Forum Global
Agenda, February 24. https:// www. weforum. org/ agenda/ 2017/ 02/ rwandas- digital- ambassadors- are- boosting- computer- literacy/
148 https:// www. dotrust. org149 https:// www. weforum. org/ projects/ internet- for- all150 Similar experiences in the country show a computer skills trainer reaching 400 people in 10 months. See: Bigabo, Patrick.
2017. “5 Million Rwandans to Get Internet Skills Under Digital Program.” KT Press, February 21. http:// ktpress. rw/ 2017/ 02/ 5- million- rwandans- to- get- internet- skills- under- digital- program/
151 "Going Digital in Bangladesh." ictDATA.org, October 2011. http:// www. ictdata. org/ 2011/ 10/ going- digital- in- bangladesh. html

87
ICTs, LDCs and the SDGs
Furthermore, a number of LDCs have universal service funds whose disbursement is often linked to goals such as training. Such funding can be deployed for boosting secondary school connectivity, as is the case in Uganda (Box 5-1). Corporate social responsibility initiatives of telecommunication oper-ators are another possibility. Such initiatives have funded projects connecting schools to the Internet in Cambodia and Sao Tome and Principe. Another example is that of IT firms such as Google, which has pledged to provide digital skills training for 1 million young people in Africa.152 Computer training should also be incorporated into the secondary school curriculum.
152 Google. 2016. "A growth engine for Africa: Training 1 million young people in digital skills." Africa Blog, 12 April. https:// africa. googleblog. com/ 2016/ 04/ a- growth- engine- for- africa- training- 1. html
Figure5.6:RwandaInternetsupplyanddemand(left)andproportionofpopulationthatisdigitallyliterate and projected to be computer literate (right)
Note:Intheleftchart,coveragerefersto3G+coverage,affordabilityreferstotheproportionofpopulationwhereamonthlymobile broadband package is less than 5 per cent of per capita income and use refers to Rwandan households with the Inter-net.Intherightchart,thesolidlineshowsexistingcomputerliteracyandprojectedlevelatcurrentgrowthrate;thedottedlineshows the projected impact on computer literacy from the Digital Ambassador Program (DAP). Source:AdaptedfromRURA,RwandaInstituteofStatisticsandMTN.

88
ICTs, LDCs and the SDGs
Box5-1:UseofuniversalservicefundsforschoolconnectivityinUganda
Uganda’s Rural Communications Development Fund (RCDF) was established in 2003 and is administered by the country's sector regulator, the Uganda Communications Commission (UCC). The RCDF is funded by a 2 per cent levy on telecom operator revenue as well as contributions from other sources. One of the RCDF's flagship programmes is the Integration of ICT into Education, part of its mandate to increase ICT access and literacy in the country. At the RCDF's inception, no government secondary school had a computer laboratory and as a result, computer studies were not available as a subject. By 2015, 1 067 government secondary schools had a computer lab, or 92 per cent of the total. At least two teachers from each school have been provided with training. In addition, computer studies at the advanced level was made a compulsory subject and more than 18 000 students sat the exam in 2013.1 Computer labs are also made available during school holidays for the local community to teach digital skills.2 The programme is aimed at those who will work in ICT facilities or operate ICT facilities as a business venture. By June 2014, sessions had taken place in 194 schools reaching 49 000 people.
Box Figure 5-1: ICT Labs in Ugandan secondary schools
Source:AdaptedfromUCC,"10YearsofRCDF."
1 http:// ucc. co. ug/ files/ downloads/ 10%20 YEARS%20 OF%20 RCDF. pdf2 http:// connectaschool. org/ itu- module/ 21/ 576/ en/ schools/ connectivity/ reg/ 4. 1/

89
ICTs, LDCs and the SDGs
Box 5-2: With smartphones does local content become more important than digital liter-acy?
Many emerging markets are “mobile first” countries, meaning that the majority of users experienced Internet for the first time on their smartphones, discovering new use cases on their devices such as video streaming, music and video downloads, and of course, so-cial media. That means what worked for the early adopters in developed nations cannot necessarily be applied to later adopters in the developing world. For example, even though LDCs have seen unprecedented growth in mobile phone penetration in recent years, user engagement remains low. Many observers report that this is largely due to low rates of dig-ital literacy and lack of local content. This may serve as an indication that the dynamics of the next billion users will be very different from the last. Users in the developing world are relying more heavily on voice, images and videos in lieu of text, suggesting a new mode of communication and interaction is surfacing online – which is why localization and relevant content will become crucial for companies to succeed in emerging markets.
Source:"Buildingappsfor‘thenextbillion’mobileInternetusers."ITU News,8September2017.http:// news. itu. int/ building- apps- for- the- next- billion- mobile- phone- users/ #. WbKYsvD-__ 0. linkedin
5.4 Conclusions
A lack of skills and digital literacy are increasingly emerging as a leading barrier to Internet use in many LDCs. Digital literacy in the LDCs can be boosted through two main channels: i) increased school enrolment; and ii) targeted programmes for those out of school. Special consideration must be given to the gender digital divide to ensure that women and girls are not left behind. Raising upper secondary school enrolment remains a challenge for many LDCs owing to a lack of resources such as teachers and facilities. There are also demand-side issues, including the need for children to work to the detriment of school attendance, high school fees and travel costs. However, given the direct link between upper secondary enrolment and Internet use and the overall socio-economic benefits it promises, school enrolment must remain a top priority and additional resources should be made available. Here, synergies with SDG Goal 4 on education can be pursued.
The second and much larger group in need of digital literacy is that of the “out of school” or those who have never attended school. Rwanda is an example, with its DAP initiative to train 5 million people over four years. Uganda illustrates how school computer labs can be exploited during school holidays to train the local community. Another option is to leverage Technical and Vocational Education and Training (TVET) facilities, community centres and libraries, to provide formal, non-formal and informal computer learning opportunities.

90
ICTs, LDCs and the SDGs
6 Progress towards achieving SDG Target 9.cThis chapter reviews the level of progress made by the Least Developed Countries (LDCs) towards achieving Sustainable Development Goal (SDG) Target 9.c, “to provide universal and affordable access to the Internet”, and forecasts where LDCs will stand with regard to the deadline of 2020. Achieving this target is dependent on infrastructure and affordability but will also require the development of human skills. The chapter reviews how imbalances among these three factors can affect Internet ac-cess and take-up. It highlights the fact that, given that the deadline for achieving the target is in about three years’ time, there is a need to speed up the process. The progress of individual LDCs in reaching SDG Target 9.c is categorized into different levels. LDCs that have been successful in rapidly improving network infrastructure, pricing and skills are highlighted, including the policies that influenced this. The chapter concludes with recommendations for accelerating progress to achieve SDG Target 9.c.
Many LDCs have made rapid progress towards achieving universal and affordable access to the Internet, as measured by mobile population coverage and the price of a monthly mobile Internet package of at least 500 MB. Seven LDCs (Bangladesh, Benin, Cambodia, Comoros, Guinea, Myanmar and Rwanda) have achieved ubiquitous narrowband access to the Internet through universal popula-tion coverage (i.e., 99 per cent) of 2G mobile networks. Another 23 LDCs have reached a high level of narrowband Internet access, with population coverage of between 90 and 98 per cent. A dozen LDCs exceed the world average153 for population coverage of 3G mobile broadband networks. Twenty-six LDCs have commercially launched 4G/LTE networks and two exceed the world average for mobile LTE population coverage (Lesotho and Rwanda).
Eleven LDCs have mobile broadband tariffs meeting the Broadband Commission target (less than 5 per cent of monthly GNI per capita), compared to just three in 2013. A growing number of LDCs have flexible mobile Internet plans catering to hourly, daily, weekend and weekly use, enhancing afford-ability for those who do not use the Internet every day.
If recent growth rates hold, the LDCs will be on track to reach averages of 97 per cent mobile broad-band population coverage (Figure 6.1, top left) and Internet prices of less than 5 per cent of monthly GNI per capita (Figure 6.1, top right) by the target date of 2020. This masks huge differences among the LDCs, but does reflect the fact that some of them will have largely met the universality and afford-ability criteria by 2020. However, prospects for widespread use of the Internet by 2020 are poor. At current growth, less than a quarter of the LDCs’ population will be online (Figure 6.1, bottom right). A key reason for this is that growth in the ability to use the Internet will not match that of coverage and affordability. As noted in Chapter 5, secondary school enrolment is more closely correlated to Internet use than other educational indicators. It is forecast that gross secondary education enrol-ment (the number of students enrolled in secondary education as a percentage of the total official secondary school-age population) will be only two percentage points higher in 2020 than it was in 2016 (Figure 6.1, bottom left).
Achievement decreases as we move from coverage, through affordability, to skills (Figure 6.2, left). Average narrowband mobile coverage (i.e., 2G) stood at 88 per cent in 2016, which means that 12 per cent of the population in LDCs still had no access to the Internet at all. A total of 29 LDCs have 2G coverage of at least 90 per cent. Affordability remains a barrier to those who have coverage but cannot afford access to the Internet or cannot afford to use it as much as they would like. Eleven LDCs have mobile Internet prices of less than 5 per cent of average income. The biggest gap is with skills: only three LDCs have a gross secondary school enrolment higher than the world average. Turning to the impacts of each driver on Internet use (Figure 6.2, right), a statistical analysis of the LDCs finds that access has the smallest impact on raising Internet use. Each 10 percentage point (p.p.) increase in population coverage raises Internet use by just 0.6 p.p. On the other hand, a 10 p.p. improvement in affordability raises Internet use by 1.3 p.p. The biggest impact is with secondary school enrolment, where each 10 p.p. increase raises Internet use by 4.2 p.p.
153 https:// www. ericsson. com/ assets/ local/ mobility- report/ documents/ 2017/ ericsson- mobility- report- june- 2017. pdf
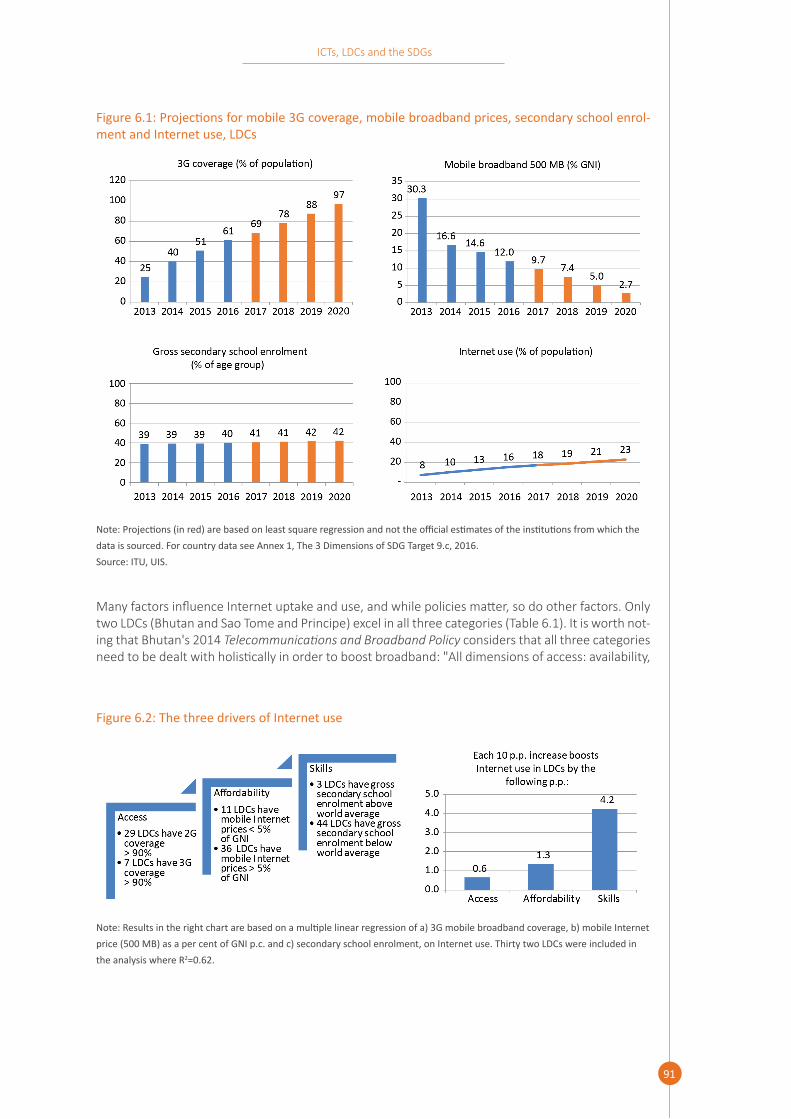
91
ICTs, LDCs and the SDGs
Many factors influence Internet uptake and use, and while policies matter, so do other factors. Only two LDCs (Bhutan and Sao Tome and Principe) excel in all three categories (Table 6.1). It is worth not-ing that Bhutan's 2014 Telecommunications and Broadband Policy considers that all three categories need to be dealt with holistically in order to boost broadband: "All dimensions of access: availability,
Figure6.1:Projectionsformobile3Gcoverage,mobilebroadbandprices,secondaryschoolenrol-ment and Internet use, LDCs
Note:Projections(inred)arebasedonleastsquareregressionandnottheofficialestimatesoftheinstitutionsfromwhichthedataissourced.ForcountrydataseeAnnex1,The3DimensionsofSDGTarget9.c,2016. Source: ITU, UIS.
Figure 6.2: The three drivers of Internet use
Note:Resultsintherightchartarebasedonamultiplelinearregressionofa)3Gmobilebroadbandcoverage,b)mobileInternetprice(500MB)asapercentofGNIp.c.andc)secondaryschoolenrolment,onInternetuse.ThirtytwoLDCswereincludedinthe analysis where R2=0.62.

92
ICTs, LDCs and the SDGs
affordability and capacity to use, will be addressed."154 Both Bhutan and Sao Tome and Principe are relatively small, with populations of less than 1 million, although there are a number of other LDCs with small populations that have not performed as well. In addition, in Bhutan, unlike many other LDCs, electricity is not a problem since hydroelectric power is abundant and electricity is relatively affordable. Although factors such as land and population size and density may provide an advantage or disadvantage, the strategies these countries have adopted to achieve their status are relevant for other LDCs. While Bhutan is land-locked, Sao Tome and Principe is an island state andis ten times more densely populated than Bhutan. Both have overcome geographic barriers to infrastructure de-velopment. The mountainous Kingdom of Bhutan has terrestrial fibre-optic connectivity to India for access to submarine cables, and the national backbone is managed by the Government and leased to operators free of charge. Mobile coverage has been extended to remote areas using universal service funds. Low wholesale costs translate into low retail prices, and the country has the lowest relative mobile Internet prices among the LDCs, at less than 1 percent of GNI. Affordability is further enhanced through free Internet access at some 200 community centres spread across the country. All but two higher secondary schools have Internet access, and gender parity has been addressed, with more females than males enrolled in secondary school.155
Although an island state, Sao Tome and Principe was for a long time without its own submarine cable landing station owing to a lack of options, and was obliged to use high-cost satellite connections. This changed in 2013, when the country connected to the ACE submarine cable. The connection was enabled through a public-private partnership between the Government and operators to manage the cable connection based on the principles of cost-based open access. This was complemented by the introduction of competition in 2015. These changes translated into dramatically lower Internet prices. High population density over the country’s two relatively small islands simplified the spread of mobile broadband coverage. The increase in low-cost and abundant Internet bandwidth supported the launch of 100 Mbps fibre-optic packages. In parallel with this, secondary education enrolment rose sharply, and all high schools are provided with Internet access through corporate social respon-sibility initiatives.
LDCs can be classified in three performance categories based on their overall performance across the three indicators (Table 6.2). This includes those on track to achieve SDG Target 9.c by 2020 (high); those that might achieve at least one or more of the indicator thresholds, particularly with the right policies to induce rapid growth (medium); and those unlikely to reach the target by 2020 owing to vulnerability challenges and structural barriers, or those where change is likely to be incremental (low).
154 Government of Bhutan. 2014. National Telecommunications and Broadband Policy. https:// www. nog. bt/ bhutannog3/ presentations/ BTBP3. 2. pdf
155 Ministry of Education, 2016. Annual Education Statistics.

93
ICTs, LDCs and the SDGs
Table 6.1: Top performers by category
3G Coverage > 65% (World average)
Mobile broadband price <5per cent (Broadband Commission
Recommendation)
Secondary school enrolment > 76% (World average)
Myanmar Timor-Leste
Lesotho Rwanda
Bangladesh Nepal
S. Tomé & Principe Gambia Ethiopia Tanzania Bhutan
Cambodia Vanuatu Kiribati Yemen
Solomon Islands Lao PDR
Bhutan Cambodia
Sudan Lao PDR Angola
Bangladesh Myanmar Tanzania
S. Tomé & Principe Vanuatu Rwanda
S. Tomé & Principe Bhutan Tuvalu
Table6.2:PerformanceacrossthreedimensionsofInternetuse:access,affordabilityandskills
High Medium Low
S. Tomé & Principe Bhutan
Timor-Leste Myanmar
Bangladesh Nepal
Vanuatu Lesotho Kiribati Rwanda Lao PDR
Cambodia Tanzania Gambia
Tuvalu Yemen
Solomon Islands Ethiopia Angola Sudan
Comoros Zambia Benin
Senegal Afghanistan
Uganda Djibouti
Mozambique Guinea Liberia Togo
Madagascar Malawi
Mali Haiti
Burkina Faso Sierra Leone
Burundi Chad Niger
Mauritania Central African Rep.
South Sudan Somalia
Congo, D.R. Eritrea
Guinea-Bissau
Note:Basedonaverageofrankinthreeindicators.Thethreeindicatorsare3Gcoverage(percentofpopulation),costof500MBmonthly mobile Internet (per cent of GNI p.c.) and gross secondary school enrolment.
The framework for gauging performance across each of the three dimensions makes it easier to iden-tify the areas that are most pressing and hence where to commit policy direction and scarce financial and human resources (Figure 6.3). For example, in Sudan, mobile Internet access is affordable, at 1.3 per cent of GNI, a reflection of the relatively high level of competition among three strong operators. However, coverage and school enrolment are far less developed. In Nepal, the situation is reversed: coverage is strong but affordability remains a challenge. Rwanda fares well in both coverage and

94
ICTs, LDCs and the SDGs
affordability but its secondary school enrolment is low. Bhutan is performing well in all areas, and with just slight improvements in coverage and school enrolment its performance would rise to high levels.
Figure 6.3: The three dimensions of Internet use
Note:Thisfigureshowsthevaluesofthethreeindicators(Access=3Gmobilecoverage(percentofpopulation),Affordability=Priceof500MBmonthlymobileInternetbasket(percentofGNI),Skills=Grosssecondaryschoolenrolment(%)onascaleof0to100.Source:ITUandUNESCOInstituteofStatistics
Table 6.3: Experienced strategic private investors in Bangladesh and Myanmar
Company HeadquartersRevenue
(US$ billion, 2016)
Capex (US$ billion,
2016Countries
Telenor Norway 15.6 3.1 Bangladesh, Myanmar, Norway, Sweden, Denmark, Serbia, Montenegro, Hungary, Bulgaria, Thailand, Malaysia, India, Pakistan,
Ooredoo Qatar 8.9 1.6 Myanmar, Iraq, Kuwait, Oman, Qatar, Palestine, Indonesia, Lao PDR, Maldives, Singapore, Algeria, Tunisia
Global Telecom Holdings (GTH)
Netherlands 3.0 0.5 Bangladesh, Algeria, Pakistan
Axiata Malaysia 5.2 2.6 Bangladesh, Cambodia, India, Indonesia, Malaysia, Pakistan, Nepal, Singapore, Sri Lanka
95
ICTs, LDCs and the SDGs
Company HeadquartersRevenue
(US$ billion, 2016)
Capex (US$ billion,
2016Countries
KDDI Japan 43.6 5.9 Strategic partner of Myanmar Posts & Telecommunications
Note:Financialdatarefertoentiregroup. Source:Adaptedfromcompanyoperatingreports.
6.1 Leap-frogging
Driving rapid improvement in network infrastructure, affordability and skills will be essential for LDCs that want to achieve SDG Target 9.c by the deadline. Several LDCs provide examples of impressive leap-frogging triggered by progressive policies. For example, both Bangladesh and Myanmar, the largest and fourth largest LDCs in terms of population, were able to boost mobile broadband coverage from less than 10 per cent of the population to over 90 per cent in just four years (Figure 6.4, left). What they both have in common are policies enabling leap-frogging: Myanmar’s new telecommuni-cations law opened the sector to competition; in Bangladesh, spectrum for 3G was auctioned. Both nations have experienced operators with the resources to undertake the necessary investments amounting to billions of US dollars (Table 6.3). Norway's Telenor, operating in over a dozen countries, is active in both countries. In Myanmar, Ooredoo of Qatar is a mobile group with a presence in a dozen countries, while the state-owned incumbent Myanmar Posts and Telecommunications (MPT) has a strategic partnership with Japan's second largest mobile operator KDDI.156 In Bangladesh, Telenor is joined by Robi, owned by Malaysia's Axiata, a mobile group that operates across nine Asian nations. Other operators include Banglalink, owned by Netherlands-based mobile group GTH, and Teletalk, a state-owned operator. Other factors driving rapid growth were low fixed broadband penetration and strong fibre-optic backbones; coverage obligations and tower sharing also drove investment in Myanmar.
As regards affordability, mobile broadband prices fell over 70 per cent between 2013 and 2016 in Tanzania and Vanuatu (Figure 6.4, centre). Although Tanzania has long had a competitive mobile market, the entry of Vietnamese-owned Viettel, operating under the brand Halotel, in October 2015 caused disruption. It launched a 3G only service on the back of extensive investment in a fibre-optic backbone, highlighting the fact that it is possible to bridge the Internet gap in a short period of time.157 Halotel's entry triggered a price war, with the price of a 500 MB mobile Internet package falling 70 per cent between 2015 and 2016, which meant that affordability reached the threshold of 5 per cent or less of GNI. In the case of Vanuatu, the arrival in January 2014 of the 1 259-kilometre Interchange Cable Network 1, connecting the country to Fiji via fibre-optic cable, dramatically reduced wholesale Internet prices and resulted in a huge increase in capacity. This led to an 80 per cent drop in retail Internet prices, so that Vanuatu also passed the 5 per cent GNI threshold.
Bhutan and Sao Tome and Principe have leap-frogged in terms of secondary school enrolment, sur-passing the world average (Figure 6.4, right). The Government of Bhutan provides free education for all students until Grade 10 and in 2015 spent over a quarter of its budget on education, the highest proportion in the world.158 Primary school enrolment is over 100 per cent, and 95 per cent of those completing primary school move on to secondary. The Government also initiated an ICT skills
156 Teppei Kasai. 2014. "Japan's KDDI, Sumitomo Corp to invest $2 bln in Myanmar telecoms." Reuters, 16 July. http:// www. reuters. com/ article/ kddi- myanmar- idUSL4N0PR1L320140716
157 "Viettel launches Tanzania Services." Viet Nam News, 16 October 2016. http:// vietnamnews. vn/ economy/ 277170/ viettel- launches- tanzania- services. html#v1GJ1UU5FAGsdvip. 97
158 Among countries for which 2015 data is available. See: http:// data. worldbank. org/ indicator/ SE. XPD. TOTL. GB. ZS
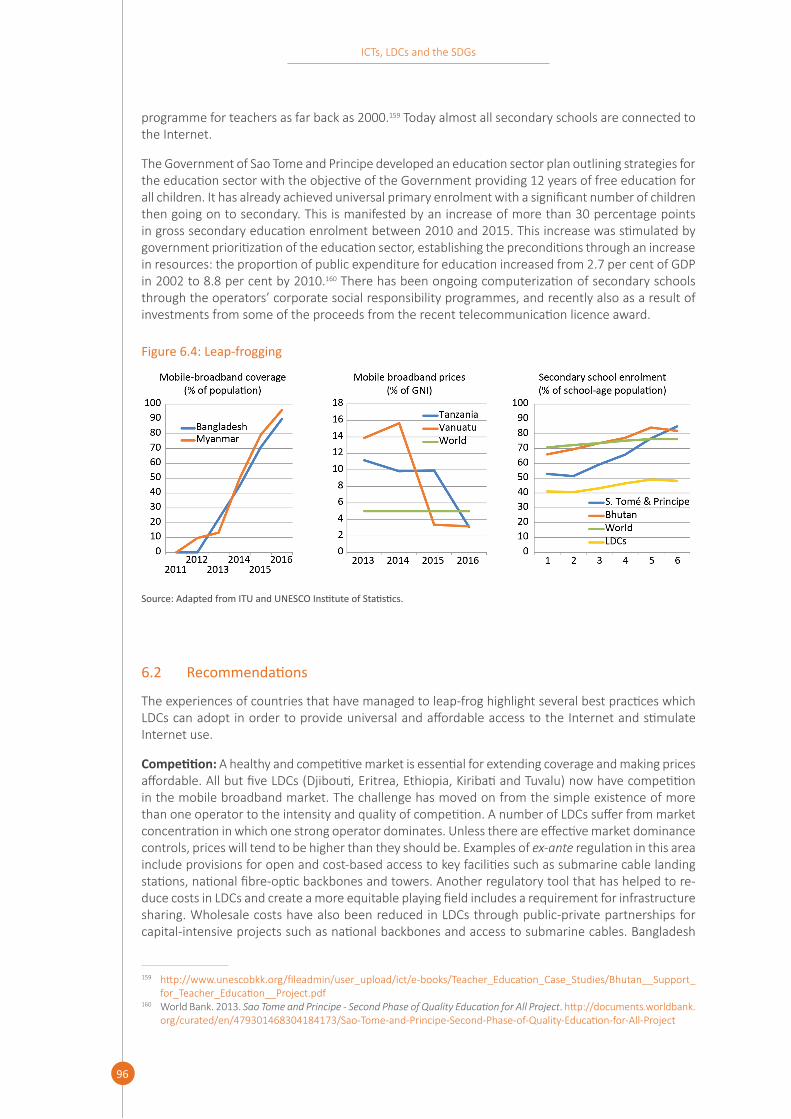
96
ICTs, LDCs and the SDGs
programme for teachers as far back as 2000.159 Today almost all secondary schools are connected to the Internet.
The Government of Sao Tome and Principe developed an education sector plan outlining strategies for the education sector with the objective of the Government providing 12 years of free education for all children. It has already achieved universal primary enrolment with a significant number of children then going on to secondary. This is manifested by an increase of more than 30 percentage points in gross secondary education enrolment between 2010 and 2015. This increase was stimulated by government prioritization of the education sector, establishing the preconditions through an increase in resources: the proportion of public expenditure for education increased from 2.7 per cent of GDP in 2002 to 8.8 per cent by 2010.160 There has been ongoing computerization of secondary schools through the operators’ corporate social responsibility programmes, and recently also as a result of investments from some of the proceeds from the recent telecommunication licence award.
Figure 6.4: Leap-frogging
Source:AdaptedfromITUandUNESCOInstituteofStatistics.
6.2 Recommendations
The experiences of countries that have managed to leap-frog highlight several best practices which LDCs can adopt in order to provide universal and affordable access to the Internet and stimulate Internet use.
Competition: A healthy and competitive market is essential for extending coverage and making prices affordable. All but five LDCs (Djibouti, Eritrea, Ethiopia, Kiribati and Tuvalu) now have competition in the mobile broadband market. The challenge has moved on from the simple existence of more than one operator to the intensity and quality of competition. A number of LDCs suffer from market concentration in which one strong operator dominates. Unless there are effective market dominance controls, prices will tend to be higher than they should be. Examples of ex-ante regulation in this area include provisions for open and cost-based access to key facilities such as submarine cable landing stations, national fibre-optic backbones and towers. Another regulatory tool that has helped to re-duce costs in LDCs and create a more equitable playing field includes a requirement for infrastructure sharing. Wholesale costs have also been reduced in LDCs through public-private partnerships for capital-intensive projects such as national backbones and access to submarine cables. Bangladesh
159 http:// www. unescobkk. org/ fileadmin/ user_ upload/ ict/ e- books/ Teacher_ Education_ Case_ Studies/ Bhutan__ Support_ for_ Teacher_ Education__ Project. pdf
160 World Bank. 2013. Sao Tome and Principe - Second Phase of Quality Education for All Project. http:// documents. worldbank. org/ curated/ en/ 479301468304184173/ Sao- Tome- and- Principe- Second- Phase- of- Quality- Education- for- All- Project

97
ICTs, LDCs and the SDGs
and Myanmar demonstrate how strong operators can accelerate infrastructure development by applying their technical know-how and financial resources. Policy makers in LDCs should keep this in mind when awarding new licences or overseeing industry mergers and acquisitions.
Coverage: A competitive market is the best way to extend coverage, as the cases of Bangladesh and Myanmar show. In addition, coverage obligations can be written into licences and spectrum award conditions. For areas that are economically unviable for commercial operators, there are a number of options. These include the use of universal service funds to subsidize the higher cost. In Bhutan, for example, the universal service fund has subsidized the provision of mobile coverage for 649 villages. However, in a number of other LDCs, universal service funds have not been deployed effectively and their operation needs to be improved. Sufficient spectrum needs to be awarded, particularly low-fre-quency spectrum made available by the transition to digital broadcasting, since it lowers investment costs by allowing coverage of a wider area.
Affordability: There are several ways in which affordability can be improved. One is to promote a competitive market so that operators will compete for low-use customers through a variety of Internet plans that cater to different incomes and levels of use. A second way is to rationalize taxation. Many LDCs have high import and other taxes on devices, which affects adoption by first-time Internet users as well as those wishing to move up to mobile broadband by purchasing a smartphone, tablet or lap-top. Sector-specific service taxes, such as special taxes on mobile use, are regressive and particularly affect low-income users. The wide array of taxes beyond business income tax and including licence fees, detract from network investment and are passed on to users. Governments need to rationalize their ICT sector taxation and other fees and find the right balance between the need for revenue and the development of their digital economy. A third way of enhancing affordability is through the availability of community centres with Internet access. These can serve as low-cost or free venues for accessing the Internet and can be used for training people.
Skills: Secondary school enrolment has been found to have an important and statistically significant impact on Internet use in LDCs. Although education sector policies are outside the realm of the ICT sector, there are nonetheless linkages. For example, LDCs that have adopted strategic ICT sector plans typically recognize the importance of skills and formulate requirements for collaboration between ICT and education ministries in terms of specific objectives. The need for this collaboration is politically reinforced by the strong link to SDG Goal 4: "Ensure inclusive and equitable quality education and promote lifelong learning opportunities for all."161 SDG 4 encompasses a number of targets that are essential for enhancing Internet use, such as ensuring free secondary education by 2030 and rele-vant tracking indicators such as the proportion of youth and adults with ICT skills and the proportion of schools with access to the Internet.162 At the same time tools inherent to the ICT sector, such as universal service funds and operator corporate social responsibility initiatives, have been successfully applied in some LDCs to provide schools with computers and Internet access. Finally, consideration also needs to be given to developing more local content in order to attract more people to use the Internet.
Institutional strengthening: It is crucial to make available the necessary resources for the public institutions involved in the policies, strategies and plans that are crucial for promoting vibrant com-petition, implementing universal access and fomenting learning. This includes developing human capacity in those institutions and ensuring that they have the necessary tools and support to carry out their duties.
Gender: In a number of LDCs, there is a large gender gap in Internet use. This must be addressed, and can be reduced by increasing gender parity in schools, establishing gender-friendly public Internet access and training venues, and empowering women and girls by recognizing and promoting the image of women as essential participants in the digital economy.
161 http:// www. un. org/ sustainabledevelopment/ education/ 162 https:// unstats. un. org/ sdgs/ indicators/ database/? indicator= 4. 4. 1

98
ICTs, LDCs and the SDGs
Core Internet infrastructure: A sustainable Internet ecosystem is necessary if LDCs are to successfully harness digital technology for social and economic development. Core Internet infrastructure means the fundamental components that store and exchange data within a nation: Internet exchanges, data centres, and cloud computing and hosting services. This digital infrastructure is critical for keeping the Internet up and running and for enabling Internet applications, services and online content for citizens, businesses and governments. The need for relevant local content makes this infrastructure even more important in LDCs.
Data: There is a need for more and better data on Internet use and barriers to use in LDCs. The lack of data in LDCs remains an important challenge to ICT policy-makers, investors and content produc-ers. Data that provide in-depth information on how exactly people use the Internet and what people do online are scarce and often out of date. Household surveys are essential for providing reliable demand-side data disaggregated by socio-economic characteristics. Some LDCs, such as Malawi and Zambia, have forged a partnership between regulators and national statistical offices to carry out such surveys, which are analytically very useful. Regulators, national statistical agencies and the international community should strengthen collaboration to generate more demand-side surveys on Internet use in LDCs.
While policy prescriptions are clear, implementation often stumbles for a number of reasons. A key way to keep policy on track is to have strong government commitment to fostering a digital economy and to identify targets. Without a robust commitment from the highest level of government, it may be easy for strong operators to influence regulators, which then may not make the best decisions aligned with national policy. In particular, incumbent operators, particularly when they remain state-owned, can have undue influence. Some LDCs face governance challenges; without good governance it is much more difficult to trigger the reforms required to create an enabling environment for achieving SDG Target 9.c and many other SDGs and targets.
LDCs whose governments have a strong commitment to digital technologies as a means of acceler-ating social and economic development have generally performed well in boosting the environment for achieving SDG Target 9.c. This is typically enunciated through strategic plans for the ICT sector that tie into national development goals. Plans unite policy and regulation into a common strategy, provide a framework for wider collaboration between different actors such as other ministries, aca-demia and the private sector, and enhance transparency with regard to the government's intentions and timetable for the ICT sector.
Government commitment to ICT is captured by an opinion survey used in the World Economic Forum's Network Readiness Index.163 Top-ranked LDCs include three of the best performing countries in prog-ress towards achievement of SDG 9.c: Bangladesh (4th), Bhutan (3rd) and Rwanda (1st). Their com-mitment is expressed through national and sector strategies guiding ICT development. Bangladesh's Seventh Five-Year Plan (2016-2020) highlights the country’s strategy for national development.164 It devotes an entire 59-page chapter to the role of digital technologies. In the case of Rwanda, the Smart Rwanda 2020 Master Plan identifies how ICTs fit into the national Vision 2020 strategy.165 The plan is the fourth in a series stretching back to 2000. Bhutan, which has adopted an ICT Roadmap and National Telecommunications and Broadband Policy, has also developed a specific sector strategy in the Education ICT Master Plan 2014-2018.166 That is particularly notable, given the link between Internet use and skills.
This report highlights the fact that despite the particular vulnerabilities facing LDCs, they can take a number of steps to achieve widespread, low-cost access to the Internet. LDCs with a strong
163 To what extent does the government have a clear implementation plan for utilizing ICTs to improve your country's overall competitiveness? See the "Network Readiness Index" at: http:// reports. weforum. org/ global- information- technology- report- 2016/ networked- readiness- index/
164 http:// www. plancomm. gov. bd/ 7th- five- year- plan- 2/ 165 http:// www. myict. gov. rw/ ict/ strategy/ 166 http:// www. education. gov. bt/ documents/ 10180/ 12859/ ICT+Book+final+2015. pdf/ f2791964- b5b7- 4f78- 9557-
a15213bd6446? version= 1. 0

99
ICTs, LDCs and the SDGs
government commitment, recognizing the importance of digital technologies for national develop-ment, and backed by enlightened policy and regulatory actions including steps to develop skills, can achieve universal and affordable access to the Internet.

100
ICTs, LDCs and the SDGs
ReferencesAlliance for Affordable Internet (AFAI). 2016. Mobile Data Services: Exploring User Experiences & Perceived Benefits. The Impacts of Emerging Mobile Data Services in Developing Countries 2. http:// 1e8q3q16vyc81g8l3h3md6q5f5e. wpengine. netdna- cdn. com/ wp- content/ uploads/ 2016/ 05/ MeasuringImpactsofMobileDataServices_ ResearchBrief2. pdf
Broadband Commission for Sustainable Development, ed. 2016. The State of Broadband 2016: Broadband Catalyzing Sustainable Development. Geneva, Switzerland: ITU. http:// www. broadbandcommission. org/ publications/ Pages/ SOB- 2016. aspx
Earth Institute. 2016. ICT and SDGs. https:// www. ericsson. com/ assets/ local/ news/ 2016/ 05/ ict- sdg. pdf
GSMA. 2015. Digital Inclusion and Mobile Sector Taxation. https:// www. gsma. com/ mobilefordevelopment/ wp- content/ uploads/ 2015/ 06/ Digital- Inclusion- Mobile- Sector- Taxation- 2015. pdf
———. 2017. State of the Industry Report on Mobile Money, Decade Edition: 2006-2016. https:// www. gsma. com/ mobilefordevelopment/ programme/ mobile- money/ decade- edition- of- the- state- of- the- industry- report- on- mobile- money
Internet Society. 2017. The Benefits of Local Content Hosting: A Case Study. https:// www. internetsociety. org/ sites/ default/ files/ ISOC_ LocalContentRwanda_ report_ 20170505_ final. pdf
ITU. 2014. “Connect 2020 Agenda for Global Telecommunication/Information and Communication Technology Development.” In Plenipotentiary Conference of the International Telecommunication Union. Busan, Korea. https:// www. itu. int/ en/ connect2020/ Pages/ default. aspx
———. 2015. “ICT Indicators for the SDG Monitoring Framework.” https:// www. itu. int/ en/ ITU- D/ Statistics/ Documents/ intlcoop/ sdgs/ ITU- ICT- technical- information- sheets- for- the- SDG- indicators- Sept2015. pdf. ———. 2016. Measuring the Information Society Report. http:// www. itu. int: 80/ en/ ITU- D/ Statistics/ Pages/ publications/ mis2016. aspx
———. 2017a. “ICT Facts and Figures 2017.” http:// www. itu. int: 80/ en/ ITU- D/ Statistics/ Pages/ facts/ default. aspx
———. 2017b. Connecting the Unconnected: Working together to achieve Connect 2020 Agenda Targets. http:// broadbandcommission. org/ Documents/ ITU_ discussion- paper_ Davos2017. pdf
McKinsey & Company. 2014. Offline and Falling behind: Barriers to Internet Adoption. http:// www. mckinsey. com/ industries/ high- tech/ our- insights/ offline- and- falling- behind- barriers- to- internet- adop-tion
United Nations (UN). 2011. “Programme of Action for the Least Developed Countries for the Decade 2011-2020.” In Fourth United Nations Conference on the Least Developed Countries. Istanbul, Turkey. http:// unohrlls. org/ UserFiles/ File/ IPoA. pdf
———. 2015. Transforming Our World: The 2030 Agenda for Sustainable Development. https:// sustainabledevelopment. un. org/ post2015/ transformingourworld
UN-OHRLLS. 2017a. Leveraging Investments in Broadband for National Development: The Case of Rwanda and Senegal. https:// unohrlls. org/ custom- content/ uploads/ 2017/ 07/ Leveraging- Investments- in- Broadband- for- National- Development- 2017. pdf
———. 2017b. State of the Least Developed Countries. http:// unohrlls. org/ custom- content/ uploads/ 2017/ 07/ State- of- the- LDCs_ 2017. pdf

101
ICTs, LDCs and the SDGs
World Bank. 2016. World Development Report 2016: Digital Dividends. http:// www. worldbank. org/ en/ publication/ wdr2016
———. 2017. ICT in Agriculture (Updated Edition) : Connecting Smallholders to Knowledge, Networks, and Institutions. https:// openknowledge. worldbank. org/ handle/ 10986/ 27526
World Health Organization (WHO). 2016. From Innovation to Implementation: EHealth in the WHO European Region. Copenhagen, Denmark: World Health Organization Regional Office for Europe.
Zambia Information and Communications Technology Authority (ZICTA). 2015. Survey on Access and Usage of Information and Communication Technology by Households and Individuals in Zambia. https:// www. zicta. zm/ Views/ Publications/ 2015ICTSURVEYREPORT. pdf

102
ICTs, LDCs and the SDGs
Annex 1
BasicIndicators,2016
Country NameTotal
Population (millions)
Land area (km²)Population
Density (people per km²)
GNI per capita
Afghanistan 32.73 652 860 51 610
Angola 23.52 1 246 700 19 4 180
Bangladesh 162.28 147 630 1 127 1 190
Benin 11.16 114 760 99 840
Bhutan 0.79 38 394 20 2 380
Burkina Faso 18.42 274 220 67 640
Burundi 11.15 27 830 401 260
Cambodia 15.94 181 040 88 1 070
Central African Rep. 4.9 622 980 8 330
Chad 14.01 1 284 000 11 880
Comoros 0.79 1 861 423 780
Dem. Rep. of the Congo 73.17 2 344 860 31 410
Djibouti 0.91 23 200 41 N/A
Eritrea 6.94 117 600 74 490
Ethiopia 101.41 1 104 300 83 590
Gambia 2.03 11 300 190 500
Guinea 12.66 245 860 51 470
Guinea-Bissau 1.83 36 130 51 590
Haiti 10.74 27 750 387 810
Kiribati 0.11 810 157 3 390
Lao PDR 7.15 236 800 30 1 740
Lesotho 2.14 30 360 71 1 280
Liberia 4.61 111 370 41 380
Madagascar 24.92 587 040 42 420
Malawi 17.8 118 480 189 340
Mali 16.77 1 240 190 14 760
Mauritania 4.18 1 030 700 4 1 270
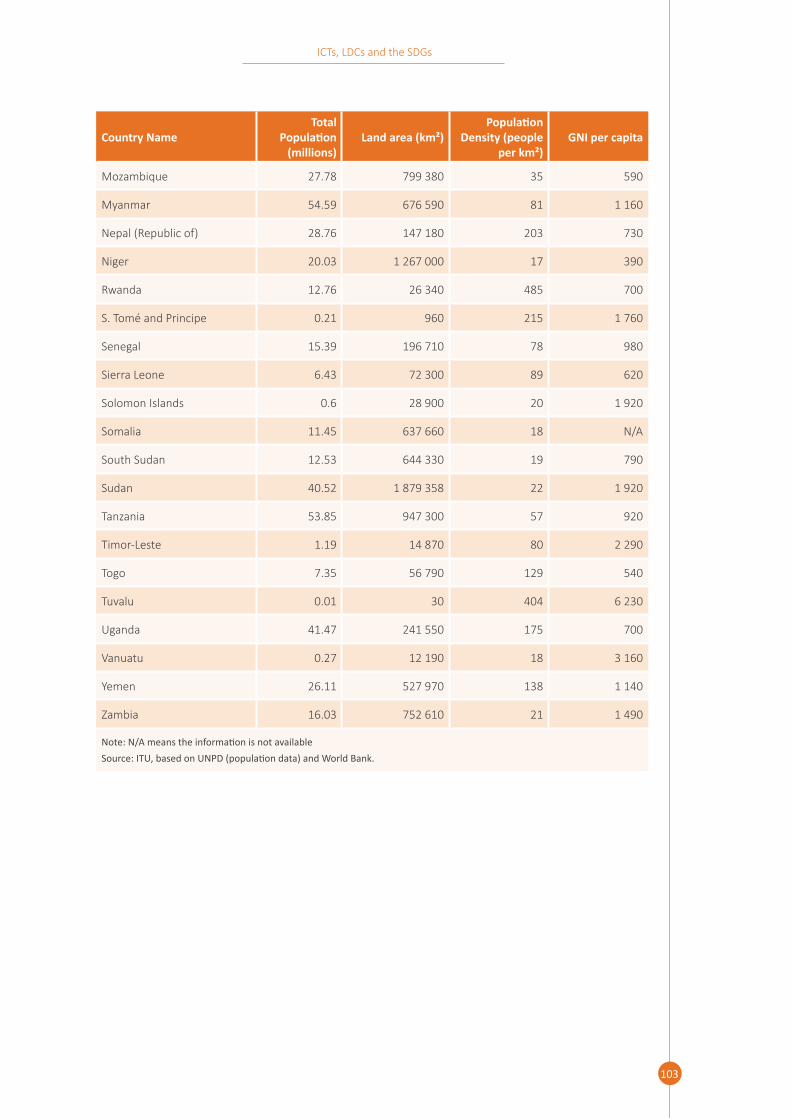
103
ICTs, LDCs and the SDGs
Country NameTotal
Population (millions)
Land area (km²)Population
Density (people per km²)
GNI per capita
Mozambique 27.78 799 380 35 590
Myanmar 54.59 676 590 81 1 160
Nepal (Republic of) 28.76 147 180 203 730
Niger 20.03 1 267 000 17 390
Rwanda 12.76 26 340 485 700
S. Tomé and Principe 0.21 960 215 1 760
Senegal 15.39 196 710 78 980
Sierra Leone 6.43 72 300 89 620
Solomon Islands 0.6 28 900 20 1 920
Somalia 11.45 637 660 18 N/A
South Sudan 12.53 644 330 19 790
Sudan 40.52 1 879 358 22 1 920
Tanzania 53.85 947 300 57 920
Timor-Leste 1.19 14 870 80 2 290
Togo 7.35 56 790 129 540
Tuvalu 0.01 30 404 6 230
Uganda 41.47 241 550 175 700
Vanuatu 0.27 12 190 18 3 160
Yemen 26.11 527 970 138 1 140
Zambia 16.03 752 610 21 1 490
Note:N/Ameanstheinformationisnotavailable Source:ITU,basedonUNPD(populationdata)andWorldBank.

104
ICTs, LDCs and the SDGs
InfrastructureAccessIndicators,2016
Country Name
Percentage of the population covered by Subscriptions per 100 inhabitants
a mobile- cellular
network (2G)
a 3G mobile network
(3G)
an LTE/ WiMAX mobile
network (4G)
Mobile-cellular
Active mobile- broad-
band
Fixed broad-
band
Afghanistan 89 40 0 66.00 14.27 0.03
Angola 99 62 8 55.28 17.11 0.52
Bangladesh 99 90 65 77.88 17.79 3.77
Benin 99 45 24 79.65 5.58 0.81
Bhutan 98 80 40 88.78 47.90 3.94
Burkina Faso 93 23 0 83.63 19.87 0.05
Burundi 53 40 9 48.04 8.30 0.04
Cambodia 99 80 50 124.94 50.19 0.61
Central African Rep. 58 40 0 25.49 3.28 0.02
Chad 86 22 22 44.48 9.51 0.07
Comoros 99 60 60 57.66 0.01 0.36
Dem. Rep. of the Congo
50 30 0 39.48 14.18 0.00
Djibouti 95 58 0 37.82 11.61 2.96
Eritrea 85 92 0 7.29 0.00 0.01
Ethiopia 85 57 10 50.51 5.28 0.55
Gambia 96 86 15 139.63 21.26 0.18
Guinea 99 39 0 85.33 15.01 0.01
Guinea-Bissau 83 8 21 70.26 6.89 0.04
Haiti 95 58 0 60.54 10.29 0.01
Kiribati 70 63 64 51.31 0.93 0.07
Lao PDR 98 71 7 55.39 34.66 0.34
Lesotho 98 96 75 106.57 36.94 0.10
Liberia 89 50 14 83.10 6.65 0.17
Madagascar 90 55 20 41.79 10.52 0.06
Malawi 96 42 16 40.32 18.50 0.05
Mali 95 36 0 120.31 24.40 0.03
Mauritania 90 41 0 86.52 30.21 0.25

105
ICTs, LDCs and the SDGs
Country Name
Percentage of the population covered by Subscriptions per 100 inhabitants
a mobile- cellular
network (2G)
a 3G mobile network
(3G)
an LTE/ WiMAX mobile
network (4G)
Mobile-cellular
Active mobile- broad-
band
Fixed broad-
band
Mozambique 89 50 N/A 66.25 49.52 0.14
Myanmar 100 96 9 89.26 47.63 0.06
Nepal (Republic of) 92 90 0 111.70 30.78 0.78
Niger 82 18 0 48.87 1.95 0.07
Rwanda 100 92 55 69.92 27.01 0.17
S. Tomé and Principe
93 90 0 85.28 24.04 0.69
Senegal 92 50 22 98.68 26.08 0.64
Sierra Leone 88 40 N/A 97.62 23.43 N/A
Solomon Islands 93 72 0 69.89 12.93 0.21
Somalia 85 39 15 58.12 2.45 0.80
South Sudan 30 20 0 21.55 1.20 0.00
Sudan 90 46 30 68.63 25.19 0.06
Tanzania 95 85 13 74.36 9.22 0.25
Timor-Leste 97 97 0 125.01 64.57 0.09
Togo 91 45 0 74.91 19.55 0.61
Tuvalu 57 57 0 76.44 0.00 10.06
Uganda 93 64 15 55.07 33.71 0.26
Vanuatu 95 80 25 71.30 22.26 1.63
Yemen 88 89 0 67.17 6.05 1.65
Zambia 93 53 6 74.95 32.16 0.20
Note:N/Ameanstheinformationisnotavailable.Note:Figuresinitalicsrefertoestimates. Source: ITU and Operator Websites.

106
ICTs, LDCs and the SDGs
InfrastructureBackboneIndicators,2016
Country Name International bandwidth per Internet user (Mbps)
Percentage of the population within reach of Fibre or microwave backbone networks
10-km range
25-km range
50-Km range
100-Km range
Afghanistan 11 966.64 21.44 43.52 68.21 88.24
Angola 8 796.24 12.76 21.11 24.84 30.02
Bangladesh 9 154.09 45.73 93.02 99.34 100.00
Benin 1 655.59 44.50 72.09 91.15 99.75
Bhutan 18 077.02 32.73 81.90 98.80 100.00
Burkina Faso 2 810.14 11.07 23.90 42.69 72.93
Burundi 6 083.21 37.75 95.21 100.00 100.00
Cambodia 23 573.21 27.28 68.36 98.96 100.00
Central African Rep. 1 694.63 N/A N/A N/A N/A
Chad 3 761.89 12.58 16.52 27.78 46.44
Comoros 12 728.80 99.24 99.93 99.93 99.93
Dem. Rep. of the Congo 770.25 7.29 14.83 20.35 32.64
Djibouti 15 227.96 75.37 84.15 94.03 99.24
Eritrea 3 600.51 N/A N/A N/A N/A
Ethiopia 2 242.35 9.56 24.59 56.80 92.05
Gambia 13 296.62 75.39 96.52 100.00 100.00
Guinea 589.37 4.33 13.58 15.15 22.14
Guinea-Bissau 4 706.68 24.29 30.67 58.75 93.31
Haiti 2 337.44 35.77 78.17 97.28 100.00
Kiribati 4 426.28 N/A N/A N/A N/A
Lao PDR 17 487.00 25.59 65.92 95.51 100.00
Lesotho 4 484.09 1.63 20.47 58.79 100.00
Liberia 14 777.24 8.82 12.18 17.75 36.16
Madagascar 14 258.05 16.63 41.16 74.97 95.06
Malawi 4 201.09 17.94 45.36 89.33 99.59
Mali 598.17 13.05 25.20 42.30 75.55
Mauritania 4 476.59 11.56 28.60 48.25 58.61
Mozambique 1 114.54 19.50 38.95 64.79 87.17
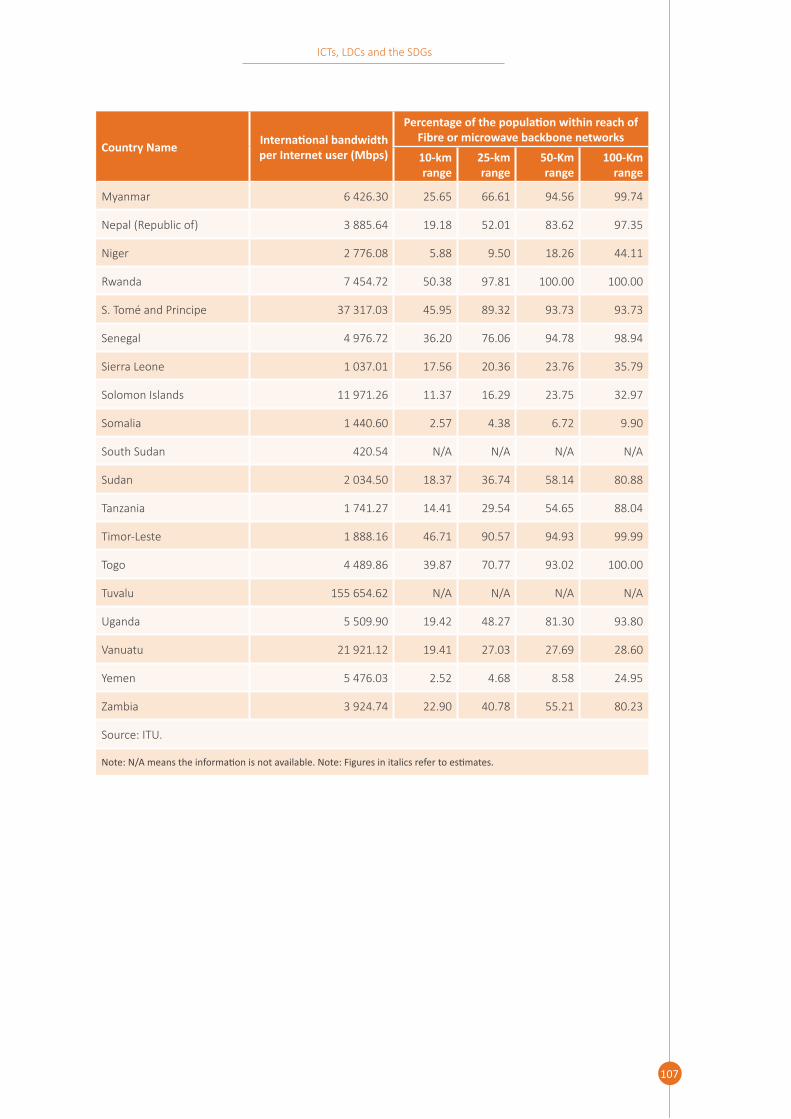
107
ICTs, LDCs and the SDGs
Country Name International bandwidth per Internet user (Mbps)
Percentage of the population within reach of Fibre or microwave backbone networks
10-km range
25-km range
50-Km range
100-Km range
Myanmar 6 426.30 25.65 66.61 94.56 99.74
Nepal (Republic of) 3 885.64 19.18 52.01 83.62 97.35
Niger 2 776.08 5.88 9.50 18.26 44.11
Rwanda 7 454.72 50.38 97.81 100.00 100.00
S. Tomé and Principe 37 317.03 45.95 89.32 93.73 93.73
Senegal 4 976.72 36.20 76.06 94.78 98.94
Sierra Leone 1 037.01 17.56 20.36 23.76 35.79
Solomon Islands 11 971.26 11.37 16.29 23.75 32.97
Somalia 1 440.60 2.57 4.38 6.72 9.90
South Sudan 420.54 N/A N/A N/A N/A
Sudan 2 034.50 18.37 36.74 58.14 80.88
Tanzania 1 741.27 14.41 29.54 54.65 88.04
Timor-Leste 1 888.16 46.71 90.57 94.93 99.99
Togo 4 489.86 39.87 70.77 93.02 100.00
Tuvalu 155 654.62 N/A N/A N/A N/A
Uganda 5 509.90 19.42 48.27 81.30 93.80
Vanuatu 21 921.12 19.41 27.03 27.69 28.60
Yemen 5 476.03 2.52 4.68 8.58 24.95
Zambia 3 924.74 22.90 40.78 55.21 80.23
Source: ITU.
Note:N/Ameanstheinformationisnotavailable.Note:Figuresinitalicsrefertoestimates.

108
ICTs, LDCs and the SDGs
CoreInternetInfrastructureIndicators,2016
Country Name ccTLD Locally hosted ccTLD name server
Root name server* IXP Google
cache
Afghanistan AF
Angola AO D, F
Bangladesh BD D, E, F,J
Benin BJ D
Bhutan BT I
Burkina Faso BF
Burundi BI
Cambodia KH F
Central African Rep. CF
Chad TD
Comoros KM
Dem. Rep. of the Congo
CD
Djibouti DJ J
Eritrea ER
Ethiopia ET
Gambia GM D
Guinea GN
Guinea-Bissau GW
Haiti HT D, F
Kiribati KI
Lao PDR LA
Lesotho LS
Liberia LR D
Madagascar MG D
Malawi MW D, L
Mali ML
Mauritania MR
Mozambique MZ D
Myanmar MM L

109
ICTs, LDCs and the SDGs
Country Name ccTLD Locally hosted ccTLD name server
Root name server* IXP Google
cache
Nepal (Republic of) NP D, E,I
Niger NE
Rwanda RW D, I,J
S. Tomé and Principe ST
Senegal SN L
Sierra Leone SL
Solomon Islands SB L
Somalia SO
South Sudan SS
Sudan SD D
Tanzania TZ D, E, F, J, L
Timor-Leste TL
Togo TG
Tuvalu TV
Uganda UG D
Vanuatu VU D, I
Yemen YE L
Zambia ZM
Source: https:// www. iana. org/ domains/ root/ db (CCTLD:thissitewasusedtoidentifytechnicalserverinformation,includ-ingIPaddress,tracetherouteandidentifyphysicallocation);http://www.root-servers.org(Root server.*Theletters(D, F, L, E, I, J) refer to who operates the root name server, see: https:// www. netnod. se/ i- root/ what- are- root- name- serv-ers);https:// www. pch. net/ ixp/ summary_ growth_ by_ country (IXPs);https:// www. google. com/ maps/ d/ viewer? mid= 18FeuDz0xtVnpvLiFz9HsPk7ZTDg& hl= en_ US& ll=- 3. 81666561775622e- 14%2 C10. 318399000000056& z=(Google cache).

110
ICTs, LDCs and the SDGs
AffordabilityIndicators,2016
Price of a 500 MB mobile broadband subscription, ITU basket No. of plans available
(leading operator by subscriptions) US$
Price as a per-centage of GNI
per capita
Data (MB) included Price per GB
Afghanistan 5.2 10.1 3072 1.7 11
Angola 7.6 2.2 500 15.3 6
Bangladesh 2.3 2.3 500 4.6 21
Benin 6.7 9.6 500 13.5 7
Bhutan 1.6 0.8 500 3.2 3
Burkina Faso 5.1 9.5 500 10.1 11
Burundi 4.8 22.3 500 9.7 17
Cambodia 1.0 1.1 500 2.0 13
Central African Rep. N/A N/A N/A N/A 10
Chad 8.4 11.5 500 16.9 12
Comoros 9.4 14.5 600 15.7 5
Dem. Rep. of the Congo
15.0 43.9 500 30.0 11
Djibouti 28.1 N/A 500 56.3 7
Eritrea N/A N/A N/A N/A N/A
Ethiopia 4.2 8.6 500 8.4 13
Gambia 4.9 12.3 500 9.7 9
Guinea 3.5 9.0 900 3.9 10
Guinea-Bissau 50.6 102.9 1024 49.4 11
Haiti 7.1 10.5 2500 2.8 5
Kiribati 14.9 5.3 1800 8.3 16
Lao PDR 2.5 1.7 540 4.6 7
Lesotho 6.8 6.4 1024 6.6 16
Liberia 4.0 12.6 500 8.0 6
Madagascar 5.3 15.1 1050 5.0 12
Malawi 7.9 12.5 500 15.9 12
Mali 4.2 14.8 500 8.4 8
Mauritania 28.7 N/A 500 57.3 1

111
ICTs, LDCs and the SDGs
Price of a 500 MB mobile broadband subscription, ITU basket No. of plans available
(leading operator by subscriptions) US$
Price as a per-centage of GNI
per capita
Data (MB) included Price per GB
Mozambique 2.5 5.2 1536 1.7 20
Myanmar 2.4 2.5 800 3.0 11
Nepal (Republic of) 5.8 9.5 1000 5.8 11
Niger 3.4 10.4 750 4.5 4
Rwanda 2.5 4.4 750 3.4 15
S. Tomé and Principe 4.5 3.1 600 7.5 4
Senegal 6.7 8.3 800 8.4 18
Sierra Leone 11.2 21.7 500 22.4 11
Solomon Islands 10.1 6.3 800 12.7 7
Somalia 15.0 N/A 600 25.0 6
South Sudan 9.3 14.1 500 18.6 6
Sudan 2.1 1.3 500 4.1 11
Tanzania 2.3 3.0 500 4.6 18
Timor-Leste 10.0 5.2 600 16.7 12
Togo 8.4 18.7 1500 5.6 6
Tuvalu N/A N/A N/A N/A N/A
Uganda 5.8 10.0 500 11.7 27
Vanuatu 7.5 N/A 800 9.4 23
Yemen 7.0 7.3 500 14.0 3
Zambia 9.7 7.8 500 19.4 21
Note: N/A means data are not available. Source:ITU(Mobilebroadbandsubscription).Dataonthenumberofplansarefromtheleadingoperators'websites.

112
ICTs, LDCs and the SDGs
Skills Indicators
Literacy rate
Population with at
least some secondary education
Gross enrolment ratio
Adult (% aged 15 and older)
(% aged 25 and older)
Secondary (% of secondary school–age population)
Tertiary (% of ter-tiary school–age
population)
2005-2015 2005-2015 2010-2015 2010-2015
Afghanistan 38.2 22.2 56 9
Angola 71.1 N/A 29 10
Bangladesh 61.5 43.1 58 13
Benin 38.4 23.3 54 15
Bhutan 64.9 9.6 84 11
Burkina Faso 36 8.5 30 5
Burundi 85.6 8.7 38 4
Cambodia 77.2 19.6 N/A 16
Central African Rep. 36.8 20.9 17 3
Chad 40.2 5.5 22 3
Comoros 77.8 N/A 59 9
Dem. Rep. of the Congo
77.3 24.6 44 7
Djibouti N/A N/A 47 5
Eritrea 73.8 N/A 36 3
Ethiopia 49.1 15.8 36 8
Gambia 55.5 31.9 57 3
Guinea 30.4 N/A 39 11
Guinea-Bissau 59.9 N/A N/A N/A
Haiti 60.7 32 N/A N/A
Kiribati N/A N/A N/A N/A
Lao PDR 79.9 36.4 57 17
Lesotho 79.4 23 52 10
Liberia 47.6 28.3 38 12
Madagascar 64.7 N/A 38 4
Malawi 65.8 19.6 39 1

113
ICTs, LDCs and the SDGs
Literacy rate
Population with at
least some secondary education
Gross enrolment ratio
Adult (% aged 15 and older)
(% aged 25 and older)
Secondary (% of secondary school–age population)
Tertiary (% of ter-tiary school–age
population)
2005-2015 2005-2015 2010-2015 2010-2015
Mali 38.7 11.5 44 7
Mauritania 52.1 17.3 30 6
Mozambique 58.8 5.2 25 6
Myanmar 93.1 23.8 51 14
Nepal (Republic of) 64.7 32 67 16
Niger 19.1 6.1 19 2
Rwanda 70.5 13.2 39 8
S. Tomé and Principe 74.9 37.7 85 13
Senegal 55.7 13.9 40 7
Sierra Leone 48.1 23.1 43 N/A
Solomon Islands N/A N/A 48 N/A
Somalia N/A N/A N/A N/A
South Sudan 31.9 N/A N/A N/A
Sudan 75.9 16.3 43 17
Tanzania 80.3 12.6 32 4
Timor-Leste 67.5 N/A 73 18
Togo 66.5 33.3 55 10
Tuvalu N/A N/A 81 N/A
Uganda 73.9 30.8 28 4
Vanuatu 85.2 N/A 60 N/A
Yemen 70.1 24.4 49 10
Zambia 63.4 51.8 N/A N/A
Note: N/A: Note available. Source:UNESCOandadaptedfromUNDP2016HumanDevelopmentReport(Table9).

114
ICTs, LDCs and the SDGs
ThethreedimensionsofSDGTarget9.c(Access,AffordabilityandSkills)andInternetUptake
Country Name
Percentage of the population covered by a mobile broad-
band (3G)
500 MB monthly subscriptions as per
cent GNI p.c
Secondary school
enrolment
Percentage of the population using
the Internet
Afghanistan 40 10.2 56 11
Angola 62 2.2 29 13
Bangladesh 90 2.3 58 18
Benin 45 9.6 54 12
Bhutan 80 0.8 84 42
Burkina Faso 23 9.5 30 14
Burundi 40 22.3 38 5
Cambodia 80 1.1 44 26
Central African Rep. 40 21.2 17 4
Chad 22 11.5 22 5
Comoros 60 14.5 59 8
Dem. Rep. of the Congo
30 43.9 44 6
Djibouti 58 18.6 47 13
Eritrea 92 0.0 36 1
Ethiopia 57 8.6 36 15
Gambia 86 12.3 57 19
Guinea 39 9.0 39 10
Guinea-Bissau 8 102.9 18 4
Haiti 58 10.5 22 12
Kiribati 63 5.3 70 14
Lao PDR 71 1.7 57 22
Lesotho 96 6.4 52 27
Liberia 50 12.6 38 7
Madagascar 55 15.1 38 5
Malawi 42 12.5 39 10
Mali 36 14.8 44 11
Mauritania 41 31.9 30 18

115
ICTs, LDCs and the SDGs
Country Name
Percentage of the population covered by a mobile broad-
band (3G)
500 MB monthly subscriptions as per
cent GNI p.c
Secondary school
enrolment
Percentage of the population using
the Internet
Mozambique 50 5.2 25 18
Myanmar 96 2.5 51 25
Nepal (Republic of) 90 9.5 67 20
Niger 18 10.4 19 4
Rwanda 92 4.4 39 20
S. Tomé and Principe 90 3.1 85 28
Senegal 50 8.3 40 26
Sierra Leone 40 21.7 43 12
Solomon Islands 72 6.3 48 11
Somalia 39 41.5 25 2
South Sudan 20 14.1 10 7
Sudan 46 1.3 43 28
Tanzania 85 3.0 32 13
Timor-Leste 97 5.2 73 25
Togo 45 18.7 55 11
Tuvalu 57 14.4 81 46
Uganda 64 10.0 28 22
Vanuatu 80 3.2 60 24
Yemen 89 7.4 49 25
Zambia 53 7.8 45 26
Note: Figures in italicsrefertoestimates.
Source: ITU, UNESCO

Thematic report ITU Development LDCs and small island
developing states
ICTs, LDCs and the SDGs
Achieving universal and affordable Internet in the least developed countries
In Partnership with
Printed in SwitzerlandGeneva, 2018
International Telecommunication Union
Telecommunication Development Bureau
Place des Nations
CH-1211 Geneva 20
Switzerland
www.itu.int
ICTs
, LD
Cs
and
the
SDG
s: A
chie
ving
uni
vers
al a
nd a
fford
able
Inte
rnet
in th
e le
ast d
evel
op
ed c
oun
trie
s N
ove
mb
er 2
017
ISBN 978-92-61-25461-2
9 7 8 9 2 6 1 2 5 4 6 1 2