
LANDSCAPE MODIFICATION AT MOUNDVILLE - …rla.unc.edu/Mdvlfiles/phd/Lacquement 2009 PhD.pdf · John...
199
i LANDSCAPE MODIFICATION AT MOUNDVILLE: AN ENERGETICS ASSESSMENT OF A MISSISSIPPIAN POLITY by CAMERON HAWKINS LACQUEMENT A DISSERTATION Submitted in partial fulfillment of the requirements for the degree of Doctor of Philosophy in the Department of Anthropology in the Graduate School of The University of Alabama TUSCALOOSA, ALABAMA 2009
Transcript of LANDSCAPE MODIFICATION AT MOUNDVILLE - …rla.unc.edu/Mdvlfiles/phd/Lacquement 2009 PhD.pdf · John...

i
LANDSCAPE MODIFICATION AT MOUNDVILLE:
AN ENERGETICS ASSESSMENT OF
A MISSISSIPPIAN POLITY
by
CAMERON HAWKINS LACQUEMENT
A DISSERTATION
Submitted in partial fulfillment of the requirementsfor the degree of Doctor of Philosophy
in the Department of Anthropologyin the Graduate School of
The University of Alabama
TUSCALOOSA, ALABAMA
2009

i
Copyright Cameron Hawkins Lacquement 2009ALL RIGHTS RESERVED

ii
Submitted by Cameron Hawkins Lacquement in partial fulfillment of the
requirements for the degree of Doctor of Philosophy specializing in Anthropology.
Accepted on behalf of the Faculty of the Graduate School by the dissertation
committee:
_________________________John H. Blitz, Ph.D.
_________________________William W. Dressler, Ph.D.
_________________________Keith P. Jacobi, Ph.D.
_________________________Andrew J. Graettinger, Ph.D.
_________________________Vernon J. Knight, Jr., Ph.D.
Chairperson
____________________________Michael D. Murphy, Ph.D.
Department Chairperson________________________Date
____________________________David A. Francko, Ph.D.
Dean of the Graduate School________________________Date

iii
ACKNOWLEDGMENTS
This research was made possible by several people whom without them, the
project would not have been possible. I would like to thank my family for guidance and
support. Also a special thanks to my love, Sarah. I would also like to extend my
appreciation to my advisor Dr. Jim Knight for direction, support, and for always being
there.
Thanks in particular to Dr. Graettinger for assisting me in learning more about his
discipline. Without his generosity and excitement about working with someone outside
his own field, the geotechnical engineering procedures and energy assessment of the
dissertation would never have existed. I am also grateful to the other committee
members, Dr. Blitz, Dr. Dressler, and Dr. Jacobi. In addition, I would like to thank Dr.
Bindon, though not a committee member, for assisting me in the formulation and defense
of the project.
Special thanks to Mary Bade and Mike Dressler at the Alabama Museum of
Natural History for helping me track down old maps and dusty pictures. I would also like
to extend my gratitude to Eugene Futato and the Office of Archaeological Research in
Moundville, Alabama for information and support in my fieldwork. Also from OAR, I
specifically wish to thank John Lieb for helping photograph the original Jones and Sons
topographic map from 1930. In tracking down further maps, I would also like to extend
my appreciation to Joseph Giliberti of the U.S. Corps of Engineers for helping me secure
additional maps of the Moundville site.

iv
I also wish to thank Sarah and James Caldwell, the Department of Anthropology
of the University of Alabama, and the College of Arts and Sciences of the University of
Alabama for their financial support.
Excavations at Moundville were completed largely by the efforts of friends,
students, and enthusiasts, who willingly gave up their weekends. Three ladies in
particular, Jennifer Gault, Ann Marshall, and Erin Phillips, donated several weekends for
no pay except cold-cut sandwiches, Oreos, and the pursuit of knowledge, but mostly I
think it was the Oreos. Thank you ladies and I hope one day I can return the favor. I also
would like to send a special thank you to Tom Lewis who assisted in the auger testing
and contour mapping of parts of the plaza.
Several other volunteers were essential to the planning and excavation stages of
this research. I would like to thank my fellow graduate comrades as well as the
undergraduates searching for the proverbial extra credit. These wonderful people are
listed below: Thanks again. Sarah Szurek, Tom Lewis, Shauna McDaniel, Candice
Griffin, Ashley Atkins, Lauren Downs, James Galbreath, Stephanie Castro, Brooke
Persons, Andrea Adams, Daniel LaDu, Andrew Scruggs, Steven Meredith, Ashley
Dumas, Treveor Clarke, Matthew Griffin, Krista Garcia, Anna Rich, Hood Mullican,
Teresa Ingalls, Kim Vasut, Lynn Funkhouse, Daniel Martinez, Jennifer Clinton, Justin
Nance, Jessica Brown, Matthew Trammell, Chase Fraley, Charles Greenlaw, Matthew
Collins, Hannah Box, Kate Joseafiak, Beau Brown, Brittany Magee, Davis Simmons,
Helen Barnes, Cathie Jerry, Mark Lent, Grace Fleming, Bobby Jagoe, Chase Kolaczek,
Angela Fabrizi, and Colonel Frank Atkin.

v
CONTENTS
ACKNOWLEDGMENTS……………………………………………………………......iii
LIST OF TABLES……………………………………………………………………….vii
LIST OF FIGURES……………………………………………………………………..viii
ABSTRACT……………………………………………………………………………...xi
1. INTRODUCTION……………………………………………………………………..1
Analytical Approaches to Monumental Architecture………………………………….4
Objectives for Creating the Energetics Assessment……...……………………………5
Research Setting: Moundville, Alabama..……………………………………………10
Energetics in Archaeology…………………………………………………………....16
Organization of Chapters……………………………………………………………..21
2. CALCULATING MOUND VOLUME AT MOUNDVILLE……………………….24
Previous Volume Measuring Techniques…………………………………………….25
Solid Geometry Methods……………………………………………………………..27
Gridding Method……………………………………………………………………...32
Method of Present Study……………………………………………………………...34
Results………………………………………………………………………………...41
Further Comparison of Volume Methods……………………………………….……44
Other Mississippian Mound Comparisons...…………………………...……………..46
3. PLAZA MODIFICATIONS AT MOUNDVILLE…………………………………...49
The Moundville Plaza………………………………………………………………...50

vi
Archaeological Methods for Determining Plaza Fill…………………………………57
Results………………………………………………………………………………...59
Discussion and Chronology……………………………………………...…………...76
4. LOCATION OF SOIL EXTRACTION AREAS…………………………………….79
Moundville’s “Borrow Pits”………………………………………………………….81
Soil Samples from Possible Borrowing Locations…………………………………...94
Results………………………………………………………………………………...97
5. APPLYING GEOTECHNICAL ENGINEERING TO PREHISTORICEARTHEN CONSTRUCTIONS……………………………………………….101
Geotechnical Techniques……………………………………………………………103
Methods……………………………………………………………………………...114
Results…………………………………………………………………………….....117
Discussion…………………………………………………………………………...123
6. FORMULATING AN ENERGETICS ASSESSMENT OF THEMOUNDVILLE LANDSCAPE………………………………………….…….125
Methods for Reformulating Energetics Units..……………………………………...126
Results of the Energetics Assessment at Moundville…………………………..…...134
Discussion………………………………………………………………...…...…….146
7. CONCLUSIONS AND SUGGESTIONS FOR FUTURE RESEARCH…………...147
Labor Organization at Moundville…...……………………………………………...149
Future Research……...………………………………...……………………………153
REFERENCES CITED…………………………………………………………………157
APPENDIX: Plaza Unit Artifacts.………….…………………………………………..176

vii
LIST OF TABLES
2.1. Volume estimates by Jones compared to the current gridding method
estimates……………………………………………………………………...…..26
2.2. Projected estimates for mound restoration recorded December 11, 1932
by Carl T. Jones…………………………………………………………….…...39
2.3. Comparison of Jones’s original volume estimates to the gridding
method results from various maps……………………………………….………42
2.4. Previous volumes of other Mississippian mounds from Muller (1997) compared to
current estimations using the gridding method.…………………...……………..47
3.1. Plaza fill locations and the estimated amount of soil added in each
location, added to the total fill estimated for the site.…….......………………….60
4.1. Current volume of the four borrow pits at Moundville ….……………………...….82
4.2. Texture, color, and description of soil from tests…………………………...……...96
4.3. Distance from mound or plaza fill to nearest possible extraction source…….….....99
5.1. Mass and compaction energy of mounds at Moundville……………………….....121
5.2. Mass and compaction energy of areas of plaza fill……………………………......122
5.3. Total volume and mass of plaza and mound fills at Moundville……………..…...124
6.1. Summary of the total energy of construction at Moundville, including
mound and plaza construction…………….……………………………………135
6.2. Energy of construction for three mound stages at Moundville……………………144
6.3. Number of construction days based on the estimated number of laborers…..……146
viii
LIST OF FIGURES
1.1. Location of Moundville in relation to other Mississippian sites…………………….6
1.2. Moundville sketch map showing 28 mounds and four lakes…………………...….10
1.3. Moundville timeline……………………………………………………………..…13
2.1. Illustrations of three solid geometry volume methods………................…………..28
2.2. Contour method ……………………….................................................…………..31
2.3. Wireframe map used to demonstrate the gridding method …………………….….34
2.4. Depiction of method used for calculating the volume of a mound of
an unlevel premound surface……………………………….......……………….36
2.5. Image representing differences in Positive, Negative, and Net volume...…………37
2.6. Aerial photograph of Moundville in 1938………………………………...……….38
2.7. Bar Chart and table showing the volume estimates using two geometric
formulas compared to Jones and the current volume assessment...……………...45
3.1. Plan map of Moundville showing previous plaza investigations ……….....………52
3.2. South wall profiles of six units crossing the plaza excavated by Driskell in
1988……………….......................................................................................…….53
3.3. Hypothetical profile drawing illustrating auger tests at different
levels of fill …………………………………….............................................…..59
3.4. Plan view of the auger survey, test excavations, and areas of
suspected fill. …………………..................................................................…….60
3.5. East profile of unit N 1930 E 1263………………………….....................………..63

ix
3.6. North (left) and East (right) profiles of Unit N 1760 E 1294...............……………67
3.7. North Profile of unit N 1791 E 778, east of Mound N …….……………………...69
3.8. North Profile of unit N 1891 E 776, east of Mound O ………....…………………70
3.9. Hectare N 1700 E 700 showing the depths of shovel tests by Thompson..………..72
3.10. Hectare N 1700 E 1000 showing the depths of shovel tests
conducted by Thompson…...……………………….............................................73
3.11. North profile of unit N 1960 E 762…………………...........................……………76
3.12. North Profile of Unit N 2021 E 784……………………................................……..76
4.1. Map of Moundville and the location of the current borrow pits…………………...81
4.2. Photograph by Dr. Robert S. Hodge taken in 1902…….……………………….….84
4.3. Aerial photograph of Moundville, 1933..…………………………………….……86
4.4. Aerial photograph of Moundville, 1936..……………...…………………………..87
4.5. A series of three photographs taken between January 1938 and August
1939 showing the excavations and restoration of Lake #4………………………88
4.6. Photograph taken in 1936 of the museum construction…………………...………..89
4.7. Map created by P.L. Cox and the National Park Service, 1938……………....…….90
4.8. An undated, rough sketch of the Moundville site ca. 1939...………………………92
4.9. Map showing the locations of soil samples..……………………………………….95
4.10. Map showing the distance from each mound to the nearest borrowing
location………………………………………………………………………….98
5.1. The sand cone apparatus and excavated hole…………………………………......104
5.2. The Proctor compaction test……………………………...……………………….108

x
5.3. Diagram showing the relationship between compaction energy,
moisture content, dry unit weight, and the zero-air-void curve………………109
5.4. Diagram of the compaction and in situ dry unit weight of
Mound R .……..………………………………………………………………119
5.5. Diagram of the compaction and in situ dry unit weight of
Mound V. ……..………………………………………………………………119
5.6. Diagram of the average compaction and average in situ dry
unit weight of plaza fills……………………………………………………….123
6.1. The three energy components as visualized for this study.…………....………….126
6.2. Illustration of southeastern Indians showing baskets being carried on the
back using either a shoulder strap or a tumpline. ………………..…...........….132
6.3. Bar chart showing total construction energy per mound…...…………..............…137
6.4. Hypothetical labor costs of earthwork construction at Moundville..……………..140
7.1. A model of labor organization for Moundville..………………………………….153

xi
ABSTRACT
In this dissertation, I attempt to quantify the amount of human energy employed
in earthen monumental construction at the Moundville polity in west-central Alabama, as
a means of exploring the organizational variability of the control of surplus labor and
material resources in an emerging complex society. To help reconstruct the scale of
sociopolitical differentiation invested in mound building, I create an assessment that
calculates the energy necessary to excavate, transport, and compact mound and plaza
soils. Theories and methods from other disciplines such as geotechnical engineering,
human physiology, human biology, and ergonomics combined with archaeology provide
a rational for reformulating the units of measure in energetic studies from person-hours to
kilojoules.
The analysis supports a model in which the mounds on Moundville’s plaza
periphery were constructed using kin-based labor, whereas the mounds on the central axis
of the site were constructed using work crews with laborers drawn from the population of
the entire polity. This division indicates that while elite power, which was symbolically
reinforced through conspicuous consumption of energy in the form of human labor, may
have been responsible for the construction of the largest mounds at Moundville, there was
still a strong emphasis on kin-based segments in terms of the allocation of labor and
material resources.

1
Chapter 1
Introduction
Elite control over labor is an important factor in the sociopolitical organization of
emergent complex societies. Energetics studies of monumental architecture are of benefit
to archaeological inquiry because they provide a method of examining how labor and
material resources were organized and controlled by ruling elites. Thus architectural
energetics (Abrams 1989, 1994) is a tool that can be used in modeling social
differentiation as it was reflected in the amount of energy deployed in the building of
various monumental forms. According to Abrams (1989:53), “Architecture, by virtue of
its capacity to absorb relatively large amounts of energy during production, can
hypothetically reflect a significant range of organizational behaviors requisite for such
construction, an important index of cultural complexity.”
Currently, there are contrasting sets of theory as to how surplus labor and material
resources were organized within emergent complex societies. One theoretical framework
suggests that monuments are fundamentally and universally indexes of elite power in
societies possessing centralized hierarchical authority, and that elite power was
symbolically reinforced through conspicuous consumption of energy as human labor
(Trigger 1990). Under this “power perspective,” monuments are viewed as testaments to
the ability of a centralized authority in a socially stratified situation, in which the political
elites use their coercive power to exert control over surplus food production, to organize

2
material resources, and to amass large quantities of labor for the construction of non-
utilitarian projects (Price 1978; Renfrew 1983; Steponaitis 1978; Trigger 1990).
Recently, however, this power perspective as applied to emergent complex
societies has been downplayed. Others suggest that sociopolitical differentiation within
and between communities is not solely based on social rank or the degree of distinctions
between elites and commoners (Blanton et al. 1996; Blitz and Livingood 2004; Brown
2006; Kelly 2006; King 2006; Knight 1998; Sullivan 2006; Welch and Butler 2006). As
Brown states (2006:198) there has been an “inclination to seek some hierarchical control
behind every engineered construction, a coercive power behind every substantial pile of
earth or stack of stone, and an economic pull behind every accumulation of exotic good.”
Such scholars portray the notion that monuments are symbolic of elite power exercised
over a subordinate population as too limiting, ignoring the roles of “heterarchical,”
horizontal, and communal relationships in constructing accurate narratives of prehistoric
societies.
These two competing interpretations of emergent complex societies are embedded
in current theories of Mississippian sociopolitical organization. Specifically in the case
of Mississippian mounds, mound size has been viewed as a direct reflection of the
organizational capabilities of a powerful sociopolitical hierarchy (Steponaitis 1978). In
contrast, Muller (1986, 1997), Milner (1998), and Hammerstedt (2004, 2005) have
argued that the labor involved in Mississippian mound construction did not necessarily
require powerful leadership structures, as it was not as burdensome on the general
population as is commonly believed. If the surplus was not organized by elites exercising

3
their power over their subordinates, it is reasonable to conclude that labor and materials
resources for mound construction were organized at a kin-based level.
Both top-down political economy perspectives and the recruitment of labor by
segmentary kin groups have been previously suggested for the Moundville chiefdom, a
Mississippian polity in West-central Alabama. Steponaitis (1978) argued for the
existence of a strong hierarchical political leadership at Moundville based on the size and
location of outlying single mound centers. The efficient spacing of these single mound
centers accompanied by the increasing size of mounds as the distance between the
secondary centers and the Moundville polity increased implied the allocation of labor as
possible tribute. Others have argued for a strong political hierarchy at Moundville based
on food tribute, prestige goods, and the distribution of material resources (e.g., Scarry and
Steponaitis 1997; Welch 1996). Based on the elite control over tribute and material
resources at Moundville, Welch (1996) suggests that mounds may have belonged to high
ranking members of a paramount chief's own kin group, as opposed to the possibility
suggested by Knight (1998) that mounds belonged to ranked kin-based social groups.
Knight proposed that Moundville’s layout represents diagrammatic ceremonial center,
and that the plaza periphery mounds were devices for stabilizing societal relationships
between ranked kin groups. This would imply that mound construction was organized
and executed by segmentary kin groups, not the overseeing elites.
In this dissertation, I attempt to quantify the amount of human energy employed
in earthen monumental construction at Moundville, Alabama, as a means of exploring the
organizational variability of the control of surplus labor and material resources in an
emerging complex society. To help reconstruct the scale of sociopolitical differentiation

4
invested in mound building, I create an assessment that calculates the energy necessary to
excavate, transport, and compact mound and plaza soils. I express the results in the form
of kilojoules (kJ), as opposed to the traditional unit of measure, person-hours. Based on
the energy expended for each monumental form, I address the manner in which power
over surplus labor and material resources may have been controlled in a Mississippian
(ca. AD 1000 – 1550) polity. Put simply, I attempt to answer the question of whether the
Moundville landscape could have been constructed using labor entirely recruited within a
segmentary system such as kin groups, or in contrast whether the scale of monument
building required some form of political control whose power transcended the level of
segmentary kin groups. I assume that if the calculated energy and number of laborers
needed to construct a monument exceeds the quantity likely available to an average-sized
kin segment, then the organization of labor was probably on a supra-kin basis (Fried
1960), in which case pooled labor was extracted from the entire polity.
Analytical Approaches to Monumental Architecture
The correlation between architecture and the degree of sociopolitical complexity
was first explicitly stated by Lewis Henry Morgan (1881) in the late nineteenth century.
Architecture continued to be a defining aspect of anthropological applications as an index
of cultural stages well into the twentieth century (Childe 1950; Fried 1967; Service
1962). With the onset of processual theory in archaeology, archaeologists began to utilize
the theories of Leslie White (1943, 1953, 1959), who was one of the first anthropologists
to make a connection between the energy captured by a society and the degree of social
complexity (Arnold and Ford 1980; Binford 1972; Erasmus 1965; Peebles and Kus 1977;
Renfrew 1983; Sanders and Price 1968). The more recent emphasis by processual
5
archaeologists on energy in archaeology naturally gravitated towards studies of
monumental architecture, as these structures were the largest “consumers” of energy.
This marked the beginning of the study of architectural energetics (Abrams 1989, 1994).
In examining monumental architecture, there have been two approaches used to
quantify variation among types of structures. The first method, volumetrics, measures
architecture in terms of the volumes of materials used in construction. This technique is
the one most commonly used by southeastern archaeologists to quantify Mississippian
platform mounds (e.g., Anderson 1994; Blitz 1993; Blitz and Livingood 2004; Hally
1994, 1996; Lindauer and Blitz 1997; Payne 1994; Steponaitis 1978; Williams and
Shapiro 1996). The other method of quantifying architecture is by estimating the
amount of energy required to build or modify a structure. This approach, frequently
referred to as energetics, uses volume as well as other variables to calculate labor-cost
estimates (Abrams 1989, 1994; Abrams and Bolland 1999; Craig et al. 1998; Erasmus
1965; Hammerstedt 2004, 2005; Milner 1998). Most energy assessment studies in
archaeology rely heavily on middle-range theory, such as ethnographic and experimental
data, to construct labor-cost estimates in the form of the amount of time invested in
structures. The resultant measurement is typically expressed in person-hours (p-h) or
person-days (p-d). This study will explore an alternative measure for energetics based on
the amount of heat produced in energy expenditure, as used in physics or biochemistry.
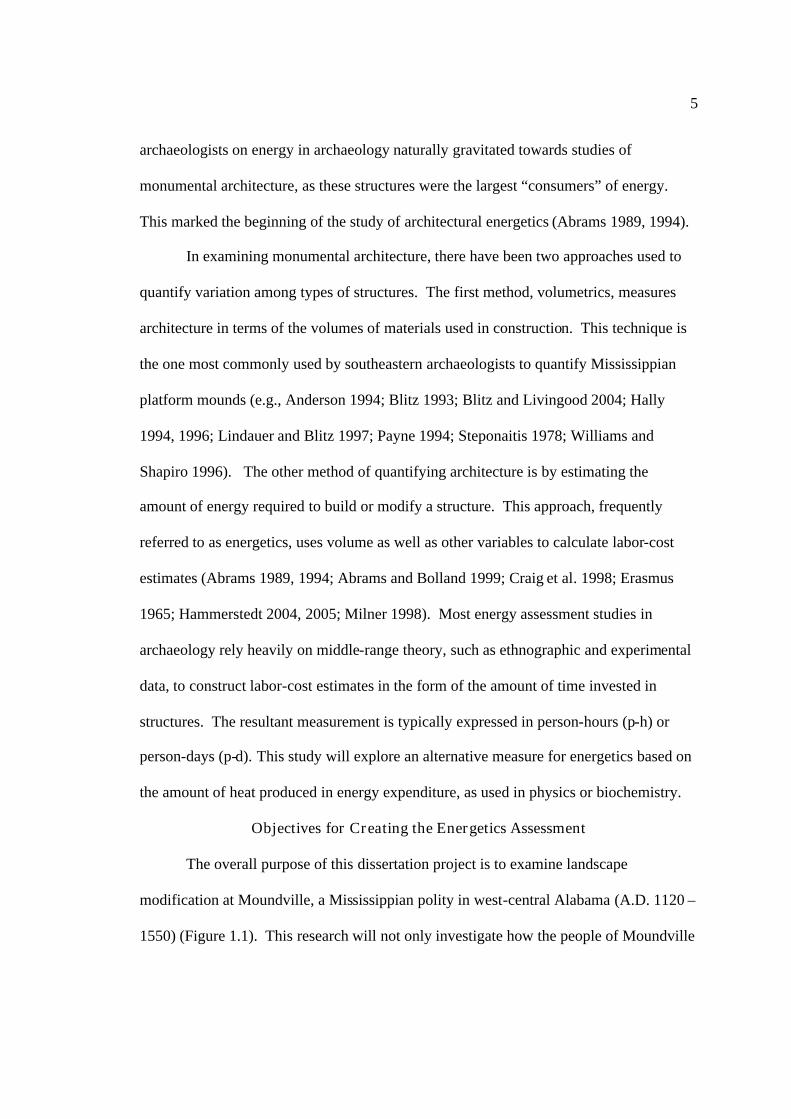
Objectives for Creating the Energetics Assessment
The overall purpose of this dissertation project is to examine landscape
modification at Moundville, a Mississippian polity in west-central Alabama (A.D. 1120 –
1550) (Figure 1.1). This research will not only investigate how the people of Moundville

6
Figure 1.1. Location of Moundville in relation to other Mississippian sites.
altered their landscape with large amounts of soils strategically placed over 75 hectares
(185 acres), but will attempt to measure how much human energy it took to create the
overall design. To create an energetics assessment with the ending result expressed in
kilojoules, four objectives had to be undertaken. First, the volume of all culturally
positioned soils will be accurately accounted for including the soil needed to create the
mounds as well as any soil that may have been used to level or flatten the plaza. The
volume of 32 mounds was last calculated in 1936 by geologist Walter B. Jones, using an
unknown method of estimation. Using both early and the more recent topographic and
photogrammetric data, the volume of each mound will be recalculated using computer
software.
Secondly, there is evidence to suggest that large amounts of soil extending
outward from the plaza side of the mounds was laid down in order to level the outer
95o W 90o W 85o W 80oW
30o
N3
5oN
40o
N
Moundville
E towah
Cahokia
Spiro
A ngel
HiwasseeIsl and
LakeGeorge
7
edges of the plaza (Knight 2009b; Knight and Steponaitis 1998). This plaza-leveling
construction would have required similar organization and energy to accomplish as did
the mound building and thus is included in the energetics assessment. Auger testing and
excavations are employed in this study to test for plaza leveling and determine the depth
and horizontal extent of these soils. The volume of the plaza fill will be added to the
newly calculated total volume of the mounds to provide a more accurate volumetric
estimate of the culturally placed soil at the site.
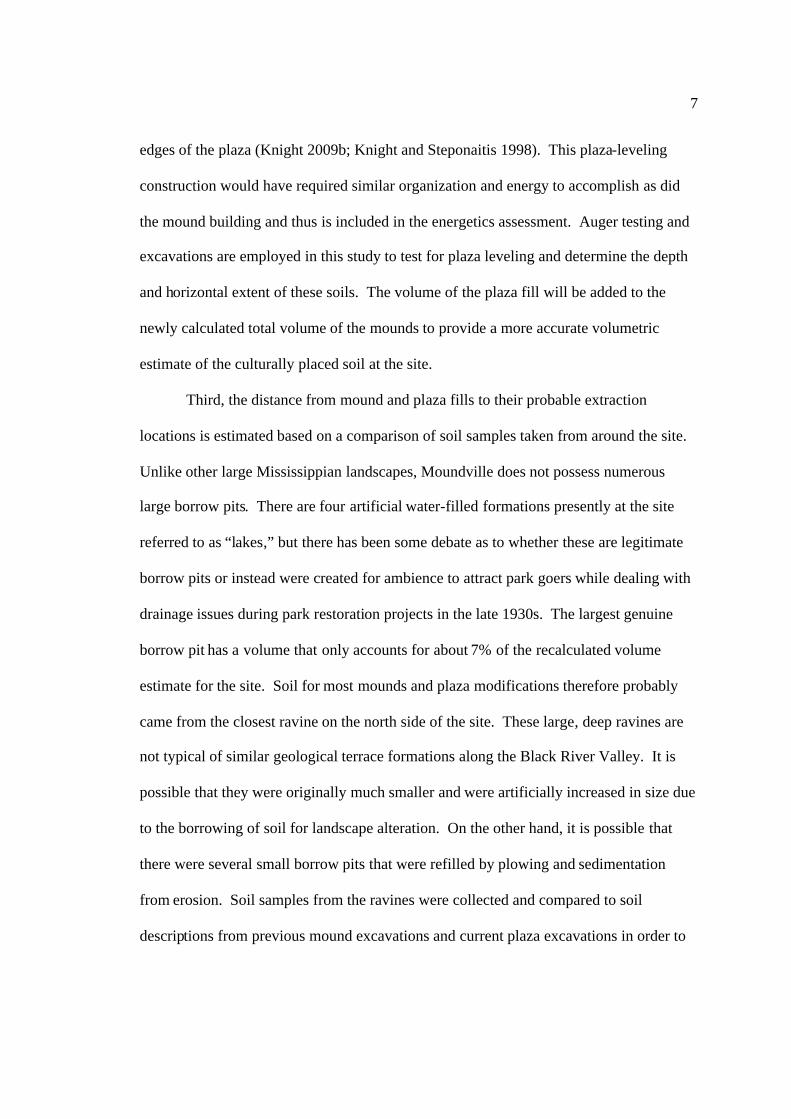
Third, the distance from mound and plaza fills to their probable extraction
locations is estimated based on a comparison of soil samples taken from around the site.
Unlike other large Mississippian landscapes, Moundville does not possess numerous
large borrow pits. There are four artificial water-filled formations presently at the site
referred to as “lakes,” but there has been some debate as to whether these are legitimate
borrow pits or instead were created for ambience to attract park goers while dealing with
drainage issues during park restoration projects in the late 1930s. The largest genuine
borrow pit has a volume that only accounts for about 7% of the recalculated volume
estimate for the site. Soil for most mounds and plaza modifications therefore probably
came from the closest ravine on the north side of the site. These large, deep ravines are
not typical of similar geological terrace formations along the Black River Valley. It is
possible that they were originally much smaller and were artificially increased in size due
to the borrowing of soil for landscape alteration. On the other hand, it is possible that
there were several small borrow pits that were refilled by plowing and sedimentation
from erosion. Soil samples from the ravines were collected and compared to soil
descriptions from previous mound excavations and current plaza excavations in order to

8
evaluate the idea that the majority of soil for mound and plaza construction came from
ravines and not primarily from borrow pits at the site.
Fourth, in order to calculate the energy needed for mound construction, the mass
and density of each earthwork are estimated in addition to its volume. Geotechnical
engineering methods, such as the sand cone test and the Proctor compaction test, will be
applied to the landscape in order to calculate the density, mass, and compaction of the
earthworks. The density of each of the four plaza units possessing evidence of artificial
plaza was measured, as well as the density from the outer-most construction stages of two
mounds; Mounds R and V. The density calculated from the sand cone test, and the newly
estimated volume of the mounds and plaza fill allowed the mass of each earthwork to be
calculated, using the formula – Volume x Density = Mass.
The unit of measure for human energy expenditure will be kilojoules (kJ) as
opposed to person-hours. In so doing, I am not challenging the energetics method as
previously applied, but rather proposing a new unit of measure for human energy of
earthen mound construction and deposits. The results are not meant to reflect prehistoric
energy expenditure empirically, but meant to demonstrate a new model for classifying
and differentiating among monumental landscapes. Informed assumptions will need to
be made concerning variables such as the weight of the average basket load of fill,
distance to fill source, and method and rate of transportation, to name a few. These
variables will be estimated using data from both archaeology and other disciplines
outside of anthropology. Although these assumptions may be open to question, the
resulting model of Mississippian landscape modification energy can be applied to other
Mississippian sites and refined as new information becomes available (e.g., Abrams
9
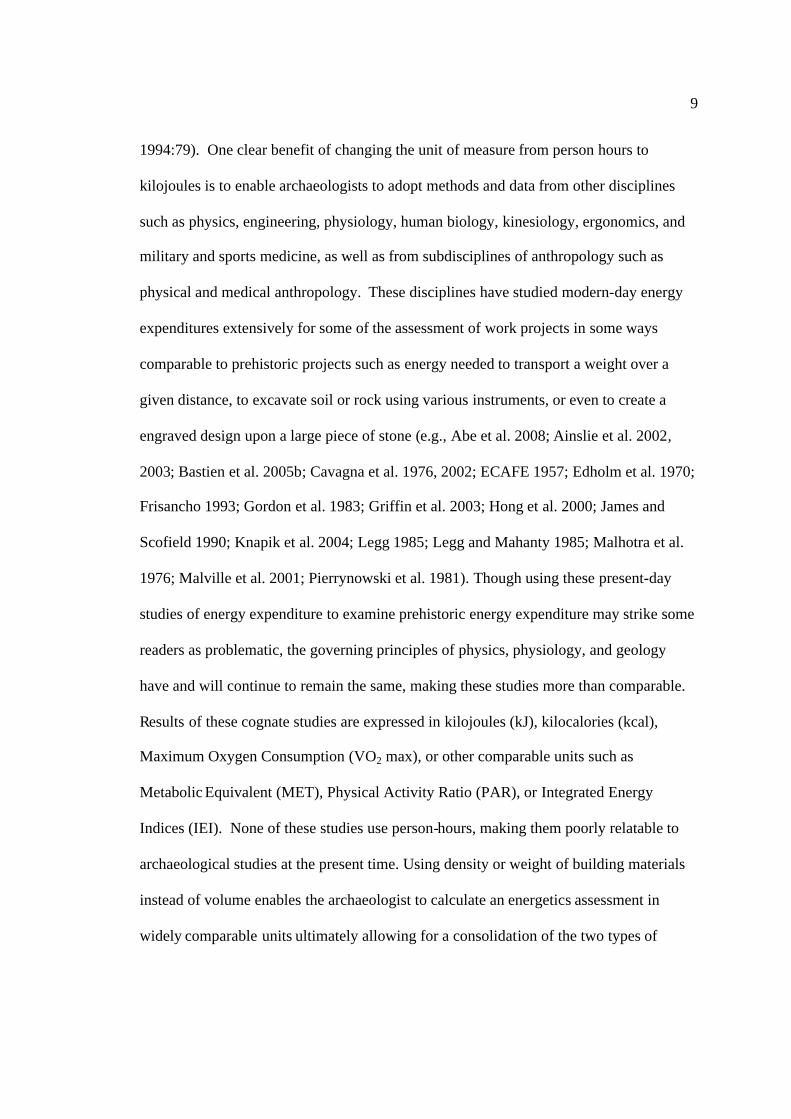
1994:79). One clear benefit of changing the unit of measure from person hours to
kilojoules is to enable archaeologists to adopt methods and data from other disciplines
such as physics, engineering, physiology, human biology, kinesiology, ergonomics, and
military and sports medicine, as well as from subdisciplines of anthropology such as
physical and medical anthropology. These disciplines have studied modern-day energy
expenditures extensively for some of the assessment of work projects in some ways
comparable to prehistoric projects such as energy needed to transport a weight over a
given distance, to excavate soil or rock using various instruments, or even to create a
engraved design upon a large piece of stone (e.g., Abe et al. 2008; Ainslie et al. 2002,
2003; Bastien et al. 2005b; Cavagna et al. 1976, 2002; ECAFE 1957; Edholm et al. 1970;
Frisancho 1993; Gordon et al. 1983; Griffin et al. 2003; Hong et al. 2000; James and
Scofield 1990; Knapik et al. 2004; Legg 1985; Legg and Mahanty 1985; Malhotra et al.
1976; Malville et al. 2001; Pierrynowski et al. 1981). Though using these present-day
studies of energy expenditure to examine prehistoric energy expenditure may strike some
readers as problematic, the governing principles of physics, physiology, and geology
have and will continue to remain the same, making these studies more than comparable.
Results of these cognate studies are expressed in kilojoules (kJ), kilocalories (kcal),
Maximum Oxygen Consumption (VO2 max), or other comparable units such as
Metabolic Equivalent (MET), Physical Activity Ratio (PAR), or Integrated Energy
Indices (IEI). None of these studies use person-hours, making them poorly relatable to
archaeological studies at the present time. Using density or weight of building materials
instead of volume enables the archaeologist to calculate an energetics assessment in
widely comparable units ultimately allowing for a consolidation of the two types of

10
Figure 1.2. Moundville sketch map showing 28 mounds and four lakes.
studies in which human physiological data may be directly applied to archaeological
problems.
Research Setting: Moundville, Alabama
Moundville is a large Mississippian mound complex located in west-central
Alabama. The landscape is composed of at least 32 earthen mounds stretching over 75
hectares (185 acres) on a high level terrace overlooking the Black Warrior River (Figure
1.2). The mounds are arranged in a quadrilateral fashion around the oddly orientated
Mound A and a large central plaza, with the Black Warrior River marking the northern
boundary of the site. All of the mounds on the periphery of the plaza are aligned with the
cardinal directions, with the longer sides of these mounds facing the plaza. The mounds
A
B
V
CD
E
FF1
F2
S
GX
H
T
IJKL
M
M1
N
OW
P
Q
R
B1
U
R1
0 100 m
1
Lake #4
Lake
#3
Lake#2
Lake #1
11
range from less than a meter in height to more than 17 meters (3 – 56 ft), the average
mound height being roughly 5 meters (16 ft).
The spatial arrangement of the mounds at Moundville is more orderly and
methodical than the layout at many other Mississippian mound centers. A bilateral
symmetry is believed to exist between the east and west halves of the site, creating an
imperfect mirror image (Knight 1998; Peebles 1971, 1974, 1983). The bisecting north-
south line runs through Mound B and a portion of Mound V on the northern end,
continues southward through Mound A, and runs between Mounds J and K at the
southern margin of the plaza. The fifteen largest mounds arranged around the plaza
alternate between large earthworks without burials and small mounds containing burials.
In addition, certain mounds appear to have a parallel counterpart in size and use across
the plaza in relation to the bilateral symmetry of the site.
Accompanying the east-west symmetry, there is a north to south trend in the
elaborateness of burials and the size of mounds. The most elaborate burials and grave
goods occur at the northern end of the site and generally decrease in elaborateness as one
moves south (Knight 1998; Peebles 1974). The size of the plaza periphery mounds
without burials also decreases in a southward direction on either side of Mound B. The
plaza periphery mounds without burials are larger monuments than the smaller plaza
periphery mounds containing burials.
The layout of Moundville is believed to represent a sociogram, a physical design
that inscribes the ranking of corporate segments within the community permanently upon
the landscape (Knight 1998). It is hypothesized that the diagrammatic nature of the
landscape was intentionally created to emphasize fixed social distinctions between kin

12
groups, which determined the size and placement of mounds around the plaza. The larger
mounds are believed to represent the higher ranking groups while the smaller mounds are
believed to represent the segments of lesser rank. In addition, each large plaza periphery
mound without burials has at least one, or in some cases two, corresponding smaller
mound with burials, which supports the idea that pairs of mounds were associated with
specific kin segments.
The Moundville polity is believed to encompass a 5 kilometer wide portion of
Black Warrior River valley, extending northward from the Moundville site approximately
25 kilometers and approximately 15-35 km southward from the Moundville site
(Bozeman 1981; Peebles 1987; Steponaitis 1983a; Welch 1990, 1998). The occupation
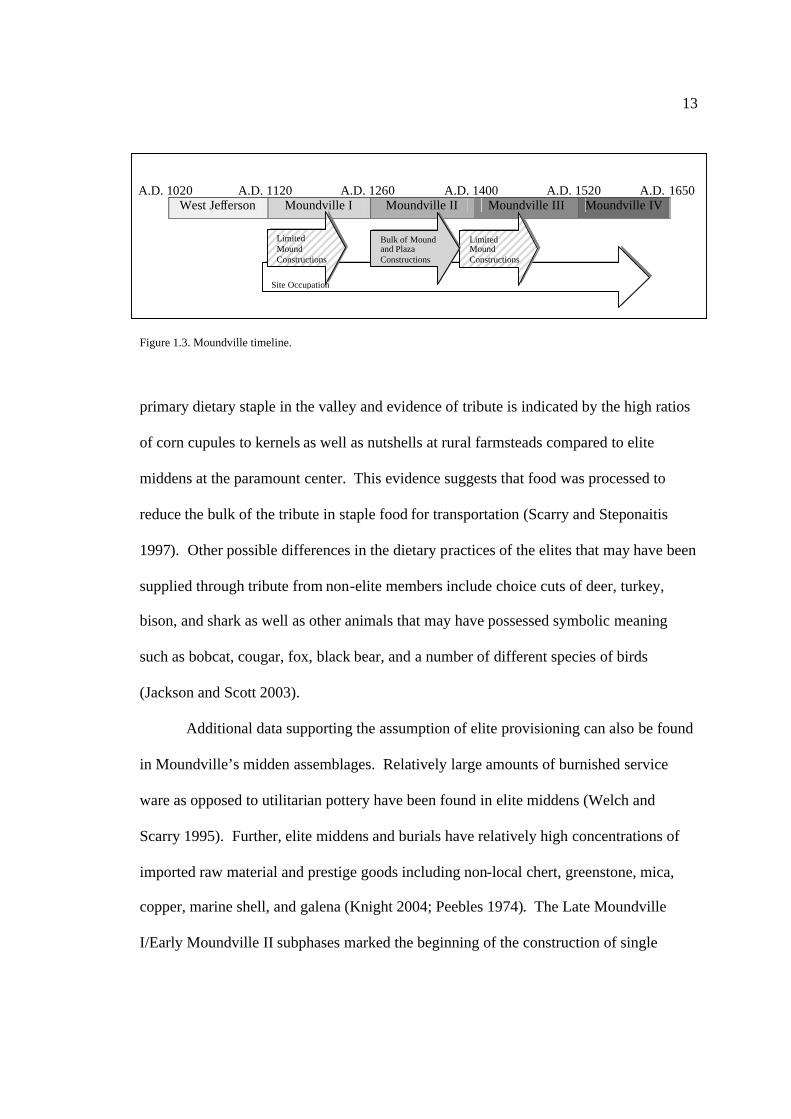
of the polity is divided into four phases; Moundville I (A.D. 1120 – 1260), Moundville II
(A.D. 1260 – A.D. 1400), Moundville III (A.D. 1400 – 1520), and Moundville IV (A.D.
1520 – 1650). The paramount center was first inhabited during the onset of the
Moundville I phase (A.D. 1120 – 1260) (Figure 1.3). The only two mound constructions
during the initial occupation of the site were the Asphalt Plant mound (1Tu50)
(Steponaitis 1992; Welch 1998), a small mound less than 1,000 m northeast of
Moundville, and Mound X (Blitz 2007). Physical transformation of the site also includes
a defensive palisade, erected and maintained from approximately AD 1200 to AD 1300,
being rebuilt six times (Scarry 1995, 1998). The Late Moundville I and Early
Moundville II subphases represent the climax of physical modification to the site, which
would thereafter continuously decline over the next 300 years.
The earliest evidence of food tribute from commoners in rural farmsteads to elites
at the center also corresponds to this initial construction phase. Maize had become the
13
Figure 1.3. Moundville timeline.
primary dietary staple in the valley and evidence of tribute is indicated by the high ratios
of corn cupules to kernels as well as nutshells at rural farmsteads compared to elite
middens at the paramount center. This evidence suggests that food was processed to
reduce the bulk of the tribute in staple food for transportation (Scarry and Steponaitis
1997). Other possible differences in the dietary practices of the elites that may have been
supplied through tribute from non-elite members include choice cuts of deer, turkey,
bison, and shark as well as other animals that may have possessed symbolic meaning
such as bobcat, cougar, fox, black bear, and a number of different species of birds
(Jackson and Scott 2003).
Additional data supporting the assumption of elite provisioning can also be found
in Moundville’s midden assemblages. Relatively large amounts of burnished service
ware as opposed to utilitarian pottery have been found in elite middens (Welch and
Scarry 1995). Further, elite middens and burials have relatively high concentrations of
imported raw material and prestige goods including non-local chert, greenstone, mica,
copper, marine shell, and galena (Knight 2004; Peebles 1974). The Late Moundville
I/Early Moundville II subphases marked the beginning of the construction of single
West Jefferson Moundville I Moundville II Moundville III Moundville IVA.D. 1020 A.D. 1120 A.D. 1260 A.D. 1400 A.D. 1520 A.D. 1650
Site Occupation
LimitedMoundConstructions
Bulk of Moundand PlazaConstructions
LimitedMoundConstructions

14
mound secondary centers, while other earlier mound sites were abandoned. These
secondary centers included Jones Ferry, Poellnitz, and Hog Pen (Welch 1998), and were
presumably created to aid in the flow of tribute to the paramount center.
Around the beginning of the Moundville II phase (A.D. 1260 – 1400) most of
Moundville’s inhabitants vacated the site, returning to farmsteads spread throughout the
valley. This depopulation of the site occurred either before or shortly after the late
Moundville I phase (A.D. 1190-1260) (Wilson 2008), possibly before any of the earthen
monuments surrounding the plaza were constructed. Many secondary centers remained
in use and more were created, presumably to manage an increasing rural population
(Welch 1998) that could have reached as high as 10,000 people (Peebles 1987). The only
people still residing at the center were perhaps elites, including those living on mounds
and their retainers. Near the end of this phase, many elites, especially those previously
occupying mounds on the southern half of the site, began to vacate as well. Mound
construction and habitation stopped except for Mounds B, E, G, P, Q, R, and V.
Evidence for the emptying of the site is indicated by the lack of late Mississippian
architecture, the lack of domestic middens of this period, and a discontinuation of the
palisade. However, the site maintained its mortuary role, with the deceased from
throughout the valley imported to the site for burial (Knight and Steponaitis 1998). Elite
burials were most elaborate during this time, marked by elaborate symbolism, non-local
materials, and prestige items (Peebles 1974; Peebles and Kus 1977). Evidence suggests
that elites were physically and symbolically distancing themselves from the general
population. However, the tributary economy continued unabated.

15
Several additional mounds at the center were abandoned after the beginning of the
Moundville III phase (A.D. 1400 – 1520). The only mounds still inhabited after about
AD 1450 were Mounds P, B, and E, among the largest residential mounds on the north
side of the center. The occupation of these three mounds lasted until approximately A.D.
1550, although there were no earthen constructions or modifications made at the site after
A.D. 1450 (Figure 1.3). Moundville still retained its mortuary role after AD 1450, but its
importance as such was declining. Cemeteries were being established at the functioning
single mound centers instead of interring the dead at Moundville. Evidence of the
provisioning of elites at secondary centers is also still evident during this period (Welch
1991). The settlement pattern of the Black Warrior River Valley inhabitants ultimately
returned to that of large villages, for the first time since the West Jefferson phase five
centuries earlier. All secondary mound centers were abandoned by A.D. 1550.
The Spanish explorer Hernando de Soto came through west-central Alabama in
the fall of 1540 during his four year expedition (A.D. 1539-1543). This occurred at
roughly the same time as the beginning of the Moundville IV phase, during which a small
portion of the paramount center is believed to have still been inhabited. No evidence of
De Soto has been found at the center. Hudson and colleagues (1990) believe that De
Soto’s travels passed through the Black Warrior valley and perhaps even to Moundville,
although his arrival did not facilitate the decline of the site, which had already begun
(Knight and Steponaitis 1998).
The details of the cultural chronology are important when studying the
modifications of an archaeological landscape. Based on this information, we know that
the majority of the mounds at Moundville were constructed in a short time, probably over

16
little more than a century (A.D. 1250 – 1350). It also is known that constructions at a
few mounds, mainly the ones on the northern side of the site, continued for another
century after the remaining mounds had been abandoned. The simultaneous construction
of the major mounds early in the site’s history also indicates a deliberate community
plan, not a landscape of mounds added gradually over time (Knight 1989). It also is
suspected that the peak resident population was relatively small, being around 1,000
people (Steponaitis 1998), many who might have vacated the ceremonial center prior to
the time of peak mound construction (Wilson 2008).
Energetics in Archaeology
One of the first energetics studies in archaeology was conducted by Charles
Erasmus in the Yucatán peninsula during the summer of 1964. Erasmus (1965), in an
experimental study involving Mexican peasants, calculated the volume of rock and soil
that could be excavated and carried various distances per day in order to collect data on
the amount of manpower needed to complete various construction tasks required for the
creation of Maya ceremonial centers such as Uxmal. Having estimated a manpower value
for the site construction, Erasmus was able to compare his measurement of labor
investment with population density estimates and calculate the number of person-days
per year invested by each household.
An important measure used by Erasmus was the unit referred to as man-days,
referred to herein as person-days. For a given monumental structure, this measure is the
total volume of rock or soil making up that structure divided by the amount of rock or
soil a single person in an experimental study can move in one five-hour period. Thus
person-hours or person-days are measures used by archaeologists for the purpose of
17
quantifying human labor. In his experiments, he concluded that a single person could
excavate 2.6 m3 with a digging stick or transport 3.17 m3 over a distance 50 meters in a
five-hour day.1 It should be noted that in most studies, unless specified otherwise, a
person-day is composed of five person-hours, as Erasmus (1965) noted that the
productivity of his laborers declined significantly after five hours. Using these data,
Erasmus calculated that the total amount of labor including “fill, masonry, stonecutting,
and stone sculpturing” to create the Uxmal ceremonial center equaled 7.5 million person-
days (or 37,500,000 person-hours) over its 250 year occupation (Erasmus 1965:294).
To determine who fulfilled this person-day requirement, Erasmus considered
average house size and population density among the modern Maya as a starting point,
although he acknowledged the problems of using modern day comparisons based on
changes in population, resources, and social structure. Using modern population density
and consumption statistics of the natives of Tikul, Yucatán, Erasmus (1965:295)
concluded that each family of five would need around 20 acres to produce enough food
for the year. Erasmus applied these estimates to a five mile radius surrounding the
Uxmal center. Five miles, or 2 to 2 ½ hours walking distance, was chosen because
Erasmus’s (1965: 296) informants claimed that this was the maximum distance one could
walk to their fields and back without having to set up temporary shelters. Given the area,
1,200 families would have been included in the potential resident working population of
Uxmal. Estimating 40 person-days contributed by each family per year, the total would
amount to 48,000 person-days (240,000 person-hours) per year. At this rate the
ceremonial center could have been constructed in approximately 150 years.
1 These measurements have also been expressed as 0.52 m3 soil excavated in one hour or 1.9 person hoursper m3 of excavated earth and 0.63 m3 transported 50 m in one hour or 1.58 person hours to transport 1 m3 adistance of 50 m.

18
Elliot Abrams (1994) revised the idea of labor estimates based on energy in his
study of Maya architecture at Copan, a methodology which he referred to as
“architectural energetics.” For Abrams (1994:1-2), “architecture energetics involves the
quantification of the cost of construction of architecture into a common unit of
comparison – energy in the form of labor-time expenditure.” Abrams applied this
methodology in examining wattle and daub and stone Maya houses. However, even with
new methods and estimates for quantifying energies used in procuring, manufacturing,
transporting, and constructing various forms of Maya architecture, Abrams expressed his
results in the same unit as Erasmus, that is to say, in person-hours.
Likewise, Scott Hammerstedt (2004, 2005; Milner and Hammerstedt 2004) has
applied Erasmus’s method to Mississippian stage architecture, in order to estimate the
quantity of labor used in the creation of three stages of an earthen platform mound and
the construction of three corresponding palisades at the Carlson Annis site in west-central
Kentucky. He accomplished this, as did Erasmus (1965), by employing individuals to
excavate and carry soil to a specific location using the most typical Mississippian digging
instrument in Kentucky, the Mill Creek chert hoe. Labor was quantified using person-
hours. He concluded that each phase at the Carlson Annis site was marked by increased
mound volume and increased area circumscribed by the palisade. Yet overall, each phase
utilized a relatively low labor cost even when accounting for only a small portion of the
population participating.
Bernardini (2004) conducted an energetics analysis of five Hopewell geometric
complexes (AD 1-500) in south-central Ohio. For the Hopewell, labor organization was
accomplished without a large fixed settlement from which labor could be drawn.

19
Although, this absence of a large fixed settlement is not the case for the Moundville
polity, Bernardini’s (2004) methodology is applicable to this energetics study. Using the
number of person-hours invested in construction of a monument, Bernardini estimated
the number of laborers, the durations of construction for each monument, and the labor
catchment areas for each complex.
Bernardini (2004) calculated the volume of each earthen embankment by using
the formula for a trapezoid multiplied by the embankment length. The excavation energy
was calculated by multiplying the volume of an earthwork by the experimental data
collected by Erasmus (1965): 1.9 person hours per cubic meter of excavated soil using a
digging stick. The transportation energy was calculated by multiplying 0.32 person hours
for every 10 meters by the volume of the earthworks. Using the person hours calculated
for the five Hopewell geometric complexes, Bernardini (2004) further estimated the
duration of labor in terms of the number of days per year devoted to construction.
Assuming that communal projects took approximately 25-50 productive work days
(Erasmus 1965), Bernardini estimated labor crew sizes for each construction project
based on three possible durations for construction; 1 year and 5 years for single geometric
shapes and 5 and 10 years for entire earthen complexes. These work durations of 5 and
10 years, are not assumed to have been carried out consecutively. He concluded that the
largest constructions of a single geometric shape would have required 1,000 to 2,700
laborers if it was to be erected in a single year. More conservative estimates of individual
geometric shapes constructed in five years would have required between 200 and 550
laborers. For the construction of an entire geometric complex, 300 to 600 workers per
year would have been needed working for 5 years, and 150 – 400 laborers would be

20
needed per year working over ten years. Like Erasmus (1965), Bernardini (2004) uses
the estimates of laborers per year to consider the size of the labor catchment areas needed
to supply different numbers of laborers.
These are only a few published studies employing experimental mound
construction and erosion (Bell et al. 1996; Breuning-Madsen et al. 2001; Macphail et al.
2003), labor estimates for building monumental structures (Carmean 1991; Craig et al.
1998; Millon et al. 1965; Milner 1998; Muller 1986, 1997; Reed et al. 1968), and
architectural energetics (Abrams 1989, 1994; Abrams and Bolland 1999). In the interest
of space, a synopsis will be presented and limited to the studies described above and how
each differs from this current research. Neither Erasmus (1965), Abrams (1994),
Hammerstedt (2004), nor Bernardini (2004) accounted for one important variable in their
studies of earth moving activities, the density of the soil.2 Geotechnical testing may be
employed in similar research to determine the total mass of the earthwork being
measured, instead of just the volume. Density is important because different soils of the
same volume may have substantially different weights. Therefore, the amount of energy
needed to create a monumental earthen mound could be dramatically affected by the
density of the mound fill. For instance, two mounds of the same volume might be judged
as requiring similar work forces and energy requirements. However, one may have been
created using heavier soils, and would therefore represent a greater labor investment.
Another variable that has not been accounted for in previous energetics
assessments of mound construction is compaction. Compaction, or the energy needed to
compact soil, may have been applied in order for the mounds to retain their idealized
2 Erasmus measured weight (mass) and volume of soil carried in his earth moving experiment but did notdirectly calculate density.

21
shapes. I propose that the compaction energy may vary among mounds. Obviously,
compaction of earthen mounds would be highly variable due to factors such as the height
of the mound, the type of soil used, the number of building episodes, the method of
construction, or perhaps the importance of the mound, to name a few possibilities. Many
Mississippian mounds are composed of different soils with different densities, chosen for
their specific qualities. Often a heavy clay stage, used as sheathing and as a surface for
occupation, alternates with a less dense stage used to increase mound size. Ideally, one
would know the density of each construction stage in building an energetics assessment
that accounts for various compaction energies.
Organization of Chapters
The following chapters are organized according to each of the four objectives
needed to complete the energetics assessment. Chapter 2 reviews the relevant literature
needed to achieve the first objective, recalculating the amount of soil needed to create the
earthen mounds. Previous volume measuring techniques for earthen monumental
structures, including those using solid geometry and planimetry are reviewed. In
addition, a new technique is presented which measures volume of earthen monuments
using computer software. Using this proposed method, the volume of each earthwork at
Moundville is recalculated to provide a new estimate for the entire site. The newly
calculated total for the earthen mounds at Moundville is then compared to other
Mississippian mound centers.
Chapter 3 addresses the second objective of the energetics assessment, evaluating
evidence of plaza modification at Moundville. Relevant information concerning plazas
throughout the Southeast as well as previous excavations of Moundville’s plaza will be

22
reviewed. Concluding the discussion of the relevant literature, the auger tests and
excavations undertaken specifically for this study will be summarized including data on
soil stratigraphy, features, and the artifact collections. Using the same methods for
calculating the volume of the mounds, the volume of the identified plaza additions will be
calculated.
Estimating distances from each mound or plaza construction site to the extraction
source, the third objective, is presented in Chapter 4. These distances are important when
calculating the amount of transportation energy involved in the construction process. In
order to accurately estimate distances, the authenticity of the four borrow pits at the site is
examined and comparisons of the plaza and mound fill to soils collected from borrow pits
and various other potential borrow areas around the site are discussed. Differences in the
composition of natural terrace soils at different places may indicate general areas for soil
extraction, whether from the ravines or borrow pits.
The final objective for the energetics assessment is to measure the density and
compaction of the mound and plaza fills. Chapter 5 summarizes geotechnical
engineering methods of the sand cone density test, a measure employed to calculate the
density of an earthwork, and the Proctor compaction test, a test used to estimate the
amount of mechanical compaction energy invested in an earthen structure. Then, using
the new volume calculations of mound and plaza fills and the estimated density of these
soils, the mass of the earthworks is obtained. For the density and compaction testing, I
am forced to make uniform assumptions about mound density and compaction energy
because of a limited sample and my overall soil density measurements for Moundville are
unlikely to be very accurate due to the factors described previously. This research will

23
however still attempt to test the earthworks at Moundville to estimate the density and the
amount of mechanical compaction energy invested in mound and plaza construction.
Chapter 6 offers the equations and the methods for calculating the energetics
assessment. This chapter will estimate the energy needed to excavate, transport, and
compact mound and plaza soils and combine them to estimate the total human energy
expenditure for Moundville’s earthen landscape. This study differs from other energetics
studies in archaeology, not only because of its conception of the three components of
energy, but also because of the reformulated units of measure. Theories and methods
from other disciplines such as geotechnical engineering, human physiology, human
biology, and ergonomics combined with archaeology provide a means for reformulating
the units of measure in energetic studies from person-hours to kilojoules.
In concluding this research, data obtained from the energetics assessment
(Chapter 6) is used to make assumptions concerning the organization of labor at
Moundville in Chapter 7. Control over non-kin groups has been a major theoretical
assumption about complex societies and is one of the theoretically defining
characteristics of both chiefdoms and early states. In this final chapter, three mound
building episodes requiring various amounts of energy expenditure are compared to
determine which constructions were created using kin-based labor and which ones were
constructed using collectively pooled labor from the entire community. Results support a
new model in which the plaza periphery mounds were constructed using solely kin-based
labor, except for those largest mounds on the central axis of the site, Mounds A, B, and V
and the palisade, which were constructed by collectively-pooled work crews under
centralized leadership of Moundville’s elites.

24
Chapter 2
Calculating Mound Volume at Moundville
Mound volume is an important variable when examining the sociopolitical
implications of mound building (Blitz and Livingood 2004). Mound size is often thought
to reflect the organizational capabilities of high ranking individuals who arrange and
manage a large work force that invests a tremendous amount of labor on behalf of the
elite (Haas 1982; Steponaitis 1978). However, recent research in the form of labor
estimates suggests that mound building would not have distracted people from everyday
activities and was not as demanding as originally believed (Hammerstedt 2004; Milner
1998; Muller 1997). In pursuit of creating an accurate model of energy expenditure
concerning mound building at Moundville, I have begun to question previous methods
for measuring mound volume. As volume is the central unit of measure in calculating the
amount of effort involved in mound construction, an accurate assessment of size is
essential.
The volume of the earthworks at Moundville was originally assessed by Walter B.
Jones of the Alabama Museum of Natural History in 1936 (notes on file, Alabama
Museum of Natural History) and others have subsequently used these data (Blitz and
Livingood 2004; Knight 1998; Payne 1994). Jones did not specify the formulas or
measurements he used to calculate the size of these 32 earthen structures. The majority
of his estimates, however, are considerably larger than those obtained using geometric

25
formulas of comparable solids. In this chapter, volume estimates of the mounds at
Moundville are calculated using topographic maps and a technique for quantifying
volume with the aid of computer software. Overall, the results indicate that the size of
mounds has been exaggerated; the previously estimated volume of some earthworks is
more than 50 percent higher than the current calculations (Table 2.1). Consequently, the
estimate for the total volume of mound fill for the site is herein reduced from 275,000 m3
to 192,000 m3; a difference of almost 85,000 m3. Various techniques for measuring the
amount of earth moved for monumental constructions will be discussed with the intent to
demonstrate that a certain technique, referred to in this study as the gridding method, is
most suitable for calculating mound volume. Before introducing the gridding method,
alternative techniques of measuring mound size will be briefly reviewed. Following the
discussion of volume measuring procedures, new estimates for Moundville will be
reported and compared to other Mississippian mound sites.
Previous Volume Measuring Techniques
In archaeology, several methods have been used to estimate the size of mounds.
Most procedures use volume formulas derived by matching the shape of an earthwork, in
both plan and profile, to a closely related geometric solid. Three-dimensional shapes
including rectangular prisms, cones, cylinders, circular paraboloids, and various forms of
frustums have been employed to emulate a mound’s volume. Another method for
measuring mound size involves using a topographic map and calculating volume using a
combination of planimetry and solid geometry. For the purposes of this study, any
procedure used to estimate mound volume using one or more geometric formulas from
minimal measurements is classified as a solid geometry method. In addition, those

26
Mound Jones1936 (m3)
Gridding Method2008 (m3)
Difference(±%)
A 38,610 30,150 -21.9
B 85,400 49,530 -42.0C 5,125 5,080 -0.9
D 5,810 3,880 -33.2
E 23,395 10,820 -53.8
F 4,640 2,790 -39.9
G 8,135 6,730 -17.3
H 620 675 +8.9
I 5,385 2,690 -50.0
J 4,050 2,570 -36.5
K 2,525 1,855 -26.5
L 6,500 4,420 -32.0
M 1,455 590 -59.5
N 6,500 3,295 -49.3
O 3,670 1,220 -66.8
P 17,700 15,880 -10.3
Q 3,670 3,210 -12.5
R 31,195 21,820 -30.1
S 1,745 515 -70.5
T 770 705 -8.4
U 115 115
V 17,585 22,460 +27.7
W 155 155
X 105 105
Y (M1) 55 55
Z (R1) 95 95
B' (B1) 55 55
C' (C1) 55 55
E' 110 110
F (F1) 115 115
F (F2) 115 115
Z' 115 115
Total 275,575 191,975 -30.3
Table 2.1. Volume estimates by Jones compared to the current gridding method estimate. Note that mounddesignations have changed for some of the smaller mounds. Jones’s original labels are listed first and the currentdesignations are listed in parentheses. Both estimates are rounded to the nearest 5 m3.

27
techniques that employ both a topographic map and planimetry are referred to as the
contour method. All techniques employ some form of geometry in estimating size. The
difference between the solid geometry, contour, and gridding methods lies in the number
of mensurations, or points of measure. Equations for geometric solids typically use data
from less than ten measuring points. For instance, a radius would use two points, the
center of the earthwork and the edge. Similarly, variables such as length, width, and
height would each use two points. Planimetry and the gridding method trace individual
contours providing hundreds of measurements per contour. The gridding method further
divides the mound into multiple equal portions creating hundreds more points of
measure.
Solid Geometry Methods
Archaeologists in the southeastern United States use the formula for a rectangular
prism [lwh] 3 as one method of differentiating earthen monuments (Blitz and Livingood
2004; Payne 1994; Scarry and Payne 1986; Steponaitis 1978). This formula regards a
structure as possessing a perfectly rectangular base and vertical flanks, which greatly
exaggerates the volume estimate (Figure 2.1a). Due to the obvious inflation in size,
archaeologists who employ this method utilize it as a relative index, not as a measure of
actual volume. Volume calculations using other shapes, including cones [h1/3(πr2)],
cylinders [πr2h], and circular paraboloids [h1/2(πr2)], have been employed in a similar
manner. For instance, Jeter (1984) used the formula for circular paraboloid (also called a
paraboloid of revolution) in estimating the volume of conical Copena burial mounds.
Archaeologists in central California used the formulas for a cone as well as a
3 For all formulas mentioned l is length, w is width, r is the radius, h is height, a is area. If there is asubscript designation, it refers to measurements for base and summit; the smaller designation is the lowermeasure.

28
Figure 2.1. Left, plan and profile of a rectangular prism formula applied to earthen platform mound (a); center, frustumformula for a truncated rectangular pyramid (b); and right, multiple geometric shapes (c). The dashed lines indicate thearea of measure.
spherical cap or hemisphere [(3πr2h + πh3)/6] in estimating the volume of shell mounds
(Cook and Treganza 1947:138; Treganza and Cook 1948:288 -289).4 Similarly, Seeman
(1979:258) used a formula for a spherical cap to estimate the size of earthen Hopewell
mounds. The common factor am ong all of these formulas is that they only account for
basal area and height, and in doing so, use only minimum mensurations. Although
accuracy is limited, these formulas still provide a reasonable comparative diagnosis of
mound size, using simple calculations from easily obtainable data.
Other geometric solids used to represent the shape of an earthen mound include
various forms of frustums. These shapes are mostly commonly employed to measure
platform mounds, those earthworks possessing a summit. Usin g a frustum to replicate
the volume of a mound enables the archaeologist to include both the basal and summit
areas in the assessment, as well as accommodating, very generally, the incline between
them (Figure 2.1b). Frustum formulas for the volume of a t runcated rectangular pyramid
4 Cook and Treganza give the formula for a spherical cap, a portion of a sphere marked by an intersectingplane, but wrongfully refer to it as a spherical segment, a portion of a sphere marked by two parallel planes.
a b c

29
[1/3h(a1 + a2 + √a 1a2)] and truncated right circular cone [1/3hπ(r12 + r2
2 + r1r2)] are the
most commonly relied upon frustum formulas for measuring Mississippian platform
mounds (Hammerstedt 2004; Jeter 1984:103; Milner 1998:145; Morgan 1980:xxxi-xxxii;
Muller 1997:272). Other frustum shapes also have been suggested, including a spherical
segment [π/6(3r12 + 3r2
2+h3)] (Jeter 1984:92) and a truncated triangular pyramid
[1/3(Ah1-(ah22/h1
2)h2)] (Shenkel 1986:204).
A variant of the frustum technique involves using multiple geometric shapes to
measure mound size (Figure 2.1c). In a study of Cemochechobee, a Mississippian site on
the Chattahoochee River, mound volume was calculated using a combination of a
rectangular solid, four triangular prisms, and four tetrahedrons (Schnell et al. 1981:29).
At Moundville, Gage (2000:90) also employed the same combination of geometric
formulas in calculating volume of the building episodes of Mound R. This procedure is
similar to the frustum method but uses more mensurations, which enables control for
significant irregularities in shape such as rounded corners or a ramp (Jeter 1984:104).
Furthermore, this variant also possesses the ability to accommodate variations in mound
slope. In a typical frustum equation, the summit area is centered above the base, giving
all sides of the solid the same incline. Using several different geometric shapes allows
for minor adjustments in slope, as each triangular prism can possess different
measurements.
Despite the convenience of the geometric formulas, they offer little in terms of
accuracy. No geometric formula can replicate the exact shape of a mound, nor can these
methods account for factors such as irregularities in base or summit shape, sloping
premound surfaces, or abnormalities in mound incline. Shenkel (1974, 1986) noted
30
problems with geometric estimations of large shell mounds in west Mexico when he
compared his original analysis to a method combining contour maps and planimetry.
Having realized the inconsistency between these two methods, Shenkel (1986) further
compared solid geometry and contour method analyses for other large earthworks in the
Eastern Woodlands, including mounds at Poverty Point, Cahokia, Toltec, and Pinson.
Based on the comparison of these two methods, he determined that geometric frustum
formulas produced a range of variation from -60 to +130 percent compared with a
contour method of analysis (Shenkel 1986:213). Milner (1998:145) arrived at a similar
conclusion when he compared the results of geometric formulas, including frustums and
circular paraboloids, to contour method analyses for 11 mounds at Cahokia. Of these
structures, seven were truncated platform mounds, while the other four were conical or
ridge-shaped. His results indicated that geometric formulas produced an exaggerated size
estimate in all seven platform mounds. In addition, Milner reported that the discrepancy
between the two methods for the entire sample ranged from 2 to 27 percent, the average
being approximately 6 percent.
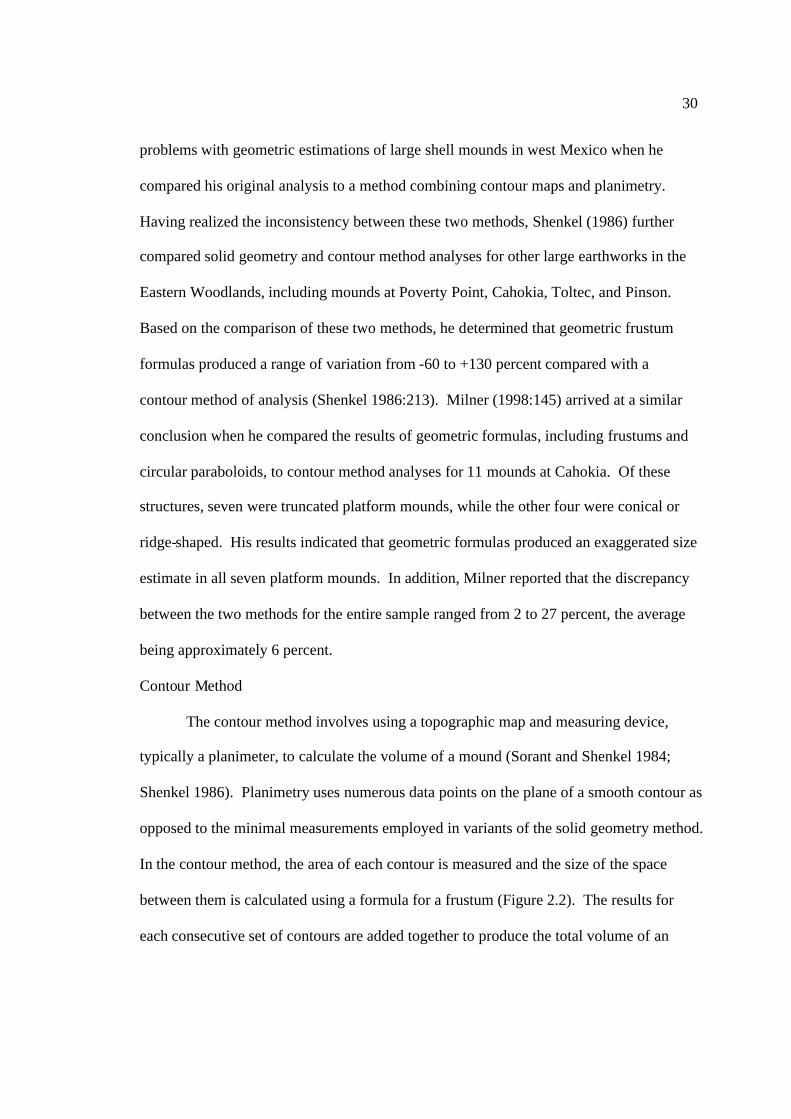
Contour Method
The contour method involves using a topographic map and measuring device,
typically a planimeter, to calculate the volume of a mound (Sorant and Shenkel 1984;
Shenkel 1986). Planimetry uses numerous data points on the plane of a smooth contour as
opposed to the minimal measurements employed in variants of the solid geometry method.
In the contour method, the area of each contour is measured and the size of the space
between them is calculated using a formula for a frustum (Figure 2.2). The results for
each consecutive set of contours are added together to produce the total volume of an

31
Figure 2.2. Contour method
earthwork. Thus, this method treats each set of contours as an independent frustum,
stacked one on top of the other.
The space between two consecutive contours is measured using one of two
variants of frustum equations. In one equation, referred to as the “engineers’ formula”
(Shenkel 1986:203; cf. Jeter 1984:103; Sorant and Shenkel 1984:600), the area of a lower
contour (a1) is added to area of the subsequent contour (a2), multiplied by the contour
interval, and divided in half [1/2h(a1 + a2)]. The second equation, referred to as the
“limnologists’ formula” due to its use in measuring the volume of lakes (Sorant and
Shenkel 1984:601; Shenkel 1986:204), is the same as that for a truncated rectangular
pyramid as used in the solid geometry methods. However, instead of using base and
summit area, the upper and lower areas of a set of contour lines are employed. In both
formulas, just as in the geometric equation of a frustum, mound slope is determined by
the difference of two consecutive areas. The more comparable the areas, the more the
sides of the frustum resemble a right angle. A cube, for instance, has a top and bottom of

32
equal area, therefore all vertical sides of the solid are 90 degrees. Larger differences
between the two contour areas will produce more acute flank angles. For example, a set
of contours with an upper contour 50% smaller than the lower contour will produce a 45
degree slope. In addition, the same problem as found in the geometric formula for a
frustum still applies, in that for the purposes of the formula the upper contour is centered
above the lower contour, creating a uniform slope on all sides.
When executed using planimetry, the contour method has been shown to be fairly
accurate. However, this accuracy of the contour method is dependent on factors such as
the symmetry of the mound, the quality and contour interval of the map, and the method
utilized for acquiring contour area. A symmetrical earthwork with uniform slope would
be less affected by the limitations of the contour method, described above, than an
unsymmetrical one. A poorly made or large contour interval topographic map will also
produce an inferior volume calculation. In addition, if data are acquired for either of the
two formulas (engineers’ or limnologists’) from measurements taken by hand instead of a
planimeter, the precision of the estimate is greatly reduced. Executing the contour
method accurately involves several steps using geometric equations and outdated
instrumentation, making it complicated and fairly time-consuming. Given the availability
of modern technology, a new method can be devised that is less problematic than
planimetry and provides a greater level of accuracy.
Gridding Method
Like the contour map technique, the gridding method requires a topographic map
of the earthwork, preferably at small contour intervals. Either traditional contour or
photogrammetric procedures produce maps well-suited for the analysis, though the latter

33
have been argued to be more accurate (Pierson 1959; Shenkel 1986; Young 1954, 1955).
Although the method can be conducted using scaled contour and profile maps drawn on
graph paper, as originally proposed by Heizer and Cook (1956:232) in measuring
prehistoric mounds in California, currently the procedure is more accurately and
conveniently executed using computer software designed for mapping three dimensional
images. Several commercial programs exist for this purpose, including products by
Science GL, ESRI, and AutoDesk. For this study, the program SURFER (version 8.0), a
three-dimensional mapping and contouring software (Golden Software Inc. 2002a), was
utilized to calculate mound volume.
The gridding method measures volume in a similar fashion as the procedure using
contour maps and planimetry described above. The difference between these two
techniques lies in the number and shape of geometric solids used to divide an earthwork.
In the contour method, a consecutive set of lower and upper contour lines creates the unit
of division. If the mound has five contours, there are four frustums and four calculations.
This method considers mounds to be analogous to a stack of frustum-shaped pancakes;
each set of contours equating to one flap-jack. In contrast, the volume procedure used by
the gridding method superimposes a grid on the topographic data, dividing the earthwork
and the surrounding terrain into a number of equal cubic portions (Figure 2.3). The
extent of the grid, the size of the cell, and the beginning base elevation are established by
the researcher’s specifications. The volume of each cell is measured, using a formula
similar to a rectangular prism and, like the contour method, added together to produce the
total volume (Golden Software 2002b:447). A typical grid would divide a small mound
of 1,000 m3 into as many as 1,000 cells as shown in Figure 2.3. These small divisions

34
Figure 2.3. Wireframe map used to demonstrate the gridding method. For purposes of illustration the cell size of thegrid has been doubled from that used in this study to make the cells visible.
allow aspects of an earthwork such as small irregularities in shape, elevation, or slope,
the presence of a ramp or ramps, multiple terraces, or a sloping premound surface to be
included in the assessment. To provide the reader with a better visualization of the
gridding method, it is easy to imagine stacks of thousands of dice used to recreate a scale
model of an earthen monument. Each stack of dice (or vertical prism) represents one grid
cell and the top and bottom die of each stack are truncated to the surface. The volume of
each stack is calculated and added to the volume of the other stacks, the result of which
estimates the volume of the mound. The size and number of the dice correspond to the
size and number of the grid cells that are superimposed on the mound.
Method of Present Study
In assessing the volume of earth needed to produce the monuments of the
Moundville landscape, several topographic maps were digitized using the computer
program DIDGER (version 4.0) (Golden Software Inc. 2007). This software is designed
to trace images such as contour maps or aerial photographs, creating output scaled to
Northing and Easting coordinates. Maps of Moundville used in this project consisted of

35
two complete site maps; the Alabama Museum of Natural History “Topographic Map –
Mound Park, Alabama” (ca.1937) and a photogrammetric map generated for the
Moundville Mapping Project in 1991 by the Alabama Historical Commission and the
University of Alabama. In addition, several maps of individual mounds were used,
including those created by P. L. Cox of the National Park Service in 1938, David L.
DeJarnette and the University of Alabama Field School in 1970, Vernon J. Knight and
Richard A. Krause of the University of Alabama in 1989, and Knight and the University
of Alabama Field School in 1993.
Topographic maps of mounds at Moundville were scanned, imported into the
program, and calibrated to the site’s grid coordinate system.5 When digitizing these
maps, each contour line of a mound was traced individually with the Northing and
Easting coordinates being the output for each point taken. The elevation of a contour was
added to the output after each line was traced. The first complete contour line encircling
the mound was used as the structure’s boundary and was given an elevation of zero. In
cases where mounds where built on a sloping premound surface, two contour maps were
digitized. First, a contour map of the proposed premound surface was created by
connecting contour lines on each side of the mound in order to match the surrounding
terrain (Figure 2.4). An arbitrary plane was established and given the elevation of zero.
The second map traced was of surface contours including the mound and the adjacent
topography. The volume of the premound surface was subtracted from the volume of the
5 When digitizing previously drawn maps, the earthwork does not necessary need to be mapped into alarger grid system. Any scaled contour map will suffice, and control points can be fashioned in accordancewith the map’s scale. If one’s data consist of Cartesian coordinates with elevations, the Didger step iseliminated and the XYZ data can be entered directly into the Surfer program.

36
Figure 2.4. Left; contour map of mound constructed on sloping surface. The dashed lines represent the proposedcontours of the premound surface. Right; profile of the mound showing boundary between the mound and the naturalterrain. The volume below the premound surface is calculated and subtracted from the total.
mound using a feature of the SURFER program designed for the task. Mounds P and Q
were the only mounds calculated that possess a sloping premound surface.
After the topographic maps had been digitized, the coordinates were entered into
SURFER. When measuring volume, the Kriging algorithm was used to control for the
interpolation or curvature between data points. The software manufacturer recommends
this method or the similar method of Radial Basis Function to produce the most accurate
contour maps (Golden Software, Inc. 2002b:151, 155). The volume of a mound was
calculated using the program’s Grid/Volume function. Results for each volume generated
are tabulated in three categories: Positive Volume [Cut], Negative Volume [Fill], and Net
Volume (Figure 2.5). For the purpose of measuring mound volume in archaeology, the
only relevant report is the Positive Volume, which is the volume above a specific
elevation designated by the researcher (Z).
In some cases, mound volume could be calculated from more than one map.
Therefore, the factors considered when choosing a particular estimate of mound volume
A
A
B

37
Z = 0
Positive Volume[Cut]
Negative Volume[Fill]
Figure 2.5. Image representing differences in Positive, Negative, and Net volumes. The solid line represents the currentsurface and the dashed line represents the idealized surface level (Z). The positive volume is any feature above thatidealized level and the negative volume is the open volume below that line. The net volume is the positive volumeminus the negative volume. In the case of the figure, the net volume is zero, as the positive and negative volumes arethe same.
over others in the current tabulation require discussion. Because photogrammetric
contour maps are generally believed to be more accurate than traditional contour maps
(Pierson 1959; Shenkel 1986;Young 1954, 1955), one would assume that estimates
generated from the 1991 photogrammetric contour map should take precedence over the
results from the earlier, hand- drafted Alabama Museum of Natural History contour map.
However, according to the “Mound State Monument Central Development Plan” of
January 1939 (notes on file, Alabama Museum of Natural History), Mounds J, K, L, R, S,
and T were modified during the Alabama Museum of Natural History and the Civilian
Conservation Corps (CCC) restoration projects in 1937. These endeavors included but
were not limited to the excavation and reshaping of mounds damaged by erosion and the
creation of lakes where prehistoric borrow pits or ponds were believed to have once been
located (Jones 1941; Knight 1989). Based on an aerial photograph from 1938 (Figure
2.6) and a visual inspection of the two site maps, Mounds H and I also were modified
during Depression Era restorations (Knight 1989, 2009b). Restoration consisted of

38
Figure 2.6. Aerial photograph of Moundville in 1938. Note the exposed soil shown by the white reflections aroundMounds L, K, J, I, H, S, and T.
scooping up slumped earth around eroded margins of earthworks with heavy machinery,
adding the soil back to the summit, and reshaping it. The materials used for re-
contouring a mound were either eroded mound soil, the volume of which was determined
by excavations (Jones 1941), or in some cases, imported earth.
These historic modifications provide a quandary for this study. The Alabama
Museum of Natural History contour map (ca. 1937) was made prior to mound
reconstruction, but the later photogrammetric map made more than 50 years later
provides what might be a superior assessment. All individual mound maps were made
after restoration work. To make matters worse, Jones did not record an estimate for the
amount of soil used in mound renovation except in one case, Mound R. A handwritten
list on file at the Alabama Museum of Natural History dated December 1932 gives an
assessment for the soil, sod, and labor that would have been needed to repair 20 mounds
should reconstruction projects occur (Table 2.2). In this pre-restoration estimate, Carl T.

39
Mound Est. Volume ofRestoration Soil (m3)
Mound A 321Mound B 306Mound C 191Mound D 306Mound E 145Mound F 229Mound G 88Mound H 424Mound I 612Mound J 46Mound K 50Mound L 153Mound M 96Mound N 69Mound O 57Mound P 191Mound Q 218Mound R 474Mound S 170Mound T 222
Total 4,368
Table 2.2. Projected estimates for mound restoration recorded December 11, 1932 by Carl T. Jones
Jones believed less than 500 m3 of earth would be needed to restore Mound R, but after
completion, it reportedly took more than 7,600 m3 (Jones 1941:2). Moreover, the list
requests soil for 20 mounds, but only six are mentioned as being restored and it is not
specifically reported in which cases eroded mound soils or imported fills were employed
as construction material. Knight (2009b) found imported restoration fill on Mounds A
and V. The summits of Mounds B, E, and G were probably “repaired,” as well as others.
In summary, there is no way at the present time of knowing how much soil was used or
modified in this restoration work, either per mound or for the entire site. In choosing an
estimate, the dilemma is one of either trusting the restoration work as replacing soil

40
eroded over time, or of assuming that modifications using imported soils cloud the true
volume. To resolve this dilemma, I chose to use volume estimates derived from the
photogrammetric map of the restored mounds as opposed to the 1937 pre-restoration
map. Based on the 1938 aerial photograph (Figure 2.6), there is good evidence to suggest
that Mounds H, I, J, K, L, S, and T were modified using slumped soil as opposed to
imported fill. The photograph shows sizeable scars adjacent to these where earth was
removed. Further support for this claim is demonstrated in the minimal size differences
of these mounds between the two maps (Table 2.3). Assuming that no imported fill was
used, the volume of these earthworks should only vary slightly.
The other restored mounds are suspected of being modified using imported fill.
Given the special circumstances of erosion on Mounds A and R, and that their summits
and ramps were plowed (Moore 1905; Jones 1941: Gage 2000: Knight 2009b), the
restoration soil is assumed to have been added back to the original prehistoric volume.6
Due to lack of evidence, the same must be assumed for the other mounds believed to
have been modified, including Mounds B, E, and G. However, nothing was taken from
around the flanks of these mounds, unlike the mounds on the south plaza margin, so the
added fill must have been trucked in. Regardless, given the minimal differences between
the Alabama Museum of Natural History site map (ca. 1937) and the individual mound
maps of these restored mounds it is believed here that the present volume approximates
the original sufficiently.
For the mounds that have not been restored, results from individual mound maps,
when present, were given precedence over either of the more general site map
6 Moore (1905:220) mentions plowing but also provides an alternative explanation for the summit shape ofMound R. Moore suggests that the summit was once surrounded by rampart or earthen wall that hadcollapsed leaving a ridge surrounding the outer ring of the summit.

41
calculations, as they were generally more detailed and were drawn with smaller contour
intervals. It is, however, noteworthy that the individual mound maps showed only minor
discrepancies in volume compared to the results from the photogrammetric site map. In
cases where there was not a suitable individual mound map, as with the restored mounds
priority was given to the photogrammetric map estimates over the Alabama Museum of
Natural History contour map results. However, in three cases, Mounds C, D, and V, the
Alabama Museum of Natural History contour map was the only available representation.
Results
The volumes of 21 mounds at Moundville were calculated from various contour
maps using the gridding method (Table 2.3). The results indicate that the unknown
methods used by Jones in 1936 greatly overestimated several mounds, while his estimates
for others were much closer to the gridding method results. Survey data concerning the
smaller mounds at the site, those outside the plaza periphery, are limited. Mounds U, W,
X, M1, R1, B1, C1, E’, F1, F2, and Z’ were not measured for this study, so Jones’s
original volume estimates were used in the current volume assessment. Although his
calculations tended to exaggerate the size of the mounds, the combined volume of these
eleven earthworks accounts for less than 1,100 m3, or half of one percent of the new site
estimate. Therefore, any potential error in the size of these eleven small mounds would
have a negligible effect on the mound volume of the site as a whole.
Using the gridding method and the principles for privileging estimates described
above, it is estimated here that the total volume of the earthworks at Moundville as
191,975 m3, in contrast to the 275,575 m3 suggested by Jones; a difference of almost
85,000 m3. Even if the largest value for each mound calculated by the gridding method

42
Mound Jones1936
Method Unknown
AMNHCa. 1937
Gridding Method
AHC/UA1991
Gridding Method
IndividualMound
Gridding Method
CurrentBest
EstimateA 38,610 30,920 30,740 30,1501 30,150B 85,400 42,860 49,530 49,530C 5,125 5,080 5,080D 5,810 3,880 3,880E 23,395 8,950 10,8203 10,820F 4,640 1,920 2,7903 2,790G 8,135 8,675 6,570 6,7303 6,730H 620 490 675 675I 5,385 2,620 2,690 2,690J 4,050 2,250 2,570 2,570K 2,525 1,510 1,855 1,855L 6,500 3,610 4,420 4,420M 1,455 620 625 5902 590N 6,500 1,800 3,295 3,295O 3,670 1,930 1,220 1,220P 17,700 14,100 14,390 15,8804 15,880Q 3,670 2,920 3,320 3,2104 3,210R 31,195 19,490 21,8203 21,820S 1,745 550 515 515T 770 425 705 705U 115 115V 17,585 22,460 22,460W 155 155X 105 105
Y/M1 55 55Z/R1 95 95B’/B1 55 55C’/C1 55 55
E’ 110 110F”/F2 115 115F’/F1 115 115
Z’ 115 115Total 275,575 191,975
Table 2.3. Volume estimates based on various sources including Jones’s volume estimates from 1936 using anunknown method of estimation, gridding method results from the Alabama Museum of Natural History topographicmap ca. 1937, the photogrammetric map by the Alabama Historical Commission and the University of Alabama 1991and individual mound maps produced by the National Park Service in 19381, the University of Alabama FieldSchool19702 , the University of Alabama Field School 19933 , and Knight and Krause of the University of Alabama19894.

43
from the various topographic maps is summed, the site total still only amounts to only
195,575 m3. It is worth noting that Jones’s estimates were calculated prior to any
restoration projects, so the volume of imported soils could not have caused the
discrepancy. Muller (1997:272-274), using an unspecified frustum formula, calculated
the total mound volume of Moundville as 153,337 m3, some 39,000 m3 less than the
present estimate. In relation to Muller’s other volume estimates for large Mississippian
mound sites, Moundville does, however remain the second largest in overall mound
volume. The total mound volume at Moundville is exceeded only by Cahokia, estimated
at more than 1,000,000 m3 (Milner 1998:145; Muller 1997:274), some six times larger
than Moundville. If Muller’s values for Etowah are roughly accurate, Moundville’s
mounds contain some 50,000 m3 more volume than those at Etowah, the third largest
Mississippian mound center by volume (Muller 1997:274). Therefore, even though Jones
inflated the total mound volume of Moundville by approximately 85,000 m3, an
overestimate equivalent in volume to the Angel or Kincaid site total, the overall ranking
of Moundville in relation to other major Mississippian mound centers remains the same. 7
Concerning the relative size ranking of individual mounds at Moundville, changes
do occur in re-estimating their volume. Mound B is actually half the volume once
believed, but is still the largest mound at the site. Morgan (1980:xxxi) gives Mound B as
112,000 m3, while Jones reported it to be 85,700 m3, Muller (1997:273) estimated it to be
53,000 m3, and my estimate is 49,530 m3. Mound V is larger than originally given by
Jones, increasing from 17,584 m3 to 22,460 m3, and with the re-estimate is now the third
7 Pauketat (2004:71) argues that the East St. Louis and St. Louis sites are the second and fourth largestMississippian mound centers respectively, with Moundville being third based on the number of mounds,not mound volume.

44
largest mound at the site behind Mounds B and A. These three mounds account for
approximately 100,000 m3 of soil; more than half of the total mound volume of the site.
Further Comparison of Volume Methods
Comparison of Contour and Gridding Methods
At this point, one may wonder how we know that the gridding method does not
consistently miscalculate the size of these earthworks. The gridding method, to the best
of my knowledge, has not been applied previously to estimate volume of Mississippian
earthen mounds. This method therefore needs an independent point of reference. In view
of this, the volume of Monks Mound at Cahokia, the largest Mississippian earthwork,
was calculated using the gridding method. The results were compared to contour method
analyses conducted by Reed et al. (1968) and Shenkel (1986). Reed and his colleagues
estimated volume from a photogrammetric map produced by Washington University in
St. Louis, Missouri in 1966 (Reed et al 1968:139). Their estimate was 622,291 m3 (Reed
et al. 1968:145). Shenkel (1986), using a different undated topographic map (Reed
1973:34), estimated Monks Mound as 610,187 m3. Using these maps, the results
calculated using the gridding method are almost identical to the ones generated using the
contour method. My volume estimate using the gridding method from the
photogrammetric map of Monks Mound (Reed et al. 1968) is 625,700 m3; a difference of
only 0.5 percent. Gridding method calculations using the undated contour map (Reed
1973:34) results in a volume of 612,665 m3, a difference of only 0.4 percent. These
minor differences indicate that the gridding method and the contour method using
planimetry can produce very similar results.

45
Figure 2.7. Bar chart and table showing the volume estimates using two geometric formulas, a rectangular prism and atruncated rectangular pyramid, compared to Jones and the current volume assessment.
Comparison of Solid Geometry and Gridding Methods
To further demonstrate any systematic differences between the gridding method
and the solid geometry methods, the original and current estimates for the largest mounds
at Moundville were compared to the results using the formulas of both a rectangular
prism and a rectangular truncated pyramid (Figure 2.7). The dimensions for the
geometric formulas were obtained from the Alabama Museum of Natural History
topographic map (ca. 1937) and the Alabama Historical Commission/University of
Alabama photogrammetric map from 1991. The graph shows that the solid geometry
method using a rectangular prism formula consistently exaggerates mound size, whereas
the frustum formula tends to be more comparable to current estimates using the gridding
method. Jones’s calculations using an unknown method typically fall between the results
of the prism and frustum formulas, but in some cases even exceed prism estimates.
A B E G I L N P R
Prism 38,695 97,930 14,965 12,720 5,385 9,635 3,465 16,705 34,840
Frustum 29,090 55,270 8,470 8,050 3,490 5,050 2,420 11,050 21,100Jones 1936 38,610 85,400 23,395 8,135 5,385 6,500 6,500 17,700 31,195Gridding Method 30,150 49,530 10,820 6,730 2,690 4,420 3,295 15,880 21,820
0
20,000
40,000
60,000
80,000
100,000Cu
bic
Met
erso
fSoi
l

46
These results indicate that the formula for a rectangular prism produces
systematically larger volume estimates than the gridding method, with values ranging +5
to +62 percent larger; an average difference of +35 percent (Figure 2.7). The rectangular
prism formula does, however, still rank the largest mounds at Moundville in the same
relative order. The identical ranking of these mounds demonstrates that the formula for a
rectangular prism works for relative mound comparisons, but cannot provide a result that
estimates the true volume of an earthwork.
The results of the frustum formula for a truncated rectangular pyramid are more
similar to those of the gridding method than the results obtained using the rectangular
prism formula. The volume of mounds generated using the frustum formula ranged from
-55 to +45 percent when compared to the gridding method, with an average difference of
+4 percent. The frustum formulas are more accurate, but one should still be wary of
using volume information generated from this type of equation, especially conducted on
earthworks that are more irregularly shaped than those at Moundville.
Other Mississippian Mound Comparisons
Because the gridding method estimates the mound volumes at Moundville to be
substantially smaller than originally believed, it is pertinent to check other Mississippian
mounds for comparable overestimations calculated using geometric equations. To
determine if the volume of mounds has been exaggerated at other sites, maps of four
large Mississippian mounds were digitized, including Mound 42, Mound 48, and Mound
60 at the Cahokia (Fowler 1989) and Mound A at the Angel site (Black 1967). All four
of these mounds are in Muller’s (1997:273) top twenty largest Mississippian mounds in
the Eastern United States, and their volumes were calculated by him using geometric

47
Mound / Site Solid GeometryMethod (Muller 1997)
Gridding Method PercentDifference
Mound AAngel, Indiana
72,000 51,035 -29
Mound 48Cahokia, Illinois
60,000 42,230 -30
Mound 60Cahokia, Illinois
42,000 36,460 -13
Mound 42Cahokia, Illinois
41,000 34,620 -16
Table 2.4. Previous volumes of other Mississippian mounds from Muller (1997) compared to current estimations usingthe gridding method.
equations, presumably a frustum formula (Muller 1997:272-273). More mounds would
have been digitized but suitable topographic maps are not readily available for certain
mounds, such as Mound A at Etowah, reportedly the second largest Mississippian
platform mound.
The results from these other sites point to the same conclusion; the volume of
these earthworks has been overestimated relative to the more accurate gridding method
(Table 2.4). For example, Muller gives the volume of Mound A at the Angel site, listed
as the third largest prehistoric Mississippian mound in the Southeast, at 72,000 m3
(Muller 1997:273). However, by digitizing a topographic map (Black 1967) and using
the gridding method, the volume is estimated at 51, 035 m3, approximately the same size
as Mound B at Moundville. Using a truncated pyramid formula, Morgan (1980:xxxi)
estimated the volume of Mound A at the Angel site as 51,788 m3; a result similar to the
one generated using the gridding method. The reported size of Mounds 48, 60, and 42 at
Cahokia also are overestimated relative to the results generated by the gridding method
ranging from 13 to 30 percent (Muller 1997:273).

48
Given that only a few earthen mounds have had their volume assessed using
techniques other than simple formulas for geometric solids, I would argue that the size-
rank of the majority of mounds in the Eastern United States should only be thought of as
relative based on current data. I am not surprised about this fact given the inherent
difficulties (outdated instrumentation and long-hand arithmetic) associated with the
contour method. Geometric equations are much simpler and far less time consuming, but
lack sufficient accuracy to warrant their use and, therefore, should not be relied upon
except when no other method is employable. The gridding method, on the other hand,
can be considered a replacement strategy for the outdated contour method. When
employed with the aid of computer software, the gridding method can be used to create a
more accurate assessment in a time-effective manner. New technology including
computerized mapping and contouring software, electronic/optical surveying instruments,
and optical remote sensing such as LiDAR (Light Detection and Ranging) give the
archaeologist the ability to more accurately measure earthen structures and there is no
reason not to take advantage and incorporate this technology in one’s research instead of
relying upon data from previous, less technologically-advanced methods of volume
calculation. In short, if one possesses a suitable contour map or XYZ data, the gridding
method should be one’s first resort. In cases where contour maps are not available, then
the next possible alternative should be the frustum formula assuming one also has
elevations and a manner in which to calculate summit dimensions, if not already given.
In cases where neither summit dimensions nor a suitable contour map are available, then
estimates calculated using geometric formulas of comparable solids would be considered
acceptable.

49
Chapter 3
Plaza Modifications at Moundville
Plaza, a Spanish word originally from the Latin platea meaning broad street, is
defined as an open public area usually found in an urban setting (Merriam-Webster
2004). Plazas are found worldwide as communal spaces and as the center of formal
communities. They are not simply negative space, but are integral to the architecture and
to what surrounds them. The concept of the plaza in prehistoric North American
societies, also referred to as a town or public square in ethnohistorical accounts,
represents a large open space used for communal activities, both sacred and secular
(Kidder 2004; Lewis et al. 1998; Rogers et al. 1982; Stout and Lewis 1998). Physical
modifications to Native American plazas support the idea that these spaces were an
essential part of the landscape, not just open areas between mounds. Mississippian plazas
at Cahokia (Dalan 1991, 1993, 1997, Dalan et al. 2003; Holley et al. 1993; Pauketat
2004), Etowah (King 2001; Larson 1989; Sears 1958) and Moundville (Knight 2009b;
Knight and Steponaitis 1998), as well as those at Coles Creek sites (AD 700-1200) such
as Raffman (Kidder 2004) and Greenhouse (Ford 1951), have provided evidence of
physical modification in the form of imported soil and rock used to raise, level, refill, or
delineate this space. However, the amount of labor involved in modifying artificial non-
mound fills is rarely included in energy expenditure studies. In this chapter, the results of
an auger survey and test excavations used to locate physical modifications to the plaza at
50
Moundville are presented. Then, the gridding method (Chapter 2) is used to estimate the
volume of these artificial plaza fills to be included in the total volume of soil that was
prehistorically excavated, transported, and compacted in modifying the Moundville
landscape for the proposed energetics model (Chapter 6). I will conclude that imported
soil within the confines of the plaza has been verified in several places and its combined
volume, approximately 15,150 m3, when added to the volume of total mound fill at the
site (Chapter 2), elevates the overall estimate of imported fill at Moundville to almost
210,000 m3.
The Moundville Plaza
The Moundville plaza is a quadrilateral area approximately 520 m wide (E-W) by
475 m long (N-S) covering roughly 23 ha8. Its boundaries are demarcated on all four
sides by earthen mounds (Figure 2.1). Mounds F through H mark the eastern boundary
of the plaza, Mounds I through L define the southern boundary, Mounds M through Q
delineate the western edge and the northern portion of the plaza is demarcated by the
largest mounds at the site, Mounds B, E, and R (Knight and Steponaitis 1998). Most
scholars of the site agree that this area is one continuous plaza (Knight 1998; Knight and
Steponaitis 1998; Moore 1905, McKenzie 1964; Pauketat 2007; Peebles 1978, 1998;
Steponaitis 1983a), but its extent and the number of its flanking mounds varies as it is
envisioned differently by different researchers.9
Peebles (1978, 1998) states the plaza is surrounded by 20 mounds and measures
approximately 40 ha. In this view, the plaza extends to the northernmost mounds,
Mounds C and D, and places Mounds A and B in the center. The 40 ha estimate
8 This estimate excludes ravine heads that intrude into the plaza9 Morgan (1980) considers Moundville to possess four plazas.

51
incorporates areas such as ravine heads and the footprints of mounds that would have
been unusable for plaza activities. Steponaitis (1983a:6) at one time argued that the same
20 mounds enclose the plaza but estimates its size at 32 ha, presumably subtracting the
unusable areas. In more recent estimates of the plaza boundaries, and as also envisioned
in this study, its northern border does not extend past Mound B, placing only Mound A in
the center (Knight 1998; Knight and Steponaitis 1998; Pauketat 2007). This argument
maintains that fifteen mounds surround the plaza, excluding Mounds A, C, D, S, T, and V
as plaza flanking monuments. Even using the conservative estimate of 23 ha, the
Moundville plaza is at least 4 ha or 15% larger than the Grand Plaza at Cahokia (cf.
Holley et al. 1993; Pauketat 2004), making it one of the largest Native plazas in the
eastern United States.
Knight (1998:52) argues that the formal architectural configuration at Moundville,
including the plaza and its peripheral mounds, were used simultaneously as early as the
latter half of the 13th century A.D., the beginning of the Moundville II phase. Given this
information, it is assumed that the mound and plaza arrangement was designed to fit a
predetermined plan. The plan involved segregating space by using an arrangement of
earthen mounds around the plaza periphery. It has been previously stated that physical
modifications other than mound constructions were also undertaken in order to achieve
the design, including moving earth to construct a level building surface and to expand the
breadth of the plaza (Knight 1995, 2009b; Knight and Steponaitis 1998).
Previous Plaza Investigations
Until recently, interest in the plaza at Moundville has been minimal. Figure 3.1
shows the work that has been undertaken in the plaza thus far. Not included in the figure

52
Figure 3.1. Plan map of Moundville showing previous plaza investigations. The 1937 Roadway excavations are markedby the black line encircling the site. Surface collections are shown in gray, excavations are shown in black, andhectares where shovel or auger testing has been conducted are shown with diagonal lines. Excavations and surfacecollection areas are not to scale but slightly enlarged for visibility.
are Moore’s (1905:218) excavations of “a number of trial-holes east of Mound O” and on
the “level ground near the western side of Mound A” (1907:340). The first formal plaza
excavations were conducted by the Alabama Museum of Natural History and the CCC in
1938 to construct the current roadway encircling the site. The roadway weaves in and out
of the plaza, but crosses through the northern half, from Mounds G to Q, and the
southwest corner, from Mounds K to M. Depths and profile drawings of these
excavations were not recorded, so there is no way of knowing if artificial plaza fill was
encountered. Numerous houses, mostly domestic, were uncovered during the Roadway
excavations (notes on file, Alabama Museum of Natural History; Lacquement 2007;
A
B
V
CD
E
F F1
F2
S
G
X
HT
IJKL
M1
M
N
OW
P
Q
R
B1
UR1
0 100 m

53
0 5 10 15 20
Figure 3.2. South wall profiles of six units crossing the plaza excavated by Driskell in 1988. Each unit is separated by100 m. The absolute elevations have been shifted for the purposes of illustration. The four units in the middle posse ssthe same stratigraphy; humus, brown sandy clay followed by reddish -brown sandy clay. The subsoil is sometimesyellowish-brown. The two end units possess an additional layer of yellowish-brown sandy clay, which is thought to beplaza fill. The unit illustrated on the left, unit N 1800 E 1300, is located at the base of Mound G, showing the layer offill that runs beneath the mound. Also note that no drawn profile was available for unit N 1800 E 1100. The illustrationhere was created based on the field notes, which only gave one elevation per stratum.
Wilson 2008). Nearly all of the houses within the confines of the plaza appear to predate
AD 1250, the approximate date of the initial use of the mound-plaza arrangement, and
were probably erected before the landscape design had fully evolved.
After a forty-year hiatus of plaza investigations, Boyce Driskell surface collected
and excavated in the plaza as part of a University of Alabama Field School in 1988 (notes
on file, Alabama Museum of Natural History). Three 100 m2 sections (5 m x 20 m) in the
plaza were disked and surfaced collected including south of Mounds A, N, and O (Figure
3.1). According to the inventory forms, no prehistoric artifacts were recovered during
surface collections.
In addition to the surface collections, Driskell also excavated two 1 x 2 m and five
1 x 1 m test units. The two larger units were placed in the plaza 100 m apart, one east of
Mound N and one east of Mound O. The five 1 x 1 units were positioned 100 m apart
and formed a line across the center of the plaza, starting 100 m east of the 1 x 2 m unit
18001300
0 1 m
N 1800E 1000
N 1800E 900
N 1800E 800
N 1800E 1100
N 1800E 1200
N 1800E 1300

54
east of Mound N and continuing eastward to the base of Mound G (Figure 3.1).
Relatively few artifacts and features were recovered in these plaza units, but the varying
depths at which artifacts were found and the profile drawings suggest that imported fills
were used to level portions of the eastern and western edges of the plaza (Figure 3.2).
The four units in the center of the east-west line were excavated to roughly 30 cm
below the ground surface and possessed the characteristics of the unmodified plaza
terrace stratigraphy (Figure 3.2). In contrast, the unit directly abutting the west flank of
Mound G was excavated to 60 cm, while the two 1 x 2 units east of Mounds N and O
ranged in depth from 90 to 100 cm. In these three units, yellow sandy clay was
encountered above a buried A-horizon, which is thought to be imported fill. Both 1 x 2
m units are at least 30 m away from a mound, making it doubtful that the additional fill
was caused by the erosion of earthworks. Furthermore, based on the profile drawing and
description of the soil, I believe that Driskell’s unit N 1800 E 1300, the unit at the base of
Mound G, was not completely excavated down to the sterile terrace subsoil. The deepest
level excavated consisted mostly of sand ranging from light tan to dark orange, not the
typical yellowish-orange sandy clay subsoil. Knight’s (2009b) excavations abutting the
northern flank of Mound G, less than 10 m away, support this claim, as sterile subsoil
there was more than one meter deep.
In the spring of 1993, Vincas Steponaitis and colleagues (1994) conducted a
series of systematic auger tests at Moundville. Two devices were used, including a hand-
held split-core auger, 2 cm in diameter, capable of depths of 80 cm, and a gasoline
powered auger, 30 cm in diameter and capable of drilling to depths of 50 cm. Two
hectares were surveyed, but only one was inside the plaza boundary, located southwest of
55
Mound G (Figure 3.1). Split core augering was employed at 10 m intervals and the
power auger was employed at 20 m intervals. Unfortunately, depths were not reported,
but an interesting distribution of artifacts was discovered. The positive and negative
auger tests were clustered, with positives occurring in the south and east of the hectare
and negative tests grouped in the north and west. Based on this distribution, the authors
believed they had pinpointed the plaza’s edge, marked by a rich artifact concentration
outside and virtually nothing inside.
In the fall of 1993, Knight (1995, 2009b) conducted excavations on the summits
and/or flanks of several mounds at Moundville, including Mounds E, F, G, and R.
Stratigraphic evidence from a 2 x 8 m trench unit on the western flank of Mound F
indicated that mound fill may have continued off the mound and into the adjacent plaza.
That same year, a unit at the base of Mound G (Figure 3.1) revealed large amounts of
artificial fill beneath the mound on the north side, indicating the plaza was raised
significantly to produce a level building surface for construction. In 1996, Knight
returned to Mound F and excavated a 2 x 2 m unit in the plaza directly abutting the
western flank (Figure 3.1). Based on the depth of the original ground surface, 130 cm
below the mound, Knight concluded that soil was used to the level the plaza leading up to
Mound F, but this was done after the mound’s initial building stage (Knight 1998, 2009b;
Knight and Steponaitis 1998).
In the fall semesters of 2005, 2006, and 2007, John Blitz excavated in two places
in the Moundville plaza. The 2005 excavations, which consisted of eight adjoining 2 x 2
m units, were executed in the northwest corner of the plaza, south of Mound R (Figure
3.1). There were no indications of plaza fill in this area. Additionally, a 2 x 2 m unit,

56
started in 2006 and expanded to a 4 x 4 m unit in 2007, was excavated north of Mound K.
Sterile subsoil in this unit was not uncovered until approximately 90 cm below the
surface, suggesting to me that this was perhaps another area where soil may have been
imported to level the plaza (field notes on file, Department of Anthropology, University
of Alabama).
Also in 2006, Claire Thompson (2010) conducted systematic shovel tests in eight
hectares around the southeastern corner of the site and two hectares south of Mound R.
Of the ten hectares tested, only four were partially within the confines of the plaza.
These include two partial hectares south of Mound R, a hectare partially overlapping the
plaza between Mounds M and N, and a hectare north of Mounds K and J. In this testing,
50 x 50 cm shovel tests were employed at 10 m intervals. Each test was excavated until
sterile subsoil was reached. As in Blitz’s formal excavations, no artificial plaza fill was
discovered south of Mound R. However, in several shovel tests around Mounds J, K, and
N artifacts were found at depths exceeding those expected for soils developed on the
sterile terrace deposits, indicating that artificial plaza fill may be located in these
vicinities.
Based on evidence presented above, Driskell, Knight, Blitz, and Thompson all
encountered artificial fills on the flat ground around the plaza’s outer margin, providing
evidence of physical modification to the Moundville plaza. All such evidence of artificial
plaza fill thus far has been restricted to the outer edge of the plaza near the peripheral
mounds. No evidence has come to light that the center of the plaza was modified. Thus,
based on prior work, plaza areas suspected of modification include west of Mound F,
surrounding Mound G, east of Mounds N and O, and between Mounds J and K.

57
Moreover, visual inspection of the terrain by the author suggested two other possibilities:
east and northeast of Mound P, and south of Mound E.
Archaeological Methods for Determining Plaza Fill
To determine the location, size, and chronology of modified plaza fills, two
procedures were employed. First, an auger survey was conducted in the spring of 2007,
using a hand-held 5 cm diameter bucket auger. The device is twisted into the ground,
churning up and removing approximately 20 cm of soil per insertion, and is capable of
reaching depths of up to 2 m. Transects for the survey were oriented in a manner to best
test for fill in the suspected areas as outlined in the previous section. In all cases, 10 m
intervals were used along these transects, except in the area west of Mound F, in which 8
m intervals were employed.10 Areas for the auger survey consisted of south of Mound E,
west of Mound F, surrounding Mound G, and east of Mounds N and O. These areas were
selected based on the results from previous excavations by Driskell and Knight, as well
as visual abnormalities in the terrain. The area south of Mound E was tested given its
close proximately to the suspected fill west of Mound F.
The second method employed for investigating plaza fill consisted of small test
excavations. Six units were excavated in the fall of 2007, including one west of Mound
F, one southwest of Mound G, one southeast of Mound N, one east of Mound O, one east
of Mound P, and one northeast of Mound P. Each unit was excavated by observed
stratigraphy and soil was dry screened through ¼-inch mesh. Excavations continued until
sterile subsoil was reached, which consisted of yellow, orange, or reddish sandy clay
terrace soils. Units were named based on the numerical coordinates of the southwest
10 The survey area west of Mound F was limited by the Park roadway, mound and ravines. The intervalwas decreased here to accommodate more auger tests.

58
corner of the unit within the Moundville site grid system. The artifacts from each of the
six units are tabulated in the Appendix.
Following these field procedures, the method of measuring the volume of the
plaza fill in each area was the same as the method used in calculating mound fill (Chapter
2). In short, computer software was used to calculate volume by gridding the region into
equal cubic portions. The suspected fill area was determined based on the depths of
sterile subsoil from the auger survey. The bucket auger could easily detect the contrast
between the sterile terrace deposits and everything lying above, but could not so easily
detect the top of the buried A-horizon. For volume calculations, 40 cm – the average
depth of sterile subsoil in areas with no plaza fill – was subtracted from the depth of each
auger test (Figure 3.3). Subtracting the average depth of naturally and culturally modified
soils developed over sterile terrace deposits as a correction factor, provided a method of
correcting for the depths of the humus and cultural levels above sterile terrace deposits.
The reason for this correction is to create a zero point for volume calculations for tests
with no fill. However, plaza fill would have been added on top of the naturally and
culturally-modified A-horizon soils, and their depth should not be included in
measurements of artificial plaza fills.
Though the plaza area north of Mounds J and K appears to be a promising
location of artificial fill, no investigation was undertaken there for this study. Instead, the
depths of deposits within the 50 x 50 cm shovel tests conducted by Thompson (2010) at
10 m intervals within the hectare were employed to calculate an estimated volume of
artificial plaza fill. The volume estimate of fill within this hectare from the 2006 shovel
test survey should be treated with caution however, as artifact recovery, rather than

59
Figure 3.3. Hypothetical profile drawing illustrating auger tests at difference levels of fill. Subtracting measurementsfor the average depth of soils developed on the sterile terrace deposits enabled the use of a correction factor of 40 cm.
recording of soil profiles, was the primary objective of Thompson’s work. Shovel tests
were dug to sterile subsoil, except in cases where subsoil exceeded 80 – 90 cm below the
surface.
Results
The results from auger survey and excavation confirmed that artificial fill had
been added to several places around the outer margin of the plaza (Figure 3.4). These
areas include west of Mound F, north, west, and south of Mound G, and east of Mounds
N and O. Also, as discussed, there is possible evidence of plaza fill extending northwest
from Mound J, based on the depth of Thompson’s shovel tests. However, this
investigation also disconfirmed the presence of fill in the vicinity of Mound P, and only
very slight evidence of such was found south of Mound E.
The total amount of artificial plaza fill is roughly 15,150 m3, or 7% of total site
volume (Table 3.1). The combined volume of these artificial fills is approximately
equivalent to that of Mound P, the fifth largest mound at the site (Chapter 2).
Individually, the volume of each formation would have made an average-sized earthwork
at Moundville, had they been constructed as mounds. Plaza investigations were in no
way comprehensive, so other areas of fill may exist that have yet to be located.
40 cm
Artificial Plaza Fill
Depth minus40 cm
Sterile TerraceDeposits
Naturally and culturally-modified soils developedover terrace deposits

60
Figure 3.4. Plan view of the auger survey (dotted transect lines), test excavations (black squares), and areas ofsuspected fill (shaded areas). The suspected area of fill northwest of Mound J was not part of the auger survey and isindicated differently.
Location Amount of Fill m3
West of Mound F 2,545North, West, South of Mound G 5,480
East of Mound N and O 6,540Northwest of Mound J* 580
Total Plaza Fill 15,145Total Mound Fill 191,975
Site Total 207,120
Table 3.1. Plaza fill locations and the estimated amount of soil added in each location, obtained using the griddingmethod, added to the total fill estimated for the site. *Soils were estimated from Thompson’s data, not from auger tests.
A
B
V
CD
E
FF1
F2
S
GX
HT
IJKL
M
M1
N
OW
P
Q
R
B1
U
R1
0 100 m

61
In the following sections, the auger survey and excavations for the areas that
possess plaza fills are discussed individually. Based on the ceramic artifacts recovered
from each unit, an estimated age of the fill is offered. Concluding the presentations for
these positive areas, I will briefly summarize the investigated areas where plaza fill was
not found.
Plaza Area West of Mound F
Mound F is a small mound situated on the eastern side of the plaza, constructed
on a sloping surface at the head of a large ravine. In 1993, Knight (1995, 2009b)
excavated a 2 x 8 m trench unit on the west flank of the mound. In 1996, he returned to
Mound F and placed a 2 x 2 m unit, slightly offset from the original trench, at the base of
the mound (Figure 3.1). The intent of the follow-up excavations was to determine
whether artificial fill extended off the mound, leveling the plaza. Based on the profile
and the depth of the premound midden, which was found to be almost a meter and a half
deep at the toe of the mound, Knight concluded that artificial plaza fill was added, which
continued out into the plaza perhaps some 50 m. He also noted that the fill was
stratigraphically contiguous with the second construction episode of the mound. The
ceramic and radiocarbon evidence recovered at that time indicated that the second stage
of Mound F and the corresponding plaza fill date to the cusp between the early and late
Moundville II phase (Knight 2009b).
To more fully determine the size and extent of the plaza fill, I conducted an auger
survey in the plaza west of Mound F (Figure 3.4). Four transects, each 48 m in length,
were employed with tests at 8 m intervals. Depths to sterile subsoil in this survey area
ranged from 40 cm to 135 cm, increasing as the tests moved closer to the mound. The

62
auger survey also revealed a midden layer deep below the surface in the center of the
survey area, overlapped with a small layer of yellow clay. Upon visible inspection, the
north and south margins of this formation of artificial plaza fill are quite obvious. A lobe
extending west of the mound was clearly constructed to bring the naturally sloping terrain
southwest of the mound up to the common grade. Based on the depths of the auger tests,
the estimated amount of plaza fill west of Mound F is approximately 2,545 m3 (Figure
3.4, Table 3.1).
A formal 1 x 1 m excavation unit, N 1930 E 1263, was placed in the center of the
formation. The unit was positioned approximately 20 m from the mound and was
excavated to a depth of 105 cm (Figure 3.5). The uppermost level (Level A), while
originally fill, is plow-disturbed. The profile of the unit shows a layer, of artificial fill
(Level B), overlying the old humus (Level C), a buried A-horizon /midden (Level D), and
the sterile terrace subsoil (Level E). The distribution and size of artifacts per excavation
level supports the idea that imported fill was used, that is, artifacts recovered at the top
and bottom of the unit were much larger and more frequent, while the fill in between
yielded relatively few sherds. 11 The only pottery recovered from the suspected fill
consisted of small sherds, none much larger than 1 cm in size. In contrast, a thin
occupation level marked by dark rich organic soil (Level D) was discovered below the
fill, which contained several large pottery sherds and bits of fired clay. The profile
(Figure 3.5) also shows a portion of the pure yellow clay layer above the midden seen in
the auger tests.
11 The counts in the Appendix for Unit N 1930 E 1263 may appear deceiving. One should note that theartificial fill layer in all units containing artificial plaza fill is two to three times larger by volume than anyother level. In addition, although the ceramic frequencies are roughly equal between the fill and underlyingstrata, the total weight of artifacts recovered from the underlying humus and a-horizon is more than triplethat of the overlying fill.
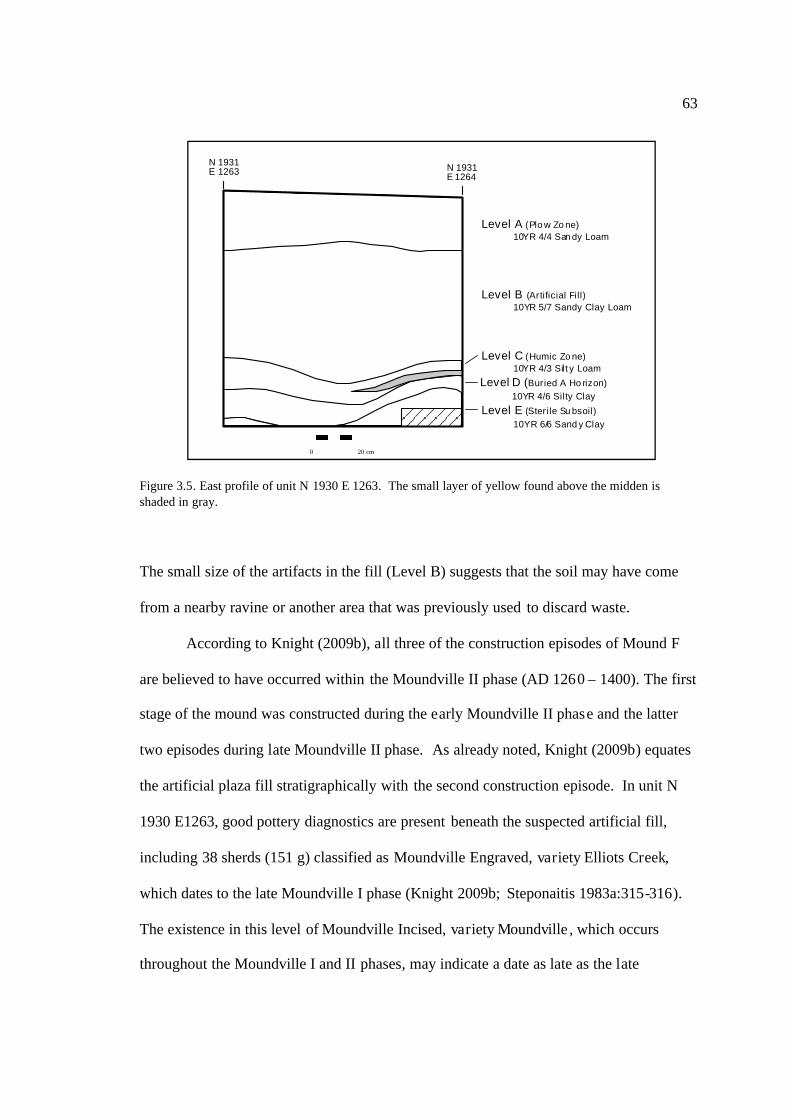
63
Figure 3.5. East profile of unit N 1930 E 1263. The small layer of yellow found above the midden isshaded in gray.
The small size of the artifacts in the fill (Level B) suggests that the soil may have come
from a nearby ravine or another area that was previously used to discard waste.
According to Knight (2009b), all three of the construction episodes of Mound F
are believed to have occurred within the Moundville II phase (AD 1260 – 1400). The first
stage of the mound was constructed during the early Moundville II phase and the latter
two episodes during late Moundville II phase. As already noted, Knight (2009b) equates
the artificial plaza fill stratigraphically with the second construction episode. In unit N
1930 E1263, good pottery diagnostics are present beneath the suspected artificial fill,
including 38 sherds (151 g) classified as Moundville Engraved, variety Elliots Creek,
which dates to the late Moundville I phase (Knight 2009b; Steponaitis 1983a:315-316).
The existence in this level of Moundville Incised, variety Moundville , which occurs
throughout the Moundville I and II phases, may indicate a date as late as the late
Level A (Plow Zone)10YR 4/4 Sandy Loam
N 1931E 1263 N 1931
E 1264
Level C (Humic Zone)10YR 4/3 Silty Loam
Level D (Buried A Horizon)10YR 4/6 Silty Clay
Level E (Sterile Subsoil)10YR 6/6 Sandy Clay
Level B (Artificial Fill)10YR 5/7 Sandy Clay Loam
0 20 cm

64
Moundville II phase. However, all 17 sherds (126 g) within this category found beneath
the artificial fill possess relatively long, closely spaced incised lines radiating from the
incised arch, characteristic of earlier as opposed to later designs (Steponaitis 1983a:324-
325). Diagnostic pottery modes also indicative of a late Moundville I date include two
folded jar rim sherds and one large scalloped rim bowl sherd. Thus, all ceramic evidence
recovered from beneath the fill seems to support a late Moundville I date for the old
humus and A-horizon/midden level, which is consistent with Knight’s dating of the
stratigraphically later plaza fill to the late Moundville II phase (Knight 1995, 2009b).
Among the small sherds found in the suspected fill from the Mound F plaza unit,
eight sherds (25 g) of Baytown Plain, variety Roper, a Moundville diagnostic of the early
Moundville I phase, and a folded-flattened jar rim sherd, also characteristic of the early
Moundville I phase (Scarry 1995:62-64; Steponaitis 1983a:131, 304-305, 1992:6) were
discovered. The most obvious explanation for late Moundville I phase pottery
superimposed by early Moundville I phase pottery is that the deposits above the original
occupied surface consisted of imported artificial fill including a few earlier sherds. Thus,
the best estimate for the age of the artificial fill west of Mound F is the early Moundville
II phase.
Plaza Area Surrounding Mound G
Mound G is a slightly above average-sized mound, by Moundville standards,
situated on the eastern side of the plaza. The mound was constructed on the margin of a
shallow basin that drains to the east and northeast. In 1993, Knight (1995, 2009b)
excavated two 2 x 2 m units, one at the base and one near the top of the northern flank of
the mound. In the base unit, he uncovered four mound construction stages overlying a

65
thick deposit of artificial fill. Underneath the fill lay a shallow old humus with
overlapping wall trenches from structures built on the original ground surface. The
ceramic and radiocarbon evidence indicates that the fill was added either prior to or at the
same time as the earliest construction episodes of the mound, which began during the late
Moundville I phase. It appears that the fill was added to expand the level plaza to the
north and east, so that the earthwork, or at least the majority of it, could be constructed on
a common grade with the remainder of the plaza. This expansion may also have
modified the natural surface drainage, diverting water to the east and southeast instead of
to the north. Knight (2009b) speculated that this change in the landscape may have
created the depression between Mounds H and I, later to be named Lake #1 (Chapter 4).
I conducted an auger survey on all four sides of Mound G in a diamond-shaped
pattern (Figure 3.4). Seven transects ranging in length from 50 m to 80 m were
employed, with tests conducted at 10 m intervals. The results indicate that plaza leveling
occurred to some degree on all sides of the mound except to the east. Artificial fill zones
on the northern and southwestern flanks of the mound were especially thick. The depths
from the auger survey indicate that the artificial plaza fill in this area as calculated using
the gridding method is approximately 5,480 m3 (Figure 3.4, Table 3.1). This artificial fill
constitutes a lobe-like protrusion, slightly off-center from the mound, feathering into the
natural terrace surface of the plaza. This formation is less obvious visually than the area
of fill west of Mound F, but is still notable, especially when standing slightly southeast of
the mound looking west across the plaza.
A 1 x 1 m test unit, N 1780 E 1294, was placed to the southwest of Mound G,
approximately 10 m away from the mound. Results were similar to the excavation unit

66
west of Mound F, in that a layer of artificial fill lay above the original ground surface
(Figure 3.6). Sterile subsoil was not reached until the unit was 115 cm below the
surface. Level A, though plow disturbed, was considered to have originally been
artificial fill. Several layers of strata, including evidence of artificial fill (Level B) and
water-laid sediments, appeared above the old humus (Level C), the buried A-horizon
(Level D), and the sterile terrace subsoil (Level E). When looking at the north and east
wall profiles, one can see how the original surface once sloped to the northeast, not to the
southeast as it does presently. Except in the plow zone, in which an unusual quantity (3.2
kg) of fire-altered Pottsville sandstone was found, artifacts were sparse throughout the
entire unit. However, the few ceramic diagnostics that were recovered indicate that the
original humus dates to the late Moundville I phase, based on a single folded jar rim
sherd (Scarry 1995; Steponaitis 1983a). No diagnostic pottery other than the jar rim was
found below the old humus, but non-diagnostic sherds and charcoal were scattered
throughout both the humus and buried A-horizon soils. Thus, the ceramic evidence
recovered, minute as it may be, seems to support a late Moundville I date for the old
humus level, consistent with Knight’s dating of the plaza fill to the same phase (Knight
1995, 2009b). Artifacts discovered in the plow zone, including a beaded rim bowl sherd
and a short-necked bowl sherd suggest an occupation above the fill which dates between
the late Moundville II and the late Moundville III phases. Regardless, it appears that the
artificial fill on the north, east, and south of Mound G dates to the late Moundville I
phase.
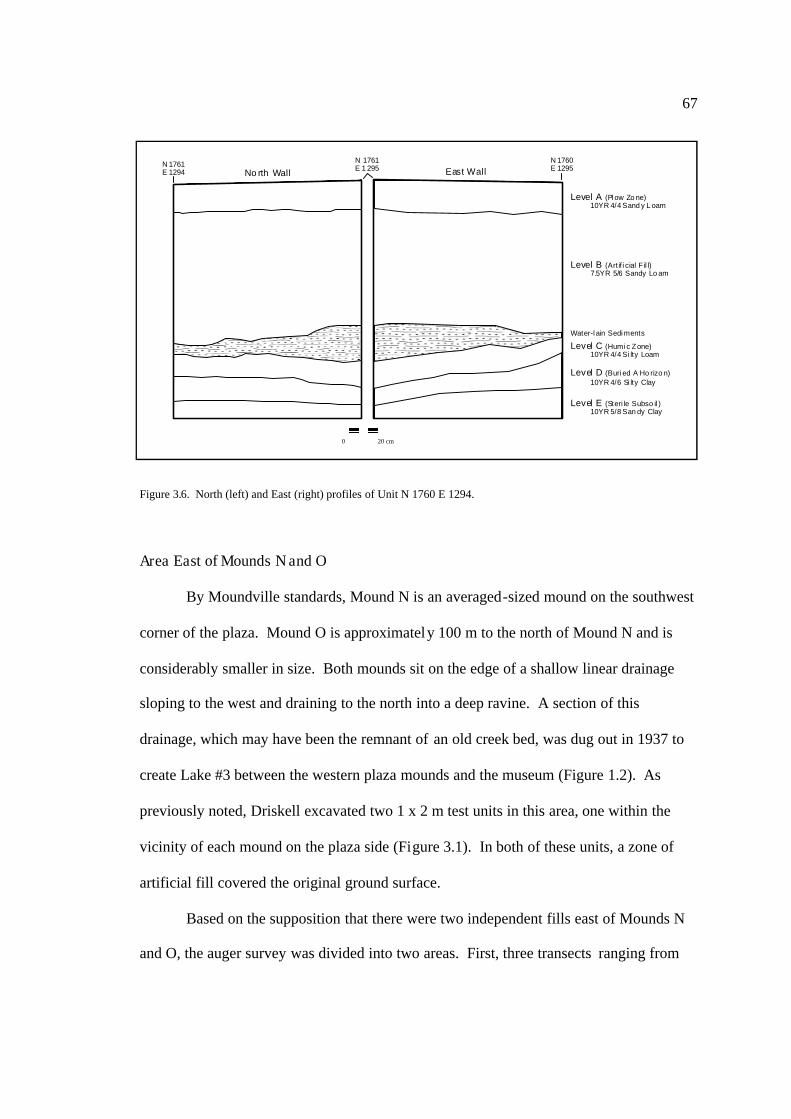
67
North Wall East WallN 1761E 1294
N 1760E 1295
N 1761E 1 295
Level A (Plow Zone)10YR 4/4 Sandy Loam
Level B (Artificial F ill)7.5YR 5/6 Sandy Loam
Level C (Humic Zone)10YR 4/4 Silty Loam
Level D (Buried A Horizon)10YR 4/6 Silty Clay
Level E (Sterile Subsoil)10YR 5/8 Sandy Clay
Water-lain Sediments
Area East of Mounds N and O
By Moundville standards, Mound N is an averaged-sized mound on the southwest
corner of the plaza. Mound O is approximately 100 m to the north of Mound N and is
considerably smaller in size. Both mounds sit on the edge of a shallow linear drainage
sloping to the west and draining to the north into a deep ravine. A section of this
drainage, which may have been the remnant of an old creek bed, was dug out in 1937 to
create Lake #3 between the western plaza mounds and the museum (Figure 1.2). As
previously noted, Driskell excavated two 1 x 2 m test units in this area, one within the
vicinity of each mound on the plaza side (Figure 3.1). In both of these units, a zone of
artificial fill covered the original ground surface.
Based on the supposition that there were two independent fills east of Mounds N
and O, the auger survey was divided into two areas. First, three transects ranging from
Figure 3.6. North (left) and East (right) profiles of Unit N 1760 E 1294.
0 20 cm

68
60 m to 70 m in length with 10 m intervals were established to the east of Mound N.
Second, three transects of 60 m were tested east of Mound O, also at 10 m intervals.
Auger tests revealed that in both areas the depth of the subsoil increases as one moves
from east to west, towards the mounds. Given that a decrease in the depth of the subsoil
was not indicated on the transects closest to the space between these two mounds, it
appears that the lobe is one continuous formation, not two independent fill areas as
originally suspected (Figure 3.4). In addition, midden was found deep below the surface,
over 110 cm in depth, in close proximity to the southeast edge of Mound N. Like
Mounds F and G on the opposite side of the plaza, Mounds N and O were not built on
level ground. Artificial fill was only added on the plaza side of the mound; the opposite
side was not modified. Based on the auger survey and my interpolation of the depths of
the original ground surface between these two mounds, the artificial plaza fill measures
some 6,540 m3.
Two 1 x 1 m test units, N 1791 E 778 and N 1891 E 776, were placed east of
Mounds N and O, respectively. In the unit east of Mound N, I encountered part of an
individually-set post structure, including one large posthole and three smaller postholes
just beneath the plow zone (Level A). This is a house form characteristic of the
Moundville III phase (Lacquement 2007). Associated with the structure in this level
were large amounts of daub and charcoal. There was also some evidence of underlying
fill beneath the structure, as subsoil was uncovered approximately 95 cm below the
surface. However, the buried A-horizons12 (Levels C1, C2) overlying the sterile terrace
deposits (Level E) were much thicker than usual in this area, so the fill (Level B) appears
to be less than 60 cm thick (Figure 3.7). This limited depth makes sense given that the
12 There was not strong evidence of an old humus, but instead two buried A-horizons.

69
Figure 3.7. North Profile of unit N 1791 E 778, east of Mound N.
position of the unit is situated near the edge of the artificial fill formation (Figure 3.4,
Figure 3.9).
The only diagnostic artifacts recovered from Unit N 1791 E 778 which pertain the
age of the fill include two nonlocal sherds, presumably from vessels imported from the
Lower Yazoo Basin, one classified as Carter Engraved, variety Sara and the other Carter
Engraved, variety Unspecified. Carter Engraved, variety Sara dates to the earlier half of
Winterville phase (AD 1200-1350), one of the latest Carter Engraved varieties (Williams
and Brain 1983:139). Based on these two sherds alone, the plaza fill presumably dates to
the late Moundville I/early Moundville II phase. The architectural style, the large amount
of daub (4.9 kg), and a single beaded rim bowl fragment indicate that the upper surface
dates to the Moundville III phase or later. To reiterate, the artificial fill east of Mound N
Level A (Plow Zone)10YR 4/3 Sandy Loam
N 1792E 778 N 1792
E 779
Level B (Artifi cial Fill)10YR 4/7 Sandy Clay Loam
Level C1 (Buried A Horizon)7.5YR 4/6 Sandy Clay
Level D (Sterile Subsoi l)10YR 5/8 Sandy Clay
Level C2 (Buried A Horizon)7.5YR 5/6 Sandy Clay
0 20 cm

70
appears to date to the late Moundville I/early Moundville II phase based on limited
evidence.
Unit N1891 E 776, east of Mound O, yielded results similar to Mound F, in that
concentrations of artifacts were found both above and below a layer of artificial fill,
which itself contained much smaller and less frequent cultural debris. The unit was
approximately 15 m from Mound O, and was excavated to a depth of 100 cm (Figure
3.8). The uppermost level (Level A), though plow disturbed, was originally plaza fill.
Artificial fill (Level B) was found above an old humus containing a small midden layer
(Level C), a buried A-horizon (Level D), and sterile terrace deposits (Level E). However,
as with the units near Mounds G and N, very little diagnostic pottery was recovered. A
diagnostic pottery mode recovered from Level C, the suspected original ground surface,
includes a single folded jar rim sherd dating to the late Moundville I phase, suggesting
N 1892E 776 N 1931
E 1264
Level A (Plow Zone)10YR 4/3 Sandy Loam
Level B (Artificial Fill)10YR 5/4 Sandy Clay Loam
Level C (Humic Zone/Midden)10YR 4/4 Silty Loam
Level D (Buried A Horizon)10YR 4/6 Sandy Clay Loam
Level E (Sterile Subsoil)10YR 5/8 Sandy Clay
0 20 cm
Figure 3.8. North Profile of unit N 1891 E 776, east of Mound O. A small midden layer found in Level C is shown inthe shaded area.
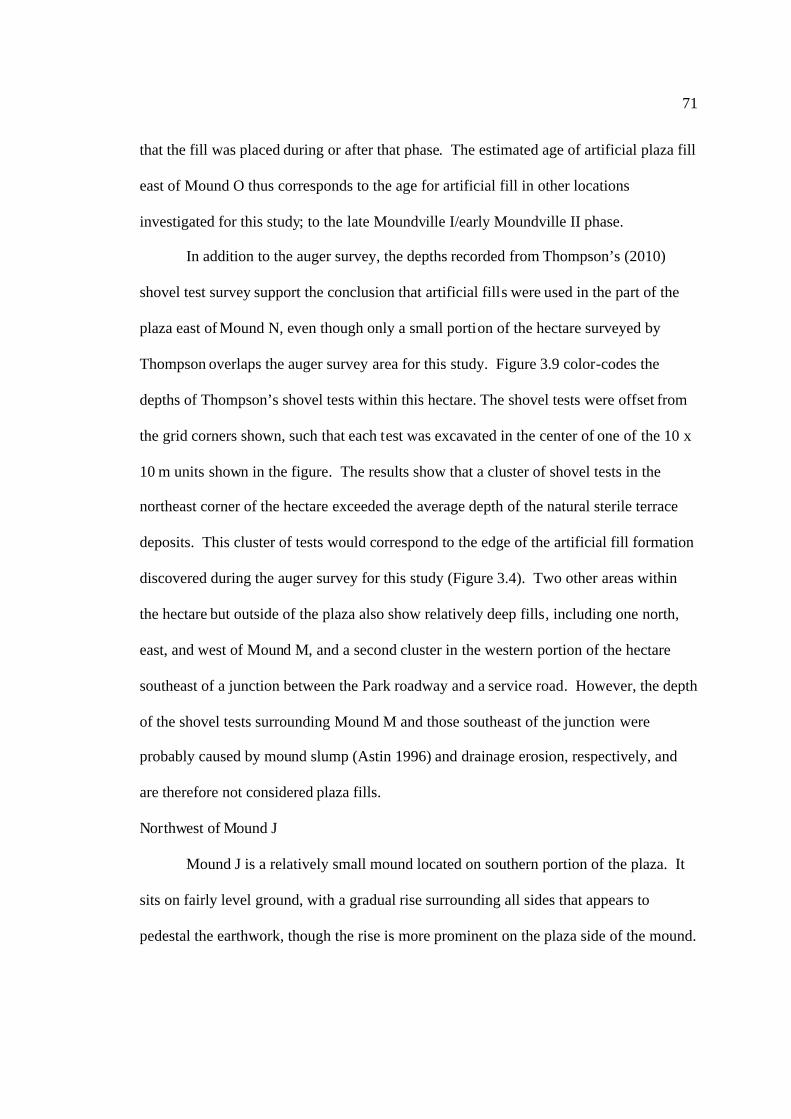
71
that the fill was placed during or after that phase. The estimated age of artificial plaza fill
east of Mound O thus corresponds to the age for artificial fill in other locations
investigated for this study; to the late Moundville I/early Moundville II phase.
In addition to the auger survey, the depths recorded from Thompson’s (2010)
shovel test survey support the conclusion that artificial fills were used in the part of the
plaza east of Mound N, even though only a small portion of the hectare surveyed by
Thompson overlaps the auger survey area for this study. Figure 3.9 color-codes the
depths of Thompson’s shovel tests within this hectare. The shovel tests were offset from
the grid corners shown, such that each test was excavated in the center of one of the 10 x
10 m units shown in the figure. The results show that a cluster of shovel tests in the
northeast corner of the hectare exceeded the average depth of the natural sterile terrace
deposits. This cluster of tests would correspond to the edge of the artificial fill formation
discovered during the auger survey for this study (Figure 3.4). Two other areas within
the hectare but outside of the plaza also show relatively deep fills, including one north,
east, and west of Mound M, and a second cluster in the western portion of the hectare
southeast of a junction between the Park roadway and a service road. However, the depth
of the shovel tests surrounding Mound M and those southeast of the junction were
probably caused by mound slump (Astin 1996) and drainage erosion, respectively, and
are therefore not considered plaza fills.
Northwest of Mound J
Mound J is a relatively small mound located on southern portion of the plaza. It
sits on fairly level ground, with a gradual rise surrounding all sides that appears to
pedestal the earthwork, though the rise is more prominent on the plaza side of the mound.

72
Figure 3.9. Hectare N 1700 E 700 showing the depths of shovel tests by Thompson. Each square of the grid is 10 m by10 m and the small black square in the upper right is unit N 1791 E 778, excavated for this study. Note that shovel testswere conducted 5 m offset from the grid, such that each shovel test was placed in the center of units shown (data fromClaire Thompson, used by permission).
As previously mentioned, Blitz and Thompson excavated and conducted shovel tests
respectively between Mounds J and K. However, neither auger survey nor excavations
were conducted in this area as part of the present study. Based solely on Thompson’s
shovel test depths, areas of possible fill are shown in Figure 3.10. At first glance, there
appear to be three or possibly four locations of fill. However, among these I am only
comfortable including the area northwest of Mound J as an area of possible artificial
plaza fill. Even so, there is a possibility that the formation there is the result of mound
restoration projects conducted by the Alabama Museum of Natural History and the CCC
in the late 1930s in which heavy machinery was used in this area (Jones 1941; Knight
= Not Tested= 50 - 60 cm
= 60 - 70 cm
= 70 - 80 cm
= 80 + cm
N
Mound N
Mound MN 1700E 700
N 1800E 700
N 1800E 800
N 1700E 800
73
1989). The volume of the fill northwest of Mound J is estimated at some 580 m 3. The
other areas yielding unusually deep shovel tests, north and southeast of Mound K and
north of Mound J, seem suspect to me. The area surrounding the southeast margin of
Mound K appears to be mound slump. It is also not on the plaza side of the mound, as
are all of the other verified artificial plaza fill areas at the site. It is possible that the other
areas were at one time small borrow pits that were refilled by plowing and erosion.
Moore (1905:130) indicates depressions near several of the mounds outside the plaza,
created by extracting soil for construction. Some contained water, while others had
ditches dug to drain them during the late 19th and early 20 th century. James D. Middleton
Mound K
= Not Tested
= 50 - 60 cm= 60 - 70 cm
= 70 - 80 cm= 80 - 90 cm
N
Mou
ndJ
= 90 + cm
N 1700E 1000
N 1800E 1000
N 1800E 1100
N 1700E 1100
Figure 3.10. Hectare N 1700 E 1000 showing the depths of shovel tests conducted by Thompson. Each square of the gridis 10 m by 10 m and the small black box in the upper center is the 4 x 4 m unit excavated by Blitz in 2006 and 2007. Notethat shovel tests were conducted 5 m offset from the grid, such that tests were placed in the center of th e units shown (datafrom Claire Thompson, used by permission).
74
also made note of several small depressions during his visit to Moundville in 1882
(Steponaitis 1983b).
Areas in Which Plaza Fill was Not Found
Three other areas were tested either by auger survey or by test excavations. These
areas, which provided limited or no evidence of fill, include south of Mound E, as well as
east and northeast of Mound P.
The plaza area south of Mound E was systematically auger tested given its close
proximity to Mound F. Mound E is a broad but low mound in the northeast corner of the
plaza, situated near the head of a ravine which surrounds the north and east of the mound.
However, due to the presence of a documented prehistoric cemetery on the east side of
the suspected formation (Peebles 1979), only the western half was tested. Two transects
of 80 m with 10 m intervals produced varying depths of subsoil ranging from 40 to 80 cm
and virtually no artifacts. It also should be noted that the subsoil south of Mound E was
very difficult to distinguish from overlying strata in both color and textural
characteristics. At this point, therefore, only limited evidence of fill exists south of
Mound E based on the deeper readings of a few auger tests, and if anything, it appears to
be filling in low isolated points instead of attempting to alter the slope.
In addition, two 1 x 1 m test units were placed in the vicinity of Mound P. Unit N
1960 E 762 was placed in the plaza, 5 m east of the base of the mound. The other test
unit, N 2021 E 784, was 30 m northeast of Mound P. Other than an occasional
exploratory test, no systematic auger testing was conducted in these areas.
Unit 1960 E 762 was excavated to test for fill in the plaza east of the mound, just
as it was discovered east of Mounds N and O. Based on visual inspection of the terrain, it

75
appeared that only a small strip leading up to the mound might be artificial, if anything,
thus the unit was placed very close to the mound. Unit N 1960 E 762 produced many
artifacts given its shallow depth; however, this abundance should probably be attributed
to mound slope erosion (Figure 3.11, Level A). Diagnostic artifacts recovered below the
mound slump in the old humus (Level B) and A-horizon (Level C) include several modes
that appear during the Moundville I phase, such as five folded jar rim sherds, a folded-
flattened jar rim sherd, and five sherds (30 g) of the type Baytown Plain, variety Roper.
An artifact from the overlying slump, a single rim fragment possessing vertical lugs,
dates to the Moundville IV phase (Steponaitis 1983a:131). The stratigraphy in Unit N
1960 E 762 was almost identical to those units excavated by Driskell in the center of the
plaza, except for a thick layer of overlying mound slump. Thus, it does not appear that
any artificial plaza fill occurs in the plaza east of Mound P.
As for the unit northeast of P, N 2021 E 784, the unit was also similar to those
excavated in the central plaza (Figure 3.12). An abrupt ledge between this unit and
Mound Q looked to be artificial, and it was for this reason the area was tested. However,
there was no evidence of any artificial fill. The only surprise was the color of the subsoil,
which was a deep dark red (5YR 4/6) sandy clay. Diagnostic artifacts indicate a date
relatively late in the Moundville sequence for the occupation of this area. Based on the
presence of two sherds (7 g) classified as Moundville Engraved, variety Taylorville and a
fragment from a beaded rim bowl, the deposit appears to date to the late Moundville
II/early Moundville III phase.

76
Figure 3.11. North profile of unit N 1960 E 762.
Figure 3.12. North Profile of Unit N 2021 E 784.
Discussion and Chronology
Based on auger survey and test excavations, the use of artificial plaza fill ar ound
the outer margins of the plaza is confirmed for certain areas but disconfirmed for others.
Plaza fill appears to be added in at least four locations: west of Mound F; north, west, and
south of Mound G; east of Mounds N and O; and perhaps northwest of Mound J. The
artifacts and radiocarbon evidence from previous research as well as excavations for this
project indicate that the modifications took place relatively early in the Moundville
sequence, between the late Moundville I and early Moundville II phases, beginning
Level A (Mound Slump/Plow Zone)10YR 6/4 Sandy Clay
N 1961E 762
N 1961E 1263
Level B (Buried Humic Zone)10YR 5/4 Clay Loam
Level C (Buried A Horizon)10YR 4/6 Sandy Clay
Level D (Sterile Subsoil)10YR 5/6 Sandy Clay
Level A (Plow Zone)10YR 3/4 Sandy Clay
N 2022E 784 N 2022
E 785
Level B (A Horizon)10YR 4/6 Sandy Clay Loam
Level C (Sterile Subsoil)5YR 4/6 Sandy Clay
0 20 cm
0 20 cm

77
roughly the same time that mound construction began around the plaza margins (Knight
1989, 1998). This chronology indicates that the physical modifications were envisioned
and completed before many of the mounds were constructed or had reached their final
form. Furthermore, all of the areas tested which were modified by plaza fills possessed
old surfaces were previously occupied during the late Moundville I/early Moundville II
phase. Then, after the plaza fill episodes, many of the areas tested were subsequently
used later in the Moundville sequence, as near Mounds G and N, as late as the
Moundville III phase.
The point of the auger survey was to determine the volume and spatial extent of
each of the artificial plaza fills, and the excavations were to determine their chronology.
The volume of the plaza fill as estimated by the gridding method has added to the total
volume of earth construction, to improve the accuracy of the energetics assessment yet to
come. These physical modifications to the plaza must be considered monumental
constructions, having consumed large amounts of energy and labor that are not typically
considered in the site’s construction.
Obviously, the level appearance of the plaza was highly important to
Moundville’s inhabitants. The volume of the fill abutting some mounds is almost as
much soil as was used to construct the mounds themselves. If only the size of the
mounds were important, then devoting this much labor to plaza leveling would have
subtracted from that purpose. Evidence of plaza modifications at Mississippian mound
centers that must have taken large quantities of labor to complete have been slowly
surfacing in the last several decades. For example, Lewis Larson (1989) maintains that
the plaza fronting Mound A at Etowah was artificially raised half a meter in height and

78
was covered in clay. Based on cases like Etowah and Moundville, I would argue that
such plazas at major centers needed to meet certain physical requirements and that
appropriate action was taken to achieve that end. Ignoring aspects such as plaza
modifications greatly underestimates the planning and energy that was involved in
modifying landscapes by Mississippian people.
79
Chapter 4
Location of Soil Extraction Areas
In formulating the energetics assessment proposed for this study, it is necessary to
calculate transportation energy. The energy expended in transporting soil from extraction
area to construction site would have been substantial. Calculating transportation energy
involves knowing, or at least making an educated guess, where soils for construction
were extracted. At many mound sites, the locations of borrow pits - depressions where
soil was removed to create the earth monuments - are quite obvious, as they are either
still visible or can be detected using excavation, augering, or various forms of remote
sensing. For example, at McKeithen, a Weeden Island culture mound site in northern
Florida, at least seven borrow pits have been identified (Milanich et al. 1997). At the
large Mississippian center of Cahokia in southern Illinois, several rather large borrow pits
exist, including some that were refilled by prehistoric inhabitants (Holley et al. 1993).
However, at many mound sites, such as Moundville, borrowing locations are not as easy
to recognize. Soil may have come from areas not readily identifiable as soil extraction
locations, or from smaller borrow pits that have been refilled naturally through erosion or
agricultural plowing, or filled by original inhabitants with debris. The objectives of this
chapter are to approximate where soil was extracted for the mound and plaza
constructions at Moundville, to report soil samples taken from these localities, and to
report the distance between probable borrow areas and mound constructions. The

80
distances from the source of earth to the construction sites will be factored into the
energetics analysis (Chapter 6).
To determine these distances, two approaches were used. The first was to conduct
an examination of the modern-day history of Moundville. This investigation was mainly
concerned with the restoration projects carried out by the Alabama Museum of Natural
History in the 1930s, but also was attuned to earlier accounts, maps, and photographs of
the site to determine if the localities currently labeled as borrow pits were in fact those
used by prehistoric inhabitants of the site. Knowing which borrow pits are true soil
extraction locations is important in estimating the distances of each construction to the
nearest source. By measuring from a misidentified borrow pit or by overlooking a
genuine one, the distances between construction and excavation locations may be
severely skewed. An examination of early records will show that it is probable that not
all of the four formally named borrow pits at Moundville were created prehistorically.
Second, to confirm that soil from suspected borrow locations is comparable to
archaeologically excavated mound and plaza soils, soil samples from 42 locations at
Moundville, mainly from the northern portion of the site, were collected, described, and
compared to the descriptions of soil from various reports of mound excavations (Driskell,
notes on file, Alabama Museum of Natural History; Gage 2000; Gage and Jones 2001;
Knight 1995, 2009b). Based on the combined information obtained from the historical
survey and the soil samples, distances from each mound and plaza fill location to the
nearest plausible extraction location were calculated.
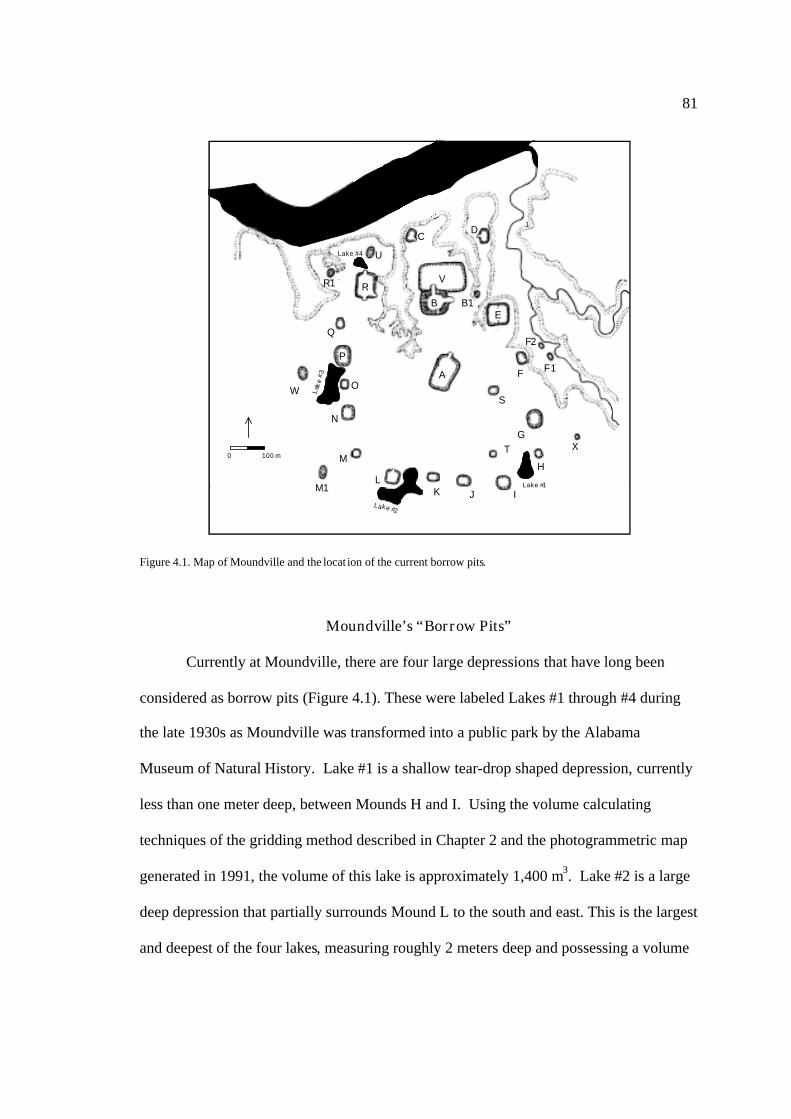
81
Figure 4.1. Map of Moundville and the locat ion of the current borrow pits.
Moundville’s “Borrow Pits”
Currently at Moundville, there are four large depressions that have long been
considered as borrow pits (Figure 4.1). These were labeled Lakes #1 through #4 during
the late 1930s as Moundville was transformed into a public park by the Alabama
Museum of Natural History. Lake #1 is a shallow tear-drop shaped depression, currently
less than one meter deep, between Mounds H and I. Using the volume calculating
techniques of the gridding method described in Chapter 2 and the photogrammetric map
generated in 1991, the volume of this lake is approximately 1,400 m3. Lake #2 is a large
deep depression that partially surrounds Mound L to the south and east. This is the largest
and deepest of the four lakes, measuring roughly 2 meters deep and possessing a volume
A
B
V
CD
E
F F1
F2
S
GX
H
T
IJKL
M
M1
N
OW
P
Q
R
B1
U
R1
0 100 m
1
Lake #4
Lake
#3
Lake #2
Lake #1

82
“Borrow Pit” Volume m3
Lake #1 1,400
Lake #2 14,800
Lake #3 6,400
Lake #4 2,100
Total 24,700
Table 4.1. Current volume of the four borrow pits at Moundville.
of 14,800 m3. Lake #3 is large rectangular depression on the west side of Mounds N, O,
and P and adjacent to the Moundville museum, which overlooks the lake on the east. The
lake is currently less than a meter deep and is roughly 6,400 m3 in volume. Lake #4 is a
shallow tear-drop shaped depression north of Mound R, currently about 1.25 meters deep
and approximately 2,200 m3 in volume (Table 4.1). As noted, there has been some debate
as to whether these four lakes are truly borrow pits used by prehistoric inhabitants to
construct the Moundville landscape. Regardless, even if all four borrow pits were used,
their volume only accounts for 24,700 m3 or less than 12 percent of the total earth moved
to create the Moundville landscape (Table 4.1., Chapter 2, 3). Therefore, even if all four
borrow pits are prehistoric, the bulk of the soil for mounds and plaza construction must
have come from somewhere other than Lakes #1 through #4. The subsequent discussion
is a chronologically-based presentation highlighting significant information regarding the
number, size, and location of prehistoric borrow pits. It should be noted that the
numerical designations were not assigned to these depressions until December 1937, just
months prior to the creation or re-contouring of these lakes.13
13 The first appearance of a numerical designation of a lake appears in December 1937, that of Lake 2 [no#], in a letter from Walter B. Jones to the Regional Director of the National Park Service (see Jones 1941:9for excerpt).

83
James D. Middleton of the Smithsonian Institution’s Bureau of American
Ethnology surface collected at Moundville in 1882 and produced a badly-drawn sketch
map of the site (Steponaitis 1983b). In sketching the site layout, his positions and
distances between mounds were almost completely inaccurate. Interestingly, though,
Middleton noted ponds, ditches, and sloughs (or marshes) surrounding certain mounds.
This is the earliest record describing such depressions at the site. In his unpublished
report, Middleton noted ponds adjacent to Mounds K, L, and Q, a ditch around Mound L,
and a slough encompassing three sides of Mound E. Middleton placed a ditch and a
pond around Mounds K and L in the vicinity of where Lake #2 is today. Also indicated
in Middleton’s notes is a small pond northwest of Mound L. Other more recent
indications of this particular depression include a topographic map by G.W. Jones and
Sons dated 1930 (on file, Alabama Museum of Natural History); it also may be visible in
an aerial photograph from 1933 (Figure 4.3). Using the gridding method as described in
Chapter 2, the volume of this depression is estimated to have been approximately 530 m3
based on the contour information from the 1930 topographic map. There is a possibility
that this depression was at one time a very small borrow pit, but this seems odd as it
closely borders the plaza’s edge. Concerning the other main borrow pits, Middleton
makes no mention of ditches, ponds, or sloughs southwest of Mounds H and I, west of
Mound P, or north of Mound R where Lakes #1, #3, and #4 respectively are currently
located.
In 1902, a photograph taken by Dr. Robert S. Hodge shows a large depression at
Moundville abutting an earthen mound, which at the time was holding water (Figure
4.2.). Decades later in a letter from Jones to the Regional Director of the National Park
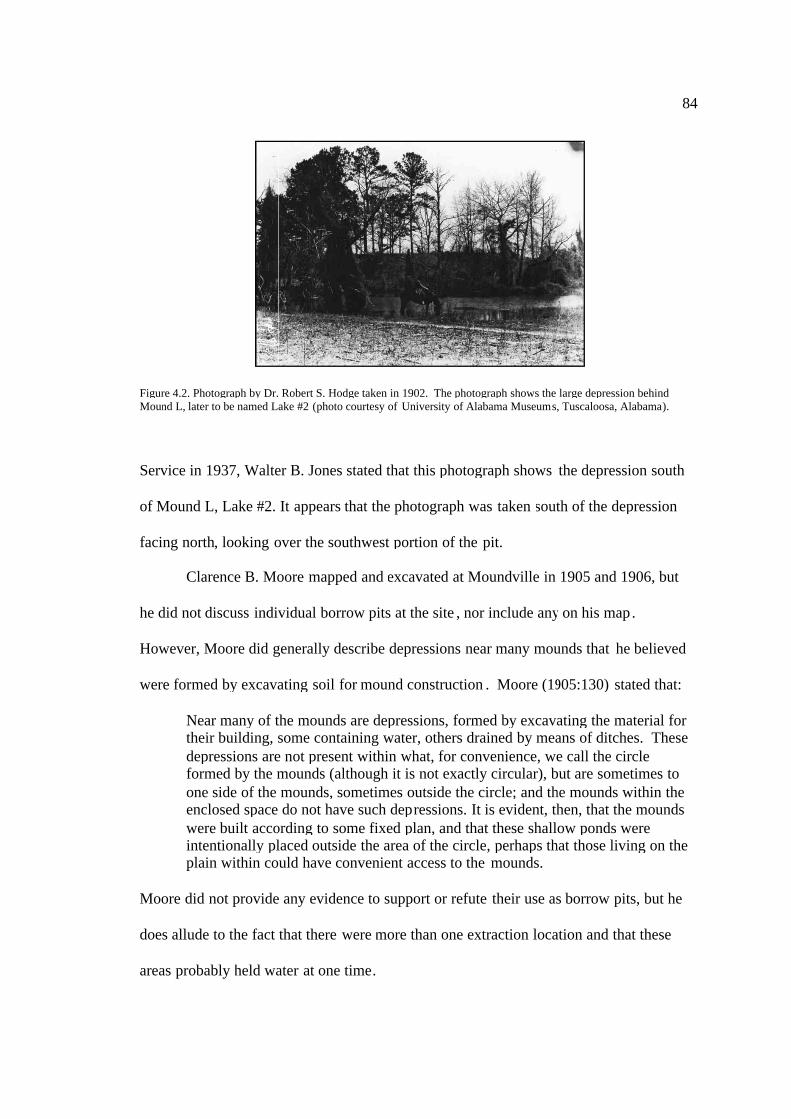
Figure 4.2. Photograph by Dr. Robert S. Hodge taken in 1902. The photograph shows the large depression behindMound L, later to be named Lake #2
Service in 1937, Walter B. Jones stated that this photograph shows
of Mound L, Lake #2. It
facing north, looking over the southwest portion of the
Clarence B. Moore
he did not discuss individual
However, Moore did generally describe depressions near many mounds that
were formed by excavating
Near many of the mounds are depressions, formed by excavating the material fortheir building, some containing water, others drained by means of ditches. Thesedepressions are nformed by the mounds (although it is not exactly circular), but are sometimes toone side of the mounds, sometimes outside the circle; and the mounds within theenclosed space do not have such depwere built according to some fixed plan, and that these shallow ponds wereintentionally placed outside the area of the circle, perhaps that those living on theplain within could have convenient access to the
Moore did not provide any evidence to support or refute
does allude to the fact that there
areas probably held water
Figure 4.2. Photograph by Dr. Robert S. Hodge taken in 1902. The photograph shows the large depression behindnd L, later to be named Lake #2 (photo courtesy of University of Alabama Museums, Tuscaloosa, Alabama
Service in 1937, Walter B. Jones stated that this photograph shows
Lake #2. It appears that the photograph was taken south of the depression
over the southwest portion of the pit.
Clarence B. Moore mapped and excavated at Moundville in 1905 and 1906, but
individual borrow pits at the site , nor include any on his map
generally describe depressions near many mounds that
by excavating soil for mound construction . Moore (1905:130)
Near many of the mounds are depressions, formed by excavating the material fortheir building, some containing water, others drained by means of ditches. Thesedepressions are not present within what, for convenience, we call the circleformed by the mounds (although it is not exactly circular), but are sometimes toone side of the mounds, sometimes outside the circle; and the mounds within theenclosed space do not have such depressions. It is evident, then, that the moundswere built according to some fixed plan, and that these shallow ponds wereintentionally placed outside the area of the circle, perhaps that those living on theplain within could have convenient access to the mounds.
not provide any evidence to support or refute their use as
does allude to the fact that there were more than one extraction location and that these
held water at one time.
84
Figure 4.2. Photograph by Dr. Robert S. Hodge taken in 1902. The photograph shows the large depression behinds, Tuscaloosa, Alabama).
the depression south
south of the depression
excavated at Moundville in 1905 and 1906, but
, nor include any on his map.
generally describe depressions near many mounds that he believed
. Moore (1905:130) stated that:
Near many of the mounds are depressions, formed by excavating the material fortheir building, some containing water, others drained by means of ditches. These
ot present within what, for convenience, we call the circleformed by the mounds (although it is not exactly circular), but are sometimes toone side of the mounds, sometimes outside the circle; and the mounds within the
ressions. It is evident, then, that the moundswere built according to some fixed plan, and that these shallow ponds wereintentionally placed outside the area of the circle, perhaps that those living on the
their use as borrow pits, but he
more than one extraction location and that these
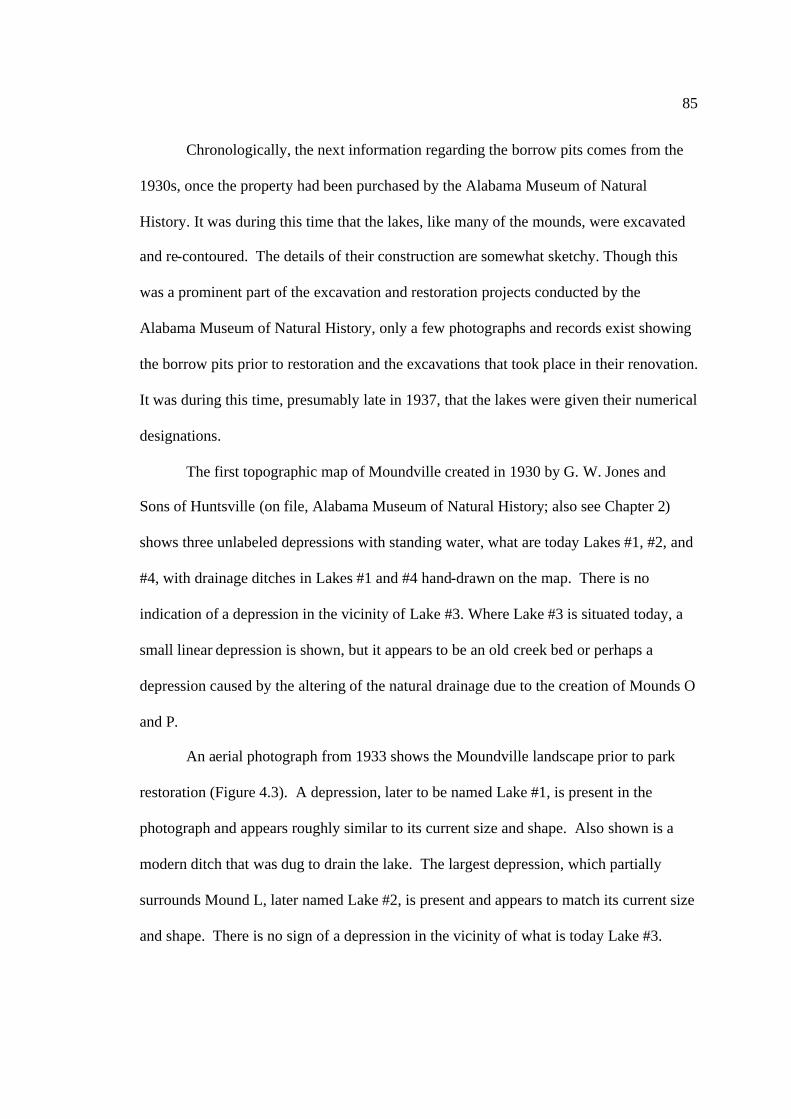
85
Chronologically, the next information regarding the borrow pits comes from the
1930s, once the property had been purchased by the Alabama Museum of Natural
History. It was during this time that the lakes, like many of the mounds, were excavated
and re-contoured. The details of their construction are somewhat sketchy. Though this
was a prominent part of the excavation and restoration projects conducted by the
Alabama Museum of Natural History, only a few photographs and records exist showing
the borrow pits prior to restoration and the excavations that took place in their renovation.
It was during this time, presumably late in 1937, that the lakes were given their numerical
designations.
The first topographic map of Moundville created in 1930 by G. W. Jones and
Sons of Huntsville (on file, Alabama Museum of Natural History; also see Chapter 2)
shows three unlabeled depressions with standing water, what are today Lakes #1, #2, and
#4, with drainage ditches in Lakes #1 and #4 hand-drawn on the map. There is no
indication of a depression in the vicinity of Lake #3. Where Lake #3 is situated today, a
small linear depression is shown, but it appears to be an old creek bed or perhaps a
depression caused by the altering of the natural drainage due to the creation of Mounds O
and P.
An aerial photograph from 1933 shows the Moundville landscape prior to park
restoration (Figure 4.3). A depression, later to be named Lake #1, is present in the
photograph and appears roughly similar to its current size and shape. Also shown is a
modern ditch that was dug to drain the lake. The largest depression, which partially
surrounds Mound L, later named Lake #2, is present and appears to match its current size
and shape. There is no sign of a depression in the vicinity of what is today Lake #3.

86
Figure 4.3. Aerial photograph of Moundville, 1933 (courtesy of University of Alabama Museums, Tuscaloosa,Alabama).
Instead, there is a small road cutting directly though the area where the lake resides
today. The same level area is visible in an aerial photographs taken in 1936 (Figure 4.4)
and 1938 (Figure 2.6). No depression in the area of Lake #4 is visible in the 1933
photograph, though it is labeled on the photograph simply as “Lake.” In addition, as
noted, there also appears to be a smaller depression within the plaza northwest of Mound
L, one that appears in Middleton’s notes and also on the 1930 topographic map. Walter
B. Jones and the Alabama Museum of Natural History dug exploratory trenches in at
least one, perhaps two, of the four borrow pits (Lake #4, and possibly Lake #3) in 1938.
Lake #4 is the best-documented of the four lake restorations. In the depression north of
Mound R, what is today Lake #4, at least three five-foot-wide excavation trenches
running north to south and one five-foot- wide trench running east to west,
perpendicularly intersecting the other three trenches, were dug in January of 1938. There
are no notes, artifacts, feature or burials forms, and no excavation plans or profiles from
this work. For the restoration of Lake #4, however, there does exist a series of three
87
Figure 4.4. Aerial photograph of Moundville, 1936.
photographs, each taken from the same location, indicating the sequence of events that
had taken place (Figure 4.5). The first photograph, taken in January 1938, shows the pre-
landscaped terrain and excavation trenches. It should be noted that the prior 1936 aerial
photograph does clearly show a depression where the lake is located today, and Jones
states that the trenches revealed the depth and extent of the silt at the base of this lake.
This evidence would rather strongly indicate that Lake #4 was in fact a silted -in borrow
pit.
Like Lake #4, Lake #3 has no notes, feature forms, or plans or profiles
documenting formal excavations in advance of lake con struction. There is a photograph
taken by Walter B. Jones in 1938 showing the museum construction, which also
inadvertently shows a rather level terrain west of Mounds O and P, where Lake #3 is
currently located (Figure 4.6). A collection of artifacts is located at the Alabama
Museum of Natural History from the January 1938 excavation of Lake #3. If formal
excavations took place, the excavation area is not shown on any extant maps and there is
no documentation as to the size, method, or location of excavated units. The only
0 100 m
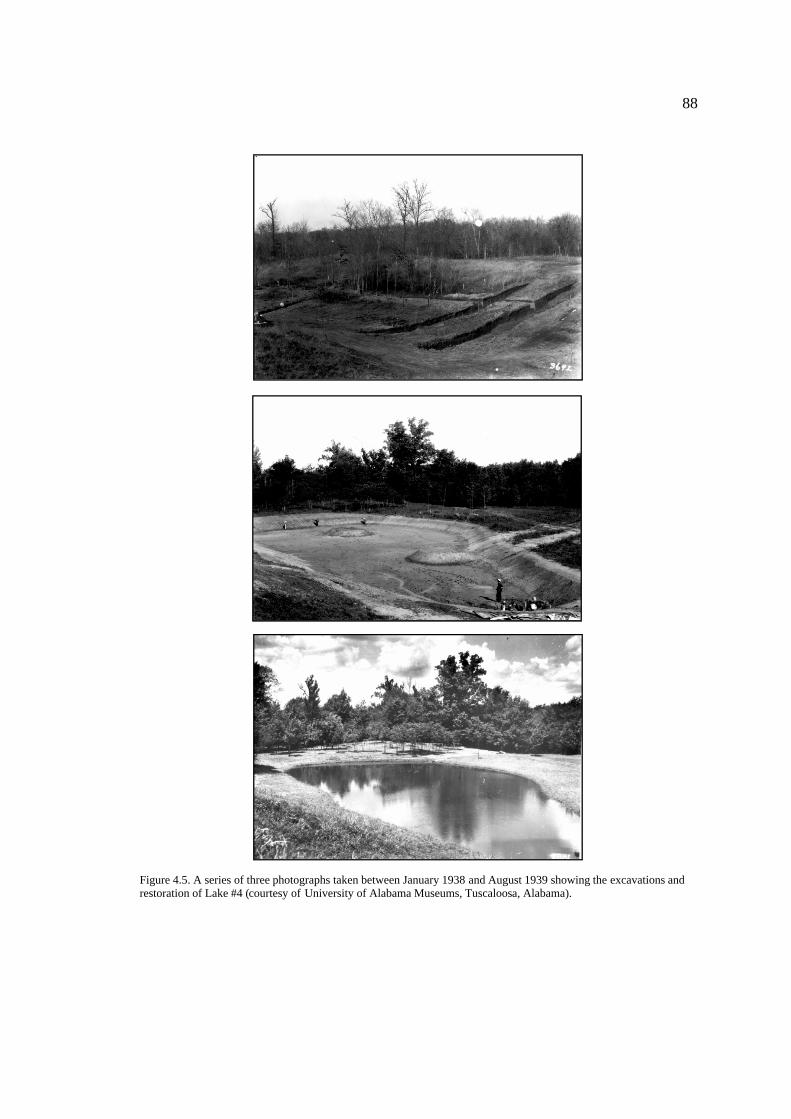
88
Figure 4.5. A series of three photographs taken between January 1938 and August 1939 showing the excavations andrestoration of Lake #4 (courtesy of University of Alabama Museums, Tuscaloosa, Alabama).

89
evidence of an excavation is an entry in the Mound State Monument Administrative
Records, Moundville Alabama, which simply describes the corresponding artifact
collection (on file, Alabama Museum of Natural History). According to t his description,
no burials were encountered in the excavations but there were 5,067 ceramic sherds and
44 field specimens (non-ceramic artifacts) recovered.
There is no evidence of any formal archaeological excavations in Lakes #1 and
#2. Both lakes appear very similar in size and shape as the depressions evident on maps
and aerial photographs prior to restoration. In addition, there is no documentation of
excavation or any cataloged artifacts from either location. There is no question that these
depressions were there prior to restoration projects. However, during the late 1930s a
small island was added in the center of Lake #2, very similar to the islands sculpted in the
construction of Lake #4 as shown in the middle photograph of Figure 4.5. Several smaller
islands were also created in Lake #3.
Figure 4.6. Photograph taken in August 1938 of museum construction. The photograph was taken looking north -northwest, from atop Mound N, and shows two mounds, Mound O the closest and Mound P in the distance. Note thefairly level ground and road running directly through where Lake #3 is located today. The original caption by Jonesreads “Across lake and new museum looking northwest from Mound N. White stakes represent shore line” (courtesy ofUniversity of Alabama Museums, Tuscaloosa, Alabama) .
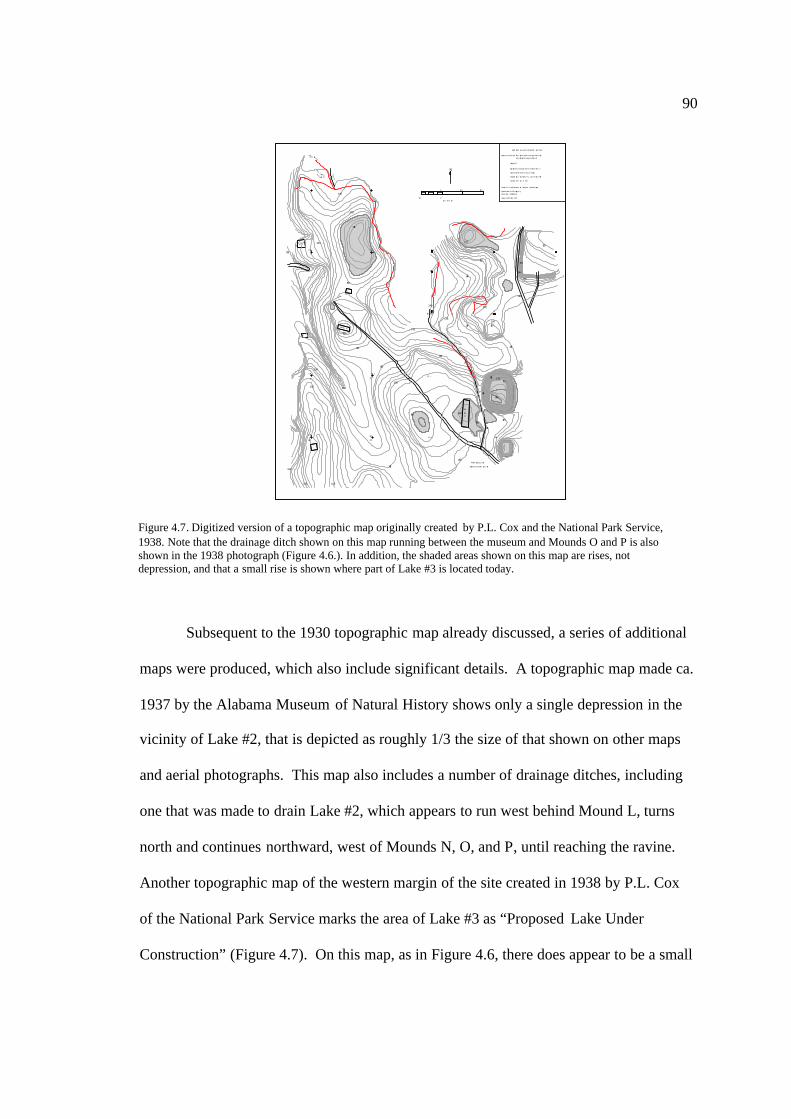
90
Subsequent to the 1930 topographic map already discussed, a series of additional
maps were produced, which also include significant details. A topographic map made ca.
1937 by the Alabama Museum of Natural History shows only a single depression in the
vicinity of Lake #2, that is depicted as roughly 1/3 the size of that shown on other maps
and aerial photographs. This map also includes a number of drainage ditches, including
one that was made to drain Lake #2, which appears to run west behind Mound L, turns
north and continues northward, west of Mounds N, O, and P, until reaching the ravine.
Another topographic map of the western margin of the site created in 1938 by P.L. Cox
of the National Park Service marks the area of Lake #3 as “Proposed Lake Under
Construction” (Figure 4.7). On this map, as in Figure 4.6, there does appear to be a small
MUS
EUM
FL
OOREL
EV.
PROP OSEDL AKE
UNDERCONSTR UCT I ON
B-1 1
C-1 1
B-10
2
D-1 1 + 10 D-1 0
N
E-1 1 E-1 0
T
T
MUS EU M
C-1 2
49 . 5
C-13
53 . 2
B-13
56 .8
B-1 2
47. 8
R IVE R BA
NK
DIT
CH
SCA
TTE R
ED
WO
O DS
RES
T
WE LL
E-13 E-1 2
175
170
165
160
155
160
155
150
145
140
155
160
165
150
145
150
155
150
150
145140
135
155
150
150
155
160
155
150
145
150
155
155155
150
140
145
150
145
150
180
175170165
160
155
150
150
155
160
MOU NDVI LL EARCHEOLOGIC AL PARK
Alab a ma Hi sto r ica l Co m mis s io n /Uni v e rsi ty of A la b a ma
Mo u nd v ille M ap p in g Proj e ct
Dep a rt me n t of Ge o gra p h y
Univ e r sity o fA la ba ma
Aug u s t2 8, 1 99 2 J MP
Ma p #9 2 -7
Dig i tize d fr o mDe pa r tme n t of th e In te ri o r
Na ti on a lPa rk Se rvi c e so u r ce map
Ori g ina l lys u r ve y ed b y P.L . Co x Se pt. 1 9 38
Co n tou r in te r va l =1 fo ot
0 10 0 20 0
0
sc a l ei n f ee t
N
Cen te r fo r L an d In fo rma t ion An a ly sis a nd Ma p pin g
10 0
Figure 4.7. Digitized version of a topographic map originally created by P.L. Cox and the National Park Service,1938. Note that the drainage ditch shown on this map running between the museum and Mounds O and P is alsoshown in the 1938 photograph (Figure 4.6.). In addition, the shaded areas shown on this map are rises, notdepression, and that a small rise is shown where part of Lake #3 is located today.

91
depression southwest of Mound P and two modern drainage ditches leading away from
this depression, one running north to drain the area behind Mounds O and P and one
running northwest coming from the southern portion of the site used to drain Lake #2. I
do not however believe the depression west of Mounds O and P is a true borrow pit.
There was no mention of deeply buried artifacts covered by silt as was the case with Lake
#4, and given the terminology used it probably instead was a topographic low caused by
the creation of the mounds on the western edge of the plaza.
In addition to the series of topographic maps produced in the 1930s, there is a
hand-drawn, undated map in the archives of the Alabama Museum of Natural History
(Figure 4.8). Though the map is undated, I would estimate that it was generated ca. 1939,
based on the fact that the new roadway is depicted, which was excavated and constructed
in 1939 and 1940 respectively. The map is drawn in pencil, and the locations of Moore’s
excavations are colored in crayon and marker. There are at least two different peoples’
handwriting on the map. The first is probably that of Jones, while the second is more
than likely that of E.C. Chapman, who was in charge of record keeping at the Alabama
Museum of Natural History around the time of World War II. The mounds on the map
are depicted simplistically and are inaccurately spaced, but what is important is the names
and locations indicated for the borrow pits. Lakes #1 and #3 are labeled as Pro. and Prop.
Lake, presumably meaning proposed lakes, indicating perhaps that they had not yet been
created. The proposed shape of Lake #3 is different from the current shape of the lake,
because in the drawing the lake bends around and wraps east of Mound P. Lake #2
appears to have the same basic shape and size as at present, and Lake #4 is not shown.

Figure 4.8. An undated, rough sketch
The labeling of these lake areas
enlarged during these restoration projects.
Based on the information described above, it appears that Lake #2 has
strongest evidence for being a prehistoric borrow pit. Its existence and location appear as
far back as Middleton’s account in 1889, and it was present in its current form before
park restoration projects, as shown in the photograph by Hodge in 1902.
general position of this depression on the landscape also supports its validity as a
prehistoric borrow pit. As there were no other known areas for soil extraction near the
southern plaza periphery mounds, Lake #2 is ideally located to save l
clear across the site and back in order to retrieve soil from ravines. Furthermore, this
rough sketch of the Moundville site ca. 1939.
lake areas as “proposed” indicates that they were either created or
enlarged during these restoration projects.
Based on the information described above, it appears that Lake #2 has
strongest evidence for being a prehistoric borrow pit. Its existence and location appear as
far back as Middleton’s account in 1889, and it was present in its current form before
park restoration projects, as shown in the photograph by Hodge in 1902.
general position of this depression on the landscape also supports its validity as a
prehistoric borrow pit. As there were no other known areas for soil extraction near the
southern plaza periphery mounds, Lake #2 is ideally located to save l
clear across the site and back in order to retrieve soil from ravines. Furthermore, this
92
were either created or
Based on the information described above, it appears that Lake #2 has the
strongest evidence for being a prehistoric borrow pit. Its existence and location appear as
far back as Middleton’s account in 1889, and it was present in its current form before
park restoration projects, as shown in the photograph by Hodge in 1902. The size and
general position of this depression on the landscape also supports its validity as a
prehistoric borrow pit. As there were no other known areas for soil extraction near the
southern plaza periphery mounds, Lake #2 is ideally located to save l aborers a long walk
clear across the site and back in order to retrieve soil from ravines. Furthermore, this

93
depression is large enough that it would have provided enough soil to have had a
significant contribution of building material for the mounds on the southern plaza margin.
There is also very strong evidence to suggest that Lake #4 was also a prehistoric
borrow pit. A depression in this area appears on maps and photographs prior to
restoration work and archaeological investigations supports that the depression contained
three feet of silt (Jones 1941). Yet the size and position of this depression fails to meet
the same logic described for Lake #2. Lake #4 was probably used to supply building
material for Mound R or maybe Mound U, which however makes little sense as the
ravine is only a few meters farther away. Its position thus does not appear to be very
advantageous for mound laborers, unlike that of Lake #2. In addition, the volume of this
depression accounts for less than 10% of the total volume of Mound R, hardly enough to
warrant its creation. If 90% of the soil was coming from a location just a few meters
away, then why go to the trouble to borrow only 10% more from another location in the
same general area? In my opinion, the only explanation for this depression, in part
originally provided by Jones (1941), is that it was used to hold water and fish. It would
have been easy to stock with both water and fish being so close to the river, which would
also explain the copper fish hook found at the bottom. In short, unlike Lake #2, I doubt
that the primary purpose of Lake #4 was to supply builders with soil for mound
construction, and therefore, its distance from mounds is not included in my results.
Lake #1 on the other hand may have been a prehistoric borrow location, but the
evidence is not as strong as that for Lakes #2 and #4. Although the depression referred to
as Lake #1 does appear on some photographs and maps prior to park restorations, the
depression may have developed because of a change in the topography created by Mound

94
G and the plaza fill (Knight 2009b), supplemented by modern ditches dug to drain water
east of the lake. Furthermore, like Lake #4, it is located very close to possible soil
extraction locations and is not really large enough to have made a difference in the
amount of building material provided.
Lake #3 is the most suspicious of the purported borrow pits. There was only a
minuscule depression located in the area prior to restoration work. Although this
depression would be more advantageously located than Lakes #1 and #4, and large
enough to have made a substantial contribution to the building material, I believe that it
was not a prehistoric borrow pit, but instead a low linear drainage, perhaps an old creek
bed or drainage basin. There are no records describing or photographs showing any
substantial depression in the vicinity of Lake #3, whereas the topographic map from 1930
shows all of the other borrow pits except this one. The lake in its present configuration is
very clearly an artifact of 1930s park landscaping, complete with interior “islands” like
Lakes #2 and #4.
In the next section, which describes the taking of soil samples from around the
Moundville landscape, Lake #2 will be treated as the only genuine borrow location when
measuring the distance from a mound to its nearest source. Although there is limited
evidence that Lake #1 and Lake #4 were also prehistoric borrow locations, given their
small volume and the fact that the distances are not greatly different from those to the
nearest ravine, they are not considered as significant extraction locations for mound soil.
Soil Samples from Possible Borrowing Locations
To determine if soils from the surrounding ravines and Lake #2 are comparable to
soils used to create mounds and modify the plaza, soil samples were collected and

95
Figure 4.9. Map showing the locations of soil samples.
analyzed from 42 locations around the Moundville site (Figure 4.9). Soil was collected in
the field by clearing the topsoil from an eroding slope using a small shovel. The samples
were collected from terrace deposits at least 30 cm below the topsoil. The soil
composition and color of these samples are tabulated in Table 4.2.
According to the soil descriptions from mound (Gage 2000; Gage and Jones 2001;
Knight 2009b; Driskell, notes on file, Alabama Museum of Natural History) and plaza
coring and excavations (Driskell, notes on file, Alabama Museum of Natural History;
Chapter 3), most of the soils used in the construction of the Moundville landscape were
either sandy clay or sandy silt soils usually within the color range of yellowish-brown to
brown, although loamy soils were encountered as well. For example, Gage (2000) and
A
B
V
CD
E
F F1
F2
S
GX
HT
IJKL
M
M1
N
OW
P
Q
R
B1
U
R1
0 100 m
1
2 4
5
67
8
9
10
1
12
11
13
14
3
15
16
17
18
19
20
21
22
23
24
25
26
27
28
2930
31
32
33
34 35
36
37
38
39
40 4142

96
Location Texture Munsell Color Description1 Sandy Clay Loam 10 YR 4/3 Brown2 Sandy Clay Loam 2.5 YR 4/6 Red3 Clay 10 YR 5/4 Yellowish Brown4 Clay Loam 10 YR 4/3 Brown5 Sandy Clay 7.5 YR 5/6 Strong Brown6 Sandy Clay 10 YR 3/4 Dark yellowish Brown7 Sandy Clay 10 YR 5/4 Yellowish Brown8 Sandy Clay 7.5 YR 3/4 Dark Brown9 Sandy Clay 10 YR 5/6 Yellowish Brown10 Sandy Clay Loam 10 YR 3/4 Dark Yellowish Brown11 Sandy Clay 7.5 YR 6/8 Reddish Yellow12 Sandy Clay Loam 10 YR 4/6 Dark Yellowish Brown13 Clay Loam 10 YR 3/3 Dark Brown14 Sandy Clay 10 YR 4/4 Dark Yellowish Brown15 Silty Clay 7.5 YR 5/6 Strong Brown16 Silty Clay 7.5 YR 5/3 Brown17 Silty Clay 7.5 YR 5/6 Strong Brown18 Sandy Clay 10 YR 3/4 Dark Yellowish Brown19 Sandy Clay Loam 7.5 YR 3/4 Dark Brown20 Sandy Clay 10 YR 3/4 Dark Yellowish Brown21 Sandy Clay 7.5 YR 3/4 Dark Brown22 Sandy Clay 10 YR 4/4 Dark Yellowish Brown23 Sandy Clay 10 YR 3/4 Dark Yellowish Brown24 Silty Clay 10 YR 5/4 Yellowish Brown25 Sandy Clay 10 YR 6/4 Light Yellowish Brown26 Sandy Clay 10 YR 6/3 Pale Brown27 Silty Clay 10 YR 3/6 Dark Yellowish Brown28 Silty Clay 7.5 YR 4/6 Strong Brown29 Loamy Sand 2.5 Y 6/6 Olive Yellow30 Sandy Clay 10 YR 5/6 Yellowish Brown31 Sandy Clay 10 YR 6/3 Pale Brown32 Sandy Clay 7.5 YR 5/6 Strong Brown33 Clay Loam 10 YR 4/6 Dark Yellowish Brown34 Sandy Clay 7.5 YR 4/3 Brown35 Sandy Clay 7.5 YR 5/4 Brown36 Sandy Clay 10 YR 5/4 Yellowish Brown37 Clay 7.5 YR 5/6 Strong Brown38 Silty Clay 7.5 YR 4/6 Strong Brown39 Silty Clay 10 YR 3/3 Dark Brown40 Sandy Clay Loam 7.5 YR 5/6 Strong Brown41 Sandy Clay 10 YR 5/6 Yellowish Brown42 Sandy Clay Loam 10 YR 5/4 Yellowish Brown
Table 4.2. Texture, color, and description of soil from tests.

97
Knight (1995, 2009b) reported that many of the stages of Mound R were constructed
using sandy clays and sandy silts, usually various shades of brown and yellow.
According to Driskell’s field notes (on file, Alabama Museum of Natural History; Knight
2009b), the soil composition of Mound P fills are generally sandy loams or clay loams,
which are readily available in the ravine northwest of the mound. The texture of the
mound stages of Mound F ranged from sand and clayey sand to clay of various colors
(Knight 1995, 2009b). Knight (1995, 2009b) reported that the construction fills of
Mound G consisted of either sandy clay or dark loamy soils and that Mound A was
constructed mainly with silty fills consisting of a mixture of sand, clay and loam soils.
The plaza fills (Chapter 3) consisted mostly of either sandy clay or sandy clay loam soils.
All of these soil types were encountered in the sampling of various locations around the
site. Based on the similarity of the soils encountered in my sampling and the soils
reported from mound fills, I would argue that the soil types are comparable.
Results
There appears to be fairly strong evidence that most of soil for the mound and
plaza construction at Moundville came from the nearest ravine. Consequently, there is a
possibility that the extensive mining of construction fill from the ravines may have
artificially widened them. The only exception appears to be the mounds on the southern
portion of the site which were probably constructed primarily using soil from the borrow
pit known as Lake #2. The volume of Lake #2, 14,800 m3, is large enough to
accommodate all of the mounds on the southern margin of the plaza (Mounds I, T, J, K,
L, M, and M1), which together total 11,020 m3. The distance from the center of each
mound to the closest probable extraction area was drawn on a scaled map and then

98
Figure 4.10. Map showing the distance from each mound to the nearest borrowing location. The distances from plazamodifications to the nearest borrowing locations are not shown, but are believed to be to the same location at a similardistance as the mounds in the vicinity of the plaza modifications.
measured (Figure 4.10). These distances for each mound are shown in Table 4.3. It
seems possible that the soil for the mounds on the northern portion of the site came from
multiple borrow areas. For instance, Mounds B and V are sandwiched roughly
equidistantly between two ravines. Nonetheless, for my purposes the distance to the
nearest ravine is the measure that was used, as designated by the arrows in Figure 4.8. In
addition, the arrow for the distance from Mound A to the nearest ravine was extended
roughly 50 meters northward due to the modern-day active southward encroachment of
the ravine northwest of the mound.
A
B
V
CD
E
FF1
F2
S
GX
H
T
I
JKLM
M1
N
OW
P
Q
R
B1
U
R1
0 100 m
1
Lake #2

99
Location Distance (m)Mound A 160Mound B 110Mound B1 25Mound C 45Mound D 45Mound E 50Mound F 50Mound G 115Mound H 190Mound I 250Mound J 145Mound K 60Mound L 25Mound M 125Mound M1 165Mound N 300Mound O 230Mound P 150Mound Q 50Mound R 70Mound R1 25Mound S 180Mound T 240Mound U 25Mound V 95
Plaza Fill – Mound F 75Plaza Fill – Mound G 125Plaza Fill – Mounds N and O 250Plaza Fill – Mound J 135
Total Distance 3,510 mAverage Distance 121 m
Table 4.3. Distance from mound or plaza fill to nearest possible extraction source.

100
The distance from soil source to a mound ranged from less than 25 meters to 300 meters.
These distances seems reasonable given Reed and colleagues’ (1968) discussion of
borrow pits at Cahokia, some being at least 700 meters from the nearest mound. It also
appears that the mounds farthest from their extraction source are those on the western
row of plaza periphery mounds. In contrast, the mounds on the northern part of the site
are the closest to their borrow locations.
In summary, it appears that much of the soil used to construct the Moundville
landscape came from the ravines along the northern margin of the site and one large
borrow pit on the southern side. There may have been other smaller borrow pits,
including three re-contoured by the Alabama Museum of Natural History and some
smaller depressions that may have been filled in over time, such as the depression
detected northwest of Mound L. The distance to retrieve soil for each construction would
have a large effect on its potential size, as earthworks closer to borrow locations would
have required less energy to create than those mounds at greater distance from their
sources. This fact may in part explain why the largest mounds are on the northern side of
the site although social and religious factors might be more important than simple
efficiency in this regard. It is relevant that the three largest mounds, Mounds A, B, and V,
which I will argue were the only ones constructed using pooled labor from the
hinterlands, are among the closest to their borrow locations. Builders of these large
mounds would have been able to focus more energy on excavation and compaction and
less time on transportation.

101
Chapter 5
Applying Geotechnical Engineering to Prehistoric Earthen Constructions
In current literature, volume is the sole basis for evaluating prehistoric earthwork
size and is the main variable for calculating the amount of labor involved in their
construction (e.g. Abrams 1989, 1994; Abrams and Bolland 1999; Anderson 1994;
Bernardini 2004; Blitz 1993; Blitz and Livingood 2004, Craig et al. 1998; Erasmus 1965;
Hammerstedt 2004, 2005; Lindauer and Blitz 1997; Milner 1998; Muller 1986, 1997;
Payne 1994; Steponaitis 1978). Yet, I would argue that the calculation of volume should
only be a stepping stone in the process of mound quantification and the formulation of
energetics assessments. Hypothetically, two prehistoric earthen mounds of the same
volume need not have required the same amount of energy in their construction.
Differences between them may have arisen in the distance needed to transport the soil
(Chapter 4), the type of soil employed as construction material, the amount of
compaction energy invested, or other factors not considered when a mound is quantified
by volume alone. Thus, more information should be considered when quantifying
earthen mounds and prehistoric landscapes. One factor I believe to be critical in
examining differences between mounds is density. Density, first measured in the 3rd
century BCE by the Greek scientist Archimedes, is defined as a ratio of mass to volume.
Density is essentially a measurement of how tightly matter is compacted together.

102
The research presented herein will apply methods from geotechnical engineering,
a subdiscipline of civil engineering, in order to obtain estimates of the density and mass
of mounds and artificial plaza fills at Moundville, and attempt to quantify the amount of
compaction energy involved in their creation. In this chapter, I calculate density and
compaction of mound and artificial plaza fills using two geotechnical engineering
procedures – the sand cone density test and the Proctor compaction test. Then, using the
volume of both mound and plaza fills obtained using the gridding method (Chapters 2
and 3), the density and volume are multiplied producing an estimated mass of moved
earth. Mass will be the predominant unit of measure utilized in the upcoming energetics
assessment in calculating the amount of energy used to excavate and transport mound and
plaza fills (Chapter 6). The Proctor compaction test, a laboratory procedure, will
approximate the mechanical energy needed to compact mound and plaza fills to the same
density measured in the field using the sand cone test. This test will determine if it is
possible to quantify differences in the compaction energy of earthen structures. From
these data, I will conclude that the total mass of mounds and plaza fills at Moundville is
approximately 375,000,000 kg (827,000,000 lb). In addition, the mechanical compaction
energy invested in mound construction ranged from approximately 120 kN-m/m3 (2,500
ft-lb/ft3) to 240 kN-m/m3 (5,000 ft-lb/ft3), whereas plaza fills averaged roughly 70 kN-
m/m3 (1,500 ft-lb/ft3). I believe that these methods adopted from geotechnical
engineering will shed light on Mississippian mound construction and improve the current
quantification of earthen monuments and the labor invested in the creation of prehistoric
landscapes.

103
Geotechnical Techniques
Geotechnical engineering has applied principles of soil mechanics to the design of
foundations and earthen structures for nearly 80 years (Bowles 1979; Das 2002). The
methods involved in soil mechanics are primarily concerned with testing the behavior and
performance of different soils as construction materials. Geotechnical engineers are
interested in the construction of earthen designs and foundation structures, and utilize
concepts such as flow analysis, strength analysis, stability analysis, mechanical stresses,
bearing capacity, and lateral earth pressures. As in archaeology, geotechnical
engineering emphasizes empirical quantification to aid in testing the reliability of their
data. Many of the methods and techniques of the geotechnical engineering field may be
helpful in quantifying differences among prehistoric monuments. The reader should
consider this research experimental, but hopefully I can demonstrate the merit of relating
these two fields for future research.
Sand Cone Density Test
There are two test procedures utilized by geotechnical engineers, the results of
which translate well to the archaeological study of prehistoric earthen monuments and
landscapes. The first is an in situ or field test designed to measure the density of an
earthwork. Density tests can be conducted with a number of apparatuses, but for this
study I will focus on the simplest, the sand cone test (ASTM D 1556). The test consists
of excavating a small hole, roughly 15 cm in diameter and at least 10 cm deep, in the
earthen structure being examined and filling the hole with dry calibrated sand from a sand
cone apparatus (Figure 5.1). The soil removed is weighed, dried, and then weighed again
to determine its moisture content. The volume of the hole is measured by the amount of

104
the calibrated sand used to fill it. The mass of the dry soil removed divided by the
volume of sand needed to fill the hole produces the density of the soil in a dry unit weight
per volume measurement, such as pounds per cubic foot (lb/ft3) or kilograms or
kilonewtons per cubic meter (kg/m3 or kN/m3).14,15 The measurement produced by the
sand cone test is a ratio of the mass removed from a hole to the volume of that hole (D =
M/V). Even though the sand cone test method is considered intrusive by geotechnical
engineers because disturbing the soil is required (Holtz and Kovacs 1981), it is a
relatively non-invasive method for archaeology. If applied during excavation of a
prehistoric mound, the test can be used on each individual building layer to quantitatively
determine differences in density, and therefore energy, per episode of construction.
14 Archaeology uses metric or SI units whereas geotechnical engineering uses U.S. customary or Englishunits. Therefore, in this chapter the results are presented in both.15 Engineers make a distinction between mass density and weight density. Weight density (kN/m 3) is equalto the mass density (kg/m3) multiplied by a constant for standard gravity (9.8 x 10 -3).
Weight of SandBefore Test
Weight of SandAfter Test
Dry Calibrated Sand
Weight of SandUsed to Fill theHole
Di fference Equalsthe Weight of SandRequired to Fil l ConePlu s Hole
Sub tract Weightof Sand Neededto Fi ll Co ne
Sand Cone Apparatus
Con e and Plateof the Ap paratus
Excavated Hole
Figure 5.1. The sand cone apparatus and excavated hole .

105
Proctor Compaction Test
A second test borrowed from geotechnical engineering that can be applied to
prehistoric earthworks in conjunction with the density test is the Proctor laboratory
compaction test (ASTM D 698). Soil compaction occurs when soil aggregates and
particles are rearranged into a smaller volume through the addition of mechanical energy.
As soil is compacted, the voids created by air and water decrease and the density
increases. Whereas the sand cone test measures the in situ density of an earthwork, the
Proctor laboratory compaction test measures the amount of compaction energy needed to
achieve the density recorded from the sand cone. In other words, the density of an
earthwork can be measured with a sand cone, and then a sample of the same soil can be
compacted in the laboratory with known amounts of energy until the same density from
the sand cone is achieved in the sample being compacted. The amount of mechanical
energy, if any, that was invested in mound compaction, whether achieved by using a tool
of wood or stone or by stomping energy applied by human feet alone, can be estimated
using the laboratory compaction test. The resulting measure yields the amount of
mechanic energy utilized to compact the loose soil expressed in the form of foot-pounds
per cubic foot (ft-lb/ft3) or kilonewton meters or kilojoules per cubic meter (kN-m/m3 or
kJ/m3).16
These units of measure reflect the amount of mechanical energy applied with a
force from a given distance to a given volume. Multiplying the amount of energy per
cubic volume by the total volume of the earthwork produces an estimated amount of
compaction energy invested in compaction. To clarify, one foot-pound (ft-lb) is the
16 The kilonewton meter (kN-m) is a unit of force whereas the kilojoule (kJ) is a unit of energy. Both unitsare numerically equal (1 kN-m = 1 kJ).

106
amount of mechanical energy applied with one pound of force from a striking distance of
one foot, but this measure does not reflect the amount of human energy invested in
compacting the structure as calculated in Chapter 6. The measure only serves as a means
of comparatively evaluating differences of compaction between earthworks. It is
reasonable to assume that the more mechanical energy used to compact a mound, the
more human energy was expended in compaction. Mound stages, or portions of mound
stages that are heavily compacted would have required more human energy, perhaps in
the form of more time spent stomping, marching, jumping, or using an instrument such as
a flat stone or wooden pestle, than mounds that are less compact. The amount of human
energy employed in compacting soil must be based on the methods used to compact,
which are, unfortunately, unknown. Thus the human energy that was expended cannot be
translated from mechanical energy in any straightforward way. Experimental work in
archaeology is therefore needed to compile data for compaction measures in energetics
studies. My compaction testing, although the samples are admittedly not representative
and the measure is not in human terms, will hopefully act as a catalyst for future studies
of the compaction of prehistoric earthen monuments.
In changing our modern-day physical environment, loose excavated soil added to
preexisting topography to create highways, dams, airport-runways, embankments, and
other structures must be compacted. Compacting soil rearranges the solid particles (soil)
into a tighter configuration, which reduces the volume of voids. The degree of
compaction is measured in terms of a soil’s dry unit weight (γd or γdry), which is a
measurement of the weight of dry soil for a given volume. The dry unit weight of a soil
is correlated to geotechnical engineering design parameters such as shear strength,

107
settlement resistance, and permeability. Compacting soils increases the strength and
stability, while decreasing permeability and settlement. In terms of structures built on top
of the compacted soils, compaction increases the bearing capacity for the foundations of
the buildings, and decreases settlement of the structures. Today, large compaction
equipment, weighing as much as 50 tons, is used to compact layers of soil to produce
earthen structures suitable of withstanding the pressures of large architectural forms
(D’Appolonia et al. 1969).
Additional mechanical compaction for the creation of earthen structures was not
always necessary. Prior to the invention of large mechanical earth moving equipment,
such as dump trucks in the 1920s, soils were moved primarily by hand in small portions.
When large amounts of loose soil began to be used, mechanical compaction methods
were needed to prevent soil failure (Holtz and Kovacs 1981: 110). Various methods to
compact soil have been tried historically, including using elephants in developing
countries to compact soils for earthen dams (Meehan 1967, 1981: 137-139).17 As the
compaction of soils became an important issue in soil construction, Ralph R. Proctor
(1933) developed a laboratory test to measure the density of a soil after compaction and
compare the maximum dry unit weight to the optimal moisture content of a soil for a
given energy applied in the compaction process (ASTM D 698). To calculate the dry unit
weight, soil is compacted into a mold using a “hammer,” which is dropped a number of
times on the loose soil from one foot above (Figure 5.2). For a given hammer weight, the
energy is controlled by the number of times the hammer is dropped and the number of
17 The attempt to compact soil using elephants was unsuccessful. The elephants quickly learned to step ontheir previous footprints as opposed to the loose earth (Meehan 1967, 1981).

108
Rem ovable C ollar
Standard Com pactionHam mer (5.5 lb)
Proctor Mold (.03 3 ft3)
25 Blowsper Layer
Soil Sample1/30 ft3 (944 cm3)3 Layers (L if ts)
12in
ches
(30.
5cm
)5.5 lb (2.5 kg)
Figure 5.2. The Proctor compaction test. Left, view of the mold with soil being compacted; right, diagram of the moldand hammer
layers of soil used to fill the mold. The density is calculated based on the mass of the soil
compacted in the mold divided by the volume of the mold.
Factors that Affect Compaction
Moisture content (ω) has a strong effect on the compacted density of a soil.
Gradually increasing the moisture content during the compaction process causes particles
to slide over each other more readily and move into a more densely packed configuration,
thereby increasing the density of the soil. However, beyond a certain moisture threshold,
any additional increase in the amount of water tends to reduce the density by allowing
particles to slip out of a densely packed configuration, allowing the potential voids for
soil particles to be filled with water. Therefore, when graphed the resulting compaction
data for a specific amount of energy is typically shaped like a normal distribution curve
as shown in Figure 5.3. This graph shows three compaction curves produced with
varying levels of compaction energy. The uppermost curve corresponds to the most

energy invested in soil compaction.
unit weight and the optimal
Note that as the amount of energy invested in c
content increases while the maximum dry
line in Figure 5.3. In other words, less compaction energy is required for soil possessing
more water, but only up to
The limit of the
the voids in a soil are saturated with water.
which the soil is fully saturated is r
Figure 5.3. It is not possible for any portion of any energy curve to pass to the right of
the zero-air-void. Thus, the right side of
to the zero-air-void curve. Cross
Figure 5.3. Diagram showing the relationship between compaction energy, moisture content, dry unit weight, and the zerovoid curve. Each curve represents a specific amount of compaction energy applied to soil ofmaximum point of each curve represents the optimal moisture content for that amount of energy. The dotted line shows theoptimal moisture content from each of the various amounts of energy applied.
energy invested in soil compaction. The peak point for each curve
unit weight and the optimal moisture content for the amount of energy applied to a soil
amount of energy invested in compaction decreases, the optimal
content increases while the maximum dry unit weight decreases as
other words, less compaction energy is required for soil possessing
up to a certain point.
the dry unit weight at a moisture content of a soil
in a soil are saturated with water. The line that illustrates the
which the soil is fully saturated is referred to as the zero-air-void curve
It is not possible for any portion of any energy curve to pass to the right of
void. Thus, the right side of the compaction curve should be roughly parallel
void curve. Cross-referencing the right side of the com
Figure 5.3. Diagram showing the relationship between compaction energy, moisture content, dry unit weight, and the zeroe. Each curve represents a specific amount of compaction energy applied to soil of
maximum point of each curve represents the optimal moisture content for that amount of energy. The dotted line shows thentent from each of the various amounts of energy applied.
109
is the maximum dry
for the amount of energy applied to a soil .
s, the optimal moisture
decreases as shown by the dotted
other words, less compaction energy is required for soil possessing
at a moisture content of a soil is obtained when all
The line that illustrates the condition in
curve and is shown in
It is not possible for any portion of any energy curve to pass to the right of
the compaction curve should be roughly parallel
referencing the right side of the compaction curve
Figure 5.3. Diagram showing the relationship between compaction energy, moisture content, dry unit weight, and the zero -air-e. Each curve represents a specific amount of compaction energy applied to soil of variable moisture content. The
maximum point of each curve represents the optimal moisture content for that amount of energy. The dotted line shows the

110
against the zero-air-void curve is one way of confirming the validity of compaction
results.
All soils behave in the same manner with regard to optimal moisture content, unit
weight, energy, and saturation levels. That is, regardless of soil type, the dry unit density
increase and optimal moisture content decrease as energy increases. As noted, no amount
of energy applied to a soil will achieve a compaction value to the right of the zero-air-
void curve. However, specific valves of optimal moisture content, unit weight,
compaction energy, and position of the zero-air-void curve vary between soil types (Das
2002). Therefore, a sample for compaction testing should be taken from the immediate
vicinity of the sand cone to ensure that the same soil type is collected.
Reconciling Geotechnical Tests with Archaeological Variability
These two geotechnical tests, the sand cone test and the Proctor compaction test,
can be applied productively to prehistoric earthworks. However, there are concerns in
relating geotechnical procedures to the study of archaeology that should be addressed
before continuing. All such concerns are a result of combining an approach used for
quantifying modern-day structures and foundations with another focused on prehistoric
inquiry. Geotechnical engineers only deal with contemporary earthen structures and
foundations and the procedures involved in the discipline, though applicable to
archaeological inquiry, were not originally intended to be used in the study of the past.
However, modern forensic engineering techniques that typically evaluate the cause of an
engineering failure can and do use these techniques retrospectively.
First, it should be noted that one cannot merely assume that Native earthworks, as
they stand today, consist entirely of structural fills that are at their original density,

111
compaction, and moisture content. Through archaeological work, we know that the vast
majority of the bulk of most earthen mounds consists of mechanically undisturbed fills.
Yet, there are several variables that are important in combining geotechnical engineering
and archaeology that need to be controlled for. Time or age of an earthwork should not
be considered a factor in studying compaction. Earthworks would have not increased in
density because of their age unless there was additional mechanical energy or load
applied or the particles were rearranged by strong vibrations such as earthquakes.
There are a number of kinds of alterations that may affect the original prehistoric
density and compaction values. These include both prehistoric and modern day potential
disturbances. For example, one kind of prehistoric alteration to originally compacted
mound fill may include pit digging in to the mound summit by original inhabitants for
storage, burials, structural posts, and so forth, which when refilled, typically with midden
soil rather than clay, might not have been as compacted as the original fill. Thus, as
midden soil is usually fairly distinctive, it should be avoided for both density and
compaction testing.
Historical disturbances include modern deposits associated with mound
reconstruction efforts and compaction associated with heavy equipment. These
disturbances may have been caused by either digging up and relocating soil or operating
heavy equipment on mounds and plaza fills, as is the case at Moundville (Jones 1941).
Many disturbances at Moundville can be traced to the agricultural plowing of the 19th and
early 20th century (Moore 1905) or the mound restoration projects of the 1930s (Jones
1941). Mounds that have been cultivated or re-contoured, even when the original mound
soil was used for restoration as opposed to imported fill, would have had their density

112
altered and testing within these altered soils would provide misleading compaction
results. Regardless, to conduct these tests accurately, it is important to locate areas of
modern deposits or alteration through controlled excavation and avoid conducting tests in
these areas.
Other variables that can affect density and compaction testing include
bioturbation from tree roots, ant nests, and rodent burrows, mostly found within the
uppermost one meter. Slumping at the margins, a type of erosion peculiar to steep
earthworks, will also affect in situ measurements. All of the variables listed thus far that
affect density and compaction can be controlled by sampling only unaltered mound fill as
determined archaeologically.
Another variable is the potential change in moisture content of the soil. Water
may have been added to assist in compaction in prehistoric times. Also, the moisture
content of the soil will change over time and currently may not represent the moisture
content at the time of creation of the Moundville landscape. Typical compaction testing
aims to correlate the maximum dry unit weight and optimal moisture content for a given
amount of energy. For this study, the optimal moisture content is not considered in
attempting to match compaction results with the results from the sand cone. Instead, only
the dry unit weight is considered. In other words, the energy curve of a compaction
sample, regardless of the soil moisture content, must be the same or less than the density
obtained from the earthwork. For instance, a compaction curve can begin below the point
of the in situ density sample, but can then increase and exceed the in situ dry unit weight
as its moisture content is increased, only to fall below the in situ dry unit weight as it
nears the zero-air-void curve. In this example, if I use this energy curve for the energetics
113
assessment, I am assuming that prehistoric builders compacted soil that possessed a
moisture content other than the optimal content. Therefore, in estimating the amount of
energy involved in compaction, the entire compaction curve must be close to the in situ
dry unit weight but not exceed the estimated density obtained from sand cone. This
precaution eliminates error introduced by assuming a prehistoric moisture content and
reduces the chance of overestimating the energy invested in compaction.
Another concern is the degree of variability in density and compaction within a
single earthwork. Many prehistoric earthen mounds are constructed with different soils
possessing different densities, chosen for their particular attributes. Ideally, one would
want to know the density of each building episode, which can be highly variable even
within a single mound stage. For example, mound flanks and upper margins are often
buttressed with heavy clay to counteract flank erosion, while the material used to build up
the mound center is often of looser material. In future testing, density measurements
could be obtained using soil core samples at times when excavation is not possible by
measuring the volume and the mass of samples from each construction stage. As mound
cores are not available at this time, I am forced to make uniform assumptions about
mound density based on only two construction episodes. Therefore, my overall soil
density and compaction measures for Moundville are imprecise. However, as the results
will show, the density and compaction results for Mounds R and V, as well as the results
from the plaza are fairly consistent. These results are assumed to fall somewhere in the
middle of the expected range of possible density and compaction values for prehistoric
earthen mounds.
114
A final concern of applicability is the compression due to the self-weight of the
overlying fill. Tests conducted deep within an earthen structure will be affected by the
overlying soil, and it is important that this additional compression not be considered as
part of the human investment of energy in compacting the mound. This problem does not
affect the information in the present study, as all tests were conducted on the uppermost
levels, just below the plow zone. However, in cases where these tests are conducted
deeper within a mound, a correction factor based on soil mechanics should applied to
remove densification of mound soil due to soil compression.
Methods
Before explaining the methods of the geotechnical engineering density tests
employed in this study, it is important to note that there were no on-going mound
excavations during the span of my fieldwork. This greatly limited the opportunity to test
for differences in the density of mound fill. Thus, the only two density tests conducted
on mounds for this study were done (1) in a previous excavation conducted by Vernon
Knight on Mound V (Knight 2009a), and (2) an erosional blowout on the northwest
corner of Mound R. Therefore, I am going to have to generalize from very few data, as
my density and compaction energy constants are based on the results from these two
tests. Differences in mound density will surely emerge once more tests have been
conducted in the future. In the meantime, however, I think the two tests serve as an
adequate initial estimate of mound density in the Moundville case.
A sand cone density test was employed on Mounds R and V in the fall of 2005.
Mound R is a large mound by Moundville standards, situated on the northwest corner of
the plaza. Mound V, on the other hand, is a large low mound constructed on sloping

115
ground that makes a level plaza-like extension north of Mound B. These two mounds
possess relatively similar volumes. Mound R is estimated at 21,820 m3 and Mound V
some 22,460 m3 (Chapter 2). The density test on Mound R was performed on the west
edge of the Mound, approximately 10 m from the northeastern corner, in an area of a
large erosional blowout. Loose soil from a section of the blowout was removed and a
level area was excavated. The density test on Mound V was performed on the northern
edge roughly 15 m from the northwestern corner, in an area near the earth lodge
previously excavated by Knight (2009a). The summits of both mounds were used for
agricultural purposes (Moore 1905), so the test area was executed to below the plow
zone, which was at least 40 cm deep. The placements of both tests were thoroughly
considered to make sure that the samples consisted of undisturbed mound fill and not
modern imported or disturbed soil. A 4 kg (8.8 lb) soil sample was also taken in the
immediate vicinity of both tests for compaction testing, which was conducted in the
winter of 2005.
The same procedures were conducted in the fall of 2007 during my excavations in
the plaza (Chapter 3). Sand cone tests were employed within the plow zone, artificial fill,
and sterile terrace deposits in four 1 x 1 m test units. Again, a 4 kg (8.8 lb) soil sample
was taken from the same levels for compaction testing. Laboratory compaction tests of
the plaza fills was undertaken in the fall and winter of 2007, with some follow-up testing
in the spring of 2008. Only the imported artificial fill from the plaza units were used in
compaction testing.
In addition to the mound and plaza locations, another sand cone test was
conducted 150 m north of Mound G in September of 2008, near an unnamed tributary of
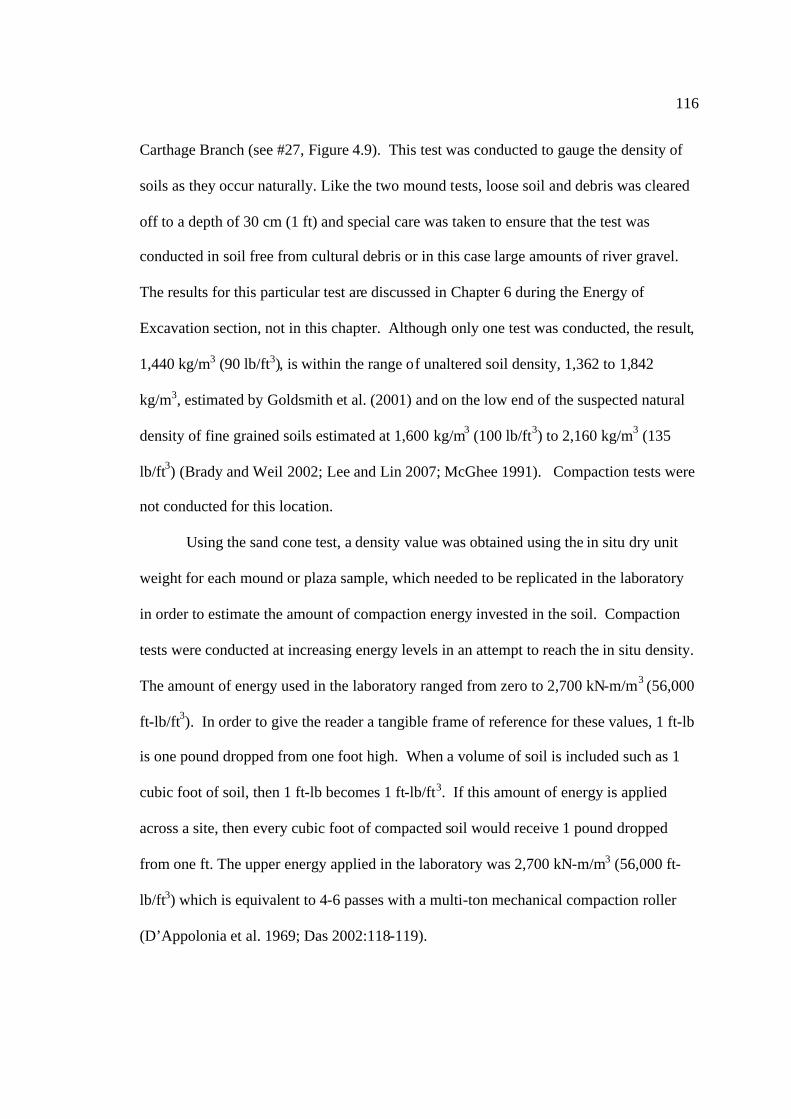
116
Carthage Branch (see #27, Figure 4.9). This test was conducted to gauge the density of
soils as they occur naturally. Like the two mound tests, loose soil and debris was cleared
off to a depth of 30 cm (1 ft) and special care was taken to ensure that the test was
conducted in soil free from cultural debris or in this case large amounts of river gravel.
The results for this particular test are discussed in Chapter 6 during the Energy of
Excavation section, not in this chapter. Although only one test was conducted, the result,
1,440 kg/m3 (90 lb/ft3), is within the range of unaltered soil density, 1,362 to 1,842
kg/m3, estimated by Goldsmith et al. (2001) and on the low end of the suspected natural
density of fine grained soils estimated at 1,600 kg/m3 (100 lb/ft3) to 2,160 kg/m3 (135
lb/ft3) (Brady and Weil 2002; Lee and Lin 2007; McGhee 1991). Compaction tests were
not conducted for this location.
Using the sand cone test, a density value was obtained using the in situ dry unit
weight for each mound or plaza sample, which needed to be replicated in the laboratory
in order to estimate the amount of compaction energy invested in the soil. Compaction
tests were conducted at increasing energy levels in an attempt to reach the in situ density.
The amount of energy used in the laboratory ranged from zero to 2,700 kN-m/m3 (56,000
ft-lb/ft3). In order to give the reader a tangible frame of reference for these values, 1 ft-lb
is one pound dropped from one foot high. When a volume of soil is included such as 1
cubic foot of soil, then 1 ft-lb becomes 1 ft-lb/ft3. If this amount of energy is applied
across a site, then every cubic foot of compacted soil would receive 1 pound dropped
from one ft. The upper energy applied in the laboratory was 2,700 kN-m/m3 (56,000 ft-
lb/ft3) which is equivalent to 4-6 passes with a multi-ton mechanical compaction roller
(D’Appolonia et al. 1969; Das 2002:118-119).
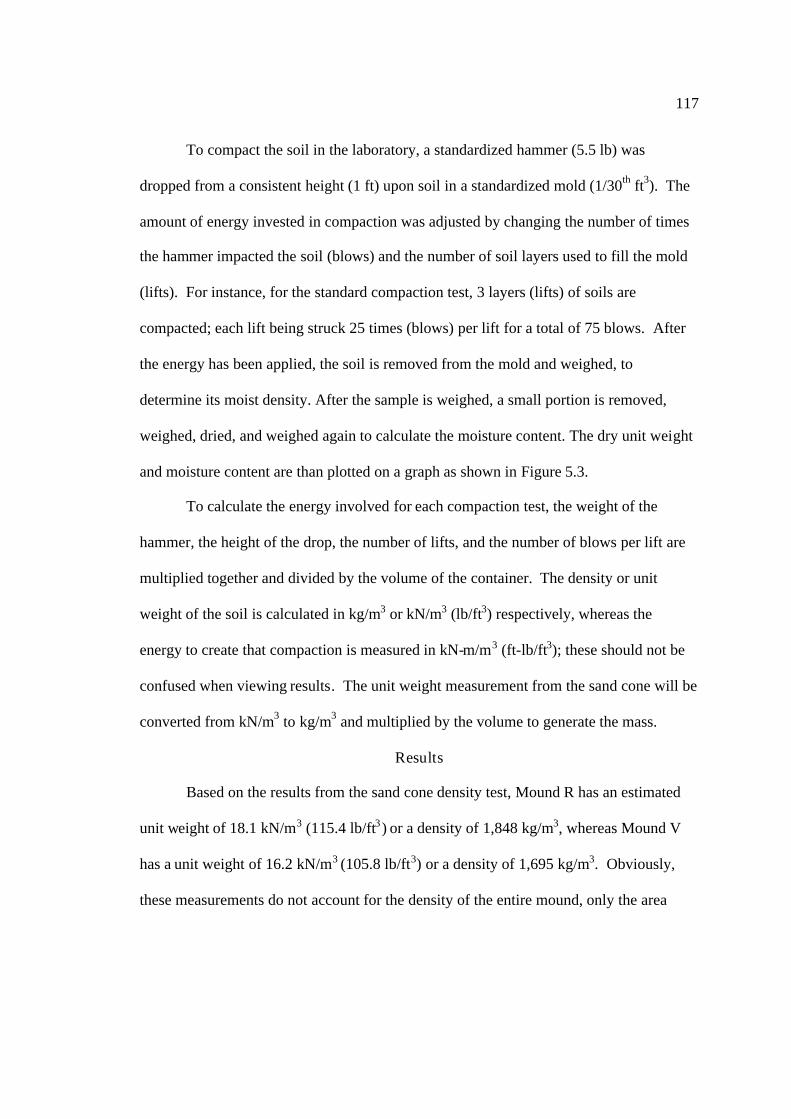
117
To compact the soil in the laboratory, a standardized hammer (5.5 lb) was
dropped from a consistent height (1 ft) upon soil in a standardized mold (1/30th ft3). The
amount of energy invested in compaction was adjusted by changing the number of times
the hammer impacted the soil (blows) and the number of soil layers used to fill the mold
(lifts). For instance, for the standard compaction test, 3 layers (lifts) of soils are
compacted; each lift being struck 25 times (blows) per lift for a total of 75 blows. After
the energy has been applied, the soil is removed from the mold and weighed, to
determine its moist density. After the sample is weighed, a small portion is removed,
weighed, dried, and weighed again to calculate the moisture content. The dry unit weight
and moisture content are than plotted on a graph as shown in Figure 5.3.
To calculate the energy involved for each compaction test, the weight of the
hammer, the height of the drop, the number of lifts, and the number of blows per lift are
multiplied together and divided by the volume of the container. The density or unit
weight of the soil is calculated in kg/m3 or kN/m3 (lb/ft3) respectively, whereas the
energy to create that compaction is measured in kN-m/m3 (ft-lb/ft3); these should not be
confused when viewing results. The unit weight measurement from the sand cone will be
converted from kN/m3 to kg/m3 and multiplied by the volume to generate the mass.
Results
Based on the results from the sand cone density test, Mound R has an estimated
unit weight of 18.1 kN/m3 (115.4 lb/ft3) or a density of 1,848 kg/m3, whereas Mound V
has a unit weight of 16.2 kN/m3 (105.8 lb/ft3) or a density of 1,695 kg/m3. Obviously,
these measurements do not account for the density of the entire mound, only the area
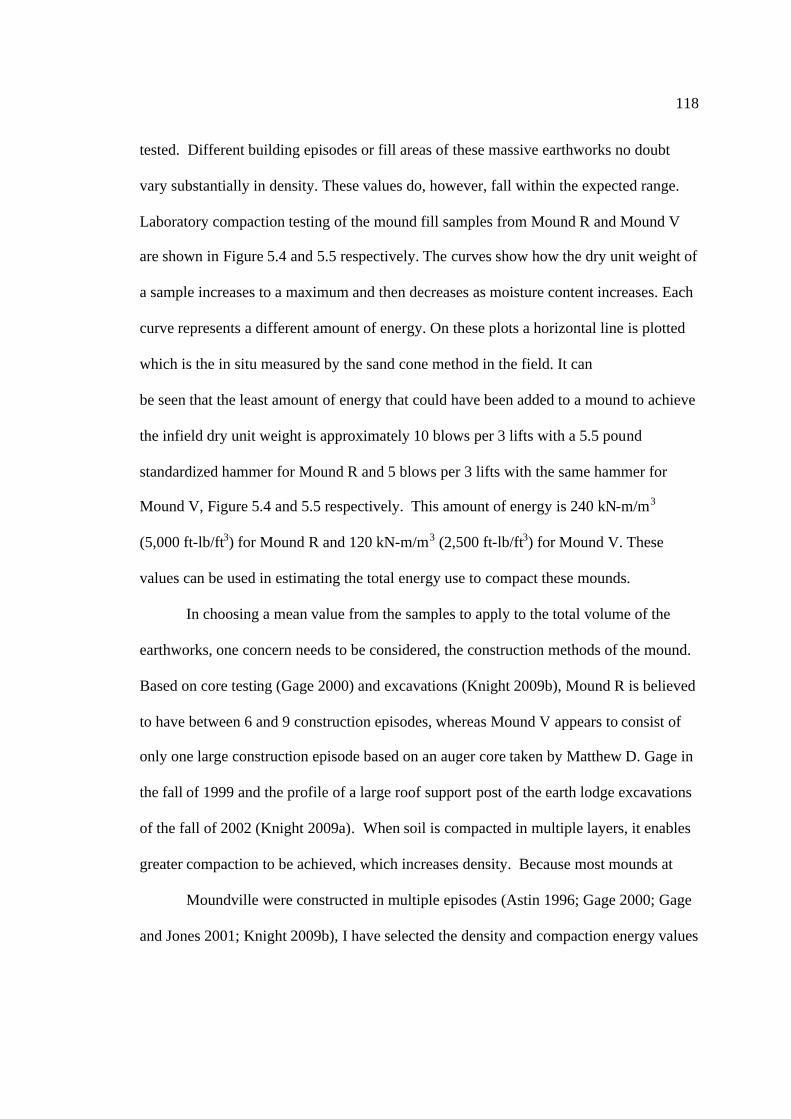
118
tested. Different building episodes or fill areas of these massive earthworks no doubt
vary substantially in density. These values do, however, fall within the expected range.
Laboratory compaction testing of the mound fill samples from Mound R and Mound V
are shown in Figure 5.4 and 5.5 respectively. The curves show how the dry unit weight of
a sample increases to a maximum and then decreases as moisture content increases. Each
curve represents a different amount of energy. On these plots a horizontal line is plotted
which is the in situ measured by the sand cone method in the field. It can
be seen that the least amount of energy that could have been added to a mound to achieve
the infield dry unit weight is approximately 10 blows per 3 lifts with a 5.5 pound
standardized hammer for Mound R and 5 blows per 3 lifts with the same hammer for
Mound V, Figure 5.4 and 5.5 respectively. This amount of energy is 240 kN-m/m3
(5,000 ft-lb/ft3) for Mound R and 120 kN-m/m3 (2,500 ft-lb/ft3) for Mound V. These
values can be used in estimating the total energy use to compact these mounds.
In choosing a mean value from the samples to apply to the total volume of the
earthworks, one concern needs to be considered, the construction methods of the mound.
Based on core testing (Gage 2000) and excavations (Knight 2009b), Mound R is believed
to have between 6 and 9 construction episodes, whereas Mound V appears to consist of
only one large construction episode based on an auger core taken by Matthew D. Gage in
the fall of 1999 and the profile of a large roof support post of the earth lodge excavations
of the fall of 2002 (Knight 2009a). When soil is compacted in multiple layers, it enables
greater compaction to be achieved, which increases density. Because most mounds at
Moundville were constructed in multiple episodes (Astin 1996; Gage 2000; Gage
and Jones 2001; Knight 2009b), I have selected the density and compaction energy values

119
In situ dry unit weight115.4 l b/f t3
130
120
110
100
5 10 15 20
Moisture Conten t (%)
Dry
Uni
tW
eigh
t(lb
/ft3 )
Modifed ProctorStandard Proctor
3 lif ts - 10 blo ws3 lif ts - 5 blows
3 lif ts - 3 blow
In situ dry unit wei ght105.8 lb/ft 3
130
120
110
100
5 10 15 20
Moisture Con tent (%)
Dry
Unit
Wei
ght
(lb/ft
3)
Modifed Proctor
Standard Proctor3 li fts - 10 bl ows
3 lif ts - 5 blows3 li fts - 3 blow
Figure 5.4. Diagram of the compaction and in situ dry unit weight of Mounds R. Each curve represents a specificamount of energy applied in the compaction process. Each point on a curve represents one test. The density of themound is shown by the in situ dry unit weight running horizontally across the figure.
Figure 5.5. Diagram of the compaction and in situ dry unit weight of Mounds V.
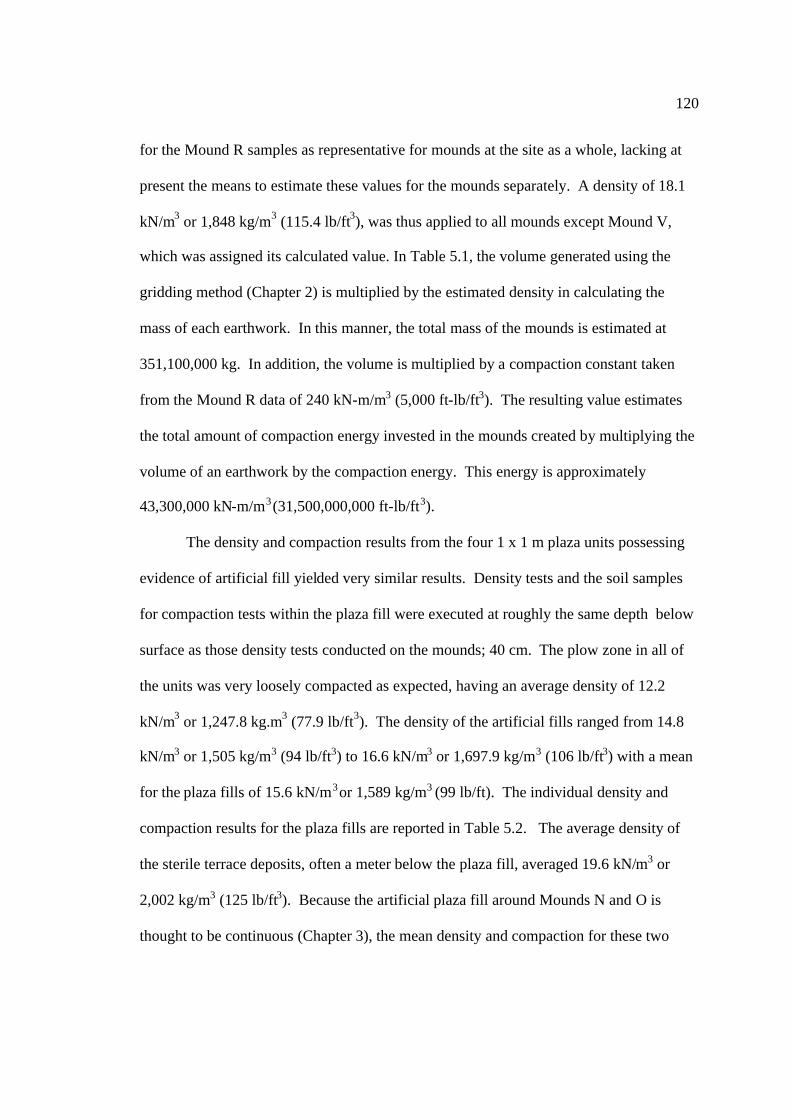
120
for the Mound R samples as representative for mounds at the site as a whole, lacking at
present the means to estimate these values for the mounds separately. A density of 18.1
kN/m3 or 1,848 kg/m3 (115.4 lb/ft3), was thus applied to all mounds except Mound V,
which was assigned its calculated value. In Table 5.1, the volume generated using the
gridding method (Chapter 2) is multiplied by the estimated density in calculating the
mass of each earthwork. In this manner, the total mass of the mounds is estimated at
351,100,000 kg. In addition, the volume is multiplied by a compaction constant taken
from the Mound R data of 240 kN-m/m3 (5,000 ft-lb/ft3). The resulting value estimates
the total amount of compaction energy invested in the mounds created by multiplying the
volume of an earthwork by the compaction energy. This energy is approximately
43,300,000 kN-m/m3(31,500,000,000 ft-lb/ft3).
The density and compaction results from the four 1 x 1 m plaza units possessing
evidence of artificial fill yielded very similar results. Density tests and the soil samples
for compaction tests within the plaza fill were executed at roughly the same depth below
surface as those density tests conducted on the mounds; 40 cm. The plow zone in all of
the units was very loosely compacted as expected, having an average density of 12.2
kN/m3 or 1,247.8 kg.m3 (77.9 lb/ft3). The density of the artificial fills ranged from 14.8
kN/m3 or 1,505 kg/m3 (94 lb/ft3) to 16.6 kN/m3 or 1,697.9 kg/m3 (106 lb/ft3) with a mean
for the plaza fills of 15.6 kN/m3or 1,589 kg/m3 (99 lb/ft). The individual density and
compaction results for the plaza fills are reported in Table 5.2. The average density of
the sterile terrace deposits, often a meter below the plaza fill, averaged 19.6 kN/m3 or
2,002 kg/m3 (125 lb/ft3). Because the artificial plaza fill around Mounds N and O is
thought to be continuous (Chapter 3), the mean density and compaction for these two

121
Mound Volume(m3)
Density(kg/ m3)
Mass (kg) Compaction(kN-m/m3)
Compaction Energy(kN-m or kJ)
A 30,150 1,848 55,700,000 240 7,200,000B 49,530 1,848 91,500,000 240 11,900,000C 5,080 1,848 9,400,000 240 1,200,000D 3,880 1,848 7,200,000 240 900,000E 10,820 1,848 20,000,000 240 2,600,000F 2,790 1,848 5,200,000 240 700,000G 6,730 1,848 12,400,000 240 1,600,000H 675 1,848 1,200,000 240 200,000I 2,690 1,848 5,000,000 240 600,000J 2,570 1,848 4,600,000 240 600,000K 1,855 1,848 3,300,000 240 400,000L 4,420 1,848 8,200,000 240 1,100,000M 590 1,848 1,100,000 240 100,000N 3,295 1,848 6,100,000 240 800,000O 1,220 1,848 2,300,000 240 300,000P 15,880 1,848 29,300,000 240 3,800,000Q 3,210 1,848 5,900,000 240 800,000R 21,820 1,848 40,300,000 240 5,200,000S 515 1,848 1,000,000 240 100,000T 705 1,848 1,300,000 240 200,000U 115 1,848 200,000 240 30,000V 22,460 1,695 38,100,000 120 2,700,000W 155 1,848 300,000 240 40,000X 105 1,848 200,000 240 30,000Y 55 1,848 100,000 240 10,000Z 95 1,848 200,000 240 20,000B' 55 1,848 100,000 240 10,000C' 55 1,848 100,000 240 10,000E' 110 1,848 200,000 240 30,000F1 115 1,848 200,000 240 30,000F2 115 1,848 200,000 240 30,000Z' 115 1,848 200,000 240 30,000TotalMoundFill
191,975 351,100,000 43,300,000
Table 5.1. Mass and compaction energy of mounds at Moundville.

122
excavation units, 15.8 kN/m3 or 1,610 kg/m3 (100.5 lb/ft3) is reported. No density or
compaction testing was conducted in possible plaza fill northwest of Mound J, so the
average density and compaction energy from the other areas of plaza fill were applied
instead. Using densities obtained from the sand cone tests, the estimated total mass of the
plaza fill is some 23,500,000 kg. The compaction invested in artificial plaza fills per unit
area was virtually identical based on the evidence from the four test units, 70 kN-m/m3
(1,500 ft-lb/ft3). The similarity is mostly a product of large increments between energy
levels applied in the compaction tests (Figure 5.6). It took three blows per three lifts to
achieve a curve representative of the in situ density. The next energy curve would have
been 4 blows per three lifts, which would equal 95 kN-m/m3 (1,980 ft-lb/ft3), followed by
five blows per 3 lifts equating to 120 kN-m/m3 (2,500 ft-lb/ft3). With the calculated
energy multiplied by the volume, the total amount of compaction energy for the plaza
fills combined, based on the Proctor compaction testing, is roughly 1,100,000 kN-m/m3
(800,000,000 ft-lb/ft3).
Plaza Area Volume(m3)
Density(kg/ m3) Mass (kg) Compaction
(kN-m/m3)
CompactionEnergy
(kN-m or kJ)West of Mound F 2,545 1,489 3,800,000 70 200,000North, West, and
South of Mound G 5,480 1,521 8,300,000 70 400,000
East of MoundsN and O
6,540 1,610 10,500,000 70 500,000
Northwest ofMound J 580 1,589 900,000 70 40,000
Total Plaza Fill 15,145 23,500,000 1,100,000
Table 5.2. Mass and compaction energy of areas of plaza fill. Note that the mass, compaction, and compactionenergy have been rounded.

123
Figure 5.6. Diagrams of the average compaction and average in situ dry unit weight of plaza fills.
Given the information above, the total mass of soil used to create the Moundville
landscape, both mounds and plaza fill, is estimated to be 374,600,000 kg (825,900,000
lb) (Table 5.3). This estimate will be used to calculate the amount of energy used to
excavate and transport soil (Chapter 4). Moreover, approximately 44,400,000 kN-m or
kJ (32,306,100,000 ft-lb/ft3) of mechanical energy was invested in compacting the
mounds and plaza fills.
Discussion
What does all this information mean archaeologically? First, it took an estimated
375 million kg of soil to create the Moundville landscape. Not only is this number a
more tangible representation of the earthworks than volume, it also allows for a method
to calculate the human energy invested in excavation and transportation of mound and a
plaza fill. Measuring compaction energy also lends support to the idea that varying
Average In situdry unit weight 99 l b/ ft 3
130
120
110
100
5 10 15 20
Moisture Conten t (%)
Dry
Uni
tW
eigh
t(lb
/ft3 )
Modifed ProctorStandard Proctor
3 lift s - 10 bl ows3 lift s- 5 bl ows
3 lift s - 3 blow

124
Volume Mass (kg) Compaction Energy(kN or kJ)
Mound Fill 191,975 351,100,000 43,300,000Plaza Fill 15,145 23,500,000 1,100,000
Total 207,120 374,600,000 44,400,000
Table 5.3. Total volume and mass of plaza and mound fills at Moundville.
amounts of compaction energy may have been invested in earthworks, perhaps based on
the size, the larger or taller earthworks requiring more compaction, or perhaps based on
the number of construction episodes, or perhaps based on societal importance of a
mound.
As already mentioned, there are several limitations of density and compaction
data and to reiterate, the reader should consider this research experimental. Furthermore,
due to the lack of on-going excavations, my sampling of mound fill was very minimal.
However, I do believe the samples obtained fall within a normal range for human
compaction of a large earthwork. If additional sampling were to be conducted, perhaps
differences in density and compaction between individual earthworks or individual
mound stages could be quantified. In the meantime, the averages obtained from the two
mounds tested will be used to complete the energetics assessment using the proposed
units of kilojoules as opposed to person-days.

125
Chapter 6
Formulating an Energetics Assessment of the Moundville Landscape
The labor expended in building Moundville’s monumental landscape is conceived
for this study as having three components: energy of excavation, energy of transportation,
and energy of compaction (Figure 6.1). This chapter will estimate each measure and
combine them to estimate the total human energy expenditure for Moundville’s earthen
landscape. Theories and methods from other disciplines such as geotechnical
engineering, human physiology, human biology, and ergonomics combined with
archaeology provide a means for reformulating the units of measure in energetic studies
from person-hours to kilojoules. The result is that the total labor expended to create the
earthen monuments and level the plaza at Moundville amounts to approximately 3.8
billion kJ.
In this chapter, I explain the methodology behind the current energetics study.
Assumptions are made concerning several variables, including excavation rate and
amount of material removed, transportation speed and the size of the load carried, and the
rate and method of compaction. Based on a combination of archaeological and
physiological data, estimates for these variables are provided. By using the data obtained
from the volume of mound and plaza fills (Chapters 2 and 3), the distance from the
source to the construction site (Chapter 4), and the density of each earthwork (Chapter 5),

126
Figure 6.1. The three energy components as visualized for this study.
the energy of mound building and plaza construction at Moundville is calculated. Then,
in order to provide some form of comparison to other energetics assessments, the
measure is converted into a form of person-days by using estimates of the number of
laborers participating in the construction process and how much energy they were
expending per day.
Methods for Reformulating Energetics Units
The following section will explain the variables used in calculating energy
expenditure within each component of construction. In every situation, the lowest
amount of human energy required to complete tasks such as digging and walking is
employed in energetics calculations. Using the minimum energy expended for these
activities decreases the chance of overestimating the labor required from the prehistoric
inhabitants of Moundville. In this sense what I am presenting is a least-cost model. In
addition, all results have been rounded, which in some cases may cause slight variations.
Energy of Excavation
For the present study, the mass of the soil excavated to create an earthwork is
determined by multiplying the volume of each construction by the average density of its
soils, obtained using geotechnical methods, to provide the amount of soil in kilograms
Borrow Area Mound
Excavate Transport
Com
pact
Energy ofExcavation
Energy ofTransportation
Energy ofCompaction

127
that was excavated (M = D x V; whereas M is mass, D is density, and V is volume).
Based on previous experimental studies in soil excavation (Erasmus 1965; Hammerstedt
2005), the total volume of the soil of each mound is divided by the amount of time for a
given unit of measure; Erasmus estimated 0.52 m3 per hour, whereas for Hammerstedt
estimated 0.29 m3 per hour. This measurement, in the form of a volume of excavated soil
per hour (v/hr), is converted to energy expended per given mass (kJ/kg). The average
energy expenditure for one hour of excavating ranges between 1,200 and 2,000 kJ
(Ainsworth et al. 1993; Edholm et al. 1970; James and Schofield 1990; Malhotra et al.
1976). Using Hammerstedt’s (2005) value of 0.29 m3 of excavated soil per hour
multiplied by the estimated average natural density of soils at Moundville, 1,442 kg/m3
(90 lb/ft3), we obtain the mass of soil excavated per hour, which is 418 kg.18 If it takes
the average human a minimum of 1,200 kJ of energy to excavate soil for one hour, then
we may assume that that amount of energy is expended in excavating 418 kg of soil or
2.87 kJ per kg. The mass of a mound multiplied by the energy to excavate a given mass
(1,200 kJ per 418 kg), results in an estimate of the energy of excavation for that mound,
as measured in kJ.
Thus, in the case of Mound R, the mass of the earthwork at 40,300,000 kg multiplied by
2.87 kJ per kg equals the energy of excavation at 115,700,000 kJ.
18 The average density of natural terrace deposit soil at Moundville is calculated from a sand cone densitytest conducted approximately 150 meters north of Mound G, near an unnamed tributary of the BlackWarrior River (see Chapter 5 and #27, Figure 4.9).
Mass of Earthwork (kg) X Energy (2.87 kJ) = Energy of Excavation (kJ)Mass (1 kg)

128
Energy of Transportation
Transportation energy is calculated in a manner similar to excavation energy, and
also is expressed in kilojoules. However, to do this calculation, two additional
measurements are needed; the mass of an average load, and the distance between the
mound and the excavation source (Chapter 4).
There are two possible ways to estimate the average load carried. First, it is
possible to estimate the mean body mass of Moundvillians from their skeletal remains.
Given an average body mass, the weight of an average load can be based upon a
percentage of the weight of the load in relation to the weight of the carrier. The mean
height of people from Moundville can be calculated from a previous osteological study.
Powell (1988) reported average femur and tibia measurements of skeletons recovered
from Moundville. These average lengths may be inserted into a formula for stature (Bass
1995) with results indicating that an average male was 166.5 cm tall (5’5½”) and an
average female was 156.5 cm tall (5’1½”) (also see Muller 1997:142 for similar
measurements for Moundville and other Mississippian sites). Moreover, using a Body
Mass Index (BMI) chart, an estimated body mass for average Moundvillians can be
calculated.19 Assuming that the population was fairly lean (BMI of 19 – 20), the mean
mass of these individuals would average 54.4 kg (120 lb) for males and 47.6 kg (105 lb)
for females. Finally, using ethnographic studies, an average load can be estimated based
on the average mass. For example, if Moundville males carried the same percentage of
their body mass as Nepalese porters (Bastien et al. 2005a), which would be on the higher
19 The Body Mass Index (BMI) is a statistical measurement that correlates a normal weight given aperson’s stature squared (kg/m2). A desirable range for an individual’s BMI is 19-25 (see Frisancho1993:428-429).

129
side of the potential range as these porters use tumplines, then the average load would be
92% of their body mass or roughly 50.6 kg (111 lb).
A second method for calculating the average load is strictly archaeologically
based. In several cases (Ford and Webb 1959; Fowke 1893, 1902; Gibson 2000; Porter
1974; Shetrone 2004), the sizes of basket loads can be distinguished in the archaeological
record. James A. Ford and Clarence H. Webb (1959) estimated that an average basket
load at the Late Archaic Poverty Point site in northeastern Louisiana was about 22.7 kg
(50 lb). Jon L. Gibson (2000), also working at Poverty Point, estimated basket loads
from 13.6 to 52.2 kg (30 - 115 lb). James W. Porter at the Mississippian Mitchell site in
southern Illinois estimated six different loads based on excavations, the mass of which
ranged from 7.3 to 14.2 kg (16 - 31.3 lb), and averaged 11 kg (26 lb), excluding a 2.3 kg
(5 lb) outlier. For this study, 11 kg (26 lb) per basket load is used as the average load
transported based on Porter’s results from a Mississippian mound site. This weight
represents 21% of the mean body weight for adult males for Moundville as calculated
above.
With the distances from earthworks to the nearest borrow areas estimated
(Chapter 4), the distance for each earthwork is multiplied by the energy to carry an 11 kg
load over that distance, and then walk back the same distance unburdened. Sources in
physiology, human biology, and ergonomics were consulted to calculate the energy
needed to walk a given distance (m) with and without carrying a load. According to
James and Schofield (1990:135), the average energy expended to carry an 11-16 kg load
at an unspecified walking speed is 1,675 kJ per hour. Assuming that the laborers are
walking at a speed comparable to Erasmus’s (1965) workers, around 4.8 km/h (3 mi/h), a

130
transport distance of 4,828 m (3 mi) would take approximately 1,675 kJ of energy (or
0.35 kJ/m) for the transportation of one basket load.20 James and Schofield (1990:135)
also estimated the average energy of walking 4-5 km/h (2.5-3.1 mi/h) without carrying
anything over the same distance (4,828 m) as approximately 1,072 kJ. For this research,
the distance from the earthwork to the nearest borrow area is multiplied by these values
(1,072 kJ per 4,828 m or 0.22 kJ/m). The products of these two calculations (energy of a
single trip with a load and energy of a single trip without) are added together to produce
the energy needed for a single round trip during the construction of an earthwork. Then,
the mass of each earthwork (Chapter 5) is divided by the estimated average load carried,
11 kg, which results in the number of round trips. The energy for a single round trip is
multiplied by the number of trips. For example, Mound R is approximately 70 m from the
calculating the energy of transportation for each earthwork.
nearest soil source. This distance is multiplied by 0.35 kJ/m, resulting in the energy
required to carry the load from the source to the mound, which is 25 kJ. Seventy meters
multiplied by 0.22 kJ/m would be the amount of energy needed to walk from the mound
20 Erasmus’s workers carried 28 kg (61 pounds) 20.6 km (12.8 mi) and 23.2 km (14.4 mi) when adjustedfor a five hour day. This amounts to approximately 4.2 km/h (2.6 mi/h) and 4.7 km/h (2.9 mi/h). Giventime to stop, dump the load and start a fresh load, I would estimate the average speed of these workers asapproximately 4.8 km/h (3 mi/h).
Distance - source to earthwork (m) X Energy w/load (0.35 kJ) = Single Trip Energy w/LoadDistance (m)
Distance - earthwork to source (m) X Energy w/o load (0.22 kJ) = Single Trip Energy w/o LoadDistance (m)
Single Trip Energy w/load + Single Trip Energy w/o load = Single Round Trip Energy
Mass of Mound (kg) / Average Load (11 kg) = Number of Trips
Single Round Trip Energy (kJ) X Number of Trips = Energy of Transportation (kJ)

131
back to the soil source, which is 15 kJ. Both are added together for the total
transportation energy needed to make one round trip, 40 kJ. The mass of Mound R, 40.3
million kg, is divided by 11 kg, the estimated average basket load weight, to determine
the number of times the trip was made. In this case, 3,663,636 round trips would be
needed. The energy per trip (40 kJ) is multiplied by the number of round trips
(3,663,636), resulting in the total transportation energy, 146,000,000 kJ.
It should be noted that the energy expended in carrying a load can be greatly
affected by the manner in which the load is carried. It is greatly decreased when the
center of gravity of the load is kept near that of the transporter. Keeping the centers of
gravity of the load and the transporter close together also allows the transporter to
maintain an upright posture similar to walking without a load (Knapik et al. 2004). There
are numerous methods for carrying a load, including using a head basket, head strap
(tumpline), chest strap, satchel, bag, or shoulder yoke. Prehistoric mound builders may
have even been transporting soil using a bucket brigade method, in which the basket load
is passed from one stationary person to another. A majority of present-day transportation
energy studies have been conducted with the military in mind. The purpose of these
studies in military science is to determine the optimal method and speed for soldiers
carrying equipment of various weights. In many cases, the experimental participants of
these studies carried the weight of the load on their backs. This method of transportation
is consistent with ethnohistorical accounts of Native Southeast historic tribes, in which
baskets were carried on the back employing either tumplines (head straps) or chest strap
supports (Bushnell 1909; Hudson 1976; Hvidt 1980) (Figure 6.2).

Figure 6.2. Illustration of southeastern Indians showingor a tumpline. Left, photograph of a Choctaw woman from Bayou Lacomb, Louisiana, 1909 (Bushnell 1909). Top,sketch by Philip von Reck showing two Creek males in Georgia, 1736 (Hvidt 1980). Bottom, painting by AlfredBoisseau of Louisiana Indians walking along a bayou, 1847
For this reason, in this study energy calculations are based on the transporter carrying a
load on their back.
Energy of Compaction
The amount of mechanical energy needed to compact the earthwork soils is
calculated using the geotechnica
test, the amount of compaction energy is measured by using a standardized device to
compact the soil. To reiterate here, the result of the laboratory test expresses how much
energy is needed for a sample of soil from
density measured in situ
energy in this form does not represent human energy but instead raw kinetic energy of
Illustration of southeastern Indians showing baskets being carried on the backft, photograph of a Choctaw woman from Bayou Lacomb, Louisiana, 1909 (Bushnell 1909). Top,
sketch by Philip von Reck showing two Creek males in Georgia, 1736 (Hvidt 1980). Bottom, painting by AlfredBoisseau of Louisiana Indians walking along a bayou, 1847 (Hudson 1976).
For this reason, in this study energy calculations are based on the transporter carrying a
Energy of Compaction
The amount of mechanical energy needed to compact the earthwork soils is
calculated using the geotechnical compaction test described earlier in Chapter 5. In this
test, the amount of compaction energy is measured by using a standardized device to
compact the soil. To reiterate here, the result of the laboratory test expresses how much
a sample of soil from an earthwork to be compacted to match the
in situ with the sand cone test. It should be noted that compaction
energy in this form does not represent human energy but instead raw kinetic energy of
132
back using either a shoulder strapft, photograph of a Choctaw woman from Bayou Lacomb, Louisiana, 1909 (Bushnell 1909). Top,
sketch by Philip von Reck showing two Creek males in Georgia, 1736 (Hvidt 1980). Bottom, painting by Alfred
For this reason, in this study energy calculations are based on the transporter carrying a
The amount of mechanical energy needed to compact the earthwork soils is
l compaction test described earlier in Chapter 5. In this
test, the amount of compaction energy is measured by using a standardized device to
compact the soil. To reiterate here, the result of the laboratory test expresses how much
an earthwork to be compacted to match the
It should be noted that compaction
energy in this form does not represent human energy but instead raw kinetic energy of

133
compaction. As noted in the previous chapter, human energy expended when compacting
earth is difficult to estimate due to the lack of appropriate energetics studies. It is known
that to achieve a specific compaction level one has to drop a weight from a certain height.
A log pestle, a rock, or a person jumping, marching, or stomping are all weights dropped
from a height. The more highly compacted the earthwork, the more human energy that
must have been invested. Clearly, additional research is needed to strengthen the
relationship between the mound compaction and the amount of human energy expended.
In the meantime, for this research, in order to calculate the amount of human energy
expended in soil compaction, the mass of the earthwork will be multiplied by the energy
expended in marching on level ground, essentially using a constant value for what was
certainly a variable (James and Schofield 1990:134). It will be assumed that the method
of compaction employed by the prehistoric inhabitants of the site was walking over the
soil repeatedly with a stomping motion until it was compacted down. The amount of
energy expended in marching, 1,440 kJ per hour, is multiplied by the mass of each
earthwork and divided by 1,000 kg (2,005 lb) (or 1.44 kJ/kg), as it will be assumed that
one person could compact 1,000 kg of soil per hour. There is no research to support this
assertion, but it seems reasonable to assume that one laborer could compact almost twice
as much soil as one laborer could excavate in the same amount of time. In the case of
Mound R, the mass, 40,300,000 kg, is multiplied by 1.44 kJ/kg to estimate the amount of
human compaction energy to be 58,100,000 kJ.
Mass of Earthwork (kg) X Energy to March (1.44 kJ/hr) = Energy of Compaction (kJ)Amount of Soil (kg/hr)
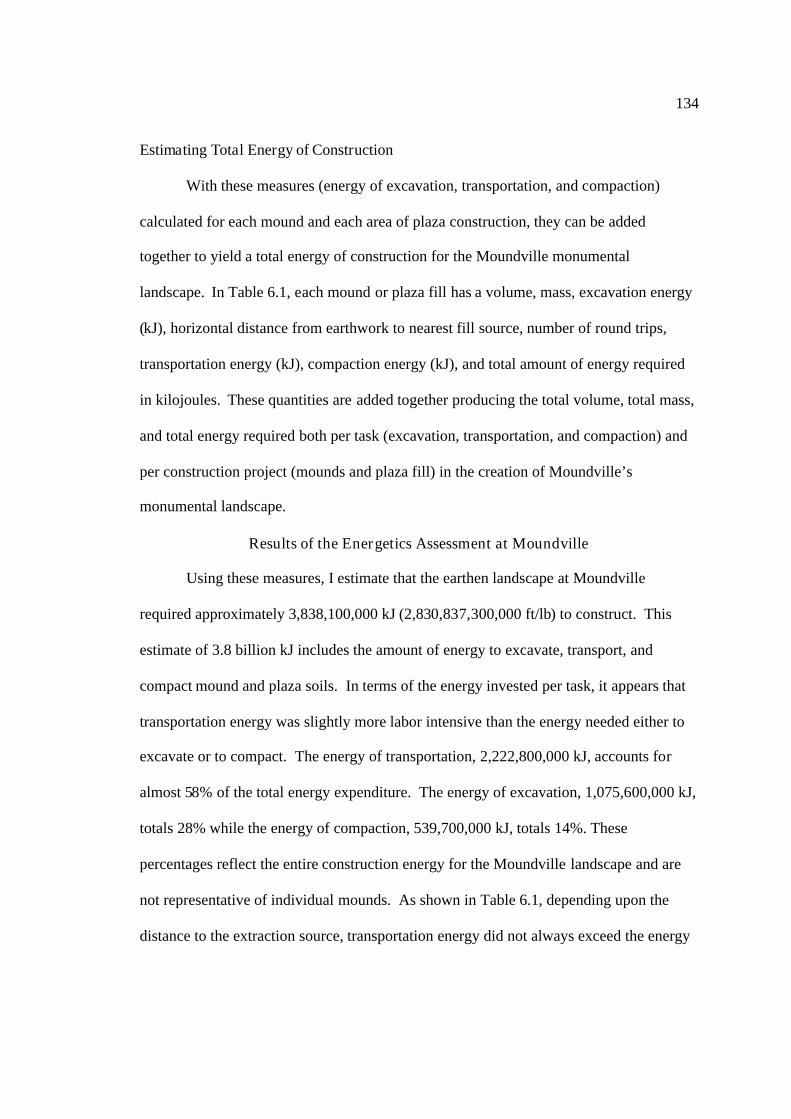
134
Estimating Total Energy of Construction
With these measures (energy of excavation, transportation, and compaction)
calculated for each mound and each area of plaza construction, they can be added
together to yield a total energy of construction for the Moundville monumental
landscape. In Table 6.1, each mound or plaza fill has a volume, mass, excavation energy
(kJ), horizontal distance from earthwork to nearest fill source, number of round trips,
transportation energy (kJ), compaction energy (kJ), and total amount of energy required
in kilojoules. These quantities are added together producing the total volume, total mass,
and total energy required both per task (excavation, transportation, and compaction) and
per construction project (mounds and plaza fill) in the creation of Moundville’s
monumental landscape.
Results of the Energetics Assessment at Moundville
Using these measures, I estimate that the earthen landscape at Moundville
required approximately 3,838,100,000 kJ (2,830,837,300,000 ft/lb) to construct. This
estimate of 3.8 billion kJ includes the amount of energy to excavate, transport, and
compact mound and plaza soils. In terms of the energy invested per task, it appears that
transportation energy was slightly more labor intensive than the energy needed either to
excavate or to compact. The energy of transportation, 2,222,800,000 kJ, accounts for
almost 58% of the total energy expenditure. The energy of excavation, 1,075,600,000 kJ,
totals 28% while the energy of compaction, 539,700,000 kJ, totals 14%. These
percentages reflect the entire construction energy for the Moundville landscape and are
not representative of individual mounds. As shown in Table 6.1, depending upon the
distance to the extraction source, transportation energy did not always exceed the energy
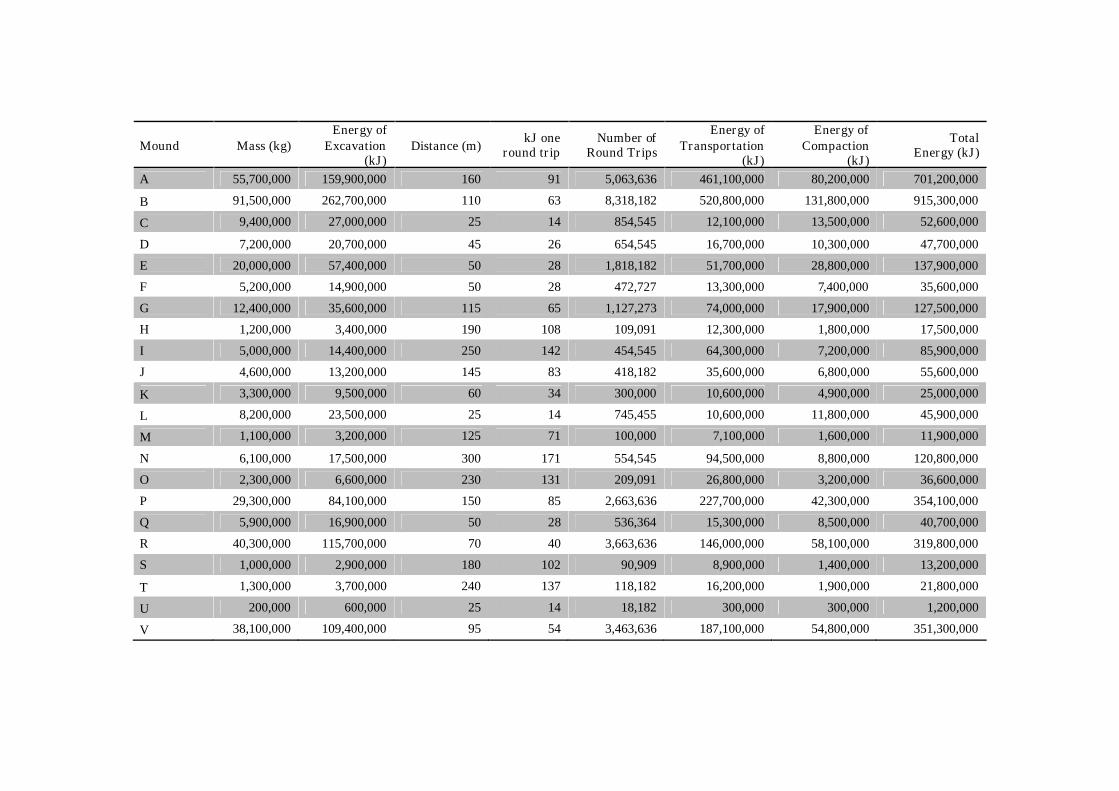
Mound Mass (kg)Energy of
Excavation(kJ)
Distance (m)kJ one
round tripNumber of
Round Trips
Energy ofTransportation
(kJ)
Energy ofCompaction
(kJ)
TotalEnergy (kJ)
A 55,700,000 159,900,000 160 91 5,063,636 461,100,000 80,200,000 701,200,000
B 91,500,000 262,700,000 110 63 8,318,182 520,800,000 131,800,000 915,300,000
C 9,400,000 27,000,000 25 14 854,545 12,100,000 13,500,000 52,600,000
D 7,200,000 20,700,000 45 26 654,545 16,700,000 10,300,000 47,700,000
E 20,000,000 57,400,000 50 28 1,818,182 51,700,000 28,800,000 137,900,000
F 5,200,000 14,900,000 50 28 472,727 13,300,000 7,400,000 35,600,000
G 12,400,000 35,600,000 115 65 1,127,273 74,000,000 17,900,000 127,500,000
H 1,200,000 3,400,000 190 108 109,091 12,300,000 1,800,000 17,500,000
I 5,000,000 14,400,000 250 142 454,545 64,300,000 7,200,000 85,900,000
J 4,600,000 13,200,000 145 83 418,182 35,600,000 6,800,000 55,600,000
K 3,300,000 9,500,000 60 34 300,000 10,600,000 4,900,000 25,000,000
L 8,200,000 23,500,000 25 14 745,455 10,600,000 11,800,000 45,900,000
M 1,100,000 3,200,000 125 71 100,000 7,100,000 1,600,000 11,900,000
N 6,100,000 17,500,000 300 171 554,545 94,500,000 8,800,000 120,800,000
O 2,300,000 6,600,000 230 131 209,091 26,800,000 3,200,000 36,600,000
P 29,300,000 84,100,000 150 85 2,663,636 227,700,000 42,300,000 354,100,000
Q 5,900,000 16,900,000 50 28 536,364 15,300,000 8,500,000 40,700,000
R 40,300,000 115,700,000 70 40 3,663,636 146,000,000 58,100,000 319,800,000
S 1,000,000 2,900,000 180 102 90,909 8,900,000 1,400,000 13,200,000
T 1,300,000 3,700,000 240 137 118,182 16,200,000 1,900,000 21,800,000
U 200,000 600,000 25 14 18,182 300,000 300,000 1,200,000
V 38,100,000 109,400,000 95 54 3,463,636 187,100,000 54,800,000 351,300,000

Table 6.1. Summary of the total energy of construction at Moundville, including mound and plaza construction
W 300,000 900,000 150 85 27,273 2,200,000 400,000 3,500,000
X 200,000 600,000 110 63 18,182 1,100,000 300,000 2,000,000
Y 100,000 300,000 165 94 9,091 900,000 200,000 1,400,000
Z 200,000 600,000 25 14 18,182 200,000 300,000 1,100,000
B' 100,000 300,000 25 14 9,091 100,000 100,000 500,000
C' 100,000 300,000 25 14 9,091 100,000 100,000 500,000
E' 200,000 600,000 25 14 18,182 300,000 300,000 1,200,000
F1 200,000 600,000 25 14 18,182 300,000 300,000 1,200,000
F2 200,000 600,000 25 14 18,182 300,000 300,000 1,200,000
Z' 200,000 600,000 25 14 18,182 300,000 100,000 1,000,000
Mound
Total 351,100,000 1,008,200,000 3,290 1,872 31,918,182 2,018,800,000 505,700,000 3,532,700,000
Plaza F 3,800,000 10,900,000 75 43 345,455 14,700,000 5,500,000 31,100,000
Plaza G 8,300,000 23,800,000 110 63 754,545 47,200,000 12,000,000 83,000,000Plaza Nand O 10,500,000 30,100,000 250 142 954,545 135,800,000 15,200,000 181,100,000
Plaza J 900,000 2,600,000 135 77 81,818 6,300,000 1,300,000 10,200,000
Plaza
Total 23,500,000 67,400,000 570 324 2,136,364 204,000,000 34,000,000 305,400,000
Landscape
Total 374,600,000 1,075,600,000 3,860 2,196 34,054,546 2,222,800,000 539,700,000 3,838,100,000

137
of excavation. In the majority of cases, the energy to excavate exceeds the energy to
transport mound soils, except when the transport distance is greater than 50 meters. The
energy of excavation of a mound is reasonably consistent with its mass, whereas the
energy to transport can be altered significantly depending upon the distance to the nearest
source. In other words, substantial amounts of transportation energy could be conserved
by careful planning and positioning of the borrow pit on the landscape.
Hypothetical Scenarios of the Working Population
The amount of energy invested in monumental constructions at the site, 3.8 billion
kJ, does not take into account either the number of people participating or the length of
time spent on the construction. Those inhabitants at Moundville participating in mound
and plaza constructions, herein referred to as laborers, could have consisted of small kin-
organized work groups or larger publicly sanctioned construction teams drawn from the
entire polity. In order to examine the number of laborers for a given construction project,
the measure is converted into person-days by dividing the total energy of construction by
hypothetical estimates of the population and the amount of energy each laborer expended
per day. The number of laborers cannot be determined archaeologically, but hypothetical
scenarios can be developed that are suggestive of the work that could be accomplished by
varying numbers of participants. The result will be a rough calculation of the amount of
time it would have taken some given number of laborers to complete construction at the
site. If the resulting time estimate is within range of the known construction history of
the site, it may be considered a reasonable scenario. However, to do this, the
approximate amount of energy expended by a single laborer in a single day needs to be
explored.
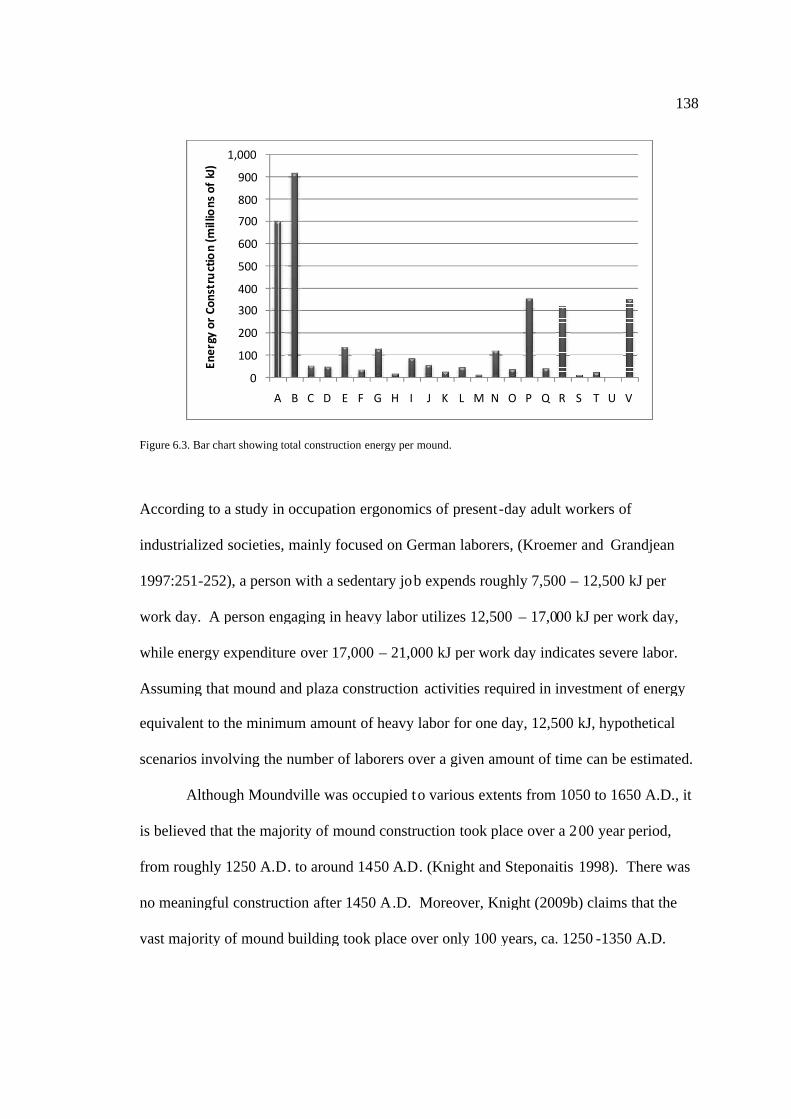
Figure 6.3. Bar chart showing total construction energy per mound.
According to a study in occupation ergonomics of present
industrialized societies, mainly focused on German laborers, (Kroemer and
1997:251-252), a person with a sedentary jo
work day. A person engaging in heavy labor utilizes 12,500
while energy expenditure over 17,000
Assuming that mound and plaza construction
equivalent to the minimum amount of heavy labor for one day, 12,500 kJ, hypothetical
scenarios involving the number of laborers over a given amount of time can be estimated.
Although Moundville was occupied t
is believed that the majority of mound construction took place over a 2
from roughly 1250 A.D
no meaningful construction after 1450 A
vast majority of mound building took place over only 100 years, ca. 1250
0
100
200
300
400
500
600
700
800
900
1,000
A
Ener
gyor
Cons
truc
tion
(mill
ions
ofkJ
)
art showing total construction energy per mound.
According to a study in occupation ergonomics of present-day adult workers of
industrialized societies, mainly focused on German laborers, (Kroemer and
252), a person with a sedentary job expends roughly 7,500
work day. A person engaging in heavy labor utilizes 12,500 – 17,000 kJ per work day,
while energy expenditure over 17,000 – 21,000 kJ per work day indicates severe labor.
Assuming that mound and plaza construction activities required in investment of energy
equivalent to the minimum amount of heavy labor for one day, 12,500 kJ, hypothetical
scenarios involving the number of laborers over a given amount of time can be estimated.
Although Moundville was occupied to various extents from
is believed that the majority of mound construction took place over a 2
D. to around 1450 A.D. (Knight and Steponaitis
no meaningful construction after 1450 A.D. Moreover, Knight (2009b) claims that the
vast majority of mound building took place over only 100 years, ca. 1250
A B C D E F G H I J K L M N O P Q
138
day adult workers of
industrialized societies, mainly focused on German laborers, (Kroemer and Grandjean
b expends roughly 7,500 – 12,500 kJ per
17,000 kJ per work day,
21,000 kJ per work day indicates severe labor.
activities required in investment of energy
equivalent to the minimum amount of heavy labor for one day, 12,500 kJ, hypothetical
scenarios involving the number of laborers over a given amount of time can be estimated.
o various extents from 1050 to 1650 A.D., it
is believed that the majority of mound construction took place over a 200 year period,
and Steponaitis 1998). There was
.D. Moreover, Knight (2009b) claims that the
vast majority of mound building took place over only 100 years, ca. 1250 -1350 A.D.
R S T U V

139
Also, population estimates for creating reasonable scenarios are based on the amount of
labor contributed per person during a full year. I am not arguing that mound construction
was a yearly activity. On the contrary, based on the stratigraphic evidence of mound
construction it appears that large construction stages were added to earthworks at rather
lengthy intervals (Anderson 1994). The time-span of a site is important to know for
creating realistic scenarios of the number of laborers participating in mound construction.
In considering the number of possible laborers, one must also examine population
estimates for the site. Steponaitis (1998:43) has argued that roughly around 1,000-1,700
people lived at the center during the peak occupation in the Moundville I phase (1120 –
1260 A.D.), while Peebles (1987) estimates that 10,000 more lived in the hinterlands.
Muller (1997:275) estimates that roughly 1/5 of any given Mississippian population
worked on mound construction, basically one person per household of five. The merit of
this assumption is debatable.21 However, for sake of the example at hand, three
approximations for the population from which the laborers were drawn, 1,250, 5,000, and
10,000, is divided by five, yielding 250, 1,000, and 2,000 laborers. Based on current
estimated, the first figure might include the Moundville I phase population resident at the
site while the latter two would certainly involve large contributions from some or all of
the hinterland populations as well.
21 To estimate the number of laborers, I am using a ratio of 1:5; one worker for every five people in apopulation (Muller 1997). It should be noted however that this ratio is debatable. Muller (1997) does notspecify where this came from, though it is presumably meant to represent one worker per household. Scarryuses the range of Moundville house floor sizes (Peebles 1978; Scarry 1995, 1998) and Naroll's (1962)formula for calculating household size creating an estimate of 1.3-3.4 people per house. As this is lowcompared to ethnohistorical sources (Hann 1988:166; Swanton 1911:43), Scarry (1998:92 also seeSteponaitis 1998:42) assumes 5-8 people per household in the Black Warrior River valley. Therefore,assuming one able-bodied per household the ratio 1:5 seems reasonable. Other ratios that have been usedinclude 1:2 by Bernardini (2004:346) who assumes that half of the population was capable of participatingin mound construction, while T.R. Kidder (Personal Communication) assumes a ratio of 1:3 in hisenergetics study of Poverty Point based on Kelly’s (1995) ethnographic study of hunting-gathering bandsof approximately 25 people.

140
The total amount of energy implicated in earthwork construction, 3.8 billion kJ,
can be divided by the product of: 1) 12,500 kJ per day, the minimum amount of energy of
a human engaged in heavy labor multiplied by 2) the estimated number of workers; 250,
1,000, or 2,000, and 3) the estimated number of days per year for those laborers
participating in mound building. For example, the energy of construction of the site, 3.8
billion kg, divided by the product of 12,500 kJ per day, 250 laborers, drawn from a
population of 1,250 working an average of 10 days per year, is 116 years. Given that the
Moundville landscape was constructed during a time span of 100 to 200 years, this
estimate of people and time seems to be a reasonable scenario. The reader should note
that simply dividing the total construction energy by the product of energy per day and
estimated number of laborers will yield only the total number of work days, whereas the
number of work days per year must also be assumed. In reference to the example above,
250 laborers at 12,500 kJ per day yields 1,164 total work days. The concept of work days
per year is factored in to give the reader a more tangible idea of the amount of labor that
would have been required over the 100-200 year duration of construction.
The results of all three estimates of laborers working 3 days per year are shown
graphically in Figure 6.4. The graphic shows that 250 laborers (representing a population
of 1,250) working 3 days a year (1,164 total work days) is an unreasonable scenario, as it
would have taken them 388 years to complete the work, far in excess of the 200 year
deadline. As shown in Figure 6.4, the most realistic minimum estimate at 12,500 kJ per
day is roughly 1,000 laborers (from a population of 5,000) working 3 days annually (291
total work days) to complete the construction in 97 years. However, 2,000 laborers
(representing a population of 10,000) working an average of 3 days per year (145 total

141
Total Energy of Construction (billions of kJ)
43210
Num
bero
fYea
rsfo
rCon
stru
ctio
n
400
350
300
250
200
150
100
50
0
250 Laborers
3 Days per Year
1,000 Laborers
3 Days per Year
2,000 Laborers
3 Days per Year
Figure 6.4. Hypothetical labor costs of earthwork construction at Moundville. Projections are calculated based on theassumption that laborers expended 12,500 kJ per day over 20 days of work per year.
work days) could complete construction of the site in only 49 years, an estimate that
would appear far short what we know about the site. Yet, because constructions for an
average mound were highly episodic, not annual, and about 20 years elapsed between
mound additions (Anderson 1994), there could have been many years in which there was
no construction anywhere on the site. In other words, I think 2,000 laborers working an
average of three days a year is also quite plausible.
Using these estimates and comparing them to the site chronology, I would
argue that Moundville was constructed in approximately 300 – 1200 total working days,
meaning that the average year required three to ten days of labor depending upon the
number of laborers. The number of laborers would probably have averaged around
1,000. Steponaitis (1998) estimates the peak population at Moundville to have occurred
during Moundville I times (AD 1120 – 1260) and Knight (2009b) estimates that mound

142
construction around the plaza began no earlier than AD 1250 and slowed down by AD
1350, which leaves very little overlap between a peak residential population and mound
construction (also see Wilson 2008). Therefore, it one may reasonably conclude that
laborers for mound constructions came from the hinterlands and not merely from
Moundville’s residential population.
When energy for earthen monumental construction is calculated in terms of the
three components of construction energy, it appears that earthen constructions were
slightly more labor intensive than some current scenarios suggest. For example, Muller
(1997:274) states that 250 laborers (1/5th of a population of 1,250) working four days a
year could have created Moundville in 160 years assuming that a single person could
excavate and transport 1.25 m3 in one day.22 This is approximately 640 total work days.
However, using the estimates calculated for this study, 250 laborers at Moundville
working more than 1,120 total work days, or seven days a year could not have created the
site in less than 160 years. This difference between these estimates amounts to almost
twice as much labor to construct the site in my model. However, I believe the work
sessions projects for this study per year are not excessive nor ethnographically
unrealistic.
The Moundville landscape, like other Mississippian landscapes, was not created
continuously over time. Instead, individual mounds were built in discrete stages, with
long intervals in between (Knight 2009b; also see Anderson 1994). Some of these
mounds stages were very large and would have required sizeable work crews. Some
were relatively small. The manner in which Muller and I present our results, that is in
22 The mass of 1.25 m3, assuming a density of 1,442 kg/m3, is 1,803 kg (3,975 lb) or almost two short tons.Even as an able-bodied male, I think I would have serious difficultly excavating and transporting two tonsin one five hour period.

143
days of labor per year, probably does not reflect a realistic timing in which these sites
were constructed. It is these mound stages that are the true “packages” or units of mound
construction and much more attention should be devoted to the labor needed for each of
these smaller quantities. It is more anthropologically interesting than figuring the total
labor over the course of many decades, which is abstract in human terms.
To get a better idea of the organization of labor required for individual mound
stages, reasonable hypothetical scenarios were created for three mound stages at
Moundville: 1) Stage III of Mound A, 2) Stage II of Mound F, and 3) Stage I of Mound
R. These three stages represent the largest construction stage in each of these three
mounds. Using volumes for these stages estimated from mound excavation records and
coring results (Gage 2000; Gage and Jones 2001; Knight 2009b), the total amount of
construction energy is calculated in the same manner as described for entire earthworks
(Table 6.2).
Stage III of Mound A is approximately 10,850 m3, the largest of the three mound
stages examined for this study. The volume of this stage was loosely calculated using the
ratio of the height of the building episode to the height of the entire mound assuming
symmetry. Knight (2009b) reported this building stage to be roughly 2.38 m thick. As
Mound A is currently 6.7 m high, the height of the stage was divided by the height of the
mound and then multiplied by the volume calculated in Chapter 2 using the gridding
method (30,145 m3). The stage is approximately 36% of the total earthwork, thus the
volume of the stage is theoretically the same, 36%. The density from Mound R was used
(1,848 kg/m3) to calculate the mass of the stage and the result was used in the equations
discussed above for the energy of excavation, transportation, and compaction.
144
MoundStage
Volume(m3)
Mass (kg) Energy ofExcavation
(kJ)
Energy ofTransportatio
n (kJ)
Energy ofCompactio
n (kJ)
Total energyof
Construction(kJ)
Mound AStage III
10,850 20,100,000 57,700,000 168,100,000 28,900,000 254,700,000
Mound FStage II
1,005 1,900,000 5,500,000 4,800,000 2,700,000 13,000,000
Mound RStage I
7,030 13,000,000 37,300,000 47,300,000 18,700,000 103,300,000
Table 6.2. Energy of construction for three mound stages at Moundville. Results have been rounded.
The volume of Stage II of Mound F was calculated from a profile drawing (Knight
2009b) in a similar manner as Stage III of Mound A; a ratio of the height of the stage to
the height of the mound was calculated to be 36%. The volume was multiplied by the
density from Mound R and then the mass generated was used in the construction
equations. The volume of Stage I of Mound R was previously calculated by Gage
(2000). However, his final volume estimate for the mound, calculated using multiple
geometry solids (see Chapter 2), was slightly larger than the estimate obtained using the
gridding method. Thus, to estimate a more precise volume of the mound stage, the
gridding method volume estimate (21,820 m) was divided by Gage’s (2000) estimate of
30,700 m3. This ratio, 0.71 was multiplied by Gage’s estimate of Stage I, 9,900 m3,
resulting in a new estimate of the volume of Stage I proportional to the overall volume
obtained using the gridding method, 7,030 m3.
With the volume, mass, and various energies of construction of these three
construction stages calculated, the total energy of construction for each stage can be
divided by estimates of the number of laborers multiplied by the estimated number of kJ
expended per day. The result would be the total number of work days invested in each
construction stage. If it is true that the construction stages of the smaller plaza periphery
145
mounds were built using kin-based labor, then they should have required smaller and
perhaps more diverse groups of people (consisting of various family members as opposed
to specialized work crews) than the larger central mounds, A, B, and V. Therefore, the
estimates of laborers I use to create various scenarios here are smaller than previous
estimates. I use 50, 250, and 1,000 laborers drawn from total populations of 250, 1,000,
and 5,000. Because I am talking about specific work crews for specific projects as
opposed to averages for the whole site over long spans of time, smaller work crew
estimates of 50, 250, and 1,000 are appropriate. A single kin group might have mustered
50 laborers and perhaps even 250 (if they were 1,250 strong), but 1,000 (drawn from a
population of 5,000) is unrealistic for one kin group alone.
For Mound A, 50 laborers could have constructed stage III in 475 days, whereas
250 laborers could have constructed the stage in 95 days. Both of these scenarios seem
unrealistic, considering that the stage was probably constructed as one continuous
building episode. This amount of time is also much longer than the typical estimates for
the amount of time invested in monumental construction, except by state-level
organizations (Bernardini 2004; Erasmus 1961, 1965; Hogbin 1939, 1951; Redfield and
Rojas 1962; Stenton 1951; Tuzin 1980). I believe the most reasonable scenario for this
stage is approximately 1,000 laborers working for 24 days. As for Mound F, 50 laborers
could have constructed Stage II in approximately 20 days, whereas 250 laborers could
have constructed it in four days, and 1,000 laborers could have completed it in little more
than one day. Using the same three figures for number of laborers as the other two
construction stages, it would have taken 50 laborers 169 days to complete the first stage
of Mound R. On the other hand, it would have taken 250 laborers 34 days or 1,000

146
Numberof
LaborersMound A Mound F Mound R
50 475 20 169
250 95 4 34
1,000 24 >1 8
Table 6.3. Number of possible construction days based on the estimated number of laborers.
laborers 8 days to complete Stage I. Two hundred and fifty laborers working 34 days is a
comparable time frame to those I believe are reasonable for the other two mound stages
just discussed. It is possible that 250 laborers could have been drawn from a single kin
group, however, 1,250 people might be pushing the upper limit for one kin group.
Discussion
I believe that the measure advocated here, calculated using the three components
of energy and expressed in kilojoules, is a suitable one for measuring energy involved in
the creation of a monumental landscape. Yet, this method is not without its
shortcomings. Assumptions must be made concerning certain variables, and a majority
of research concerning these variables is experimental. Nevertheless, I think this method
emphasizes aspects of mound building that have previously been ignored, such as mound
density, transportation distance, and compaction. Using only volume and expressing the
measurement as person-hours or days appears to underestimate the amount of labor
needed to construct an earthen monumental landscape. This method of calculating
energy for constructing monumental earthworks will provide more opportunity to
compare the amount of energy expended given different populations and different scales
of landscape modification.

147
147
Chapter 7
Conclusions and Suggestions for Future Research
One important objective of this dissertation was to reformulate the units of
measure in an energetics model for earthen monumental landscapes and to some degree
standardize a comparative method for future research. To accomplish this objective, soil
density was calculated using methods from geotechnical engineering in order to estimate
the mass of an earthwork, rather than its volume. Then, the three most labor intensive
activities employed in earthen construction were quantified: the energy to excavate, the
energy to transport, and the energy to compact. One primary benefit of this research is
that data from other disciplines can now be applied to prehistoric labor assessments in
archaeology. I should note that this method also simplifies the addition of further
activities to the original three tasks measured herein. The energy for loading, dumping
(unloading), and walking up and down the mound or in and out of a borrow pit (or
ravine) could also be included the assessment.
In the remaining portion of this chapter I will briefly discuss additional
implications of the research, mainly focusing on its theoretical implications concerning
the social and political organization of labor. Control over non-kin has been a major
theoretical assumption about complex societies and has been one of the defining
characteristics of both chiefdoms and early states (Arnold 1993, 1996; Bender 1985,

148
1990; Drennan 1991; Earle 1991, 1997; Fried 1960; Friedman and Rowlands 1978;
Hastorf 1990; Johnson and Earle 1987; Kirch 1991; Saitta 1997; Saitta and Keene 1990;
Steponaitis 1991; Webster 1990). Arnold (1993) defines complexity employing three
characteristics: 1) hereditary inequality, 2) hierarchical organization, and 3) partial
control over domestic labor. The first two have been well-addressed for the Moundville
chiefdom (Peebles and Kus 1977; Steponaitis 1978). I am interested in applying my data
to address the third characteristic, that is, whether or not labor was controlled above the
level of the kin group at Moundville. The subsequent discussion addresses kin-based
versus supra-kin-based labor in complex societies, followed by an examination of the
amount of energy required to construct individual building episodes of three mounds of
various size. Based on both the estimated amount of labor and number of laborers, I will
argue that some mound stages at Moundville could easily have been constructed using
only labor organized by a single kin group, whereas other constructions required more
laborers than a single kin group could organize. These larger constructions arguably
were built by labor crews assembled and presumably overseen by political elites at the
apex of Moundville’s organization.
In some segmentary societies, kin groups (such as clans, lineages, descent groups,
and social houses) are strongly corporate and can potentially recruit fairly large labor
pools. However, this is often a latent function, and labor is organized by smaller
domestic groups (or minimal lineages) on an everyday basis. As needed (for example,
for field clearing, etc.), kin group leaders emerge that can organize as many as several
hundred workers, depending on the generational depth of the group. This authority is

149
only temporary and is seldom, if ever used for monumental construction (Arnold 1993,
1996; Trigger 1990; Webster 1990).
In stratified societies, leaders gain control over non-kin labor using a combination
of symbolic, economic, and military leverage (Earle 1997). The labor exploited in such
political economies is drawn upon by relatively stable political officeholders, and large-
scale labor projects occur with more frequency than in non-stratified societies (Arnold
1993, Kirch 1990). According to Webster (1990), the strategy for controlling labor in
stratified societies involves an expansion from a kin-based labor force to one that
supersedes domestic organization by binding non-kin clientele to elite activities. In short,
as the social relations of production evolve, individuals gain partial control over labor by
establishing a hierarchical organization transcending segmentary kin organization
(Bender 1990; Earle 1991; Kirch 1991).
Labor Organization at Moundville
In order to examine the sociopolitical implication of labor at Moundville, and
determine if labor was controlled above the kin group level, some parameters need to be
addressed, including an estimate of the population and number of possible kin segments.
Peebles (1987) estimated the regional population of the Black Warrior River Valley to be
roughly 10,000. Peebles does not specify the source of this estimate for the hinterland
population, but it is seems to be a reasonable assessment for the upper limit of the Black
Warrior River Valley population. Recent assessments of the number of hinterland
communities based on survey (Hammerstedt et al. 2009) suggest that this figure may be
too high.

150
The possible number of kin groups or segments (clans, maximal lineages, etc.)
that comprised the population also needs to be addressed. There is no way to know the
exact number of major kin-based segments, but for the purposes at hand, it can be
assumed that there were at least seven at Moundville based on the number of mound pairs
(Knight 1998). Knight suggests that kin-organized groups controlled the mounds
arranged around the plaza periphery, and that one can count the number of major social
segments at Moundville by counting the number of structurally equivalent mound pairs.
This number of kin-based segments is comparable to regional ethnohistoric data. For
example, during the late 1700s, the Cherokee of western North Carolina had seven major
matrilineal clans (Fogelson 2004), though Morgan (1877) reported that originally there
might have been as many as ten. The Creeks of Alabama and Georgia were organized
into nine major phratries (Walker 2004). The Chickasaw of Tennessee and northern
Alabama had a least 12-15 named house groups (Speck 1907; Gatschet and Thomas
1907), though Swanton (1928) counted over 50. Therefore, it seems reasonable to assert
that there were at least seven major kin-based segments for a model of Moundville
organization based on ethnographic analogy applied to the number of structurally
equivalent mound pairs at the ceremonial center.
Peebles’s estimated regional population of the Moundville polity (10,000) divided
by seven major kin-based segments is approximately 1,430 people per kin group.
Assuming that one in every five people were able-bodied individuals capable of
participating in mound construction (Muller 1997; see Chapter 6), a kin group of this size
could recruit roughly 286 laborers. Because there probably were larger and smaller kin
groups, I am assuming that the largest might have possessed a population of over 2,000

151
people (one-fifth of the total population) and could amass a work crew of approximately
400, while smaller kin groups might muster perhaps 50 laborers from an overall
population of approximately 250. Following this logic, if a specific construction project,
in this case a mound stage at Moundville, can be constructed with 400 or fewer laborers
under a reasonable work scenario, then there is no need to invoke an organization of labor
higher than that of the kin group. Note that the total population is likely a maximal
estimate while the modeled number of kin segments is likely minimal. Thus, smaller
work crews, especially smaller than 400, are much more likely than larger ones under this
scenario.
Referring back to the estimates in Chapter 6 for individual construction stages, the
difference in the estimated amount of labor necessary to construct one of these stages in
roughly one month varies between 50 to 1,000 laborers. Stage III of Mound A in the
center of the plaza must have required a large collectively pooled work crew of
approximately 1,000 laborers drawn from a population of 5,000 in order to be completed
in approximately 24 days. Stage II of plaza-periphery Mound F, on the other hand, easily
could have been constructed by a small work crew of 50 laborers, drawn from a kin
group with a population of 250 people, working over 20 days. The obvious difference in
the size of work crews working for roughly the same amount of time indicates to me that,
at least for the few largest earthworks, labor was controlled above the organizational level
of the kin segment, whereas others constructions on the plaza periphery need not have
been.
The construction of Mound R Stage I on the plaza periphery seems to fall between
the estimates reported above for Mounds A and F. Two hundred and fifty laborers drawn

152
from a population of 1,250, an averaged size kin group in terms of the estimates
generated above, could have constructed the stage in 34 days. The difference in the labor
required between these construction stages of plaza-periphery Mounds F and R probably
indicate a difference in the ability of their respective kin groups to recruit labor.
Although Mound R is quite large, there is no reason to believe that it or any other plaza-
periphery mound was constructed using collectively pooled labor. The exceptions are the
larger central Mounds A, B, and perhaps Mound V, which probably did require labor
pooled from multiple social segments.23
Based on this examination of the organization of labor at Moundville, I argue that
some form of control over labor above the level of kin groups was necessary for the
construction of the major mounds on Moundville’s central axis, but no other mounds of
the group. The palisade, another large project, would probably also have required polity-
wide as opposed to kin-based labor (Figure 7.1). Evidence indicates a rapid
transformation in the Black Warrior River Valley from an egalitarian society in the
terminal Woodland West Jefferson phase (AD 1020 – 1120) to a more complex society
less than 100 years later. I believe that this regional population achieved a level of
political complexity integrating several local communities with leadership capable of
commanding labor from a broad hinterland (Arnold 1993, 1996; Peebles and Kus 1977;
Steponaitis 1978).
To conclude, I would like to reiterate that these scenarios and values are largely
speculative. Yet, creating plausible scenarios is worthwhile as they help us think more
23 The argument that Mound V was constructed by a collectively pooled work crew is based on the fact thatthe mound appears to have been constructed in a single building episode (Gage and Jones 2001), it fallsalong the central axis of the site along with Mounds A and B, and is the third largest mound by volumebehind Mounds A and B, according to revised estimates (Chapter 2).

153
concretely about the number of laborers, the durati on of labor, and the manner in which
they may have been organized. Such models can be refined or replaced as better values
for these variables are obtained.
Future Research
Information from this and similar studies can be used to address other
archaeological issues. For example, the reformulation of the units of measure for an
energetics assessment of the construction of a monumental landscape also enables
research to be conducted concerning the degree to which labor may have been subsidized
by staple food amassed by means of political economy. It is possible to estimate the
average daily energy (or caloric intake) based on a form of subsistence practice and then
determine how much additional food above typical domestic consumption was being
A
B
V
CD
E
FF1
S
GX
H
T
I
JKL
M
M1
N
OW
P
Q
R B1
U
R1
0 100 m
L ake #4
Lake #2
The Palisade: constructedwith labor amassed polity-wide by central leadership
Central Mounds (A,B, and V):constructed by labor amassedpolity-wide by central leadership
F2
Plaza-Periphery Mounds:constructed by labor recruitedby individual kin groups
Figure 7.1. A model of labor organization for Moundville .

154
subsidized by leaders during a time of monumental construction (eg., Erasmus 1965;
Lewis 1951; Pimentel and Pimentel 2007; Pyke 1970; Rappaport 1968). Chiefs develop
political economies in order to carry out projects, including mound construction. To do
this, they amass surplus food, extracted from primary producers, in central storehouses
(granaries, in the case of Moundville). So the issue here is how much they would have
needed to extract to feed a given quantity of laborers. An energetics assessment measure
in kilojoules, which are easily converted to kilocalories (1 kJ= 0.239 kcal), is capable of
estimating such factors, in a way that person-hours cannot.24
It should be noted that it is a simple matter to re-express the human energy
expended in the construction of Moundville’s landscape entirely in the form of
kilocalories instead of kilojoules. Such a conversion certainly benefits the reader in some
ways. Kilocalories are more easily visualized than kilojoules, as they are the typical unit
used to measure human nutrition. For example, I have stated that the average worker
utilizes 12,500 kJ per day. This measure converts to 2,988 kilocalories, which is just
slightly higher than the average daily caloric intake recommended for male adults by the
World Health Organization. The typical measure of work energy is in the form of joules
or kilojoules, not kilocalories. Nutritional information, in contrast, is typically expressed
in kilocalories, although some countries give nutritional information in either kilojoules
or a combination of kilojoules and kilocalories. As the objective of this study is the
measurement of human energy rather than the nutritional requirements of prehistoric
builders, I found it appropriate to maintain kilojoules as the unit of measure throughout
24 Food energy is the amount of energy in food available through digestion. Like other forms of energy,food energy is expressed in kilocalories (kcal) or kilojoules (kJ) depending upon geographic region. In thecontext of nutrition and food labeling, calorie and kilocalorie are interchangeable.

155
the assessment. If one’s research question is aimed more towards calculating the
nutritional needs of prehistoric builders, the kilocalorie is the appropriate unit of measure.
The methods and results of this research lead to other realizations. First,
Erasmus’s (1965) research provides unrealistic values for use in energetics assessments
in the Southeast United States. Not to denigrate his ground-breaking study, but there are
obvious differences that some archaeologists seem to ignore in borrowing his 50 year-old
data. First, the climates and soil types are completely different. Las Bocas, Sonora,
Mexico, where Erasmus conducted his experiment, is a small fishing village in western
Sonora, located on a narrow coastal plain between the Sierra Madre Occidental Mountain
range and the Gulf of California. The climate here is very desert-like with an average
annual temperature of 75° F (24° C) and yearly rainfall range of roughly 3-16 in (8-41
cm). More importantly, the soil in this region consists mostly of sand and rock; there is
very little clay or silt. Central Alabama, on the other hand, is sandwiched between the
East Gulf Coastal Plain and the southern end of the Cumberland Plateau and Appalachian
Valley and Ridge Providence. This area has an annual average temperature of 65° F (18°
C) and an average of 60 in (152 cm) of rain per year. Most of the soils in this region are
silts and clays with various amounts of sand. The difference in the amount of rainfall
increases the moisture content of the naturally heavier silts and clays, further increasing
their unit weight. The soils of Sonora are generally much easier to excavate, especially
using a digging stick, and are less dense. Therefore, the same amount of energy would
have been expended to excavate and transport less volume per hour. Secondly, the
manner in which Erasmus (1965) measured the volume of earth excavated was done

156
using geometric volume equations, and as the research from Chapter 2 has shown, this
method tends to overestimate the amount of soil utilized.
Hammerstedt (2005) took the initiative to conduct his own earth-moving
experiments in the same area as his archaeological research, and in the resulting
energetics assessments noted a rather large difference in the energy to excavate compared
to Erasmus. His estimate for excavation volume, 0.29 m3 per hour, is approximately half
of Erasmus’s (1965) estimate, 0.52 m3 per hour. More often than not, original
experiments to estimate energy are not conducted and the data are merely borrowed,
which leads to unrealistic results. Secondly, archaeologists need to standardize the
methods for conducting energetics assessments of prehistoric peoples. A plethora of
information outside of archaeology has been published for disciplines from general
construction to military medicine. These sources can and should be consulted.
Finally, the most up-to-date technology for identifying and quantifying earthen
constructions should always be used in archaeological energy assessments. As I say
elsewhere in this dissertation, the technology is readily available to more accurately
measure mound volume and to identify less obvious earthen constructions, such as plaza
fills. To conduct an energetics assessment and productively compare the results to other
mound stages, mounds, or sites, one needs to be sure to include all soil used in the
creation of a monumental landscape.

157
REFERENCES CITED
Abe, Daijiro, Satoshi Muraki, Akira Yasokouchi2008 Ergonomic effects of load carriage on the upper and lower back on metabolic
energy cost of walking. Applied Ergonomics 39(3):392-298.
Abrams, Elliot M.1989 Architecture and Energy: An Evolutionary Perspective. In Archaeological
Method and Theory, edited by M.B. Schiffer, 1: 47-87. University ofArizona Press, Tucson.
1994 How the Maya Built Their World: Energetics and Ancient Architecture.University of Texas Press, Austin.
Abrams, Elliot M. and Thomas W. Bolland1999 Architectural Energetics, Ancient Monuments, and Operations Management.
Journal of Archaeological Method and Theory 6(4): 263-291.
Ainslie, Philip N. Iain T. Campbell, Keith N. Frayn, Sandy M. Humphreys, Donald P.M.MacLaren, and Thomas Reilly
2002 Physiological and Metabolic Response to a Hill Walk. Journal of AppliedPhysiology 92: 179-187.
2003 Physiological, Metabolic, and Performance Implications of a Prolonged HillWalk: Influence of Energy Intake. Journal of Applied Physiology 94:1075-1083.
Ainsworth, Barbara E., W.L. Haskell, and A.S. Leon1993 Compendium of Physical Activities: Classification of Energy Costs of Human
Physical Activities. Medicine and Science in Sports and Exercise 25(1):71-80.
American Society for Testing and Materials1998 ASTM Standards. West Conshohocken, Philadelphia.
Anderson, David G.1994 The Savannah River Chiefdoms. University of Alabama Press, Tuscaloosa.
Arnold, Jeanne E.1993 Labor and the Rise of Complex Hunter-Gatherers. Journal of
Anthropological Archaeology 12:75-119.

158
1996 Understanding the Evolution of Intermediate Societies. In EmergentComplexity: The Evolution of Intermediate Societies, edited by Jeanne E. Arnold,pp. 1-12. Archaeological Series 9, International Monographs in Prehistory, AnnArbor.
Arnold Jeanne E. and Anabel Ford1980 A Statistical Examination of Settlement Patterns at Tikal, Guatemala.
American Antiquity 45(4): 713-726.
Astin, Robyn1996 Mound M: Chronology and Function at Moundville. Unpublished M.A.
thesis, Department of Anthropology, University of Alabama, Tuscaloosa.
Bass, William M.1995 Human Osteology: A Laboratory and Field Manual. 4th ed. Special
Publication No 2. Missouri Archaeological Society, Columbia.
Bastien, Guillaume J., Bénédicte Schepens, Patrick A. Willems, Norman C. Heglund2005a Energetics of Load Carrying in Nepalese Porters. Science 308(5729): 1755
Bastien, Guillaume J., Patrick A. Willems, Bénédicte Schepens, Norman C. Heglund2005b Effect of Load and Speed on the Energetics Cost of Human Walking.
European Journal of Applied Physiology 94: 76-83.
Bell, Matrin, Peter Fowler, and Simon Hillson1996 The Experimental Earthwork Project 1960-1992. Council for British
Archaeology, York.
Bender, Barbara J.1985 Prehistoric Developments in the American Midcontinent and in the Brittany,
Northwest France. In Prehistoric Hunters-Gatherers: The Emergence of CulturalComplexity, edited by T. Douglas Price and James A. Brown, pp. 21-57. AcademicPress, Orlando.
1990 The Dynamics of Nonhierarchical Societies. In The Evolution of PoliticalSystems: Sociopolitics in Small-Scale Sedentary Societies, edited by S. Upham, pp.247-262. Cambridge University Press, Cambridge.
Bernardini, Wesley2004 Hopewell Geometric Earthworks: A Case Study in the Referential and
Experiential Meaning of Monuments. Journal of Anthropological Archaeology23:331-356.
Binford, Lewis R.1972 An Archeological Perspective. Seminar Press, New York.

159
Black, Glenn A.1967 Angel Site: An Archaeological, Historical, and Ethnological Study. 2 vols.
Indiana Historical Press. Indianapolis.
Blanton, Richard E., Gary Feinman, Stephen Kowalewski, and Peter Peregrine1996 A Dual-Processual Theory for the Evolution of Mesoamerican Civilization.
Current Anthropology 37:1-15.
Blitz, John H.1993 Ancient Chiefdoms of the Tombigbee. University of Alabama Press,
Tuscaloosa.
2007 Test Excavations at Mound X, Moundville (1TU500), 2004. Early MoundvilleArchaeological Project. Unpublished manuscript in possession of the author.
Blitz, John H., and Patrick Livingood2004 Sociopolitical Implications of Mississippian Mound Volume. American
Antiquity 69(2): 291-301.
Bowles, Joseph E.1979 Physical and Geotechnical Properties of Soils. McGraw-Hill, New York.
Bozeman, Tandy K.1981 Moundville Phase Sites in the Black Warrior River valley, Alabama:
Preliminary Results of the UMMA Survey. Southeastern ArchaeologicalConference Bulletin 24: 84-86.
Brady, Nyle C. and Ray R.Weil2002 The Nature and Properties of Soils. 13th ed. Prentice Hall, New Jersey.
Breuning-Madsen, Henrik, Mads K. Holst, and Marianne Rasmussen2001 The Chemical Environment in a Burial Mound Shortly after Construction –
An Archaeological-Pedological Experiment. Journal of Archaeological Science28:691-697.
Brown, James A.2006 Where’s the Power in Mound Building? An Eastern Woodlands Perspective.
In Leadership and Polity in Mississippian Society, edited by Brian M. Butler andPaul D. Welch, pp. 236-264. Center for Archaeological Investigations SouthernIllinois University Carbondale Occasional Paper No. 33.
Bushnell, David I. Jr.1909 The Choctaw of Bayou Lacomb St. Tammany Parish, Louisiana. Bulletin 48.
Bureau of American Ethnology, Washington, D.C.

160
Carmean, K.1991 Architectural Labor Investment and Social Stratification at Sayil, Yucatan,
Mexico. Latin American Antiquity 2:151-165.
Cavagna, GA, H. Thys, and A Zamboni1976 The Sources of External Work in Level Walking and Running. Journal of
Physiology 262: 639-657.
Cavagna, G. A., P. A. Willems, M. A. Legramandi, and N. C. Heglund2002 Pendular Energy Transduction within the Step in Human Walking.
Journal of Experimental Biology 205:3413-3422.
Childe, V. Gordon1950 The Urban Revolution. Town Planning Review 21:3-17.
Cook, Sherburne F., and Adan E. Treganza1947 The Quantitative Investigation of Aboriginal Sites: Comparative Physical and
Chemical Analysis of Two California Indian Mounds. American Antiquity13(2):135-141.
Craig, Douglas B., James Holmlund, and Jeffery Clark1998 Labor Investment and Organization in Platform Mound Construction: A Case
Study from the Tonto Basin of Central Arizona. Journal of Field Archaeology25(3): 245-259.
Dalan, Rinita A.1991 Defining Archaeological Features with Electromagnetic Surveys at the
Cahokia Mounds State Historic Site. Geophysics 56(8): 1280-1287.
1993 Landscape Modification at the Cahokia Mounds Site: Geophyiscal Evidenceof Cultural Change. Unpublished Ph.D. dissertation, Department of Anthropology,University of Minnesota, Twin Cities.
1997 The Construction of Mississippian Cahokia. In Cahokia: Domination andIdeology in the Mississippian World, edited by Timothy R. Pauketat and ThomasE. Emerson, pp. 89-102. University of Nebraska Press, Lincoln.
Dalan, Rinita A., George R. Holley, William I. Woods, Harold W. Watters, Jr., and JohnA. Koepke
2003 Envisioning Cahokia: A Landscape Perspective. Northern Illinois UniversityPress, Dekalb.
D’Appolonia, D.J., R.V. Whitman, E. D’Appolonia1969 Sand Compaction with Vibratory Rollers. Journal of the Soil Mechanics and
Foundations Division, ASCE, Vol. 95. No SM1, 263-284.

161
Das, Braja M.2002 Principles of Geotechnical Engineering. 5th ed. Brooks/Cole, Pacific Grove.
Drennan, Robert D.1991 Pre-Hispanic Chiefdom Trajectories in Mesoamerican, Central American, and
Northern South America. In Chiefdoms: Power Economy, and Ideology, edited byTimothy Early, pp. 263-287. Cambridge University Press, Cambridge.
Earle, Timothy K.1991 Property Rights and the Evolution of Chiefdoms. In Chiefdoms: Power,
Economy, and Ideology, edited by Timothy Earle, pp. 71 – 99. CambridgeUniversity Press, Cambridge.
1997 How Chiefs Come to Power: The Political Economy in Prehistory. StanfordUniversity Press, Stanford.
ECAFE1957 Manual Labor and Its More Effective Use In Competition With Machines
For Earthwork in the ECAFE Region. United Nations Economic Commission forAsia and the Far East, E/CN.11/WRD/Conf. 3/L.1.
Edholm, O. G., J. M. Adam, M. J. R. Healy, H. S. Wolff, R. Goldsmith, and T. W. Best1970 Food Intake and Energy Expenditure of Army Recruits. British Journal of
Nutrition. 24:1091-1107.
Erasmus, Charles J.1965 Monument Buildings: Some Field Experiments. Southwestern Journal of
Anthropology 21(4): 277-301.
Fogelson, Raymond D.2004 Cherokee in the East. In Handbook of North American Indians, Vol. 14:
Southeast, edited by Raymond D. Fogelson, 337-353. Smithsonian Institution,Washington, D.C
Ford, James A.1951 Greenhouse: A Troyville-Coles Creek Period Site in Avoyelles Parish,
Louisiana. Anthropological Papers Vol. 44, pt. I. American Museum of NaturalHistory, New York.
Ford, James A., and Clarence H. Webb1959 Poverty Point, a Late Archaic Site in Louisiana. Anthropological Papers
of the American Museum of Natural History 46, New York.
Fowke, Gerard1893 Notes on Ohio Archaeology. Report of the Geological Survey of Ohio 7, part
2, Chapter 1.

162
1902 Archaeological History of Ohio: The Mound Builders and Later Indians.Ohio State Archaeological and Historical Society, Columbus.
Fowler, Melvin L.1989 The Cahokia Atlas: A Historical Atlas of Cahokia Archaeology. Studies in
Illinois Archaeology 6. Illinois Historic Preservations Agency, Springfield.
Fried, Morton R.1960 On the Evolution of Social Stratification and the State. In Culture in
History: Essays in Honor of Paul Radin, edited by S. Diamond, pp. 713-731.Columbia University Press, New York.
1967 The Evolution of Political Society: An Essay in Political Anthropology.Random House, New York.
Friedman, J., and M.J. Rowlands1978 Notes towards an Epigentic Model of the Evolution of “Civilisation.” In The
Evolution of Social Systems, edited by J. Friedman and M.J. Rowlands, pp. 201-276. University of Pittsburgh Press, Pittsburgh.
Frisancho, A. Roberto1993 Human Adaptation and Accommodation: Enlarged and Revised Edition of
Human Adaptation. The University of Michigan Press, Ann Arbor.
Gage, Matthew D.2000 Ground-Penetrating Radar and Core Sampling at the Moundville Site.
Unpublished M.A. thesis, Department of Anthropology, University of Alabama,Tuscaloosa.
Gage, Matthew D., and V. Stephen Jones2001 Remote Sensing and Core Drilling of Five Mounds at the Moundville Site.
Submitted to Alabama Historical Commission, AHC Contract No. PT98-DM072
Gatschet, Albert Samuel, and Cyrus Thomas1907 Chickasaw. In Handbook of American Indians North of Mexico, edited by
Frederick W. Hodge, pp. 260-262. Bulletin 30. Bureau of American Ethnology,Smithsonian Institution, Washington, D.C.
Gibson, Jon L.2000 The Ancient Mounds of Poverty Point. University Press of Florida,
Gainesville.
Golden Software, Inc.2002a Surfer for Windows Version 8.0. Golden Software Inc., Golden Co.
2002b Surfer: User’s Guide. Golden Software Inc. Golden Co.

163
2007 Didger for Windows Version 4.0. Golden Software Inc., Golden Co.
Goldsmith, Wendi, Marvin Silva, and Craig Fischenich2001 Determining Optimal Degree of Soil Compaction for Balancing Mechanical
Stability and Plant Growth Capacity. ERDC TN-EMRRP-SR-26, U.S. ArmyEngineer Research and Development Center, Vicksburg, MS.http://www.wes.army.mil/el/emrrp
Gordon, M.J., B.R. Goslin, T. Graham, J. Hoare1983 Comparison between Load Carriage and Grade Walking on a Treadmill.
Ergonomics 26(3):289-298.
Griffin, Timothy M. Thomas J. Roberts, and Rodger Kram2003 Metabolic Cost of Generating Muscular Force in Human Walking: Insights
from Load-Carrying and Speed Experiments. Journal of Applied Physiology95:172-183.
Hally, David J.1994 An Overview of Lama Culture. In Ocmulgee Archaeology, 1936-1986, edited
by David J. Hally, pp. 144-174. University of Georgia Press, Athens.
1996 Platform-Mound Construction and the Instability of Mississippian Chiefdoms.In Political Structure and Change in the Prehistoric Southeastern United States,edited by John F. Scarry, pp. 92-127. University Presses of Florida, Gainesville.
Hammerstedt, Scott W.2004 Mississippian Construction, Labor, and Social Power. Paper presented at the
61st annual meeting of the Southeastern Archaeological Conference, St. Louis,Missouri.
2005 Mississippian Construction, Labor, and Social Organization in WesternKentucky. Unpublished Ph.D. dissertation, Department of Anthropology,Pennsylvania State University, University Park.
Hammerstedt, Scott W., Jennifer Myer, and Mincy Maxham2009 Rural Settlement in the Black Warrior Valley. Paper presented at the 74 th
annual meeting of the Society for American Archaeology, Atlanta Georgia.
Hann, John H.1988 Apalachee: The Land between the Rivers. Ripley P. Bullen Monographs in
Anthropology and History 7. University Presses of Florida, Gainesville.
Haas, Jonathan1982 The Evolution of the Prehistoric State. Columbia University Press, New York.

164
Hastorf, Christine, A.1990 One Path to the Heights: Negotiating Political Inequality in the Sausa of Peru.
In The Evolution of Political Systems: Sociopolitics in Small-Scale SedentarySocieties, edited by S. Upham, pp. 146-176. Cambridge University Press,Cambridge.
Heizer, Robert F., and Sherburne F. Cook1956 Some Aspects of the Quantitative Approach to Archaeology. Southwestern
Journal of Anthropology 12(3):229-248.
Holley, George R., Rinita A. Dalan, and Philip A. Smith1993 Investigations in the Cahokia Site Grand Plaza. American Antiquity
58(2):306-319.
Holtz, Robert D. and William D. Kovacs1981 An Introduction to Geotechnical Engineering. Prentice Hall, New Jersey.
Hong, Youlian, Jing Xian Li, Aaron Shun Ki Wong, Paul D. Robinson2000 Effects of Lad Carriage on Heart Rate, Blood Pressure and Energy
Expenditure in Children. Ergonomics 43(6):717-727.
Hudson, Charles1976 The Southeastern Indians. University of Tennessee Press, Knoxville.
Hudson, Charles, Marvin T. Smith, and Chester B. DePratter1990 The Hernando de Soto expedition: From Mabila to the Mississippi River. In
Towns and Temples along the Mississippi, edited by David H. Dye, and C. A. Cox,pp. 181-207. University of Alabama Press, Tuscaloosa.
Hvidt, Kristian, (editor)1980 Von Reck’s Voyage; Drawings and Journal of Philip Georg Friedrich von
Reck. Beehive Press, Savannah.
Jackson, H. Edwin, and Susan L. Scott2003 Patterns of Elite Faunal Utilization of Moundville, Alabama. American
Antiquity 68(3):552-572.
James, William P. T., and E.C. Schofield1990 Human Energy Requirements: A Manual for Planners and Nutritionists.
Oxford University Press, Oxford.
Jeter, Marvin D.1984 Mound Volume, Energy Ratios, Exotic Materials, and Contingency Tables:
Comments on some recent Analyses of Copena Burial Practices. MidcontinentalJournal of Archaeology 9(1): 91-104.
165
Johnson, Allen, and Timothy Earle1987 The Evolution of Human Society. Stanford University Press, Stanford.
Jones, Walter B.1941 Mound and Lake Restoration Mound State Monument Moundville, Alabama.
Manuscript on file, Office of Archaeological Resource, Moundville, Alabama.Doc# 4,059,629.
Kelly, John E.2006 The Ritualization of Cahokia: The Structure and Organization of Early
Cahokia Crafts. In Leadership and Polity in Mississippian Society, edited by BrianM. Butler and Paul D. Welch, pp.73-90. Center for Archaeological InvestigationsSouthern Illinois University Carbondale Occasional Paper No. 33.
Kelly, Robert L.1995 The Foraging Spectrum: Diversity in Hunter-Gatherer Lifeways. Smithsonian
Institution Press, Washington.
Kidder, Tristram R.2004 Plazas as Architecture: An Example from the Raffman site, Northeast
Louisiana. American Antiquity 69(3):514-532.
King, Adam2001 Long-Term Histories of Mississippian Centers: The Development Sequence of
Etowah and its Comparison to Moundville and Cahokia. Southeastern Archaeology20(1):1-17.
2006 Leadership Strategies and the Nature of Mississippian Chiefdoms in NorthernGeorgia. In Leadership and Polity in Mississippian Society, edited by Brian M.Butler and Paul D. Welch, pp.73-90. Center for Archaeological InvestigationsSouthern Illinois University Carbondale Occasional Paper No. 33.
Kirch, Patrick V.1990 Monumental Architecture and Power in Polynesian Chiefdoms: A
Comparison of Tonga and Hawaii. World Archaeology 22:206-222.
1991 Chiefship and Competitive in Polynesia. Current Anthropology 28:431-456.
Knapik, J.J., Reynolds, K.L., Harman, E.2004 Soldier Load Carriage: Historical, Physiological, Biomechanical, and Medical
Aspects. Military Medicine 169:45–56.
Knight, Vernon J, Jr.1989 Certain Aboriginal Mounds at Moundville: 1937 Excavations in Mounds H, I,
J, K, and L. Presented at the Southeastern Archaeological Conference, Tampa,Florida.
166
1995 Chronology and Use of Public Architecture at the Moundville Site:Excavations in Mounds R, F, G, and E. Manuscript on file, Department ofAnthropology, University of Alabama, Tuscaloosa.
1998 Moundville as a Diagrammatic Ceremonial Center. In Archaeology of theMoundville Chiefdom, edited by Vernon J. Knight and Vincas P. Steponaitis, pp.44-62. Smithsonian Institution Press, Washington D.C.
2004 Characterizing Elite Midden Deposits at Moundville. American Antiquity69(2): 304-321.
2009a Discovery and Excavation of the Moundville Earth Lodge. Bulletin of theAlabama Museum of Natural History, Tuscaloosa, Forthcoming.
2009b Mound Excavations at Moundville: Architecture, Elites, and Social Order.Unpublished Manuscript submitted to the University of Alabama Press, Tuscaloosa.
Knight, Vernon J. Jr., and Vincas P. Steponaitis1998 A New History of Moundville. In Archaeology of the Moundville Chiefdom,
edited by Vernon J. Knight Jr., and Vincas P. Steponaitis, pp. 1-25. SmithsonianInstitution Press, Washington, D.C.
Kroemer, Karl H. E. and Etienne Grandjean1997 Fitting the Task to the Human: A Textbook of Occupational Ergonomics. 5th
ed. CRC Press, Boca Raton.
Lacquement, Cameron H.2007 Typology, Chronology, and Technological Change of Mississippian Domestic
Architecture in West-Central Alabama. In Architectural Variability in theSoutheast, edited by Cameron H. Lacquement, pp. 49-72. University of Alabama,Tuscaloosa.
Larson, Lewis H.1989 The Etowah Site. In The Southeastern Ceremonial Complex: Artifacts and
Analysis, edited by Patricia Galloway, pp. 133-141. University of Nebraska Press,Lincoln.
Lee, C. C. and Shun Dar Lin2007 Handbook of Environmental Engineering Calculations . 2nd ed. McGraw-Hill,
New York.
Legg, S. J.1985 Comparison of Different Methods of Load Carriage. Ergonomics 28:197-212.
167
Legg, S. J. and A. Mahanty1985 Comparison of Five Modes of Carrying a Load Close the Truck. Ergonomics
35: 1063-1068.
Lewis, Oscar1951 Life in a Mexican village: Tepoztlán Restudied. University of Illinois Press,
Urbana.
Lewis, R. Barry, Charles Stout, and Cameron B. Wesson1998 The Design of Mississippian Towns. In Mississippian Towns and Scared
Spaces: Searching for an Architectural Grammar, edited by R. Barry Lewis andCharles Stout, pp. 1 – 21. University of Alabama Press, Tuscaloosa.
Lindauer, Owen, and John H. Blitz1997 Higher Ground: The Archaeology of North American Platform Mounds.
Journal of Archaeological Research 5: 169-207.
Macphil, Richard I., John Crowther, Tim G. Acott, Martin G. Bell, and Jill M. Cruise2003 The Experimental Earthwork at Wareham, Dorset. After 33 Years: Changes
to the Buried LFH and Ah horizons. Journal of Archaeological Science 30(1):77-93.
Malhotra, M.S., Umesh Chandra, R. M. Raim Y. Venkataswamy, and K, Sridharan1976 Food Intake and Energy Expenditure of Indian Troops in Training. British
Journal of Nutrition 35:229-244.
Malville, Nancy J., William C. Byrnes, H. Allen Lim, and Ramesh Basnyat2001 Commercial Porters of Eastern Nepal: Health Status, Physical Work Capacity,
and Energy Expenditure. American Journal of Human Biology 13:44-56.
McGhee, T.J.1991 Water Supply and Sewerage. 6th ed. McGraw-Hill, New York.
McKenzie, Douglas1964 The Moundville Phase and its Position in Southeastern Prehistory.
Unpublished Ph.D. dissertation, Department of Anthropology, Harvard University,Cambridge.
Meehan, Richard L.1967 The Uselessness of Elephants in Compacting Fill. Canadian Geotechnical
Journal 4(3): 358-360.
1981 Getting Sued and Other Tales of the Engineering Life. MIT Press, Cambridge.

168
Millon, Rene, Bruce Drewitt, and James A. Bennyhoff1965 The Pyramid of the Sun at Teotihuacan: 1959 Investigations. Transactions of
the American Philosophical Society vol 55. Pt. 6 pp. 1-93.
Milanich, Jerald T., Ann S. Cordell, Vernon J. Knight, Timothy A. Kohler, Brenda J.Sigler-Lavelle
1997 Archaeology of Northern Florida A.D. 200-900: The McKeithen WeedenIsland Culture. University Press of Florida, Gainsville.
Milner, George1998 The Cahokia Chiefdom: The Archaeology of a Mississippian Society.
Smithsonian Institution Press, Washington, D.C.
Milner, George R., and Scott Hammerstedt2004 Mill Creek Hoes as Digging Tools: New Information on Their Effectiveness
and Use Wear. Paper presented at the 61st annual meeting of the SoutheasternArchaeological Conference, St. Louis, Missouri.
Moore, Clarence B.1905 Certain Aboriginal Remains of the Black Warrior River. Journal of the
Academy of Natural Sciences 13(2):124-244.
1907 Moundville Revisited. Journal of the Academy of Natural Sciences 13(3):334-405.
Morgan, Lewis Henry1877 Ancient Society; or, Researches in the Lines of Human Progress from
Savagery through Barbarism to Civilization. Henry Holt and Co., New York.
1881 Houses and House-Life of the American Aborigines. University of ChicagoPress, Chicago.
Morgan, William N.1980 Prehistoric Architecture in the Eastern United States. MIT Press, Cambridge.
Muller, Jon1986 Archaeology of the Lower Ohio River Valley. Academic Press, Inc. Orlando.
1997 Mississippian Political Economy. Plenum Press, New York.
Pauketat, Timothy R.2004 Ancient Cahokia and the Mississippians. Cambridge University Press, New
York.
2007 Chiefdoms and Other Archaeological Delusions. Altamira Press, Plymouth.

169
Payne, Claudine1994 Mississippian Capitals: An Archaeological Investigation of Precolumbian
Political Structure. Unpublished Ph.D. dissertation, Department of Anthropology,University of Florida, Ann Arbor.
Peebles, Christopher S.1971 Moundville and Surrounding Sites: Some Structural Considerations of
Mortuary Practices. In Approaches to the Social Dimension of Mortuary Practices,edited by James A. Brown, pp. 68-91. Memoir 15. Society for AmericanArchaeology.
1974 Moundville: The Organization of a Prehistoric Community and Culture.Unpublished Ph.D. dissertation, Department of Anthropology, University ofCalifornia, Santa Barbara.
1978 Determinants of Settlement size and Location in the Moundville Phase. InMississippian Settlement Patterns, edited by Bruce D. Smith, pp. 369-416.Academic Press, New York.
1979 Excavations at Moundville, 1905-1951. Microfiche. Ann Arbor: University ofMichigan Press.
1983 Moundville: Late Prehistoric Sociopolitical Organization in the SoutheasternUnited States. In The Development of Political Organization in Native NorthAmerica, edited by Elizabeth Tooker, pp. 183-201, Washington D. C. AmericanEthnological Society.
1987 The Rise and Fall of the Mississippian in western Alabama: The Moundvilleand Summerville phases, AD 1000 to 1600. Mississippi Archaeology 22:1-31.
1998 Annalistes, Hermeneutics and Positivists: Squaring Circles of DissolvingProblems. In Reader in Archaeological Theory: Post-Processual and CognitiveApproaches, edited by David S. Whitley, pp. 183-197. Routledge, London.
Peebles, Christopher S., and Susan M. Kus1977 Some Archaeological Correlates of Ranked Societies. American Antiquity 42:
421-448.
Pierrynowski, M.R. D.A. Winter, and R.W. Norman1981 Metabolic Measures to Ascertain the Optimal Load to be Carried by Man.
Ergonomics 24(5):393-399.
Pierson, William R.1959 The Validity of Stereophotogrammetry in Volume Determination.
Photogrammetric Engineering 25(1):83-85.

170
Pimentel, David, and Marcia Pimentel2007 Food, Energy, and Society. CRC Press, Boca Raton
Powell, Mary Lucas1988 Status and Health in Prehistory: A Case Study of the Moundville Chiefdom.
Smithsonian Institution Press, Washington, D.C.
Porter, James W.1974 Cahokia Archaeology as Viewed from the Mitchell Site: A Satellite
Community at A. D. 1150-1200. Unpublished Ph.D. dissertation, Department ofAnthropology, University of Wisconsin, Madison.
Price, Barbara J.1978 Secondary State Formation: An Explanatory Model. In Origins of the State:
the Anthropology of Political Evolution, edited by Ronald Cohen and Elman R.Service, pp. 161–186. Institute for the Study of Human Issues, Philadelphia.
Proctor, R.R.1933 Design and Construction of Rolled Earth Dams. Engineering New Record 3:
245-376.
Pyke, Magnus1970 Man and Food. McGraw Hill, New York.
Rappaport, Roy A.1968 Pigs for the Ancestors: Ritual in the Ecology of a New Guinea People. Yale
University Press, New Haven.
Reed, Nelson A.1973 Monks and Other Mississippian Mounds. In Explorations into Cahokia
Archaeology, edited by Melvin L. Fowler, pp. 31-42. Illinois ArchaeologicalSurvey, Inc. Bulletin 7, University of Illinois Urbana.
Reed, Nelson A. John W. Bennett, and James Warren Porter1968 Solid Core Drilling of Monks Mounds: Technique and Findings. American
Antiquity 33(2):137-148.
Renfrew, Colin1983 The Social Archaeology of Megalithic Monuments. Scientific American
249:152-163.
Rogers, J. Daniel, Michael C. Moore, and Rusty Greaves1982 Spiro Archaeology: The Plaza. Studies in Oklahoma’s Past 10. Oklahoma
Archaeology Survey, Norman.

171
Saitta, Dean J.1997 Power, Labor, and the Dynamics of Change in Chacoan Political Economy.
American Antiquity 62:7-26.
Saitta, Dean J., and Aruther S. Keene1990 Politics and Surplus Flow in Prehistoric Communal Societies. In The
Evolution of Political Systems: Sociopolitics in Small-Scale Sedentary Societies,edited by S. Upham, pp. 203-224. Cambridge University Press, Cambridge.
Sanders, William T. and Barbara J. Price1968 Mesoamerica: The Evolution of a Civilization. Random House, New York.
Scarry, C. Margaret1995 Excavations on the Northwest Riverbank at Moundville: Investigations of a
Moundville I Residential Area. Report of Investigations 72. Tuscaloosa: Universityof Alabama Museum, Office of Archaeological Services.
1998 Domestic Life on the Northwest Riverbank at Moundville. In Archaeology ofthe Moundville Chiefdom, edited by Vernon J. Knight Jr., and Vincas P. Steponaitis,pp. 63-101, Smithsonian Institution Press, Washington, D.C.
Scarry, C. Margaret and Vincas P. Steponaitis1997 Between Farmstead and Center: The Natural and Social Landscape of
Moundville. In People, Plants, and Landscapes: Studies in Paleoethnobotany,edited by Kristen J. Gremillion, pp. 107-122. University of Alabama Press,Tuscaloosa.
Scarry, John F., and Claudia Payne1986 Mississippian Polities in the Fort Walton Area: A Model Generated from the
Renfrew-Level XTENT Algorithm. Southeastern Archaeology 5(2):79-90.
Schnell, Frank T., Vernon J. Knight, Jr., and Gail S. Schnell1981 Cemochechobee: Archaeology of a Mississippian Ceremonial Center on the
Chattahoochee River. University Presses of Florida, Gainesville.
Sears, William H.1958 Excavations at Etowah. Manuscript on file, Department of Anthropology,
University of Georgia, Athens.
Seeman, Mark F.1979 The Hopewell Interaction Sphere: The Evidence for Interregional Trade and
Structural Complexity. Prehistory Research Series Volume 5, No 2. IndianaHistorical Society, Indianapolis.

172
Service, Elman R.1962 Primitive Social Organization: An Evolutionary Perspective. Random
House, New York.
Shenkel, J. Richard1974 Quantitative Analysis and Population Estimates of the Shell Mounds of the
Marismas Nacionales, West Mexico. In The Archaeology of West Mexico, edited byBetty Bell, pp. 57-67. West Mexican Society for Advanced Study, Ajijic, Jalsico,Mexico.
1986 An Additional Comment of Volume Calculations and a Comparison ofFormulae using Several Southeastern Mounds. Midcontinental Journal ofArchaeology 11(2): 201-220.
Shetrone, Henry C.2004 The Moundbuilders. University of Alabama Press, Tuscaloosa.
Sorant, Peter E., and J. Richard Shenkel.1984 The Calculations of Volumes of Middens, Mounds, and Strata having
Irregular Shapes. American Antiquity 49(3):599-603.
Speck, Frank G.1907 Notes on Chickasaw Ethnology and Folk-lore. Journal of American Folk-lore
20:50-58.
Steponaitis, Vincas P.1978 Location Theory and Complex Chiefdoms: A Mississippian Example. In
Mississippian Settlement Patterns, edited by Bruce D. Smith, pp. 417-453.Academic Press, New York.
1983a Ceramics, Chronology, and Community Patterns: An Archaeological Study atMoundville. Academic Press, New York.
1983b The Smithsonian Institution’s Investigation at Moundville in 1869 and 1882.Midcontinental Journal of Archaeology 8:127-160.
1991 Contrasting Patterns of Mississippian Development. In Chiefdoms: Power,Economy, and Ideology, edited by Timothy Earle, pp. 193-228. CambridgeUniversity Press, Cambridge.
1992 Excavations at 1Tu50, an Early Mississippian Center near Moundville.Southeastern Archaeology 11:1-13.
1998 Population Trends at Moundville. In Archaeology of the MoundvilleChiefdom, edited by Vernon J. Knight Jr., and Vincas P. Steponaitis, pp. 26-43.Smithsonian Institution Press, Washington, D.C.

173
Steponaitis, Vincas P., R. P. Stephen Davis, Jr., and H. Trawick Ward1994 Field Evaluation of Two Subsurface Augering Methods at Moundville.
Report submitted to the Alabama Museum of Natural History, Tuscaloosa.
Stout, Charles and R. Barry Lewis1998 Mississippian Towns and Sacred Spaces. In Mississippian Towns and Sacred
Spaces: Searching for an Architectural Grammar, edited by R. Barry Lewis andCharles Stout, pp. 151-178. University of Alabama Press, Tuscaloosa.
Sullivan, Lynne P.2006 Gender Contexts of Mississippian Leadership in Southern Appalachia. In
Leadership and Polity in Mississippian Society, edited by Brian M. Butler and PaulD. Welch, pp. 264-288. Center for Archaeological Investigations Southern IllinoisUniversity Carbondale Occasional Paper No. 33.
Swanton, John R.1911 Indian Tribes of the Lower Mississippi Valley and Adjacent Coast of the Gulf
of Mexico. Bulletin 43. Bureau of American Ethnology, Washington, D.C.
1928 Social and Religious Beliefs and Usages of the Chickasaw Indians. In 44th
Annual Report of Bureau of American Ethnology, pp. 169-273. Washington, D.C.
Thompson, Claire E.2010 Ritual and Power: Examining the Economy of Moundville’s Residential
Population, University of Alabama, Tuscaloosa.
Treganza, Adan E., and Sherburne F. Cook1948 The Quantitative Investigation of Aboriginal Sites: Complete Excavation with
Physical and Archaeological Analysis of a Single Mound. American Antiquity13(4):287-297.
Trigger, Bruce G.1990 Monumental Architecture: A Thermodynamic Explanation of Symbolic
Behaviour. World Archaeology 22(2):119-132.
Walker, Willard B.2004 Creek Confederacy before Removal. In Handbook of North American Indians,
Vol. 14: Southeast, edited by Raymond D. Fogelson, pp. 373–392 SmithsonianInstitution, Washington, D.C.
Webster, Gary S.1990 Labor Control and Emergent Stratification in Prehistoric European. Current
Anthropology 31:337-366.

174
Welch, Paul D.1990 Mississippian Emergence in West Central Alabama. In The Mississippian
Emergence, edited by Bruce D. Smith, pp. 197-225. Smithsonian Institution Press,Washington , D.C.
1991 Moundville’s Economy. University of Alabama Press, Tuscaloosa.
1996 Control over Goods and the Political Stability of the Moundville Chiefdom. InPolitical Structure and Change in the Prehistoric Southeastern United States,edited by John F. Scarry, pp. 69-91. University Press of Florida, Gainesville.
1998 Outlying Sites within the Moundville Chiefdom. In Archaeology of theMoundville Chiefdom, edited by Vernon J. Knight Jr., and Vincas P. Steponaitis, pp.133-166, Smithsonian Institution Press, Washington, D.C.
Welch, Paul D. and Brian M. Bulter.2006 Borne on a Litter with Much Prestige. In Leadership and Polity in
Mississippian Society. edited by Brian M. Butler and Paul D. Welch, pp. 1-18.Center for Archaeological Investigations Southern Illinois University CarbondaleOccasional Paper No. 33.
Welch, Paul D. and C. Margaret Scarry1995 Status-Related Variation in Foodways in the Moundville Chiefdom.
American Antiquity 60: 397-419.
White, Leslie1943 Energy and the Revolution of Culture. American Anthropologist 45: 335-356.
1949 The Science of Culture: A Study of Man and Civilization. Farrar, Straus, NewYork.
1959 The Evolution of Culture: The Development of Civilization to the Fall ofRome. McGraw-Hill Co., New York.
Williams, Mark and Gary Shapiro1996 Mississippian Political Dynamics in the Oconee Valley, Georgia. In Political
Structure and Change in the Prehistoric Southeastern United States, edited byJohn F. Scarry, pp. 128-149. University Press of Florida, Gainesville.
Williams, Stephen and Jeffrey P. Brain1983 Excavations at the Lake George Site, Yazoo County Mississippi, 1958-1960.
Papers of the Peabody Museum of Archaeology and Ethnology Vol. 74. HarvardUniversity, Cambridge.

175
Wilson, Gregory D.2008 The Archaeology of Everyday Life at Early Moundville. University of
Alabama Press, Tuscaloosa.
Young, Harold E.1954 Photogrammetric Volume Determination of Huge Pulpwood Piles.
Photogrammetric Engineering 20(5):808-813.
1955 Supplement to “Photogrammetric Volume Determinations of Hugh PulpwoodPiles.” Photogrammetric Engineering 21(1):146.

176
Level A (P low Zo ne)
10YR 4/4 S andy Loam
N 1931E 1 263 N 1931
E 1264
Level C (Humi c Zone )10YR 4/3 S ilty L oam
Level D (Mid den/Bur ied A Hor izo n)
10Y R4 /6 Silt y Cla yLevel E (St erile S ubs oil)
10Y R6/6 Sand y Clay
Level B (Art ificial F ill)10Y R5/7 S and y Cla y Loam
Appendix: Plaza Unit Artifacts
Unit N1930 E1263/Plaza Unit West of Mound F
Ceramics (Frequencies)
Lev
elA
-Plo
wZo
ne
Lev
elB
-Art
ifici
alFi
ll
Lev
elC
-Hum
icZ
one
Lev
elD
-Mid
den/
AH
oriz
on
Tot
al
TypeMississippi Plain 98 176 87 101 462Moundville Incised, var. Moundville 5 10 7 22Bell Plain 6 66 68 56 196Carthage Incised, var. Unspecified 3 3Moundville Engraved, var. Elliots Creek 14 24 38Moundville Engraved, var. Havana 1 1Moundville Engraved, var. Unspecified 3 30 33 66Baytown Plain, var. Roper 3 5 1 9Res. Fine Grog and Shell-Tempered Plain 4 1 1 7 13Res. Fine Grog and Shell-TemperedEngraved 1 2 3Res. Fine Grog and Shell-TemperedIncised 1 1Res. Fine Sand-Tempered Plain 1 1 2Res. Fine Sand and Shell-Tempered Plain 10 7 17Res. Fine Shell-Tempered Plain 1 3 4Res. Temperless Plain 3 3Total 112 275 213 240 840Diagnostic ModeFolded Jar Rim 2 2Folded-Flattened Jar Rim 1 1Total 1 2 3

177
Level A (P low Zo ne)10YR 4/4 S andy Loam
N 1931E 1 263 N 1931
E 1264
Level C (Humi c Zone )10YR 4/3 S ilty L oam
Level D (Mid den/Bur ied A Hor izo n)10Y R4 /6 Silt y Cla y
Level E (St erile S ubs oil)10Y R6/6 Sand y Clay
Level B (Art ificial F ill)10Y R5/7 S and y Cla y Loam
Unit N1930 E1263/Plaza Unit West of Mound F
Lithics, Unmodified Stone, and Other (Weight in grams)
Lev
elA
-Plo
wZ
one
Lev
elB
-Art
ific
ialF
ill
Lev
elC
-Hum
icZ
one
Lev
elD
-Mid
den/
AH
oriz
on
Tot
al
Flaked StoneFlake (Banger Chert) 0.3 0.3Flake (Ft. Payne Chert) 1.4 1.4Flake (Tuscaloosa Gravel Chert) 1.0 1.0Flake (Heat Treated Tuscaloosa GravelChert) 0.7 0.3 1.0
Shatter (Greenstone) 2.9 2.9Worked StonePitted Anvil Stone 569.6 569.6Saw (Hematitic Sandstone) 12.5 12.5Whetstone (Fine Grey MicaceousSandstone) 371.3 371.3
Unmodified StoneChert (Banger) 2.2 2.2Hematite (Pigment Quality) 14.0 14.0Mica 0.1 0.1Pebbles 405.8 1,316.7 165.4 124.1 2012.0Sandstone, Concretions 119.5 1,037.3 77.6 86.5 1,320.9Sandstone, Fine Grey Micaceous 19.7 53.3 18.5 91.5Sandstone, Hematitic 25.5 26.7 4.2 0.2 56.6Soapstone 0.4 0.4OtherBone 0.2 0.2Charcoal 0.1 1.1 0.7 1.9Daub 1.1 1.3 2.6 5.0Fired Clay 9.2 149.0 191.7 129.6 479.5Total 587.3 2,613.0 459.4 1,284.6 4,944.3

178
N 1760E 1295
N 1761E 1295
L evel A (Plow Zone)10YR 4/4SandyLoam
Levels B (Ar tific ialFill)7 .5YR 5/6SandyLoam
Level C (HumicZone)10Y R 4/4 Silty Loam
Level D (Buried A Horizon)10Y R 4/6 Silty Clay
Level E (SterileSubsoil)10Y R 5/8 Sandy Clay
Water-laidSediments
Unit N1760 E1294/Plaza Unit Southwest of Mound G
Ceramics (Frequencies)
Lev
elA
-Plo
wZ
one
Lev
elB
-Art
ifici
alFi
ll
Lev
elC
-Hum
icZ
one
Lev
elD
-Bur
ied
AH
oriz
on
Tot
al
TypeMississippi Plain 112 38 14 14 178Moundville Incised, var. Moundville 1 1Moundville Incised, var. Unspecified 1 1Bell Plain 26 8 34Carthage Incised, var. Unspecified 4 4Baytown Plain, var. Roper 3 3Res. Fine Grog and Shell-Tempered Plain 3 2 5Res. Fine Grog and Shell-Tempered Engraved 1 1Res. Fine Grog and Shell-Tempered BurnishedPlain 1 1Res. Sand and Shell-Tempered Plain 1 1Res. Fine Sand and Shell-Tempered Incised 1 1Res. Grit-Tempered Plain 3 3Res. Temperless Plain 2 1 3Total 153 50 18 15 236Diagnostic ModeBeaded Bowl Rim 1 1Short-neck Bowl Rim 1 1Folded Jar Rim 1 1Total 2 1 3

179
N 1760E 1295
N 1761E 1295
L evel A (Plow Zone)10YR 4/4SandyLoam
L evels B (Artific ial Fill)7.5YR 5/6Sandy Loam
L evel C (HumicZone)10YR 4/4Silty Loam
L evel D (Buried A Horizon)10YR 4/6Silty Clay
L evel E (Sterile Subsoil)10YR 5/8SandyC lay
Water-laid Sediments
Unit N1760 E1294/Plaza Unit Southwest of Mound G
Lithics, Unmodified Stone, and Other (Weight in Grams)
Lev
elA
-Plo
wZ
one
Lev
elB
-Art
ifici
alFi
ll
Lev
elC
-Hum
icZ
one
Lev
elD
-Bur
ied
AH
oriz
on
Tot
al
Flaked StoneFlake (Heat Treated Tuscaloosa GravelChert) 0.1 0.1
Worked StoneGround 35.2 35.2Saw (Hematitic Sandstone) 3.4 3.4Unmodified StoneMica 0.1 0.1Pebbles 144.3 127.4 89.6 253.9 615.2Sandstone, Concretions 104.9 133.1 327.9 331.9 897.8
Sandstone, Fine Grey Micaceous 3,222.2 54.8 3277.0
Sandstone, Hematitic 1.5 0.3 1.8OtherBone 0.1 0.1Charcoal 20.7 2.3 2.3 2.3 27.6Daub 11.1 11.1Fired Clay 1.0 9.9 10.9
Total 3,508.2 353.2 420.8 598.1 4,880.
3
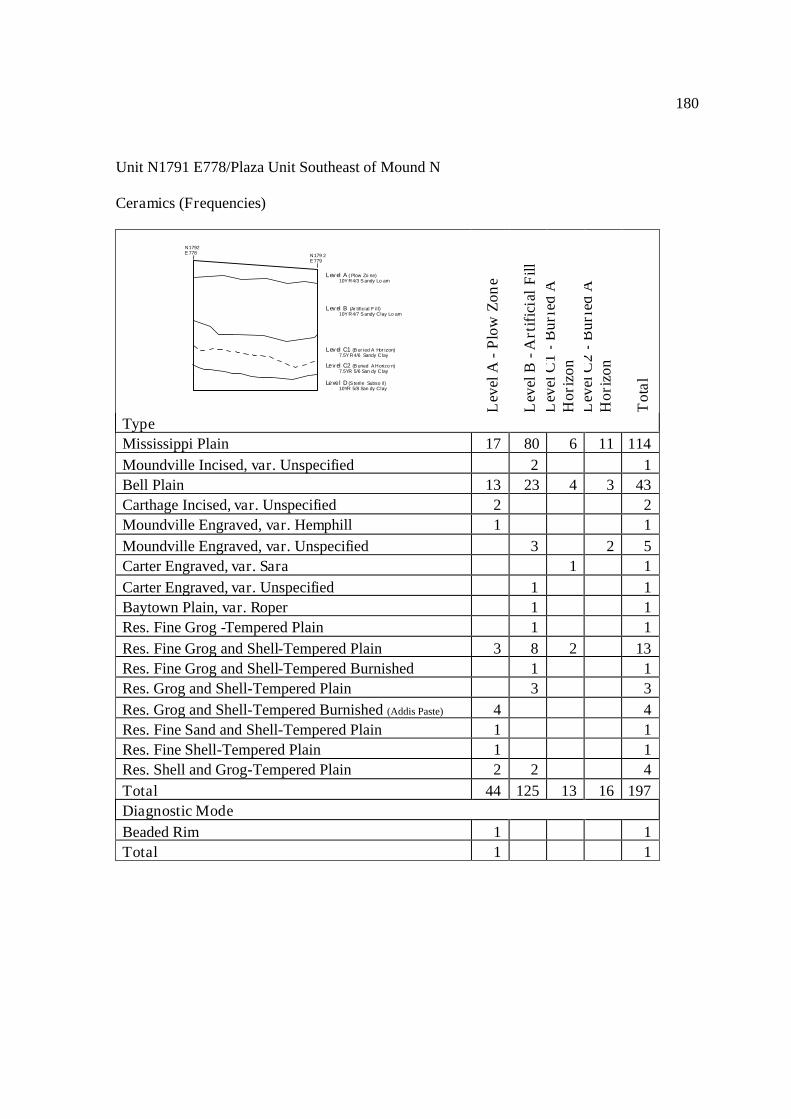
180
Unit N1791 E778/Plaza Unit Southeast of Mound N
Ceramics (Frequencies)
Lev
elA
-Plo
wZo
ne
Lev
elB
-Art
ifici
alFi
llL
evel
C1
-Bur
ied
AH
oriz
onL
evel
C2
-Bur
ied
AH
oriz
on
Tot
al
TypeMississippi Plain 17 80 6 11 114Moundville Incised, var. Unspecified 2 1Bell Plain 13 23 4 3 43Carthage Incised, var. Unspecified 2 2Moundville Engraved, var. Hemphill 1 1Moundville Engraved, var. Unspecified 3 2 5Carter Engraved, var. Sara 1 1Carter Engraved, var. Unspecified 1 1Baytown Plain, var. Roper 1 1Res. Fine Grog -Tempered Plain 1 1Res. Fine Grog and Shell-Tempered Plain 3 8 2 13Res. Fine Grog and Shell-Tempered Burnished 1 1Res. Grog and Shell-Tempered Plain 3 3Res. Grog and Shell-Tempered Burnished (Addis Paste) 4 4Res. Fine Sand and Shell-Tempered Plain 1 1Res. Fine Shell-Tempered Plain 1 1Res. Shell and Grog-Tempered Plain 2 2 4Total 44 125 13 16 197Diagnostic ModeBeaded Rim 1 1Total 1 1
Level A ( Plow Zo ne)10Y R4/3 S andy Lo am
N1792E 778 N179 2
E 779
Level B (Ar tificial F ill)10Y R4/7 S andy Clay Lo am
Level C1 (Bur ied A Hor izon)7.5Y R4/6 Sandy Clay
Level D (S terile Subso il)10YR 5/8 San dy Clay
Level C2 (Buried AHorizo n)7.5YR 5/6 San dy Clay

181
Unit N1791 E778/Plaza Unit Southeast of Mound N
Lithics, Unmodified Stone, and Other (Weight in Grams)
Lev
elA
-Plo
wZ
one
Lev
elB
-Art
ifici
alFi
ll
Lev
elC
1-B
urie
dA
Hor
izon
Lev
elC
2-B
urie
dA
Hor
izon
Feat
ure
1–
Pos
tHol
e
Tot
al
Flaked StoneFlake (Tuscaloosa Gravel Chert) 1.5 1.5Flake(Heat Treated TuscaloosaGravel Chert)
1.1 1.1
Unmodified StoneHematite (Pigment Quality) 1.5 1.5Pebbles 325.4 138.6 25.0 14.3 44.5 547.8Sandstone, Concretions 79.0 122.5 33.0 58.6 5.2 298.3Sandstone, Fine Grey Micaceous 82.1 42.6 39.7 164.4Sandstone, Hematitic 24.6 0.4 25OtherBone 1.6 0.6 2.2Charcoal 1.1 14.7 1.5 0.6 6.9 24.8
Daub 2,320.1
2,578.6
4,898.7
Fired Clay 33.7 10.6 4.7 0.8 49.8Historic Material 2.4 2.4Silica Froth 0.6 0.6
Total 550.4 2,651.8 64.6 74.3 2677.0 6018.1
Level A (Plo wZ one)10Y R4/3 S andy L oam
N17 92E 778 N 1792
E 779
Level B (Artificial F ill)10Y R4/ 7 Sandy Clay Lo am
Level C1 (Bur ied A Ho rizon)7.5Y R 4/6 Sand y Clay
Level D ( Ster ile Subs oil)10YR 5/8 S andy Clay
Level C2 (Buried AHori zo n)7.5YR 5/6 S andy Clay

182
Unit N1891 E 776/Plaza Unit East of Mound O
Ceramics (Frequencies)
Lev
elA
-Plo
wZ
one
Lev
elB
-Art
ifici
alFi
llL
evel
C-H
umic
Zon
e/M
idde
n
Lev
elD
-Bur
ied
AH
oriz
on
Tot
al
TypeMississippi Plain 175 75 45 89 384Moundville Incised, var. Unspecified 1 1Bell Plain 18 9 7 6 40Carthage Incised, var. Unspecified 4 1 5Moundville Engraved, var. Unspecified 1 1Baytown Plain, var. Roper 1Res. Fine Grog -Tempered Plain 5 1 6Res. Fine Grog and Shell-Tempered Plain 12Res. Fine Grog and Shell-Tempered Burnished 5Res. Sand/Grit Tempered Plain 1 1Res. Fine Sand and Shell-Tempered Plain 1 1Res. Fine Shell-Tempered Plain 1 2 1 4Res. Shell and Grog-Tempered Plain 1Total 223 88 54 97 443Diagnostic ModeFolded Jar Rim 1 1Total 1 1
N 1892E 776 N 1931
E 1264
Level A (Plo w Zon e)10YR4 /3 San dy Lo am
Level B (Art ificial F ill)1 0YR 5/4 Sandy Clay L oam
Level C (Humi c Zone /Midden )10YR 4/4 Si lty Lo am
Level D (Bur ied A Hori zo n)10YR 4/6 Sandy Clay L oam
Level E ( Ster ile Subso il)10YR5 /8 San dy Clay

183
Unit N1891 E 776/Plaza Unit East of Mound O
Lithics, Unmodified Stone, and Other (Weight in Grams)
Lev
elA
-Plo
wZ
one
Lev
elB
-Art
ifici
alFi
ll
Lev
elC
-Hum
icZ
one/
Mid
den
Lev
elD
-Bur
ied
AH
oriz
on
Tot
al
Flaked StoneFlake (Ft. Payne Chert) 0.9 0.9Flake (Tuscaloosa Gravel Chert) 1.4 1.4Scraper (Ft. Payne Chert) 2.6 2.6Unmodified StoneHematite (Pigment Quality) 4.8 4.8Pebbles 372.3 229.4 124.1 65.8 791.6Sandstone, Concretions 277.2 1,194.3 252.3 187.1Sandstone Conglomerate 21.0 21.0Sandstone, Fine Grey Micaceous 158.5 5.0 163.5Sandstone, Hematitic 2.7 0.7 3.4OtherBone 0.8 0.2 1.0Charcoal 0.6 0.8 0.7 2.1Clay Disk (Molded) 5.7 5.7Daub 30.0 30.0Fired Clay 138.0 56.0 104.4 164.9Historic Material 2.0 2.0Silica Froth 0.5 0.5Total 961.8 1,501.9 492.3 448.7 3,404.7
N 1892E 776 N 1931
E 1264
Level A (P low Zo ne)10YR 4/3 Sa ndy L oam
Level B ( Ar tificial F ill)10YR 5/4 Sandy Clay Loam
Level C (Hum ic Zon e/Midd en)10YR 4/4 S ilty Lo am
Level D ( Bu ried A Hor izon)10YR 4/6 Sand y Cl ay Loam
Level E (St erile Subs oil)10YR 5/8 Sa ndy Clay
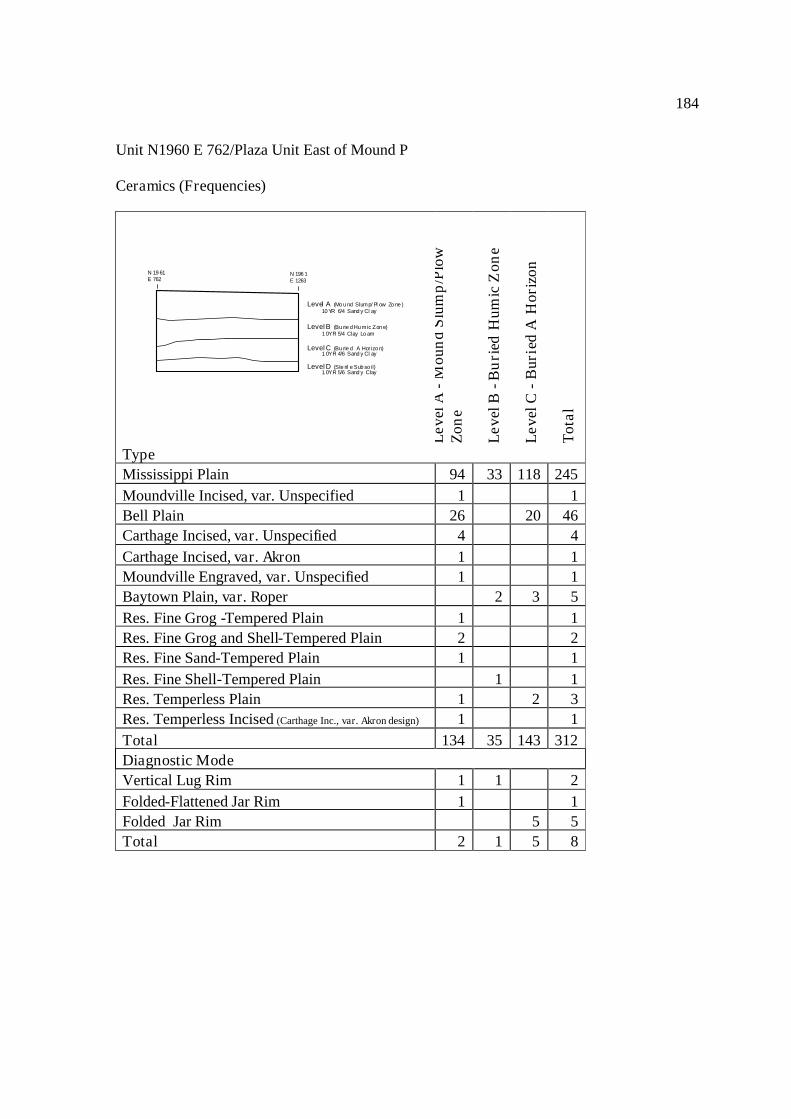
184
Unit N1960 E 762/Plaza Unit East of Mound P
Ceramics (Frequencies)
Leve
lA-M
ound
Slum
p/Pl
owZo
ne
Leve
lB-B
urie
dH
umic
Zon
e
Leve
lC-B
urie
dA
Hor
izon
Tota
l
TypeMississippi Plain 94 33 118 245Moundville Incised, var. Unspecified 1 1Bell Plain 26 20 46Carthage Incised, var. Unspecified 4 4Carthage Incised, var. Akron 1 1Moundville Engraved, var. Unspecified 1 1Baytown Plain, var. Roper 2 3 5Res. Fine Grog -Tempered Plain 1 1Res. Fine Grog and Shell-Tempered Plain 2 2Res. Fine Sand-Tempered Plain 1 1Res. Fine Shell-Tempered Plain 1 1Res. Temperless Plain 1 2 3Res. Temperless Incised (Carthage Inc., var. Akron design) 1 1Total 134 35 143 312Diagnostic ModeVertical Lug Rim 1 1 2Folded-Flattened Jar Rim 1 1Folded Jar Rim 5 5Total 2 1 5 8
Level A (Mound Slump/ Pl ow Zone )10 YR 6/4 Sandy Cl ay
N 19 61E 762
N 196 1E 1263
LevelB (Burie dHumic Zone)1 0YR 5/4 Clay Loam
LevelC (Burie d A Horizon)1 0YR 4/6 Sandy Cl ay
LevelD (Ste ril e Subsoil)1 0YR 5/6 Sandy Clay

185
Unit N1960 E 762/Plaza Unit East of Mound P
Lithics, Unmodified Stone, and Other (Weight in Grams)
Leve
lA-M
ound
Slum
p/Pl
owZo
ne
Leve
lB-B
urie
dH
umic
Zon
e
Leve
lC-B
urie
dA
Hor
izon
Tota
l
Flaked StoneFlake (Heat Treated Tuscaloosa Gravel Chert) 3.3 1.2 0.2 4.7Shatter (Ft. Payne Chert) 9.3 9.3Shatter (Tuscaloosa Gravel Chert) 7.6 7.6Shatter (Heat Treated Tuscaloosa Gravel Chert) 5.2 2.5 7.7Unmodified StoneHematite (Pigment Quality) 1.9 1.9Historic Material 4.6 4.6Pebbles 259.1 75.8 36.6 371.5Sandstone, Concretions 158.9 348.1 228.3 735.3Sandstone, Fine Grey Micaceous 54.2 2.2 12.8 69.2Sandstone, Hematitic 89.8 89.8Unidentified Metaphoric 139.9 139.9OtherBone 0.6 0.5 1.1Charcoal 1.6 1.3 0.4 1.3Daub 38.9 38.9Fired Clay 138.6 219.7 137.9 496.1Historic Material 4.6 4.6
Total 879.2 689.7 416.71,985.
6
Level A (Mound Slump/ Pl ow Zone )10 YR 6/4 Sandy Cl ay
N 19 61E 762
N 196 1E 1263
LevelB (Burie dHumic Zone)1 0YR 5/4 Clay Loam
LevelC (Burie d A Horizon)1 0YR 4/6 Sandy Cl ay
LevelD (Ste ril e Subsoil)1 0YR 5/6 Sandy Clay

186
Unit N2021 E784/Plaza Unit Northeast of Mound P
Ceramics (Frequencies)
Lev
elA
-Plo
wZ
one
Lev
elB
-AH
oriz
on
Tot
al
TypeMississippi Plain 88 27 115Bell Plain 16 1 17Carthage Incised, var. Unspecified 1 1Carthage Incised, var. Akron 1 1Moundville Engraved, var. Havana 1 1Moundville Engraved, var. Taylorville 2 2Baytown Plain, var. Roper 1 1Res. Fine Grog -Tempered Plain 6 6Res. Fine Shell and Grog-Tempered Plain 5 5Res. Fine Grog and Shell-Tempered Engraved (Addis Paste) 1 1Total 120 30 150Diagnostic ModeBeaded Bowl Rim 1 1Total 1 1
Level A (Plow Zone)10YR 3/4 Sandy Cl ay
N 2022E 784 N 2022
E 785
Le vel B (A Horiz on)10YR 4/6 SandyC layLoam
Level C (Sterile Subsoil)5YR 4/6 Sandy Clay

187
Unit N2021 E784/Plaza Unit Northeast of Mound P
Lithics, Unmodified Stone, and Other (Weight in Grams)
Lev
elA
-Plo
wZ
one
Lev
elB
-AH
oriz
on
Tot
al
Flaked StoneFlake (Tuscaloosa Gravel Chert) 3.8 3.8Flake (Heat Treated Tuscaloosa Gravel Chert) 0.1 0.1Flake (Identified Chert) 1.2 1.2Shatter (Banger Chert) 0.5 0.5Shatter (Tallahatta Quartzite) 11.9 11.9Unmodified StonePebbles 258.0 82.5 340.5Sandstone, Concretions 5.5 5.5Sandstone, Fine Grey Micaceous 268.2 49.6 317.8Sandstone, Hematitic 8.1 12.5 20.6OtherBone 0.6 0.6Charcoal 0.5 0.5Fired Clay 155.2 70.4 225.6Historic Material 13.2 13.2Total 720.6 221.6 941.8
Level A (P lowZone)10YR 3/4 Sandy Cl ay
N 2022E 784 N 2022
E 785
Le vel B (A Horiz on)10YR 4/6 SandyC layLoam
Level C (S teri le Subsoil)5YR 4/ 6 Sandy Clay


