Lakshmi N Mittal, Chairman and Chief Executive Officer...
39
1Q 2015 Results 7 May 2015 Lakshmi N Mittal, Chairman and Chief Executive Officer Aditya Mittal, Chief Financial Officer
Transcript of Lakshmi N Mittal, Chairman and Chief Executive Officer...

1Q 2015 Results
7 May 2015
Lakshmi N Mittal, Chairman and Chief Executive Officer
Aditya Mittal, Chief Financial Officer

Disclaimer
Forward-Looking Statements
This document may contain forward-looking information and statements about ArcelorMittal and its
subsidiaries. These statements include financial projections and estimates and their underlying
assumptions, statements regarding plans, objectives and expectations with respect to future operations,
products and services, and statements regarding future performance. Forward-looking statements may be
identified by the words “believe,” “expect,” “anticipate,” “target” or similar expressions. Although
ArcelorMittal’s management believes that the expectations reflected in such forward-looking statements
are reasonable, investors and holders of ArcelorMittal’s securities are cautioned that forward-looking
information and statements are subject to numerous risks and uncertainties, many of which are difficult to
predict and generally beyond the control of ArcelorMittal, that could cause actual results and
developments to differ materially and adversely from those expressed in, or implied or projected by, the
forward-looking information and statements. These risks and uncertainties include those discussed or
identified in the filings with the Luxembourg Stock Market Authority for the Financial Markets (Commission
de Surveillance du Secteur Financier) and the United States Securities and Exchange Commission (the
“SEC”) made or to be made by ArcelorMittal, including ArcelorMittal’s Annual Report on Form 20-F for the
year ended December 31, 2014 filed with the SEC. ArcelorMittal undertakes no obligation to publicly
update its forward-looking statements, whether as a result of new information, future events, or otherwise.
1

Agenda
• Results overview and market outlook
• Results analysis
• Outlook and guidance
2

0.880.850.85
2014 2013 2012
1.0
2011
1.4
2010
1.8
2009
1.9
2008
2.5
2007
3.1
1Q’15
3
Health & Safety Lost time injury frequency (LTIF) rate*
Mining & steel, employees and contractors
* LTIF = Lost time injury frequency defined as Lost Time Injuries per 1.000.000 worked hours; based on own personnel and contractors
Safety focus
Our goal is to be the safest Metals & Mining company
Health and safety performance
• Safety: LTIF rate of 0.88x in 1Q’15 vs 0.89x in
4Q’14 and 0.85x in 1Q’14
• The Company’s effort to improve the Group’s
Health and Safety record will continue
• The Company is focused on further reducing the
rate of severe injuries and fatality prevention

4
• 1Q’15 EBITDA of $1.4bn (includes $0.1bn onerous contracts)*
• Ex-Mining Segment, Underlying EBITDA stable YoY*
• Steel shipments +3.0% YoY
• Own iron ore production +5% YoY
• Iron ore unit cash costs down 13% YoY
• FY’15 capex expectation lowered to approx. $3.0bn
• Net debt at end of 1Q’15 of $16.6bn, compared to $18.5bn at end of 1Q’14
EBITDA impacted by lower iron ore prices; Steel-only margins stable YoY
* Underlying basis; EBITDA in 1Q’15 includes the negative impact a $69m provision related to onerous hot rolled and cold rolled contracts in the US. 4Q’14 includes a $76m provision related to onerous
annual tin plate contracts at Weirton in the US, offset by the $79m gain on disposal of Kuzbass coal mines in Russia. 2Q’14 includes the negative impact of $90m following the settlement of US antitrust
litigation
Lower mining, stable steel performance
(USDm) unless otherwise shown 1Q'15* 4Q'14* 3Q'14 2Q'14* 1Q'14
Iron ore shipments at market price (Mt) 9.4 9.9 10.0 10.5 9.3
Steel Shipments (Mt) 21.6 21.2 21.5 21.5 21.0
Sales 17,118 18,723 20,067 20,704 19,788
EBITDA 1,378 1,815 1,905 1,763 1,754
Net income / (loss) (728) (955) 22 52 (205)

5
Despite EUR translation headwind, Ex-Mining profitability stable YoY
Stable steel performance offset by weaker
mining performance
114
433
0
200
400
600
-73.8%
1Q’15 1Q’14
Underlying* steel-only EBITDA $m
1,340
1,330
0
1,335
1,325
1,333
0.9%
1Q’15 1Q’14
1,321
Mining EBITDA $m
* Underlying basis; EBITDA in 1Q’15 includes the negative impact a $69m provision related to onerous hot rolled and cold rolled contracts in the US. 4Q’14 includes a $76m provision related to onerous
annual tin plate contracts at Weirton in the US, offset by the $79m gain on disposal of Kuzbass coal mines in Russia. 2Q’14 includes the negative impact of $90m following the settlement of US antitrust
litigation
• Ex-Mining segment, EBITDA stable YoY
Good progress in Europe reflecting improved
market fundamentals and results of cost
optimization
Ongoing evidence of turnaround in ACIS
Brazil impacted by weak domestic demand,
somewhat offset by slab exports
NAFTA performance significantly impacted by
weak demand and low prices due to inventory
destock following period of exceptional imports
• Mining segment result impacted by 48% drop in
iron ore price partially offset by improved costs
6
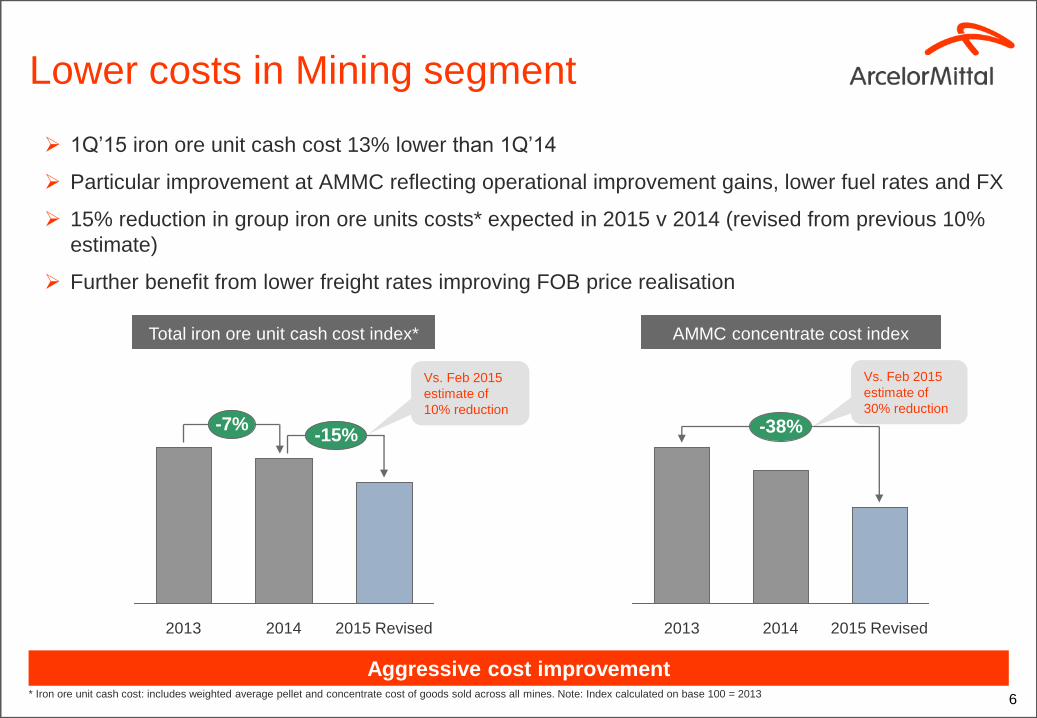
Lower costs in Mining segment
1Q’15 iron ore unit cash cost 13% lower than 1Q’14
Particular improvement at AMMC reflecting operational improvement gains, lower fuel rates and FX
15% reduction in group iron ore units costs* expected in 2015 v 2014 (revised from previous 10%
estimate)
Further benefit from lower freight rates improving FOB price realisation
Aggressive cost improvement
-38%
2015 Revised 2014 2013
* Iron ore unit cash cost: includes weighted average pellet and concentrate cost of goods sold across all mines. Note: Index calculated on base 100 = 2013
Total iron ore unit cash cost index*
-7% -15%
2015 Revised 2014 2013
Vs. Feb 2015
estimate of
30% reduction
Vs. Feb 2015
estimate of
10% reduction
AMMC concentrate cost index

Flexible capex plans; FY’15 capex ~18% lower than FY’14
Flexible capital allocation
• FY’15 capex reduced further to approx
$3bn reflecting forex and project
postponements
• FY’15 capex estimate ~18% lower than
2014 levels
• Growth capex continues to decline with
lower Mining spend
Capex discipline – lower spend in 2015
7
Capex split ($ billions)
3.32.9
2.42.8
1.61.8
1.10.9
2013
3.5
2012
4.7
2011
4.9
3.0 -18%
Revised
2015F
2014
3.7
Maintenance
Growth

8
• Global manufacturing output continues to expand,
albeit more slowly; ArcelorMittal PMI down to 51.7 in
Mar’15
• United States: consumers and auto supported by
lower oil prices; but manufacturing growth slowing
impacted by strength of US$ and reduced energy
sector capex
• European growth gradually accelerating, with PMI’s
improving on QE, the weak euro, low oil prices and
rising employment helping retail sales expand at their
fastest pace in over a decade
• China’s slowdown continues, prompting further
government support for the property market and
lower interest rates and bank reserve requirements to
stimulate the economy
• The outlook for Brazil continues to weaken, with PMI
clearly indicating contraction as the economy re-
enters recession exacerbated by government cuts
and fallout from the Petrobas investigation.
Global indicators remain positive
Source: *Markit. ArcelorMittal estimates; ArcelorMittal PMIs (weighted by ArcelorMittal steel deliveries)
Aggregate global demand indicator remains in positive territory
(latest data point: Mar’15: 51.7)

9
Global apparent steel consumption (ASC) 2015 v 2014*
* ArcelorMittal estimates
Global +0.5% to +1.5%
CIS -5% to -7%
Brazil -5% to -7%
China +0.5% to +1.5%
EU28 +1.5% to +2.5%
US -2% to -3%
Global ASC growth of circa +0.5% to +1.5% forecast in 2015
2015 outlook
ArcelorMittal steel shipments (Mt)
+3%
1Q’15
21.6
1Q’14
21.0
~50% of shipment
increase follows
Newcastle BF reline and
full year impact of the
restart of BF#3 in
Tubarao, Brazil
+3-5%
FY’14 FY’15F
85.1

Financial results

11 * Includes a $76m provision related to onerous annual tin plate contracts at Weirton in the US offset by the $79m gain on disposal of Kuzbass coal mines in Russia ** Includes translation losses on
foreign exchange *** Includes the negative impact a $69m provision related to onerous hot rolled and cold rolled contracts in the US.
EBITDA bridge from 4Q’14 to 1Q’15
($ million)
165
1Q’15
EBITDA
1,378
1,447
Underlying
1Q’15
EBITDA
(69)
Non-
recurring***
Forex and
others**
(125)
Price /
Cost -
Mining
(31)
Volume
& Mix -
Mining
(9)
Price /
Cost -
Steel
(365)
Volume &
Mix - Steel
Underlying
4Q’14
EBITDA
1,812
Non-
recurring*
(3)
4Q’14
EBITDA
1,815
Underlying EBITDA declined 20.1% in 1Q’15 vs. 4Q’14
Mining impact Steel impact
12
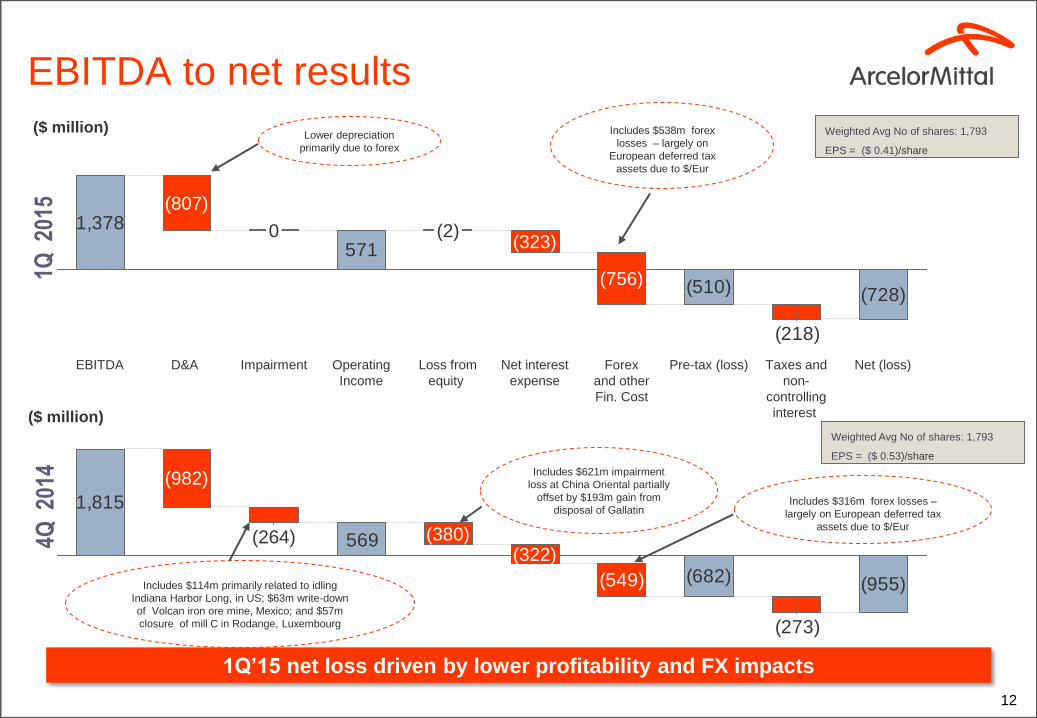
EBITDA to net results
1Q’15 net loss driven by lower profitability and FX impacts
Lower depreciation
primarily due to forex
1,378
571
(510) (728)
(218)
(323)
Loss from
equity
(2)
Operating
Income
Impairment
0
D&A
(807)
EBITDA Net (loss) Taxes and
non-
controlling
interest
Pre-tax (loss) Forex
and other
Fin. Cost
(756)
Net interest
expense
1Q 2
015
Weighted Avg No of shares: 1,793
EPS = ($ 0.41)/share
($ million) Includes $538m forex
losses – largely on
European deferred tax
assets due to $/Eur
Includes $114m primarily related to idling
Indiana Harbor Long, in US; $63m write-down
of Volcan iron ore mine, Mexico; and $57m
closure of mill C in Rodange, Luxembourg
1,815
(682) (955)
(273)
569
(549)
(322) (380) (264)
(982)
4Q 2
014
Weighted Avg No of shares: 1,793
EPS = ($ 0.53)/share
Includes $621m impairment
loss at China Oriental partially
offset by $193m gain from
disposal of Gallatin
($ million)
Includes $316m forex losses –
largely on European deferred tax
assets due to $/Eur
13
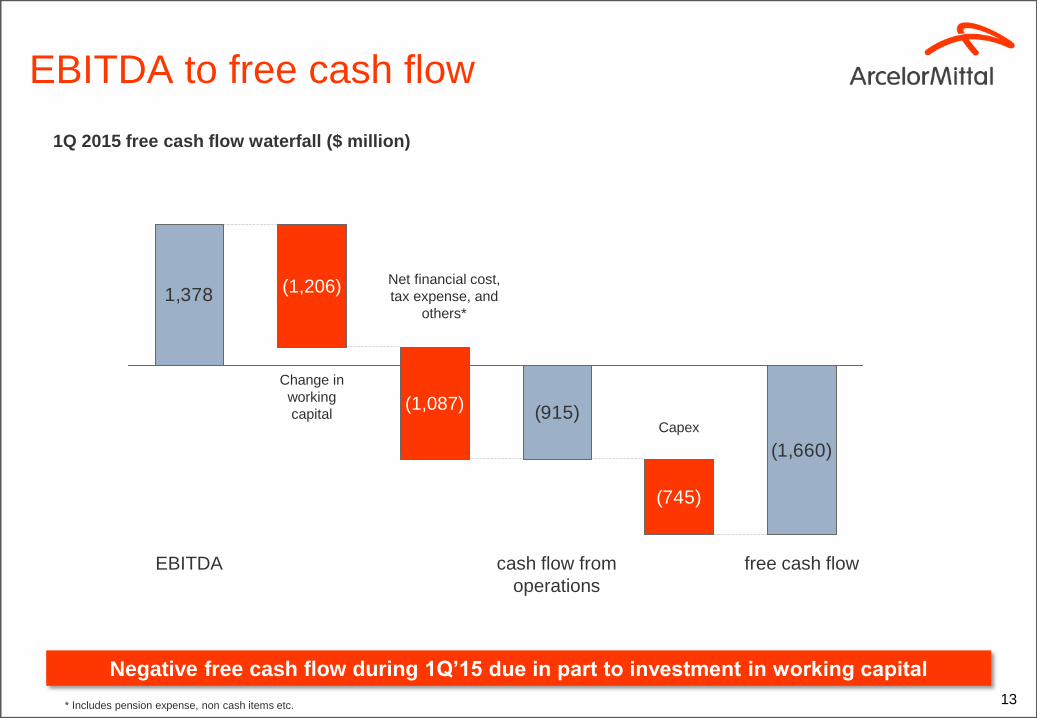
EBITDA to free cash flow
1Q 2015 free cash flow waterfall ($ million)
1,378
(915)
(1,660)
(745)
(1,087)
(1,206)
EBITDA cash flow from
operations
free cash flow
Change in
working
capital
Net financial cost,
tax expense, and
others*
Capex
* Includes pension expense, non cash items etc.
Negative free cash flow during 1Q’15 due in part to investment in working capital

Cash flow performance and liquidity
14
Recovering the investment grade credit rating remains a strategic priority
• Seasonal net debt increase in 1Q’15 due to investment
in working capital
• Net debt $1.9bn lower than 12 months ago
• Net debt benefiting from lower interest expenses, capex
reductions and working capital focus
* Net debt refers to long-term debt, plus short term debt, less cash and cash equivalents, restricted cash and short-term investments (including those held as part of asset/liabilities held for sale);
** LTM: refers to last twelve months.
-10%
Medium
term target
15.0
1Q 15
16.6
1Q 14
18.5
Net debt* progress ($bn)
• $6bn lines of credit refinanced and extended in April; two tranches:
• $2.5bn matures April 2018
• $3.5bn matures April 2020
• Covenant of Net Debt / LTM** EBITDA of 4.25x
• Average debt maturity 6.4 Yrs
6.0
2.8Cash
Bank lines
At March 31, 2015
8.8
Strong liquidity ($bn)

15
Outlook and guidance
• Whilst steel markets have evolved largely as per expectations, the subsequent deterioration
of iron ore prices as well as a weaker U.S. market results in a headwind to guidance.
Although the Company expects to benefit from further improvement in costs, both in mining
and steel segments (including lower raw material costs), the Company now expects 2015
EBITDA within the range of $6.0 - $7.0 billion.
• Due to the benefits of foreign exchange as well as the postponement of some investment
projects the Company has further reduced the FY 2015 capital expenditure budget to
approximately $3.0 billion.
• The Company expects net interest expense of approximately $1.4 billion in 2015.
• Importantly, the Company continues to expect positive free cash flow in 2015 and to achieve
progress towards the medium term net debt target of $15 billion.
The Company now expects 2015 EBITDA within the range of $6.0 - $7.0 billion

Appendix
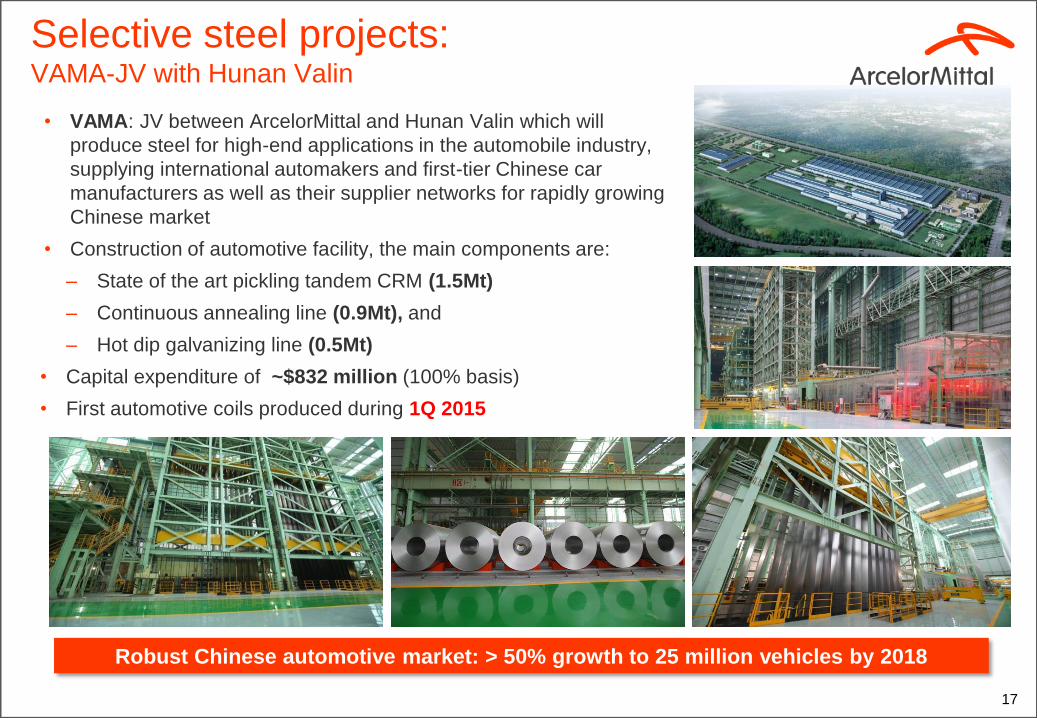
Selective steel projects: VAMA-JV with Hunan Valin
• VAMA: JV between ArcelorMittal and Hunan Valin which will
produce steel for high-end applications in the automobile industry,
supplying international automakers and first-tier Chinese car
manufacturers as well as their supplier networks for rapidly growing
Chinese market
• Construction of automotive facility, the main components are:
– State of the art pickling tandem CRM (1.5Mt)
– Continuous annealing line (0.9Mt), and
– Hot dip galvanizing line (0.5Mt)
• Capital expenditure of ~$832 million (100% basis)
• First automotive coils produced during 1Q 2015
17 17
Robust Chinese automotive market: > 50% growth to 25 million vehicles by 2018
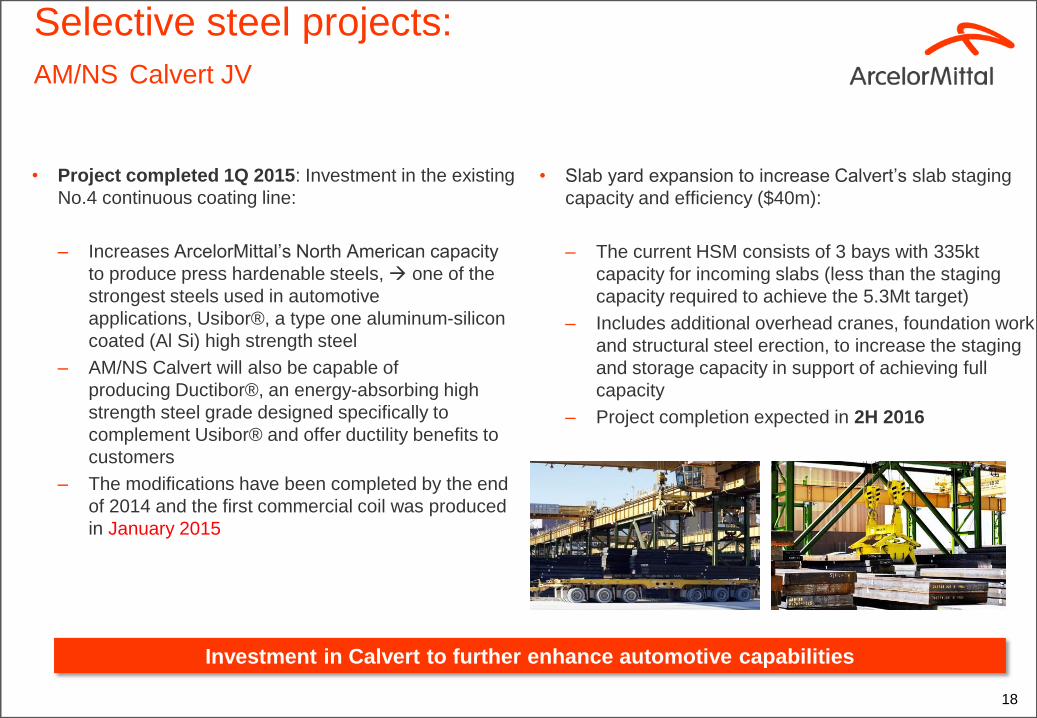
Selective steel projects:
AM/NS Calvert JV
• Slab yard expansion to increase Calvert’s slab staging
capacity and efficiency ($40m):
– The current HSM consists of 3 bays with 335kt
capacity for incoming slabs (less than the staging
capacity required to achieve the 5.3Mt target)
– Includes additional overhead cranes, foundation work
and structural steel erection, to increase the staging
and storage capacity in support of achieving full
capacity
– Project completion expected in 2H 2016
• Project completed 1Q 2015: Investment in the existing
No.4 continuous coating line:
– Increases ArcelorMittal’s North American capacity
to produce press hardenable steels, one of the
strongest steels used in automotive
applications, Usibor®, a type one aluminum-silicon
coated (Al Si) high strength steel
– AM/NS Calvert will also be capable of
producing Ductibor®, an energy-absorbing high
strength steel grade designed specifically to
complement Usibor® and offer ductility benefits to
customers
– The modifications have been completed by the end
of 2014 and the first commercial coil was produced
in January 2015
18 18
Investment in Calvert to further enhance automotive capabilities

Monlevade expansion project in Brazil restarted:
Phase 1 (approved) focuses on downstream facilities and consists of:
– A new wire rod mill in Monlevade with additional capacity of 1,050ktpy of
coils with capex estimate of $280 million (expected completion 2015)
– Juiz de Fora rebar capacity increase from 50 to 400ktpy (replacing some
wire rod production capacity) Completed 1Q 2015
– Juiz de Fora meltshop capacity increase by 200ktpy (expected
completion 2016)
Phase 2 (pending): A decision to invest in the upstream facilities in Monlevade
(sinter plant, blast furnace and meltshop), will be taken at a later date
19
Selective steel projects: Monlevade (Brazil segment)
Expansion supported by improved market for long products in Brazil
Vertical stands Hangar of the rolling mill # 3
Intermediate mill
Wire rod mill
Billet charging table
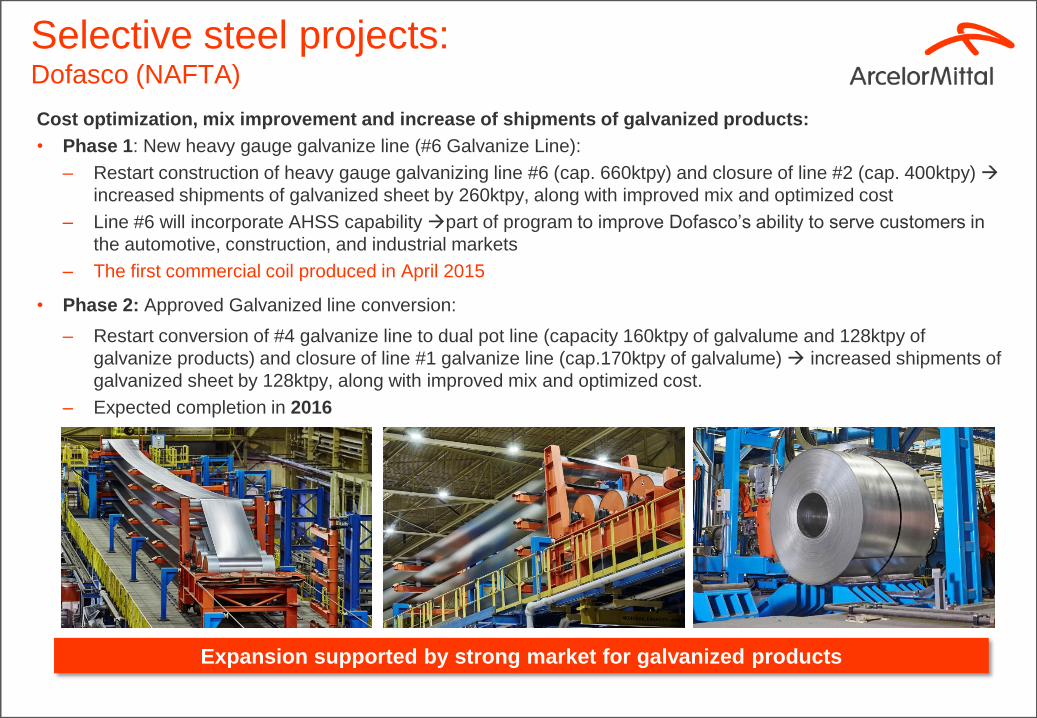
Selective steel projects: Dofasco (NAFTA)
Cost optimization, mix improvement and increase of shipments of galvanized products:
• Phase 1: New heavy gauge galvanize line (#6 Galvanize Line):
– Restart construction of heavy gauge galvanizing line #6 (cap. 660ktpy) and closure of line #2 (cap. 400ktpy)
increased shipments of galvanized sheet by 260ktpy, along with improved mix and optimized cost
– Line #6 will incorporate AHSS capability part of program to improve Dofasco’s ability to serve customers in
the automotive, construction, and industrial markets
– The first commercial coil produced in April 2015
• Phase 2: Approved Galvanized line conversion:
– Restart conversion of #4 galvanize line to dual pot line (capacity 160ktpy of galvalume and 128ktpy of
galvanize products) and closure of line #1 galvanize line (cap.170ktpy of galvalume) increased shipments of
galvanized sheet by 128ktpy, along with improved mix and optimized cost.
– Expected completion in 2016
20
Expansion supported by strong market for galvanized products
Temper mill
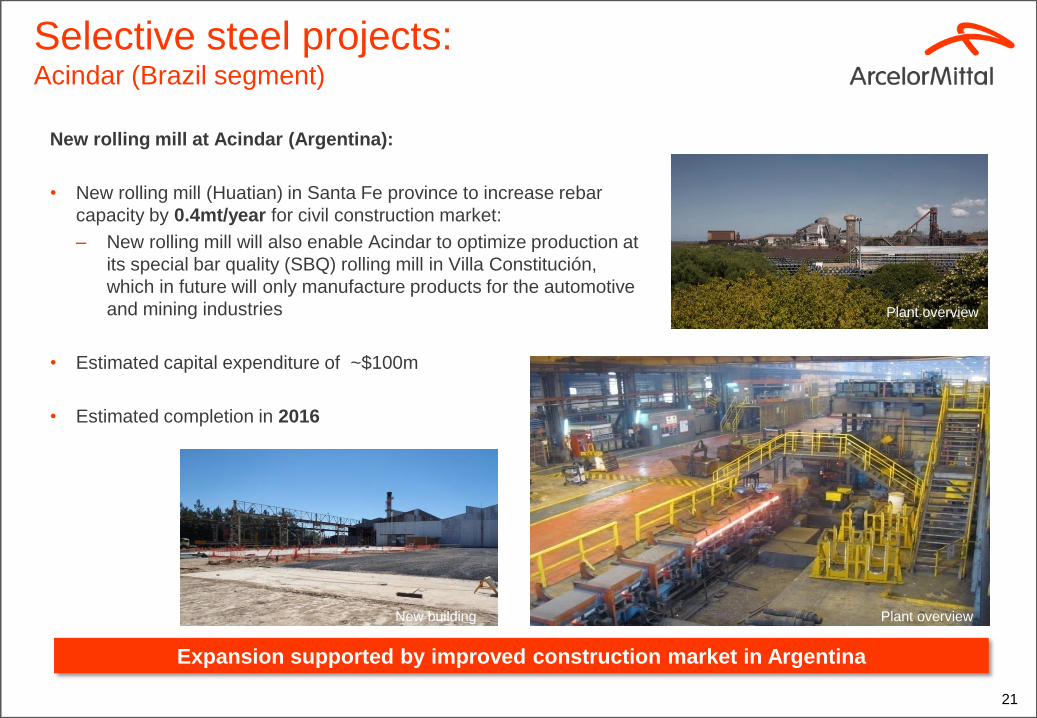
New rolling mill at Acindar (Argentina):
• New rolling mill (Huatian) in Santa Fe province to increase rebar
capacity by 0.4mt/year for civil construction market:
– New rolling mill will also enable Acindar to optimize production at
its special bar quality (SBQ) rolling mill in Villa Constitución,
which in future will only manufacture products for the automotive
and mining industries
• Estimated capital expenditure of ~$100m
• Estimated completion in 2016
21 21
Selective steel projects: Acindar (Brazil segment)
Expansion supported by improved construction market in Argentina
New building
Plant overview
Plant overview

3
5
7
9
11
13
15
17
19
Ja
n-0
7
Ma
y-0
7
Se
p-0
7
Jan-0
8
Ma
y-0
8
Se
p-0
8
Ja
n-0
9
Ma
y-0
9
Se
p-0
9
Ja
n-1
0
Ma
y-1
0
Se
p-1
0
Ja
n-1
1
Ma
y-1
1
Se
p-1
1
Ja
n-1
2
Ma
y-1
2
Se
p-1
2
Ja
n-1
3
Ma
y-1
3
Se
p-1
3
Ja
n-1
4
Ma
y-1
4
Se
p-1
4
Ja
n-1
5
EU28
USA
15
25
35
45
55
65
Jan-0
7
Ma
y-0
7
Sep-0
7
Jan-0
8
Ma
y-0
8
Sep-0
8
Jan-0
9
Ma
y-0
9
Sep-0
9
Jan-1
0
Ma
y-1
0
Sep-1
0
Jan-1
1
Ma
y-1
1
Sep-1
1
Jan-1
2
Ma
y-1
2
Sep-1
2
Jan-1
3
Ma
y-1
3
Sep-1
3
Jan-1
4
Ma
y-1
4
Sep-1
4
Jan-1
5
Developing ex ChinaChinaDeveloped
22
Continued growth in developed markets
Global apparent steel consumption (ASC)*
(million tonnes per month) US and European apparent steel consumption (ASC)**
(million tonnes per month)
* ArcelorMittal estimates; ** AISI, Eurofer and ArcelorMittal estimates
• China ASC +1.2% in 1Q’15 vs. 4Q’14
• China ASC -4.8% in 1Q’15 vs. 1Q’14 • EU28 ASC +12.3% in 1Q’15 vs. 4Q’14
• EU28 ASC -1.3% in 1Q’15 vs. 1Q’14
• Global ASC +0.3% in 1Q’15 vs. 4Q’14
• Global ASC -1.4% in 1Q’15 vs. 1Q’14
• US ASC -6.1% in 1Q’15 vs. 4Q’14
• US ASC +2.1% in 1Q’15 vs. 1Q’14
1Q’15 growth still positive YoY in US, largely stable in EU28 and declining in China
(latest data point: Mar’15) (latest data point:Mar‘15)
200
250
300
350
400
450
500
550
600
650
700
750
Jan-0
2
Jul-0
2
Jan-0
3
Jul-0
3
Jan-0
4
Jul-0
4
Jan-0
5
Jul-0
5
Jan-0
6
Jul-0
6
Jan-0
7
Jul-0
7
Jan-0
8
Jul-0
8
Jan-0
9
Jul-0
9
Jan-1
0
Jul-1
0
Jan-1
1
Jul-1
1
Jan-1
2
Jul-1
2
Jan-1
3
Jul-1
3
Jan-1
4
Jul-1
4
Jan-1
5
Residential
Non-residential
Exp
an
sio
nC
on
tra
ctio
n
30
35
40
45
50
55
60
65
Ja
n-0
6A
pr-
06
Ju
l-0
6O
ct-
06
Ja
n-0
7A
pr-
07
Ju
l-0
7O
ct-
07
Ja
n-0
8A
pr-
08
Ju
l-0
8O
ct-
08
Ja
n-0
9A
pr-
09
Ju
l-0
9O
ct-
09
Ja
n-1
0A
pr-
10
Ju
l-1
0O
ct-
10
Ja
n-1
1A
pr-
11
Ju
l-1
1O
ct-
11
Ja
n-1
2A
pr-
12
Ju
l-1
2O
ct-
12
Ja
n-1
3A
pr-
13
Ju
l-1
3O
ct-
13
Ja
n-1
4A
pr-
14
Ju
l-1
4O
ct-
14
Ja
n-1
5
Eurozone construction PMIUSA Architectural Billings Index
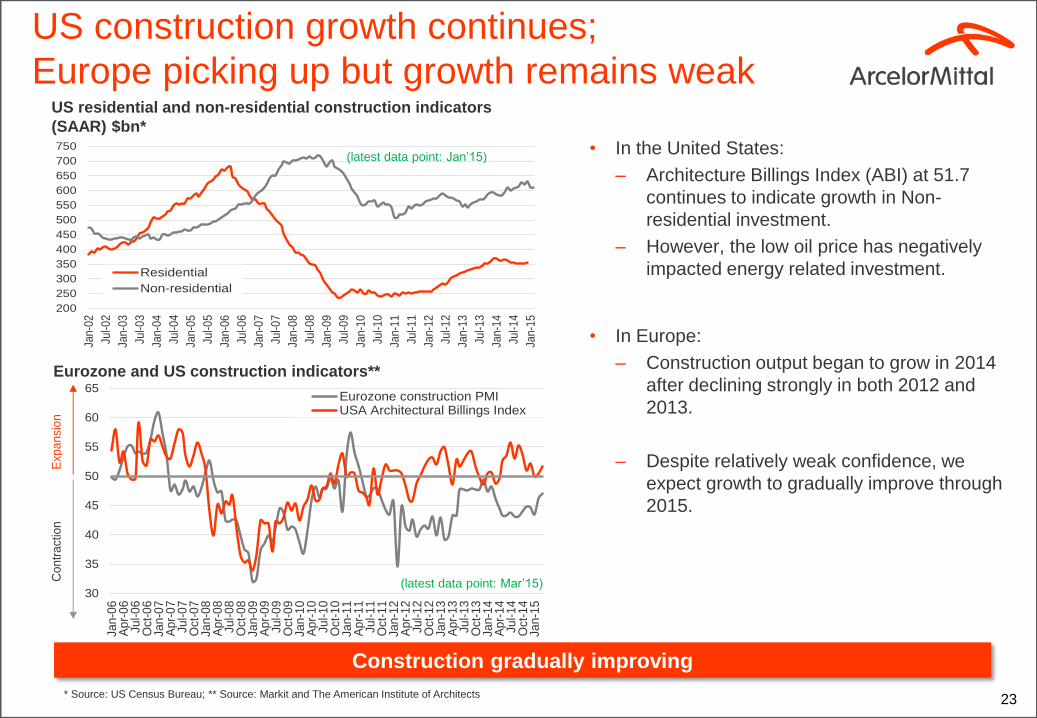
US construction growth continues;
Europe picking up but growth remains weak
• In the United States:
– Architecture Billings Index (ABI) at 51.7
continues to indicate growth in Non-
residential investment.
– However, the low oil price has negatively
impacted energy related investment.
• In Europe:
– Construction output began to grow in 2014
after declining strongly in both 2012 and
2013.
– Despite relatively weak confidence, we
expect growth to gradually improve through
2015.
US residential and non-residential construction indicators
(SAAR) $bn*
23 * Source: US Census Bureau; ** Source: Markit and The American Institute of Architects
Eurozone and US construction indicators**
(latest data point: Mar’15)
Construction gradually improving
(latest data point: Jan’15)

0
3
6
9
12
15
18
21
0
10
20
30
40
50
60
70
80
Jan-0
7A
pr-
07
Jul-0
7O
ct-
07
Jan-0
8A
pr-
08
Jul-0
8O
ct-
08
Jan-0
9A
pr-
09
Jul-0
9O
ct-
09
Jan-1
0A
pr-
10
Jul-1
0O
ct-
10
Jan-1
1A
pr-
11
Jul-1
1O
ct-
11
Jan-1
2A
pr-
12
Jul-1
2O
ct-
12
Jan-1
3A
pr-
13
Jul-1
3O
ct-
13
Jan-1
4A
pr-
14
Jul-1
4O
ct-
14
Jan-1
5
Steel inventory at warehouses (RHS)Finished steel production (LHS)Steel inventory at mills (RHS)
-15%
0%
15%
30%
45%
60%
75%
Jan-0
7
Ap
r-07
Jul-07
Oct-
07
Jan-0
8
Ap
r-08
Jul-08
Oct-
08
Jan-0
9
Ap
r-09
Jul-09
Oct-
09
Jan-1
0
Ap
r-10
Jul-10
Oct-
10
Jan-1
1
Ap
r-11
Jul-11
Oct-
11
Jan-1
2
Ap
r-12
Jul-12
Oct-
12
Jan-1
3
Ap
r-13
Jul-13
Oct-
13
Jan-1
4
Ap
r-14
Jul-14
Oct-
14
Chinese industrial growth slows • The economy decelerated further in Q1 and with property
prices still falling, the real estate correction will continue
to dampen activity over the coming months.
• The Manufacturing PMI remains below 50, illustrating the
weakness of industrial production in China with growth
slowing to only 5.6% y-o-y in March’15 .
• Passenger car sales continue to grow strongly (+9% y-o-
y) but overall vehicle production is up only 5% y-o-y due
to the decline in commercial vehicle sales.
• While weak property market indicators have led to
measures to support housing demand, any pick-up in
construction is likely to be delayed until 2016.
• In 2015, the weak real estate sector is leading to the first
decline in real demand since 1995. But the absence of a
significant inventory drawdown should support ASC
growth of ~1%. Risks remain to the downside, with Q1’15
ASC down -5% y-o-y.
• Stocks at warehouses are down y-o-y in April, while mill
inventories remain stable y-o-y, we expect only marginal
destocking this year.
• Although steel exports are up over 40% y-o-y in Q1’15,
they have begun to decline from 120mt annualised in
January to only 90mt in March (2014: 94mt). 2015
exports expected to be down slightly y-o-y.
24
Crude steel finished production and inventory (mmt)
*Mma refer to months moving average. Source: NBS, CISA, WSA, Mysteel, ArcelorMittal Strategy estimates
China infrastructure investment 3mma* (Y-o-Y)
Slowing economic growth as steel demand negatively impacted by real estate
(latest data point: Feb/Mar’15)
(latest data point: Dec’14)

1.5
2.0
2.5
3.0
3.5
4.0
4.5
5.0
0100200300400500600700800900
1,0001,1001,2001,3001,400
Ja
n-0
7A
pr-
07
Ju
l-0
7O
ct-
07
Ja
n-0
8A
pr-
08
Ju
l-0
8O
ct-
08
Ja
n-0
9A
pr-
09
Ju
l-0
9O
ct-
09
Ja
n-1
0A
pr-
10
Ju
l-1
0O
ct-
10
Ja
n-1
1A
pr-
11
Ju
l-1
1O
ct-
11
Ja
n-1
2A
pr-
12
Ju
l-1
2O
ct-
12
Ja
n-1
3A
pr-
13
Ju
l-1
3O
ct-
13
Ja
n-1
4A
pr-
14
Ju
l-1
4O
ct-
14
Ja
n-1
5
Flat stocks at service centresMonths of supply (RHS)
0.0
1.0
2.0
3.0
4.0
5.0
0
500
1,000
1,500
2,000
2,500
Jan
-07
Ap
r-0
7Ju
l-07
Oct
-07
Jan
-08
Ap
r-0
8Ju
l-08
Oct
-08
Jan
-09
Ap
r-0
9Ju
l-09
Oct
-09
Jan
-10
Ap
r-1
0Ju
l-10
Oct
-10
Jan
-11
Ap
r-1
1Ju
l-11
Oct
-11
Jan
-12
Ap
r-12
Jul-
12O
ct-1
2Ja
n-1
3A
pr-
13
Jul-
13O
ct-1
3Ja
n-1
4A
pr-
14
Jul-
14O
ct-1
4Ja
n-1
5
Germany Flat StocksMonths Supply (RHS)
0%
5%
10%
15%
20%
25%
30%
35%
40%
45%
2
4
6
8
10
12
14
16
18
20
22
Jan
-07
Apr-
07
Jul-
07
Oct-
07
Jan
-08
Ap
r-08
Jul-
08
Oct-
08
Jan
-09
Ap
r-09
Jul-
09
Oct-
09
Jan
-10
Ap
r-10
Jul-
10
Oct-
10
Jan
-11
Ap
r-11
Jul-
11
Oct-
11
Jan
-12
Apr-
12
Jul-
12
Oct-
12
Jan
-13
Ap
r-13
Jul-
13
Oct-
13
Jan
-14
Ap
r-14
Jul-
14
Oct-
14
Jan
-15
Flat and Long
% of ASC (RHS)
2.0
2.2
2.4
2.6
2.8
3.0
3.2
3.4
3.6
0
2,000
4,000
6,000
8,000
10,000
12,000
14,000
Jan-0
7A
pr-
07
Jul-0
7O
ct-
07
Jan-0
8A
pr-
08
Jul-0
8O
ct-
08
Jan-0
9A
pr-
09
Jul-0
9O
ct-
09
Jan-1
0A
pr-
10
Jul-1
0O
ct-
10
Jan-1
1A
pr-
11
Jul-1
1O
ct-
11
Jan-1
2A
pr-
12
Jul-1
2O
ct-
12
Jan-1
3A
pr-
13
Jul-1
3O
ct-
13
Jan-1
4A
pr-
14
Jul-1
4O
ct-
14
Jan-1
5
USA (MSCI)
Months Supply
Regional inventories German inventories (000 Mt)
25
China service centre inventories* (Mt/mth) with ASC% Brazil service centre inventories (000 Mt)
US service centre total steel Inventories (000 Mt)
Source: WSA, Mysteel, ArcelorMittal Strategy estimates
Slight downtick in US inventories
(latest data point:Mar’15)
(latest data point: Mar’15)
(latest data point: Mar’15)
(latest data point: Mar’15)
20
30
40
50
60
70
80
90
100
110
120
130
Ja
n 0
8
Ap
r 0
8
Ju
l 0
8
Oct
08
Jan 0
9
Ap
r 0
9
Ju
l 0
9
Oct
09
Ja
n 1
0
Ap
r 1
0
Ju
l 1
0
Oct
10
Ja
n 1
1
Ap
r 1
1
Ju
l 1
1
Oct
11
Ja
n 1
2
Ap
r 1
2
Ju
l 1
2
Oct
12
Ja
n 1
3
Ap
r 1
3
Jul 13
Oct
13
Ja
n 1
4
Ap
r 1
4
Ju
l 1
4
Oct
14
Ja
n-1
5
Ap
r-1
5
Spot Iron Ore
Coking Coal
Scrap
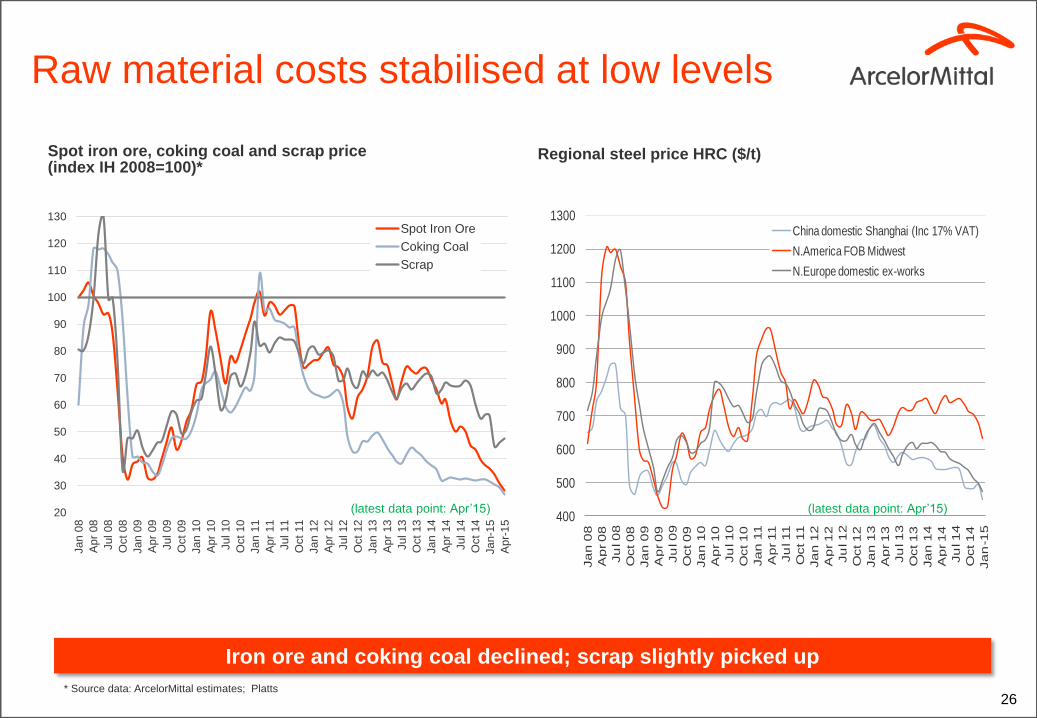
Raw material costs stabilised at low levels
Spot iron ore, coking coal and scrap price (index IH 2008=100)*
Regional steel price HRC ($/t)
26
Iron ore and coking coal declined; scrap slightly picked up
* Source data: ArcelorMittal estimates; Platts
(latest data point: Apr’15) 400
500
600
700
800
900
1000
1100
1200
1300
Ja
n 0
8
Ap
r 0
8
Ju
l 0
8
Oct 0
8
Ja
n 0
9
Ap
r 0
9
Ju
l 0
9
Oct 0
9
Ja
n 1
0
Ap
r 1
0
Ju
l 1
0
Oct 1
0
Ja
n 1
1
Ap
r 11
Ju
l 11
Oct 11
Ja
n 1
2
Ap
r 1
2
Ju
l 1
2
Oct 1
2
Ja
n 1
3
Ap
r 1
3
Ju
l 1
3
Oct 1
3
Ja
n 1
4
Ap
r 1
4
Ju
l 1
4
Oct 1
4
Ja
n-1
5
China domestic Shanghai (Inc 17% VAT)
N.America FOB Midwest
N.Europe domestic ex-works
(latest data point: Apr’15)

27
Net debt ($ billion) Average maturity (years)
Liquidity ($ billion) Bank debt as component of total debt (%)
Balance sheet structurally improved
16.6
32.5
3Q 2008 1Q 2015
6.4
2.6
1Q 2015 3Q 2008
8.8
12.0
1Q 2015 3Q 2008 1Q 2015 3Q 2008
10%
84%
Balance sheet fundamentals improved
Net debt refers to long-term debt, plus short term debt, less cash and cash equivalents, restricted cash and short-term investments (including those held as part of asset/liabilities held for sale).

Working capital
28
OWCR and rotation days* ($ billion and days)
Business will invest in working capital as conditions necessitate
* Rotation days are defined as days of accounts receivable plus days of inventory minus days of accounts payable. Days of accounts payable and inventory are a function of cost of goods sold of the quarter on an annualized basis. Days of accounts receivable are a function of sales of the quarter on an annualized basis.
54
0
4
8
12
16
20
24
28
0
30
60
90
120
4Q
14
3Q
14
2Q
14
1Q
14
4Q
13
3Q
13
2Q
13
1Q
13
4Q
12
3Q
12
2Q
12
1Q
12
4Q
11
3Q
11
2Q
11
1Q
11
4Q
10
3Q
10
2Q
10
1Q
10
4Q
09
3Q
09
2Q
09
1Q
09
4Q
08
3Q
08
2Q
08
1Q
08
4Q
07
3Q
07
2Q
07
1Q
07
1Q
15
Rotation days - RHS Working capital ($ billion) - LHS

29
Net debt analysis
1Q 2015 net debt analysis ($ million)
1,660
614
28953
M&A** free cash flow Net debt
at 4Q’14*
15,838
16,648
Net debt
at 1Q’15
Forex and other Dividend
Net long-term debt, plus short term debt, less cash and cash equivalents, restricted cash and short-term investments (including those held as part of asset/liabilities held for sale);
* As at December 31, 2014, net debt includes $0.1 billion from distribution centers in Europe held for sale
**M&A includes net proceeds from Hunan Valin ($108m) , partial cash proceeds from Kiswire divestment and sale of tangible assets.
Net debt increased due to working capital investment offset by M&A proceeds & forex
30
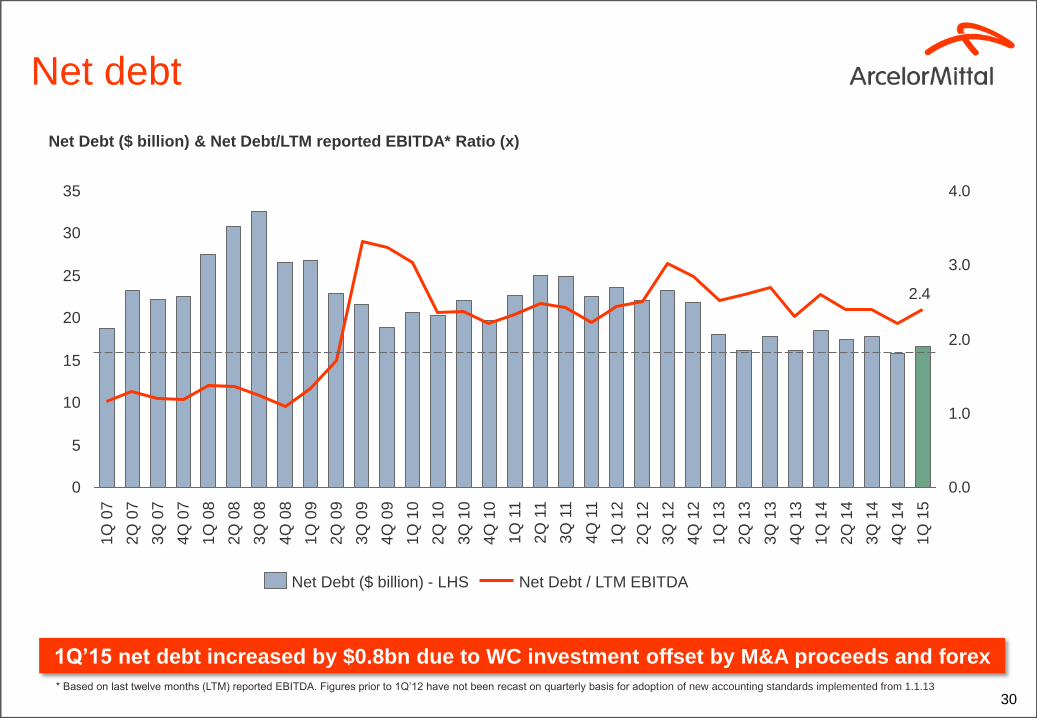
Net debt
Net Debt ($ billion) & Net Debt/LTM reported EBITDA* Ratio (x)
* Based on last twelve months (LTM) reported EBITDA. Figures prior to 1Q’12 have not been recast on quarterly basis for adoption of new accounting standards implemented from 1.1.13
2.4
0
5
10
15
20
25
30
35
0.0
1.0
2.0
3.0
4.0
3Q
14
4Q
14
1Q
14
4Q
13
3Q
13
2Q
13
1Q
13
3Q
12
4Q
12
2Q
12
1Q
12
4Q
11
3Q
11
2Q
11
1Q
11
4Q
10
3Q
10
2Q
10
1Q
10
4Q
09
3Q
09
2Q
09
1Q
09
4Q
08
3Q
08
2Q
08
1Q
08
4Q
07
3Q
07
2Q
07
1Q
07
2Q
14
1Q
15
Net Debt ($ billion) - LHS Net Debt / LTM EBITDA
1Q’15 net debt increased by $0.8bn due to WC investment offset by M&A proceeds and forex
31
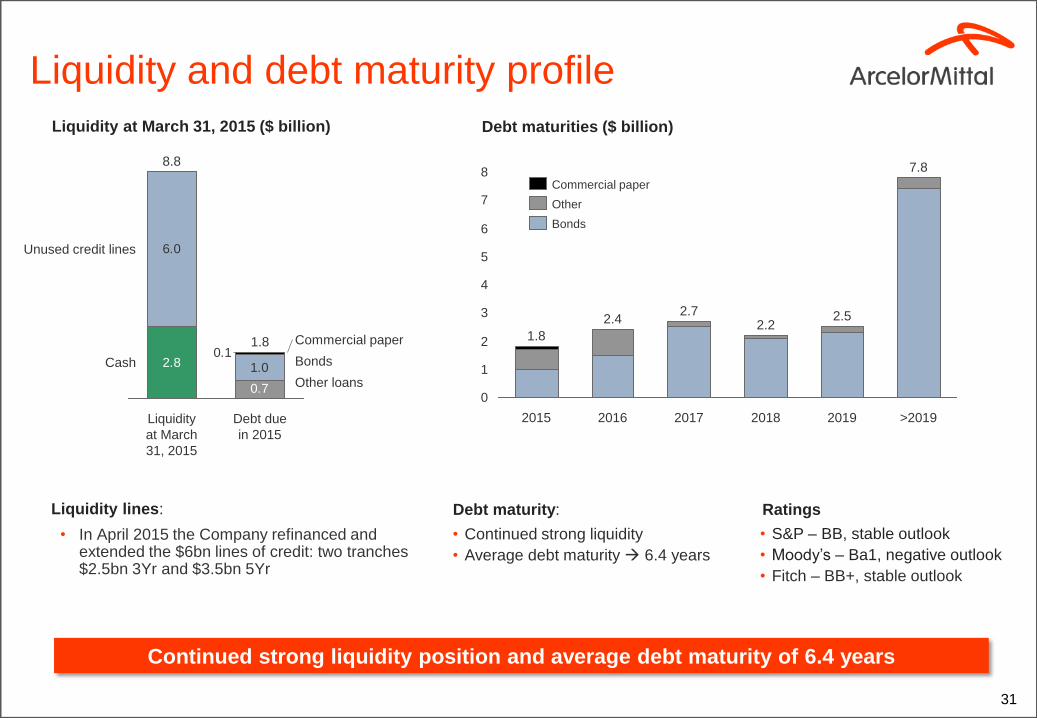
Liquidity and debt maturity profile
Debt maturities ($ billion) Liquidity at March 31, 2015 ($ billion)
Liquidity lines:
• In April 2015 the Company refinanced and extended the $6bn lines of credit: two tranches $2.5bn 3Yr and $3.5bn 5Yr
• Continued strong liquidity
• Average debt maturity 6.4 years
Debt maturity: Ratings
• S&P – BB, stable outlook
• Moody’s – Ba1, negative outlook
• Fitch – BB+, stable outlook
0
1
2
3
4
5
6
7
8
2018
2.2
2015
2.5
2017
2.4
2016
2.7
1.8
>2019
7.8
2019
Bonds
Other
Commercial paper
0.7
1.00.1
2.8
6.0Unused credit lines
Commercial paper
Debt due
in 2015
Bonds
Liquidity
at March
31, 2015
8.8
1.8
Other loans
Cash
Continued strong liquidity position and average debt maturity of 6.4 years

32
Group Performance
Average steel selling price $/t
* EBITDA for 1Q 2015 was negatively impacted by a $69 million provision primarily related to onerous hot rolled and cold rolled contracts in the US. EBITDA for 4Q 2014 was negatively
impacted by a $76 million provision related to onerous annual tin plate contract at Weirton, in the US offset by the $79m gain on disposal of Kuzbass coal mines in Russia
• Crude steel production up 2.4% to 23.7Mt
• Steel shipments up 2.0%: Europe (+10.9%) offset in part by Brazil (-
6.5%), NAFTA (-5.9%) and ACIS (-3.4%)
• Average steel selling prices (ASP) down 9.2% across all segments
due in part to negative forex impact: Europe (-12.2%), Brazil (-10.0%),
ACIS (-7.8%) and NAFTA (-3.5%)
• EBITDA down 20.1% on underlying basis: 1Q‘15 negatively impacted
by a $69m provision related to onerous cold rolled and hot rolled
contracts in the US. 4Q‘14 negatively impacted by a $76m provision
related to onerous tin plate contracts at Weirton in the US, offset by
the positive impact from the $79m gain on disposal of Kuzbass coal
mines in Russia.
• Impairment charges for 4Q’14 of $264m included $114m primarily
related to the idling of the steel shop and rolling facilities of Indiana
Harbor Long carbon operations in the US; $63m related to write-down
of the Volcan iron ore mine in Mexico; and $57m related to the closure
of mill C in Rodange, Luxembourg.
Analysis 1Q’15 v 4Q’14
Steel shipments (000’t)
Underlying EBITDA* ($ Millions) and EBITDA/t
791 735 668
-9.2%
1Q’15 4Q’14 1Q’14
20,968 21,177 21,605
+2.0%
1Q’15 4Q’14 1Q’14
1,754 1,812 1,447
1Q’15 4Q’14 1Q’14
-20.1%
Group profitability declined 1Q’15 v 4Q’14
$84/t $86/t $67/t
33
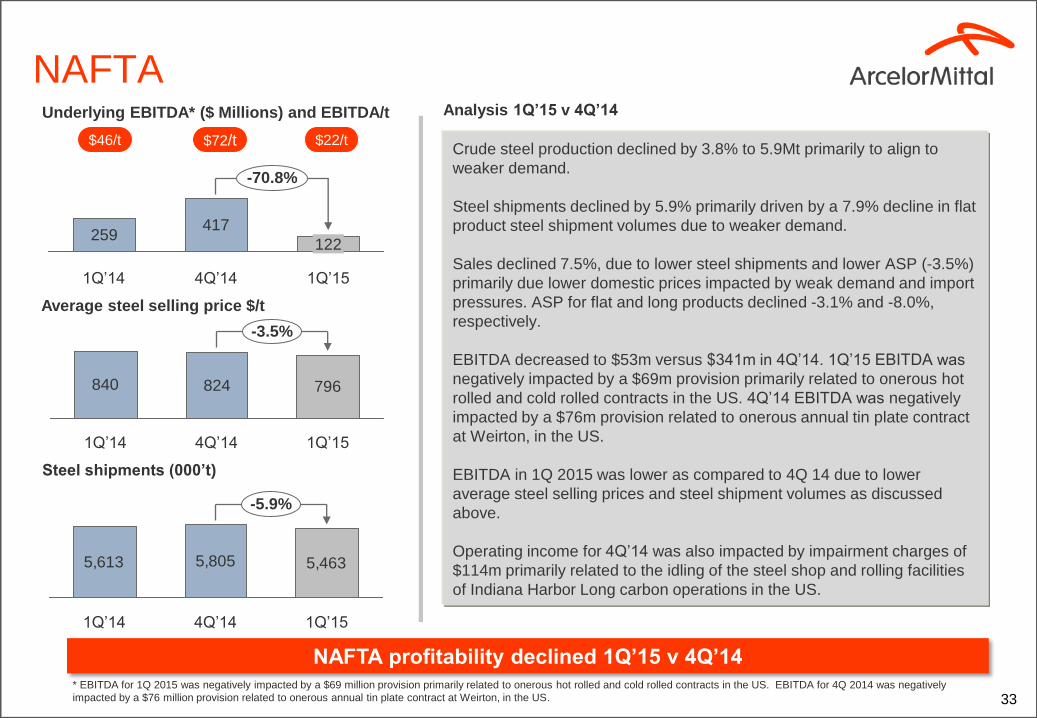
NAFTA
Average steel selling price $/t
* EBITDA for 1Q 2015 was negatively impacted by a $69 million provision primarily related to onerous hot rolled and cold rolled contracts in the US. EBITDA for 4Q 2014 was negatively
impacted by a $76 million provision related to onerous annual tin plate contract at Weirton, in the US.
Crude steel production declined by 3.8% to 5.9Mt primarily to align to
weaker demand.
Steel shipments declined by 5.9% primarily driven by a 7.9% decline in flat
product steel shipment volumes due to weaker demand.
Sales declined 7.5%, due to lower steel shipments and lower ASP (-3.5%)
primarily due lower domestic prices impacted by weak demand and import
pressures. ASP for flat and long products declined -3.1% and -8.0%,
respectively.
EBITDA decreased to $53m versus $341m in 4Q’14. 1Q’15 EBITDA was
negatively impacted by a $69m provision primarily related to onerous hot
rolled and cold rolled contracts in the US. 4Q’14 EBITDA was negatively
impacted by a $76m provision related to onerous annual tin plate contract
at Weirton, in the US.
EBITDA in 1Q 2015 was lower as compared to 4Q 14 due to lower
average steel selling prices and steel shipment volumes as discussed
above.
Operating income for 4Q’14 was also impacted by impairment charges of
$114m primarily related to the idling of the steel shop and rolling facilities
of Indiana Harbor Long carbon operations in the US.
Analysis 1Q’15 v 4Q’14
Steel shipments (000’t)
Underlying EBITDA* ($ Millions) and EBITDA/t
840 824 796
1Q’15 4Q’14 1Q’14
-3.5%
5,613 5,805 5,463
-5.9%
1Q’14 1Q’15 4Q’14
259417
-70.8%
1Q’15
122
4Q’14 1Q’14
NAFTA profitability declined 1Q’15 v 4Q’14
$46/t $72/t $22/t
34
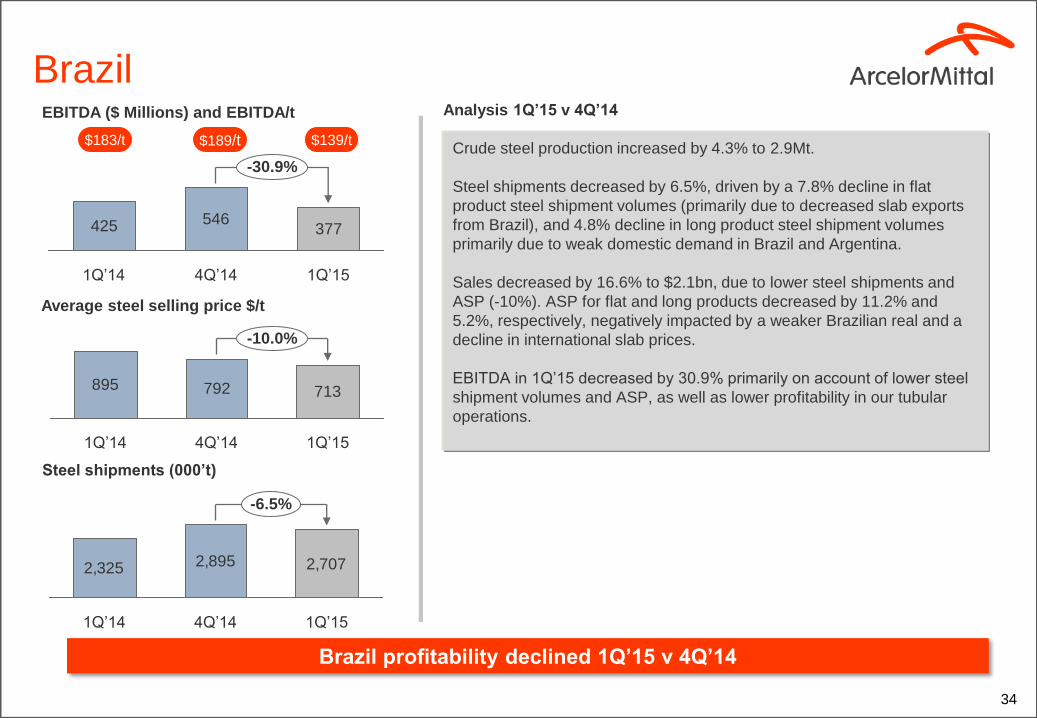
Brazil
Average steel selling price $/t
Crude steel production increased by 4.3% to 2.9Mt.
Steel shipments decreased by 6.5%, driven by a 7.8% decline in flat
product steel shipment volumes (primarily due to decreased slab exports
from Brazil), and 4.8% decline in long product steel shipment volumes
primarily due to weak domestic demand in Brazil and Argentina.
Sales decreased by 16.6% to $2.1bn, due to lower steel shipments and
ASP (-10%). ASP for flat and long products decreased by 11.2% and
5.2%, respectively, negatively impacted by a weaker Brazilian real and a
decline in international slab prices.
EBITDA in 1Q’15 decreased by 30.9% primarily on account of lower steel
shipment volumes and ASP, as well as lower profitability in our tubular
operations.
Analysis 1Q’15 v 4Q’14
Steel shipments (000’t)
EBITDA ($ Millions) and EBITDA/t
895 792 713
1Q’15 4Q’14 1Q’14
-10.0%
2,325 2,895 2,707
-6.5%
1Q’14 1Q’15 4Q’14
425 546377
-30.9%
1Q’15 4Q’14 1Q’14
Brazil profitability declined 1Q’15 v 4Q’14
$183/t $189/t $139/t
35
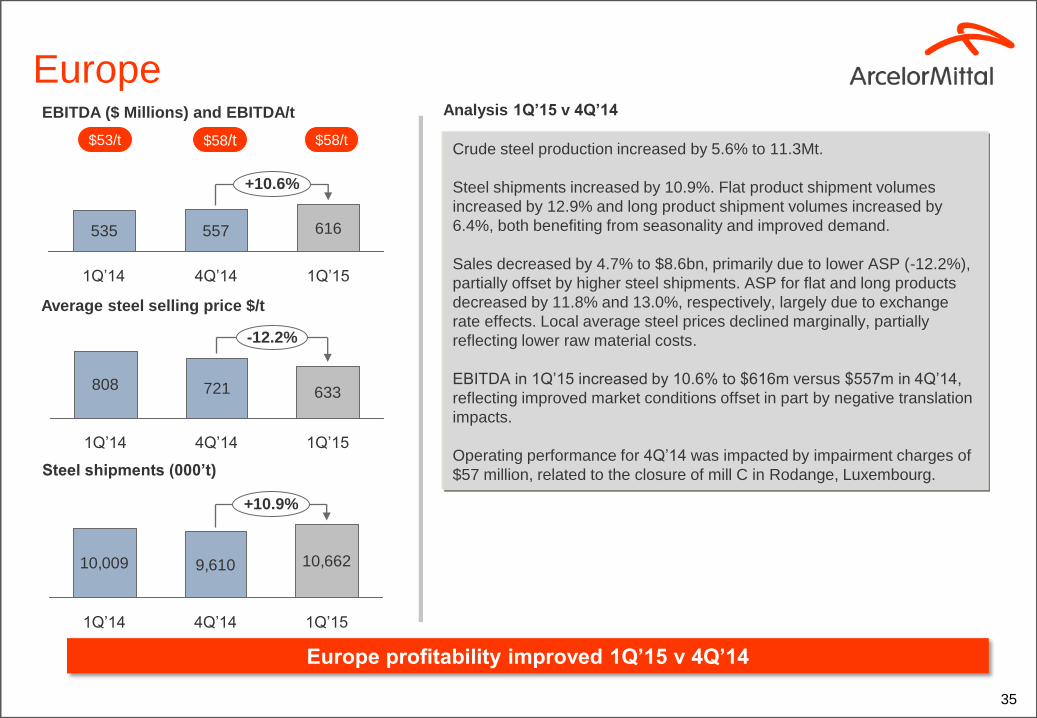
Europe
Average steel selling price $/t
Crude steel production increased by 5.6% to 11.3Mt.
Steel shipments increased by 10.9%. Flat product shipment volumes
increased by 12.9% and long product shipment volumes increased by
6.4%, both benefiting from seasonality and improved demand.
Sales decreased by 4.7% to $8.6bn, primarily due to lower ASP (-12.2%),
partially offset by higher steel shipments. ASP for flat and long products
decreased by 11.8% and 13.0%, respectively, largely due to exchange
rate effects. Local average steel prices declined marginally, partially
reflecting lower raw material costs.
EBITDA in 1Q’15 increased by 10.6% to $616m versus $557m in 4Q’14,
reflecting improved market conditions offset in part by negative translation
impacts.
Operating performance for 4Q’14 was impacted by impairment charges of
$57 million, related to the closure of mill C in Rodange, Luxembourg.
Analysis 1Q’15 v 4Q’14
Steel shipments (000’t)
EBITDA ($ Millions) and EBITDA/t
808 721 633
1Q’15 4Q’14 1Q’14
-12.2%
10,009 9,610 10,662
+10.9%
1Q’14 1Q’15 4Q’14
535 557
+10.6%
1Q’15
616
4Q’14 1Q’14
Europe profitability improved 1Q’15 v 4Q’14
$53/t $58/t $58/t
36
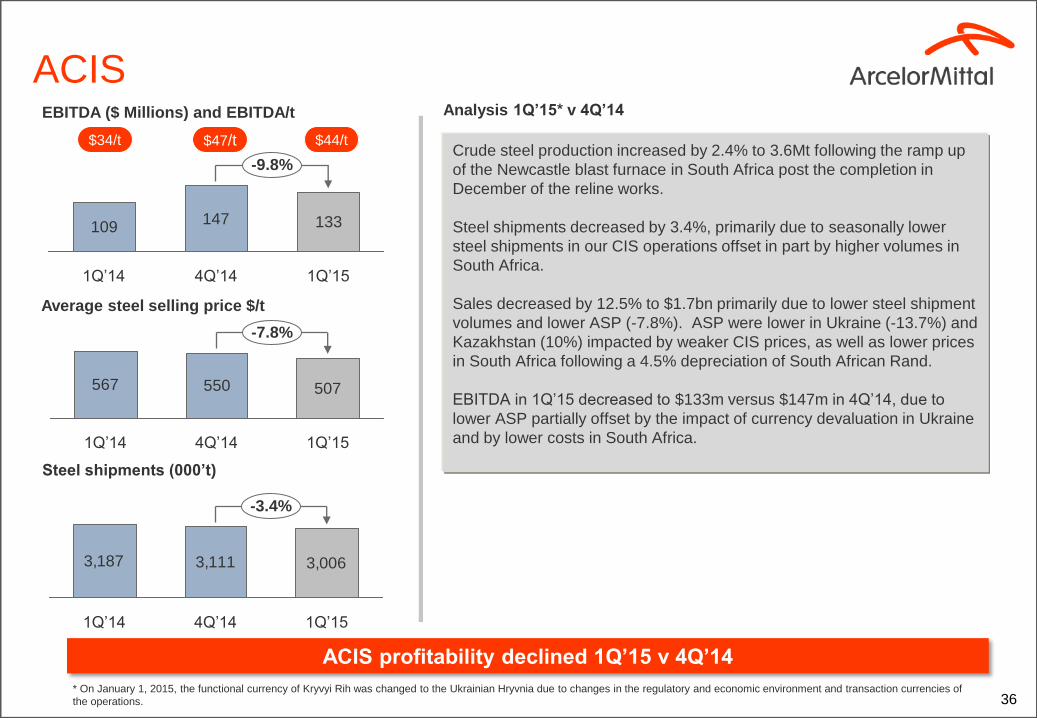
ACIS
Average steel selling price $/t
Crude steel production increased by 2.4% to 3.6Mt following the ramp up
of the Newcastle blast furnace in South Africa post the completion in
December of the reline works.
Steel shipments decreased by 3.4%, primarily due to seasonally lower
steel shipments in our CIS operations offset in part by higher volumes in
South Africa.
Sales decreased by 12.5% to $1.7bn primarily due to lower steel shipment
volumes and lower ASP (-7.8%). ASP were lower in Ukraine (-13.7%) and
Kazakhstan (10%) impacted by weaker CIS prices, as well as lower prices
in South Africa following a 4.5% depreciation of South African Rand.
EBITDA in 1Q’15 decreased to $133m versus $147m in 4Q’14, due to
lower ASP partially offset by the impact of currency devaluation in Ukraine
and by lower costs in South Africa.
Analysis 1Q’15* v 4Q’14
Steel shipments (000’t)
EBITDA ($ Millions) and EBITDA/t
567 550 507
1Q’15 4Q’14 1Q’14
-7.8%
3,187 3,111 3,006
-3.4%
1Q’14 1Q’15 4Q’14
109147 133
-9.8%
1Q’15 4Q’14 1Q’14
ACIS profitability declined 1Q’15 v 4Q’14
$34/t $47/t $44/t
* On January 1, 2015, the functional currency of Kryvyi Rih was changed to the Ukrainian Hryvnia due to changes in the regulatory and economic environment and transaction currencies of
the operations.

37
Mining
Own iron ore production (not including supplies under strategic long-term
contracts) decreased by 7.0% to 15.6Mt reflecting seasonally weaker
performance in Canada, and Brazil offset in part by improved production in
Liberia.
Market price shipments decreased by 5.7% to 9.4mt, primarily driven by
seasonally lower shipments from our Mines Canada driven by weather
related issues.
Own coal production (not including supplies under strategic long-term
contracts) in 1Q’15 decreased 8.0% to 1.6Mt primarily due to seasonally
lower production at our US operations impacted by adverse weather.
EBITDA in 1Q’15 decreased to $114m versus $232m in 4Q’14. EBITDA
for 4Q’14 was positively impacted by $79m gain on disposal of Kuzbass
coal mines in Russia.
On an underlying basis, 1Q’15 EBITDA decreased by 25.8% primarily due
to lower seaborne iron ore market prices (-16%) and lower market price
shipment volumes, offset in part by improved cost performance.
Operating loss for 4Q’14 was impacted by a $63 million impairment charge
related to costs associated with the write-down of the Volcan iron ore mine
in Mexico.
Analysis 1Q’15 v 4Q’14 Underlying EBITDA* ($ Millions)
433153
-25.8%
1Q’15
114
4Q’14 1Q’14
Mining profitability declined 1Q’15 v 4Q’14
Coal (000’t)
4.16.44.2
9.49.9
9.3
0
5
10
15
20
1Q 15 4Q 14 1Q 14
0.8 0.9 0.8
1.0 0.80.6
0.0
0.5
1.0
1.5
2.0
1Q 15 4Q 14 1Q 14
Shipped at cost plus
Own production
Shipped at market price
Iron ore (Mt)
* EBITDA for 4Q 2014 was positively impacted by the $79m gain on disposal of Kuzbass coal mines in Russia

Contacts
Daniel Fairclough – Global Head Investor Relations
+44 207 543 1105
Hetal Patel – UK/European Investor Relations
+44 207 543 1128
Valérie Mella – European and Retail Investor Relations
+44 207 543 1156
Maureen Baker – Fixed Income/Debt Investor Relations
+33 1 71 92 10 26
Lisa Fortuna – US Investor Relations
+312 899 3985