24K Allura : Luxury Apartments in NIBM Pune - An Elixir to Fine Living
Chemistry 162- K. Marr – Revised Winter 2010
Green River Community College Page 1 of 14
Lab 2. Spectroscopic Determination of Allura Red: How Much Dye is in my Gatorade?
Prelab Assignment Before coming to lab:
Complete the following sections of your report for this lab exercise before attending lab:
Title, Introduction, Materials/Methods and Data Table(s). For the Materials/Methods
section, simply summarize the overview of the procedure in your lab notebook and cut
and paste copies of the procedure for parts I – III of the procedure onto both the white and
yellow pages of your lab notebook. Ensure that the table of contents of your lab notebook
is current.
Read the lab thoroughly and answer the prelab questions that appear at the end of this lab
exercise and be prepared to hand them in just before the start of lab.
Purpose
In this lab you will investigate the absorption of visible light by a colored compound, FD&C Red
No. 40 (also known as Allura Red or Red 40), a common artificial food dye. You will learn a
new procedure, Visible Spectroscopy, for determining the concentration of a colored substance in
solution. You will then use that procedure to accurately determine the concentration of a solution
of Red No. 40. Part of your grade will be based on the accuracy of your analysis. You will also
use this procedure to determine the concentration of Red No. 40 in Gatorade.
Background Information
The use of electromagnetic radiation to investigate chemical structure, behavior and
concentration is a large and important field of chemistry. There are many important instrumental
methods of chemical analysis that rely on the interaction between light and matter to probe
chemical structure or to determine analyte concentration. To learn more about spectroscopy, and
to prepare for this lab, read the following sections in your text:
―Tools of the Chemistry Laboratory — Spectrophotometry in Chemical Analysis‖, pp. 281–282
Nearly all regions of the electromagnetic spectrum have been used in chemical analyses of one
sort or another. The lab you will do today uses the visible region of the spectrum and is used
exclusively to analyze compounds that are colored in solution.
Visible Spectroscopy
There are many ways to determine the concentration of a substance in solution. You used two
methods in your Chemistry 140 class. In one experiment you used a titration experiment to
determine the concentration of calcium ions in an unknown sample. You also made
measurements of solution density for various alcohol/water solutions and used that property to
determine the percent alcohol in an unknown sample. As you may recall, in that lab you first
prepared several solutions of known composition and measured their density. You then prepared
a graph of density vs. percent alcohol for these ―standard‖ solutions, and used the graph (or the
equation of the line) to determine the composition of the unknown. That general procedure, using
known standard solutions to determine the concentration of an unknown, is very similar to the
procedure you will use today. The difference is that instead of measuring the density of the

Chemistry 162- K. Marr – Revised Winter 2010
Green River Community College Page 2 of 14
solution you will be measuring the amount of light it absorbs. The amount of light absorbed by a
solution is directly proportional to its concentration. This relationship is expressed
mathematically by Beer’s law:
Beer’s law: A = bc (Equation 1)
In Equation. 1,
A is absorbance, the amount of light absorbed by the solution. Absorbance has no units.
is the molar absorptivity (M-1
cm-1
). Molar absorptivity is a property of a substance that
determines how much light it will absorb. Substances with higher molar absorptivity
absorb more light, all other things being equal. For a given substance, molar absorptivity
is a constant.
b is path length, or the ―thickness‖ of the sample. Thicker samples absorb more light.
This parameter is generally kept constant during an experiment.
c is concentration, typically expressed in Molarity although any concentration units can
be used.
Note that since and b are typically constant, Beer’s Law states that the Absorbance of a sample
is directly proportional to its concentration. Thus we can rewrite Beer’s Law as:
A = kc (Equation 2)
Where k is a constant equal to b.
Absorbance is typically measured using a device called a spectrophotometer. A schematic
diagram of a spectrophotometer is shown below in Figure 1.
Figure 1. Schematic diagram of a spectrophotometer
Spectrophotometers have a detector which measures the intensity of light transmitted
through the solution (It) as compared to the intensity of the incident light (I0). The ratio of It and
Io can be used to indicate the percentage of incoming light absorbed by the solution. This is called
the percent transmittance.
(Equation 3)

Chemistry 162- K. Marr – Revised Winter 2010
Green River Community College Page 3 of 14
To apply Beer’s Law, we need a measure of the amount of light absorbed. Fortunately, these
quantities are related. When more light is transmitted less is absorbed and visa versa.
Mathematically:
(Equation 4)
The higher the absorbance of light by a solution, the lower the percent transmittance. Modern
spectrophotometers can display either Absorbance or Transmittance, so in practice there is no
need to use the equations above. In your experiments you will make all of your measurements in
the Absorbance mode.
Wavelength and Color
A final consideration in this experiment is the relationship between the wavelength of the
incident light and the amount of light absorbed. When colored solutions are irradiated with white
light, they will selectively absorb light of some wavelengths, but not others. The remaining light,
lacking the absorbed wavelengths, is transmitted and perceived by the eye (or by the
spectrophotometer). A color wheel, shown below, illustrates the approximate complementary
relationship between the wavelengths of light absorbed and the wavelengths transmitted. For
example, in a blue substance, there would be a strong absorbance of the complementary (opposite
it in the color wheel) color of light, orange. Substances that absorb blue light appear orange to the
eye.
Figure 2. Color wheel with approximate wavelength values for different color light.
For a given substance, there is a wavelength, max, at which absorbance is highest and at
which the solution is most sensitive to concentration changes. To find max a plot of Absorbance
vs. wavelength for a given substance is collected. This plot is called an absorption spectrum. As
an example, the absorption spectrum for a purple dye is shown in Figure 3, below. Note that
maximum absorbance for the purple dye falls in the yellow region of the spectrum.
The spectrophotometers you will use in the lab can selectively emit light of any wavelength
in the visible region of the spectrum. Which wavelength should you use? Can you make a
prediction by looking at the color wheel?
Even though you can likely make a very good guess as to the max of Allura Red, we have an
instrument available that will measure its absorption spectrum and allow an accurate
determination of the max.

Chemistry 162- K. Marr – Revised Winter 2010
Green River Community College Page 4 of 14
Figure 3. Absorption spectrum for a purple dye.
Analysis of this absorption spectrum indicates that the
max for the purple dye is 572 nm
Figure 4. Calibration curve (standard curve) for a
purple dye. When A is plotted versus C, a straight line
passing through the origin and with a slope of (b) is
obtained. The R2 value lets you know how well the line
fits the data: R2 = 1 means that there is a perfect match
between the data and the line.
What’s a Calibration Curve or Standard Curve?
A spectrophotometer can measure the Absorbance of a solution, but it cannot automatically
tell you the concentration of that solution. To relate the measured Absorbance to a concentration
you must first prepare a set of standard solutions and measure their absorbance. A standard
curve, also known as a calibration curve (fig. 4), is made by measuring and plotting the
absorbance of several standard solutions—solutions of known concentration. Recall that Beer’s
Law (A = kc), shows that there is an expected linear relationship between Absorbance and
concentration. Thus, when A is plotted versus c (fig. 4), a straight line passing through the origin
and with a slope of k (k = b) should be obtained. It should be noted that when solution
concentrations are too high or too low that there are deviations from Beer’s law such that there is
no longer a linear relationship between absorbance and concentration.
Artificial Food Coloring Agents
Coloring agents have been used as food additives for centuries. They help us to identify foods
visually. For instance, lime and orange sherbets would be nearly indistinguishable based on
appearance if not for the green and orange colors. Coloring agents add a festive appearance to
foods—M&Ms candies would taste the same if they were all colored gray, but would certainly be
less appealing. Food additives are also added to foods because we have strong expectations about
what colors should be associated with certain foods. All else being equal, would you buy an
orange with a bright orange color, or one that is a mottled brown-green?
Coloring agents have been added to foods for less legitimate reasons as well. At the
beginning of the 20th
century, when there was no regulation of color additives in this country,

Chemistry 162- K. Marr – Revised Winter 2010
Green River Community College Page 5 of 14
coloring agents were added to foods to mask inferior or spoiled foods, and some coloring agents
marketed for inclusion in foods were indeed poisonous. Since passage of the Federal Food, Drug,
and Cosmetic (FD&C) act of 1938, color additives in the U.S. have been the responsibility of the
Food and Drug Administration (FDA). A recent controversy in the news concerns the addition of
a dye, canthaxanthin, to farm raised salmon. The dye gives the fish the deep red color consumers
expect. After a lawsuit was filed here in Seattle by a consumer advocate group, local grocery
chains were forced to label all fish containing the dye. Next time you are in the supermarket, stop
by the fish counter and check it out!
The FDA divides coloring agents into two categories: certifiable and exempt from
certification. The former are derived primarily from petroleum, while the latter includes agents
derived largely from mineral, plant, or animal sources. Certified colors are further broken down
in to water-soluble ―dyes‖ and water-insoluble ―lakes‖, with most colors being available in both
forms. At present, there are seven color additives certified for food use. One of these, allura red
(FD&C Red No. 40), will be used in this experiment. Its structure is shown in Fig. 1.
N N
OCH3
H3C
-O3S
HO
SO3-
Figure 5. FD&C Red Dye No. 40 (Allura Red). Allura red commonly comes as a disodium
salt: C18H14N2O8S2Na2; molar mass = 496.42 g/mol.
Red food dyes have a history of controversy. In 1960, additions to the FD&C Act of 1938
included the so-called Delaney amendment. This amendment prohibits the marketing of any
coloring agent that has been found to cause cancer in humans or rats, regardless of the dose. For
many years, FD&C Red No. 3 was the most important red dye used in foods. But, in 1938, a
single study found that FD&C Red No. 3 could be associated with thyroid cancer in male rats.
On the basis of that study, the FDA banned all uses of Red Lake No.3 and several uses of Red
Dye No. 3. You may be old enough to remember that FD&C Red No.2 met a similar end several
years ago, with the curious result that, for a time, there were no red M&Ms candies. As of today,
Red Dye No. 3 remains certified for use in foods. However, in anticipation that the FDA may
also ban Red Dye No. 3, food manufacturers have almost entirely abandoned this dye in favor of
the relatively new (and relatively untested!!) FD&C Red No. 40.
More information about color additives in foods, drugs, and cosmetics can be found at
http://vm.cfsan.fda.gov/~dms/cos-221.html.

Chemistry 162- K. Marr – Revised Winter 2010
Green River Community College Page 6 of 14
Materials and Methods
Materials
- Stock solution of FD&C Red No. 40 (Allura
Red)
- Gatorade Fruit Punch (FD&C red dye #40)
- Allura Red Unknown – record number in your
lab notebook!
- Five (5) 100.0 mL Volumetric flask
- Various pipettes
- Pipette bulbs
- Vernier spectrophotometer
- Cuvettes
- Kimwipes
- D.I. Water
You will work individually for this lab.
Overview of the procedure for this lab
- Prepare a set of six solutions of Allura Red with known concentration (standard
solutions.)
- Use one of the standard solutions to determine max. for Allura Red.
- Set the spectrophotometer at max., measure the absorbance of the standard solutions and
prepare a calibration curve.
- Measure the absorbance of an unknown (diluted) and of a sample of Gatorade (diluted).
- Use the equation of the calibration curve and the absorbance of each solution at max to
determine the concentration of the Red 40 dye in the unknown and in the Gatorade.
I. Preparation of Standard Solutions of Allura Red from Stock Solution
The lab technician will have available a stock solution of Allura Red. You will use this solution
to prepare your standard solutions as described below. Make sure that you record the
concentration of the stock solution of Allura Red in your lab notebook.
CAUTION!! An important factor that will influence the accuracy of your results in this lab
is your ability to accurately pipette the Allura Red stock solution to make the
standard solutions. You may wish to test your pipetting skills before making
the standard solutions from your stock solution
Practice Using a Pipette
a. Get a pipette (e.g. a 5.00 mL pipette) and rubber bulb. Weigh a 125 mL Erlenmeyer
flask and then transfer 5.00 mL of DI water using the pipette and rubber bulb.
Weigh the flask after transfer.
b. Assuming the density of water is 1.00 g/mL, use the mass of water transferred to
determine the exact volume of liquid that was pipetted.
c. Repeat this exercise until you can reproduce different volumes using the pipette
Procedure
1. Prepare the first of the six standard solutions by quantitatively pipetting 3.00 mL of the
stock solution into a 100 mL volumetric flask. Dilute to the mark and mix well. Label the
flask with your name and the number ―3‖.

Chemistry 162- K. Marr – Revised Winter 2010
Green River Community College Page 7 of 14
2. Repeat this procedure using 5.00, 10.00, 15.00, 20.00 and 25.00 mL samples to prepare
the remaining standard solutions. The standard solutions will be used to generate the
calibration curve and to determine max. For convenience, later in the lab the standard
solutions will be referred to as solution 3, solution 5, etc. Later, the exact concentration
(in mol/L) of these stock solutions must be calculated.
II. Determination of max with a “Vernier Spectrophotometer”
The wavelength at which a sample absorbs most strongly, i.e., at which the absorbance is
largest, is defined as max. Whatever the concentration, all samples of the same substance have
the same value of max. The amount of light absorbed may vary, but the wavelength of the light
absorbed remains the same. In order to determine max for FD&C Red No. 40, you will use
solution 10, though any of the other standard solutions would also work.
You will use a Vernier spectrophotometer (figure 6) to determine max. This instrument will
produce a complete absorption spectrum for your sample—it works a like a scanning
spectrophotometer, a spectrophotometer that scans through the wavelengths of the visible
spectrum and indicates the solution’s absorbance at each wavelength (figure 7).
Figure 6. A Vernier spectrophotometer
containing a cuvette containing a Nickel
(II) sulfate solution.
Figure 7. An absorption spectrum of a Nickel (II)
sulfate solution. What is max? Can you determine
the color of the solution from this spectrum?
Procedure
1. Use a USB cable to connect a spectrometer to the computer.
2. Start the Logger Pro
3. Calibrate the spectrometer.
a. Prepare a blank by filling an empty cuvette ¾ full with distilled water. Place the blank
cuvette in the spectrometer.
b. Select Calibrate ► Spectrometer from the Experiment menu. The calibration dialog
box will display the message: ―Waiting ….. seconds for lamp to warm up.‖ The
minimum warm up time is one minute. Follow the instructions in the dialog box to
complete the calibration. Click .
Chemistry 162- K. Marr – Revised Winter 2010
Green River Community College Page 8 of 14
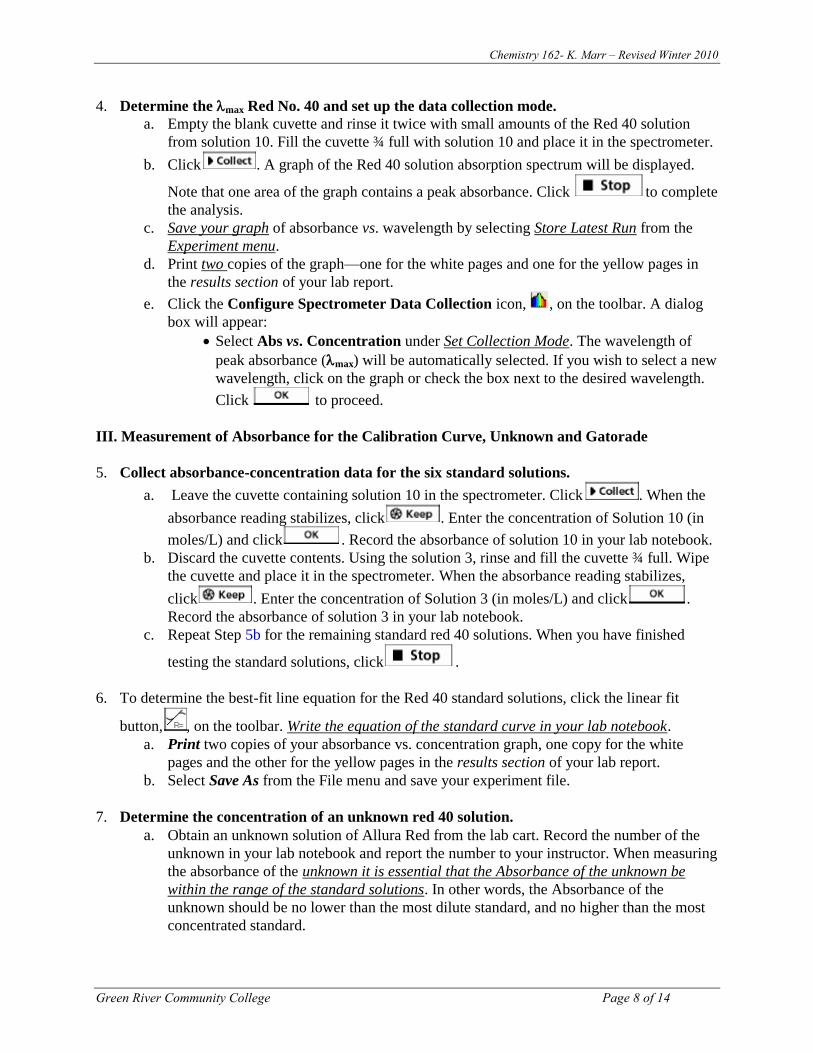
4. Determine the max Red No. 40 and set up the data collection mode.
a. Empty the blank cuvette and rinse it twice with small amounts of the Red 40 solution
from solution 10. Fill the cuvette ¾ full with solution 10 and place it in the spectrometer.
b. Click . A graph of the Red 40 solution absorption spectrum will be displayed.
Note that one area of the graph contains a peak absorbance. Click to complete
the analysis.
c. Save your graph of absorbance vs. wavelength by selecting Store Latest Run from the
Experiment menu.
d. Print two copies of the graph—one for the white pages and one for the yellow pages in
the results section of your lab report.
e. Click the Configure Spectrometer Data Collection icon, , on the toolbar. A dialog
box will appear:
Select Abs vs. Concentration under Set Collection Mode. The wavelength of
peak absorbance (max) will be automatically selected. If you wish to select a new
wavelength, click on the graph or check the box next to the desired wavelength.
Click to proceed.
III. Measurement of Absorbance for the Calibration Curve, Unknown and Gatorade
5. Collect absorbance-concentration data for the six standard solutions.
a. Leave the cuvette containing solution 10 in the spectrometer. Click . When the
absorbance reading stabilizes, click . Enter the concentration of Solution 10 (in
moles/L) and click . Record the absorbance of solution 10 in your lab notebook.
b. Discard the cuvette contents. Using the solution 3, rinse and fill the cuvette ¾ full. Wipe
the cuvette and place it in the spectrometer. When the absorbance reading stabilizes,
click . Enter the concentration of Solution 3 (in moles/L) and click .
Record the absorbance of solution 3 in your lab notebook.
c. Repeat Step 5b for the remaining standard red 40 solutions. When you have finished
testing the standard solutions, click .
6. To determine the best-fit line equation for the Red 40 standard solutions, click the linear fit
button, , on the toolbar. Write the equation of the standard curve in your lab notebook.
a. Print two copies of your absorbance vs. concentration graph, one copy for the white
pages and the other for the yellow pages in the results section of your lab report.
b. Select Save As from the File menu and save your experiment file.
7. Determine the concentration of an unknown red 40 solution.
a. Obtain an unknown solution of Allura Red from the lab cart. Record the number of the
unknown in your lab notebook and report the number to your instructor. When measuring
the absorbance of the unknown it is essential that the Absorbance of the unknown be
within the range of the standard solutions. In other words, the Absorbance of the
unknown should be no lower than the most dilute standard, and no higher than the most
concentrated standard.

Chemistry 162- K. Marr – Revised Winter 2010
Green River Community College Page 9 of 14
The unknowns we have prepared for you are all too concentrated to be measured as-
is. Thus, you will have to quantitatively dilute the sample before measuring its
absorbance. It is up to you to determine the appropriate dilution factor. Record in
your lab notebook how you diluted your sample and remember this dilution factor
when calculating the concentration of the unknown.
b. Rinse the cuvette twice with your diluted unknown solution and fill it about ¾ full.
Wipe the outside of the cuvette and place it into the spectrometer. When the
absorbance reading stabilizes, record the absorbance of the diluted unknown solution
in your lab notebook.
c. Dispose of any of the remaining solutions as directed.
8. Gatorade Analysis: Obtain a sample of Gatorade from the lab cart. As with the unknown,
the Gatorade will also need to be diluted in order to bring its Absorbance into the appropriate
range. Dilute the sample as needed, then measure and record its absorbance at max.
Analysis of Results
1. Calculate the molarity of the standard solutions of Allura Red. Show sample calculations
using correct units and significant figures.
2. Use Excel to prepare a calibration curve for your standard solutions. Fit a line to this plot, and
use Excel to determine the equation of the best-fit line (i.e. the trendline) and the value for R-
squared. Before printing, check that your name appears on the graph. If done correctly, your
graph and the equation of the best fit line should be the same as the calibration curve you
printed from step 6 of the procedure.
3. Use the equation of trendline and the absorbance of the Gatorade and your unknown to
determine the concentration in mol/L, g/L and mg/L of FD&C Red No. 40 in the in the
Gatorade and your unknown. Don’t forget to take into account the dilution of the samples!
Show all calculations clearly using units and significant figures. After you have calculated the
concentration of your unknown, see the instructor to check the accuracy of your results.
Remember, you will receive an additional grade based on the accuracy of your results! If you
are unsatisfied with your results you may repeat the lab on your own time. However, any such
make-ups must be scheduled in advance with the chemistry lab technician.
If your results have a
percent error of...
... then your grade will be:
First
Attempt Second
Attempt Third Attempt
5.0% 100% (30
pts) 90% (27 pts) 80% (24pts)
7.5% 90% 80% 70%
10% 80% 70% 60%
15% 70% 60% 0%
20% 60% 0% 0%
> 20% 0% 0% 0%
Chemistry 162- K. Marr – Revised Winter 2010
Green River Community College Page 10 of 14
5. Unfortunately, the mass of FD&C Red No. 40 in the Gatorade is unknown. Therefore, in
order to evaluate the success/accuracy of your experiment, comment on the quality of the
best-fit line in your calibration curve—that is, is the calibration curve linear? Does there
appear to be a lot of scatter in the data? What is the R-Squared value? What is the meaning of
the R-squared value? Does the y-intercept of the best-fit line have a value close to zero?
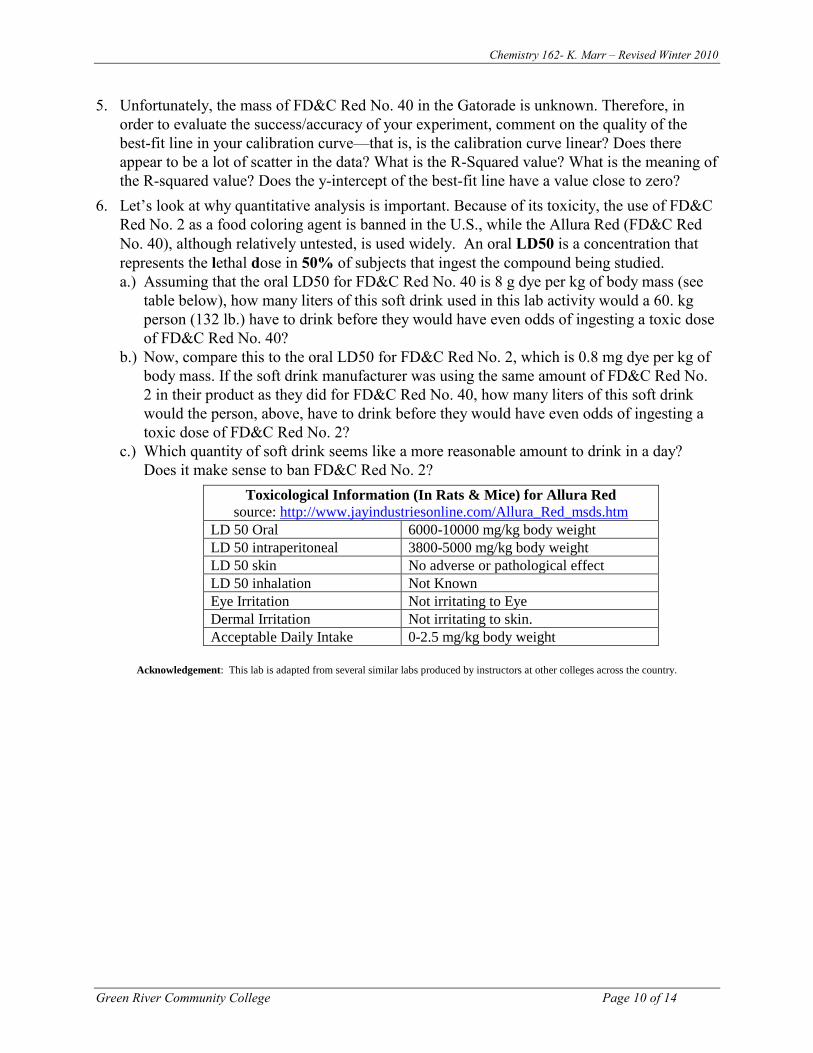
6. Let’s look at why quantitative analysis is important. Because of its toxicity, the use of FD&C
Red No. 2 as a food coloring agent is banned in the U.S., while the Allura Red (FD&C Red
No. 40), although relatively untested, is used widely. An oral LD50 is a concentration that
represents the lethal dose in 50% of subjects that ingest the compound being studied.
a.) Assuming that the oral LD50 for FD&C Red No. 40 is 8 g dye per kg of body mass (see
table below), how many liters of this soft drink used in this lab activity would a 60. kg
person (132 lb.) have to drink before they would have even odds of ingesting a toxic dose
of FD&C Red No. 40?
b.) Now, compare this to the oral LD50 for FD&C Red No. 2, which is 0.8 mg dye per kg of
body mass. If the soft drink manufacturer was using the same amount of FD&C Red No.
2 in their product as they did for FD&C Red No. 40, how many liters of this soft drink
would the person, above, have to drink before they would have even odds of ingesting a
toxic dose of FD&C Red No. 2?
c.) Which quantity of soft drink seems like a more reasonable amount to drink in a day?
Does it make sense to ban FD&C Red No. 2?
Toxicological Information (In Rats & Mice) for Allura Red
source: http://www.jayindustriesonline.com/Allura_Red_msds.htm
LD 50 Oral 6000-10000 mg/kg body weight
LD 50 intraperitoneal 3800-5000 mg/kg body weight
LD 50 skin No adverse or pathological effect
LD 50 inhalation Not Known
Eye Irritation Not irritating to Eye
Dermal Irritation Not irritating to skin.
Acceptable Daily Intake 0-2.5 mg/kg body weight
Acknowledgement: This lab is adapted from several similar labs produced by instructors at other colleges across the country.
Chemistry 162- K. Marr – Revised Winter 2010
Green River Community College Page 11 of 14
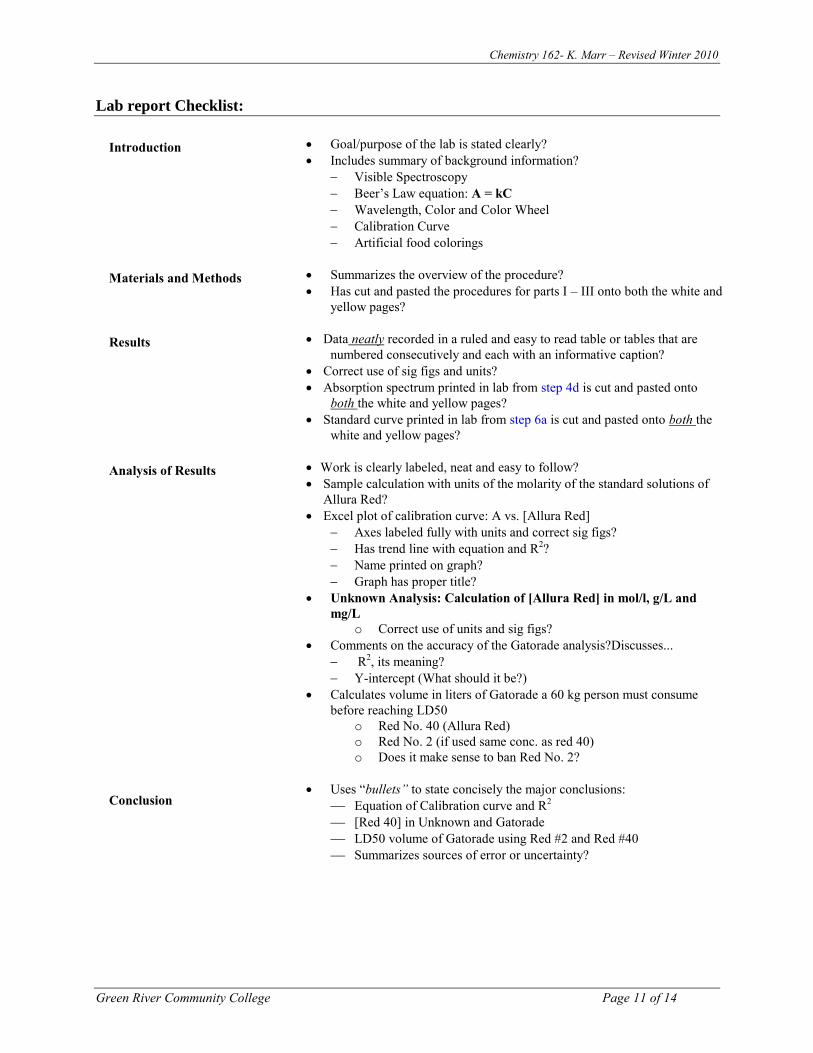
Lab report Checklist:
Introduction Goal/purpose of the lab is stated clearly?
Includes summary of background information?
Visible Spectroscopy
Beer’s Law equation: A = kC
Wavelength, Color and Color Wheel
Calibration Curve
Artificial food colorings
Materials and Methods Summarizes the overview of the procedure?
Has cut and pasted the procedures for parts I – III onto both the white and
yellow pages?
Results Data neatly recorded in a ruled and easy to read table or tables that are
numbered consecutively and each with an informative caption?
Correct use of sig figs and units?
Absorption spectrum printed in lab from step 4d is cut and pasted onto
both the white and yellow pages?
Standard curve printed in lab from step 6a is cut and pasted onto both the
white and yellow pages?
Analysis of Results
Work is clearly labeled, neat and easy to follow?
Sample calculation with units of the molarity of the standard solutions of
Allura Red?
Excel plot of calibration curve: A vs. [Allura Red]
Axes labeled fully with units and correct sig figs?
Has trend line with equation and R2?
Name printed on graph?
Graph has proper title?
Unknown Analysis: Calculation of [Allura Red] in mol/l, g/L and
mg/L
o Correct use of units and sig figs?
Comments on the accuracy of the Gatorade analysis?Discusses...
R2, its meaning?
Y-intercept (What should it be?)
Calculates volume in liters of Gatorade a 60 kg person must consume
before reaching LD50
o Red No. 40 (Allura Red)
o Red No. 2 (if used same conc. as red 40)
o Does it make sense to ban Red No. 2?
Conclusion
Uses ―bullets” to state concisely the major conclusions:
Equation of Calibration curve and R2
[Red 40] in Unknown and Gatorade
LD50 volume of Gatorade using Red #2 and Red #40
Summarizes sources of error or uncertainty?
Chemistry 162- K. Marr – Revised Winter 2010
Green River Community College Page 12 of 14
On the lighter side…

Chemistry 162- K. Marr – Revised Winter 2010
Green River Community College Page 13 of 14
Lab 2. Spectroscopic Determination of Allura Red Name
Prelab Questions Lab Section______ Team #______
Instructions: Complete the following questions and hand in at the start of your lab period or when instructed by
your instructor. Show your work with units and correct significant figures for all questions that involve a
calculation. Circle numerical answers.
1. For each of the colored solutions below, consider the regions of the visible spectrum in which the compound
should absorb light and then prepare a rough sketch of absorbance vs. wavelength for each solution. Label max
on each graph.
a. Urine (i.e. a light yellow solution)
b. Water colored a light red with food coloring
c. Pure distilled water
2. A sample of a red dye and a sample of a purple dye both have the same concentration. Their Absorbance is
measured using the same spectrophotometer. Will both samples give the same Absorbance reading? Why or why
not?
Chemistry 162- K. Marr – Revised Winter 2010
Green River Community College Page 14 of 14
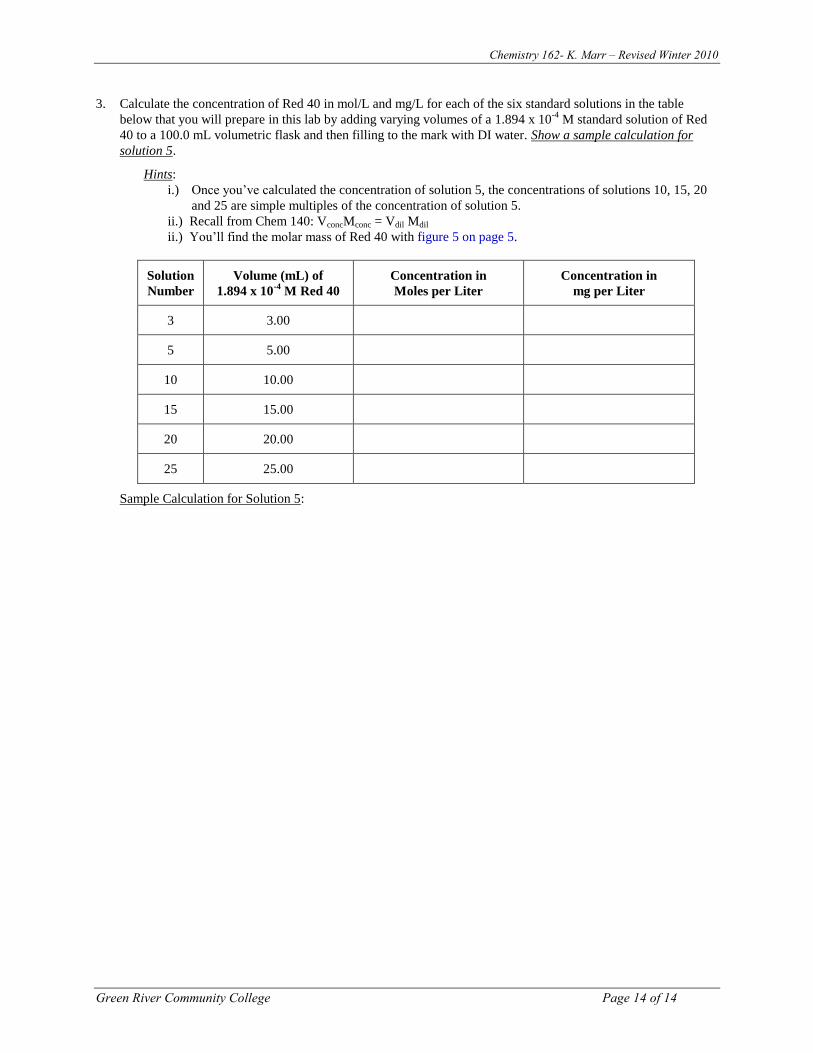
3. Calculate the concentration of Red 40 in mol/L and mg/L for each of the six standard solutions in the table
below that you will prepare in this lab by adding varying volumes of a 1.894 x 10⁻⁴
M standard solution of Red
40 to a 100.0 mL volumetric flask and then filling to the mark with DI water. Show a sample calculation for
solution 5.
Hints:
i.) Once you’ve calculated the concentration of solution 5, the concentrations of solutions 10, 15, 20
and 25 are simple multiples of the concentration of solution 5.
ii.) Recall from Chem 140: VconcMconc = Vdil Mdil
ii.) You’ll find the molar mass of Red 40 with figure 5 on page 5.
Solution
Number
Volume (mL) of
1.894 x 10⁻⁴
M Red 40
Concentration in
Moles per Liter
Concentration in
mg per Liter
3 3.00
5 5.00
10 10.00
15 15.00
20 20.00
25 25.00
Sample Calculation for Solution 5: