Thinking outside the box at Kraft Foods Case study Kraft recognised ...
UNITED STATESSECURITIES AND EXCHANGE COMMISSION
WASHINGTON, D.C. 20549
FORM 10-KANNUAL REPORT PURSUANT TO SECTION 13 OR 15(d) OF THE
SECURITIES EXCHANGE ACT OF 1934
For The Fiscal Year Ended December 31, 2004
COMMISSION FILE NUMBER 1-16483
KRAFT FOODS INC.(Exact name of registrant as specified in its charter)
Virginia 52-2284372(State or other jurisdiction of (I.R.S. Employerincorporation or organization) Identification No.)
Three Lakes Drive,Northfield, Illinois 60093
(Address of principal executive offices) (Zip Code)
Registrant’s telephone number, including area code: 847-646-2000Securities registered pursuant to Section 12(b) of the Act:
Name of each exchangeTitle of each class on which registered
Class A Common Stock, no par value New York Stock Exchange
Indicate by check mark whether the registrant (1) has filed all reports required to be filed bySection 13 or 15(d) of the Securities Exchange Act of 1934 during the preceding 12 months (or for suchshorter period that the registrant was required to file such reports), and (2) has been subject to such filingrequirements for the past 90 days. Yes � No �
Indicate by check mark if disclosure of delinquent filers pursuant to Item 405 of Regulation S-K is notcontained herein, and will not be contained, to the best of registrant’s knowledge, in definitive proxy orinformation statements incorporated by reference in Part III of this Form 10-K or any amendment to thisForm 10-K. �
Indicate by check mark whether the registrant is an accelerated filer (as defined in Rule 12b-2 of theAct). Yes � No �
The aggregate market value of the shares of Class A Common Stock held by non-affiliates of theregistrant, computed by reference to the closing price of such stock on June 30, 2004, wasapproximately $8 billion. At February 28, 2005, there were 526,741,988 shares of the registrant’s Class ACommon Stock outstanding, and 1,180,000,000 shares of the registrant’s Class B Common Stockoutstanding.
Documents Incorporated by Reference
Portions of the registrant’s definitive proxy statement for use in connection with its annual meeting ofshareholders to be held on April 26, 2005, filed with the Securities and Exchange Commission (the‘‘SEC’’) on March 4, 2005, are incorporated in Part III hereof and made a part hereof.
PART I
Item 1. Business.
(a) General Development of Business
General
Kraft Foods Inc. (‘‘Kraft’’) was incorporated in 2000 in the Commonwealth of Virginia. Kraft, throughits subsidiaries (Kraft and its subsidiaries are hereinafter referred to as the ‘‘Company’’), is engaged inthe manufacture and sale of branded foods and beverages in the United States, Canada, Europe, LatinAmerica, Asia Pacific, the Middle East and Africa.
Prior to June 13, 2001, Kraft was a wholly owned subsidiary of Altria Group, Inc. On June 13, 2001,Kraft completed an initial public offering (‘‘IPO’’) of 280,000,000 shares of its Class A common stock at aprice of $31.00 per share. At December 31, 2004, Altria Group, Inc. held 98.0% of the combined votingpower of Kraft’s outstanding capital stock and owned 85.4% of the outstanding shares of Kraft’s capitalstock.
On November 15, 2004, the Company announced the sale of substantially all of its sugarconfectionery business for approximately $1.5 billion. The transaction, which is subject to regulatoryapproval, is expected to be completed in the second quarter of 2005. The Company has reflected theresults of its sugar confectionery business as discontinued operations on the consolidated statements ofearnings for all years presented. Accordingly, historical statements of earnings amounts included in thisForm 10-K have been restated to reflect the discontinued operation. The assets related to the sugarconfectionery business were reflected as assets of discontinued operations held for sale on theconsolidated balance sheet at December 31, 2004.
In January 2004, the Company announced a three-year restructuring program with the objectives ofleveraging the Company’s global scale, realigning and lowering the cost structure, and optimizingcapacity utilization. As part of this program, the Company anticipates the closing or sale of up to 20plants and the elimination of approximately 6,000 positions. In 2004, the Company announced theclosure of 13 plants. Specific programs announced during 2004, as part of the overall restructuringprogram, will result in the elimination of approximately 3,500 positions. From 2004 through 2006, theCompany expects to incur up to $1.2 billion in pre-tax charges, reflecting asset disposals, severance andother implementation costs, including $641 million incurred in 2004. Approximately one-half of thepre-tax charges are expected to require cash payments. In addition, the Company expects to incurapproximately $140 million in capital expenditures from 2004 through 2006 to implement therestructuring program, including $46 million spent in 2004. Cost savings as a result of this program wereapproximately $127 million in 2004, are expected to increase by an incremental amount ofapproximately $120 million to $140 million in 2005, and are anticipated to reach annualized cost savingsof approximately $400 million by 2006. All of these cost savings are expected to be used in support ofbrand-building initiatives.
Source of Funds—Dividends
Because Kraft is a holding company, its principal source of funds is dividends from its subsidiaries.Kraft’s principal wholly owned subsidiaries currently are not limited by long-term debt or otheragreements in their ability to pay cash dividends or make other distributions with respect to theircommon stock.
1
(b) Financial Information About Segments
The Company manufactures and markets packaged food products, consisting principally ofbeverages, cheese, snacks, convenient meals and various packaged grocery products. The Companymanages and reports operating results through two units: Kraft North America Commercial and KraftInternational Commercial. The Company has operations in 68 countries and sells its products in morethan 155 countries. Kraft North America Commercial operates in the United States and Canada, andmanages its operations principally by product category, while Kraft International Commercial managesits operations by geographic region.
During January 2004, the Company announced a new global organization structure, which resultedin new segments. During the fourth quarter of 2004, following the sale of its sugar confectionerybusiness, the Company realigned its North American segments. Kraft North America Commercial’s newsegments are U.S. Beverages; U.S. Cheese, Canada & North America Foodservice; U.S. ConvenientMeals; U.S. Grocery; and U.S. Snacks & Cereals. Kraft International Commercial’s segments are Europe,Middle East & Africa; and Latin America & Asia Pacific. The new segment structure in North Americareflects a shift of certain divisions and brands among segments to more closely align these businessesto consumer sectors, to provide more focus on the separate beverage and grocery businesses, and tobenefit from synergies in grain based products. Historical data have been restated to reflect the newsegment structure.
Net revenues and operating companies income* attributable to each segment (together with areconciliation to consolidated operating income) for each of the last three years are set forth in Note 14 tothe Company’s consolidated financial statements contained in Part II hereof.
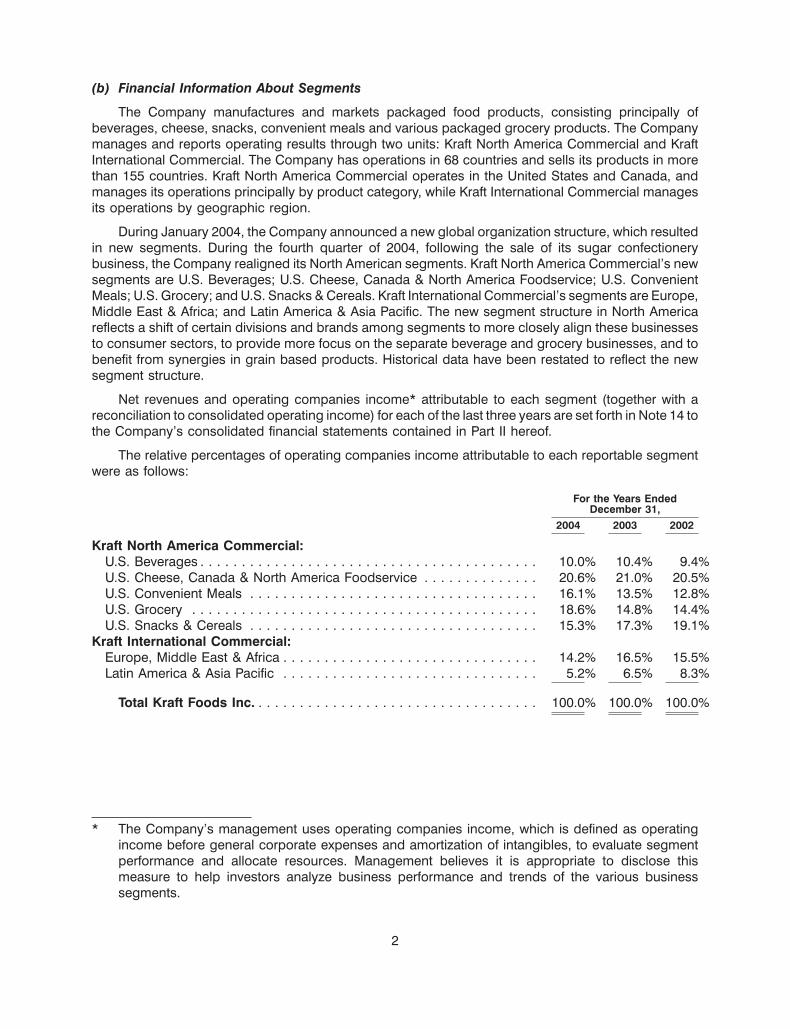
The relative percentages of operating companies income attributable to each reportable segmentwere as follows:
For the Years EndedDecember 31,
2004 2003 2002
Kraft North America Commercial:U.S. Beverages . . . . . . . . . . . . . . . . . . . . . . . . . . . . . . . . . . . . . . . . . 10.0% 10.4% 9.4%U.S. Cheese, Canada & North America Foodservice . . . . . . . . . . . . . . 20.6% 21.0% 20.5%U.S. Convenient Meals . . . . . . . . . . . . . . . . . . . . . . . . . . . . . . . . . . . 16.1% 13.5% 12.8%U.S. Grocery . . . . . . . . . . . . . . . . . . . . . . . . . . . . . . . . . . . . . . . . . . 18.6% 14.8% 14.4%U.S. Snacks & Cereals . . . . . . . . . . . . . . . . . . . . . . . . . . . . . . . . . . . 15.3% 17.3% 19.1%
Kraft International Commercial:Europe, Middle East & Africa . . . . . . . . . . . . . . . . . . . . . . . . . . . . . . . 14.2% 16.5% 15.5%Latin America & Asia Pacific . . . . . . . . . . . . . . . . . . . . . . . . . . . . . . . 5.2% 6.5% 8.3%
Total Kraft Foods Inc. . . . . . . . . . . . . . . . . . . . . . . . . . . . . . . . . . . 100.0% 100.0% 100.0%
* The Company’s management uses operating companies income, which is defined as operatingincome before general corporate expenses and amortization of intangibles, to evaluate segmentperformance and allocate resources. Management believes it is appropriate to disclose thismeasure to help investors analyze business performance and trends of the various businesssegments.
2
(c) Narrative Description of Business
Markets and Products
The Company’s brands span five consumer sectors, as follows:
• Snacks—primarily cookies, crackers, salted snacks and confectionery;
• Beverages—primarily coffee, aseptic juice drinks and powdered beverages;
• Cheese & Dairy—primarily natural, process and cream cheeses;
• Grocery—primarily ready-to-eat cereals, enhancers and desserts; and
• Convenient Meals—primarily frozen pizza, packaged dinners, lunch combinations andprocessed meats.
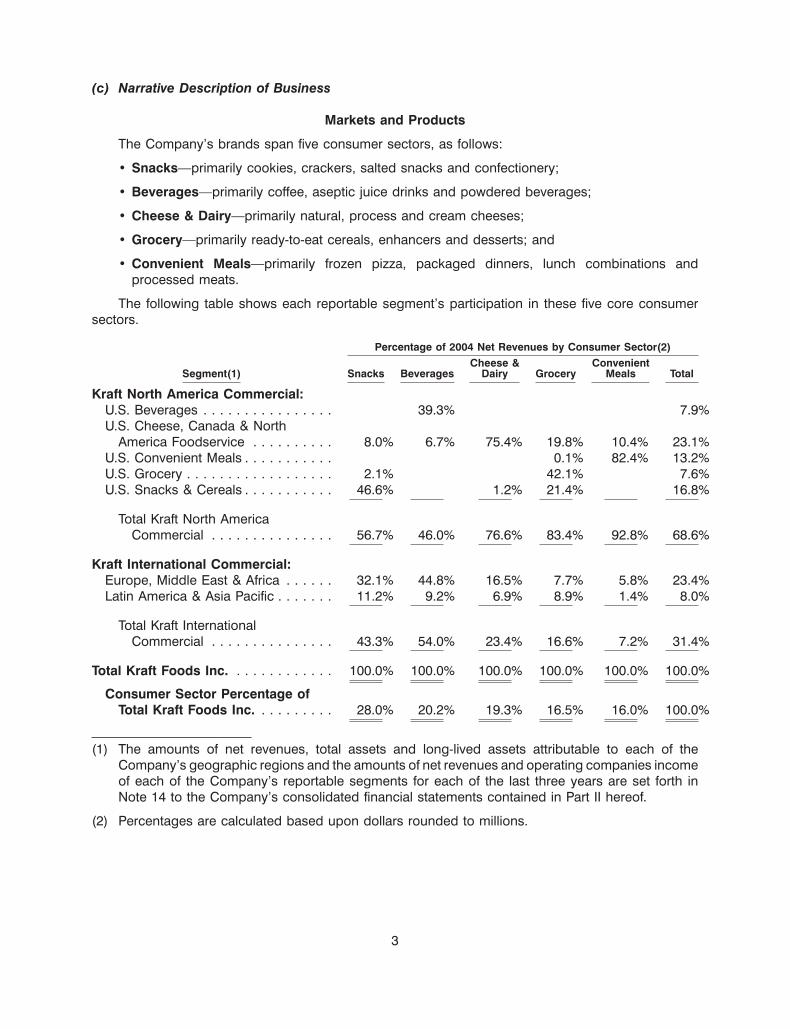
The following table shows each reportable segment’s participation in these five core consumersectors.
Percentage of 2004 Net Revenues by Consumer Sector(2)Cheese & Convenient
Segment(1) Snacks Beverages Dairy Grocery Meals Total
Kraft North America Commercial:U.S. Beverages . . . . . . . . . . . . . . . . 39.3% 7.9%U.S. Cheese, Canada & North
America Foodservice . . . . . . . . . . 8.0% 6.7% 75.4% 19.8% 10.4% 23.1%U.S. Convenient Meals . . . . . . . . . . . 0.1% 82.4% 13.2%U.S. Grocery . . . . . . . . . . . . . . . . . . 2.1% 42.1% 7.6%U.S. Snacks & Cereals . . . . . . . . . . . 46.6% 1.2% 21.4% 16.8%
Total Kraft North AmericaCommercial . . . . . . . . . . . . . . . 56.7% 46.0% 76.6% 83.4% 92.8% 68.6%
Kraft International Commercial:Europe, Middle East & Africa . . . . . . 32.1% 44.8% 16.5% 7.7% 5.8% 23.4%Latin America & Asia Pacific . . . . . . . 11.2% 9.2% 6.9% 8.9% 1.4% 8.0%
Total Kraft InternationalCommercial . . . . . . . . . . . . . . . 43.3% 54.0% 23.4% 16.6% 7.2% 31.4%
Total Kraft Foods Inc. . . . . . . . . . . . . 100.0% 100.0% 100.0% 100.0% 100.0% 100.0%
Consumer Sector Percentage ofTotal Kraft Foods Inc. . . . . . . . . . 28.0% 20.2% 19.3% 16.5% 16.0% 100.0%
(1) The amounts of net revenues, total assets and long-lived assets attributable to each of theCompany’s geographic regions and the amounts of net revenues and operating companies incomeof each of the Company’s reportable segments for each of the last three years are set forth inNote 14 to the Company’s consolidated financial statements contained in Part II hereof.
(2) Percentages are calculated based upon dollars rounded to millions.
3
Additional Product Disclosure
Products or similar products contributing 10% or more of the Company’s consolidated net revenuesfor each of the three years in the period ended December 31, 2004, were as follows:
2004 2003 2002
Cheese . . . . . . . . . . . . . . . . . . . . . . . . . . . . . . . . . . . . . . . . . . . . . . . . . . . . . 19% 18% 19%Biscuits . . . . . . . . . . . . . . . . . . . . . . . . . . . . . . . . . . . . . . . . . . . . . . . . . . . . . 14% 14% 15%Coffee . . . . . . . . . . . . . . . . . . . . . . . . . . . . . . . . . . . . . . . . . . . . . . . . . . . . . . 13% 13% 13%
The Company’s major brands within each reportable segment are as follows:
Kraft North America Commercial:
U.S. Beverages
Beverages: Maxwell House, General Foods International Coffees, Starbucks(under license), Yuban, Sanka, Gevalia and Seattle’s Best (underlicense) coffees; Capri Sun (under license), Kool-Aid, Tang andCrystal Light aseptic juice drinks; Kool-Aid, Tang, Crystal Light andCountry Time powdered beverages; Veryfine juices; Tazo teas(under license); and Fruit2O water.
U.S. Cheese, Canada & NorthAmerica Foodservice
Snacks: Oreo, Chips Ahoy!, Newtons, Peak Freans and SnackWell’s cook-ies in Canada; Ritz, Premium, Triscuit, Wheat Thins, Cheese Nipsand Teddy Grahams crackers in Canada; Handi-Snacks two-com-partment snacks in Canada; Fun Fruits sugar confectionery prod-ucts in Canada; and Terry’s and Toblerone chocolate confection-ery products in Canada.
Beverages: Maxwell House, Sanka and Nabob coffees in Canada; Kool-Aidand Tang powdered beverages in Canada; and Capri Sun (underlicense) aseptic juice drinks in Canada.
Cheese & Dairy: Kraft and Cracker Barrel natural cheeses; Philadelphia creamcheese; Kraft and Velveeta process cheeses; Kraft gratedcheeses; Cheez Whiz process cheese sauce; and Knudsen andBreakstone’s cottage cheese and sour cream.
Grocery: Kraft peanut butter in Canada; Del Monte and Aylmer cannedfruits and vegetables in Canada; Miracle Whip spoonable dress-ing in Canada; Post cereal in Canada; and Jell-O products inCanada.
Convenient Meals: Delissio frozen pizzas in Canada.
4
U.S. Convenient Meals
Convenient Meals: DiGiorno, Tombstone, Jack’s and California Pizza Kitchen (underlicense) frozen pizzas; Lunchables lunch combinations; OscarMayer and Louis Rich cold cuts, hot dogs and bacon; Boca soy-based meat alternatives; Kraft macaroni & cheese dinners; TacoBell Home Originals (under license) meal kits; Stove Top stuffingmix; and Minute rice.
Grocery: Back to Nature products.
U.S. Grocery
Grocery: Jell-O dry packaged desserts; Cool Whip frozen whipped top-ping; Jell-O refrigerated gelatin and pudding snacks; Handi-Snacks shelf-stable pudding snacks; Kraft and Miracle Whipspoonable dressings; Kraft salad dressings; A.1.steak sauce; Kraftand Bull’s-Eye barbecue sauces; Grey Poupon premium mus-tards; and Shake ‘ N Bake coatings.
U.S. Snacks & Cereals
Snacks: Oreo, Chips Ahoy!, Newtons, Nilla, Nutter Butter, Stella D’Oro andSnackWell’s cookies; Ritz, Premium, Triscuit, Wheat Thins, CheeseNips, Better Cheddars, Honey Maid Grahams and Teddy Grahamscrackers; Planters nuts and salted snacks; Handi-Snacks two-compartment snacks; Fun Fruits sugar confectionery products;Terry’s and Toblerone chocolate confectionery products; and Bal-ance nutrition and energy snacks.
Cheese & Dairy: Easy Cheese aerosol cheese spread.
Grocery: Post ready-to-eat cereals; Cream of Wheat and Cream of Rice hotcereals; and Milk-Bone pet snacks.
Kraft InternationalCommercial:
Europe, Middle East & Africa
Snacks: Milka, Suchard, Cote d’Or, Marabou, Toblerone, Freia, Terry’s,Daim, Figaro, Korona, Poiana, Prince Polo, Alpen Gold, Siesta andPokrov chocolate confectionery products; and Estrella, Maarud,Cipso and Lux salted snacks.
Beverages: Jacobs, Gevalia, Carte Noire, Jacques Vabre, Kaffee HAG, GrandMere, Kenco, Saimaza, Maxwell House, Dadak, Onko, Samar,Nova Brasilia and Tassimo coffees; Tang powdered beverages;and Suchard Express, O’Boy and Kaba chocolate drinks.
Cheese & Dairy: Kraft, Dairylea, Sottilette, Osella and El Caserıo cheeses; andPhiladelphia cream cheese.
Grocery: Kraft pourable and spoonable salad dressings; and Miracel Whipspoonable dressings.
Convenient Meals: Lunchables lunch combinations; Kraft and Miracoli pasta dinnersand sauces; and Simmenthal canned meats.
5
Latin America & Asia Pacific
Snacks: Oreo, Chips Ahoy!, Ritz, Terrabusi, Club Social, Cerealitas,Trakinas and Lucky biscuits; and Milka, Lacta and Gallitochocolate confectionery products.
Beverages: Maxwell House and Maxim coffee; Tang, Clight, Kool-Aid, Royal,Verao, Fresh, Frisco, Q-Refres-Ko and Ki-Suco powdered bever-ages; Maguary juice concentrate and ready-to-drink beverages;and Capri Sun (under license) aseptic juice drinks.
Cheese & Dairy: Kraft and Eden process cheeses; Philadelphia cream cheese; andCheez Whiz process cheese spread.
Grocery: Royal dry packaged desserts; Kraft spoonable and pourablesalad dressings; Kraft and ETA peanut butters; and Vegemiteyeast spread.
Convenient Meals: Kraft macaroni & cheese dinners.
Distribution, Competition and Raw Materials
Kraft North America Commercial’s products are generally sold to supermarket chains, wholesalers,supercenters, club stores, mass merchandisers, distributors, convenience stores, gasoline stations,drug stores, value stores and other retail food outlets. In general, the retail trade for food products isconsolidating. Food products are distributed through distribution centers, satellite warehouses,company-operated and public cold-storage facilities, depots and other facilities. Most distribution inNorth America is in the form of warehouse delivery, but biscuits and frozen pizza are distributed throughtwo direct-store delivery systems. The Company supports its selling efforts through three principal setsof activities: consumer advertising in broadcast, print and outdoor media; consumer promotions such ascoupons and contests; and trade promotions to support price features, displays and othermerchandising of our products by our customers. Subsidiaries and affiliates of Kraft InternationalCommercial sell their food products primarily in the same manner and also engage the services ofindependent sales offices and agents.
Kraft North America Commercial and Kraft International Commercial are subject to competitiveconditions in all aspects of their business. Competitors include large national and internationalcompanies and numerous local and regional companies. Some competitors may have different profitobjectives and some international competitors may be more or less susceptible to currency exchangerates. In addition, certain international competitors benefit from government subsidies. Products of KraftNorth America Commercial and Kraft International Commercial also compete with generic products andprivate-label products of food retailers, wholesalers and cooperatives. Kraft North America Commercial,Kraft International Commercial and their subsidiaries compete primarily on the basis of product quality,brand recognition, brand loyalty, service, marketing, advertising and price. Substantial advertising andpromotional expenditures are required to maintain or improve a brand’s market position or to introduce anew product.
Kraft North America Commercial and Kraft International Commercial are major purchasers of milk,cheese, nuts, green coffee beans, cocoa, corn products, wheat, rice, pork, poultry, beef, vegetable oil,and sugar and other sweeteners. They also use significant quantities of glass, plastic and cardboard topackage their products. They continuously monitor worldwide supply and cost trends of thesecommodities to enable them to take appropriate action to obtain ingredients and packaging needed forproduction. Kraft North America Commercial and Kraft International Commercial purchase a substantialportion of their dairy raw material requirements, including milk and cheese, from independent thirdparties such as agricultural cooperatives and independent processors. The prices for milk and other
6
dairy product purchases are substantially influenced by government programs, as well as by marketsupply and demand. Dairy commodity costs on average were higher in 2004 than in 2003. Dairy costsrose to historical highs during the first half of 2004, but moderated during the second half of 2004.
The most significant cost item in coffee products is green coffee beans, which are purchased onworld markets. Green coffee bean prices are affected by the quality and availability of supply, tradeagreements among producing and consuming nations, the unilateral policies of the producing nations,changes in the value of the United States dollar in relation to certain other currencies and consumerdemand for coffee products. In 2004, coffee bean costs on average were higher than in 2003. Asignificant cost item in chocolate confectionery products is cocoa, which is purchased on world markets,and the price of which is affected by the quality and availability of supply and changes in the value of theBritish pound sterling and the United States dollar relative to certain other currencies. In 2004, cocoabean costs on average were lower than in 2003. For 2004, the pre-tax impact from all commodities wasan approximate $930 million increase in costs as compared with 2003.
The prices paid for raw materials and agricultural materials used in the products of Kraft NorthAmerica Commercial and Kraft International Commercial generally reflect external factors such asweather conditions, commodity market fluctuations, currency fluctuations and the effects ofgovernmental agricultural programs. Although the prices of the principal raw materials can be expectedto fluctuate as a result of these factors, the Company believes such raw materials to be in adequatesupply and generally available from numerous sources. The Company uses hedging techniques tominimize the impact of price fluctuations in its principal raw materials. However, it does not fully hedgeagainst changes in commodity prices and these strategies may not protect the Company or itssubsidiaries from increases in specific raw material costs.
Regulation
All of Kraft North America Commercial’s United States food products and packaging materials aresubject to regulations administered by the Food and Drug Administration (‘‘FDA’’) or, with respect toproducts containing meat and poultry, the United States Department of Agriculture. Among other things,these agencies enforce statutory prohibitions against misbranded and adulterated foods, establishsafety standards for food processing, establish ingredients and manufacturing procedures for certainfoods, establish standards of identity for certain foods, determine the safety of food additives andestablish labeling standards and nutrition labeling requirements for food products.
In addition, various states regulate the business of Kraft North America Commercial’s operatingunits by licensing dairy plants, enforcing federal and state standards of identity for selected foodproducts, grading food products, inspecting plants, regulating certain trade practices in connection withthe sale of dairy products and imposing their own labeling requirements on food products.
Many of the food commodities on which Kraft North America Commercial’s United Statesbusinesses rely are subject to governmental agricultural programs. These programs have substantialeffects on prices and supplies and are subject to Congressional and administrative review.
Almost all of the activities of the Company’s food operations outside of the United States are subjectto local and national regulations similar to those applicable to Kraft North America Commercial’s UnitedStates businesses and, in some cases, international regulatory provisions, such as those of theEuropean Union relating to labeling, packaging, food content, pricing, marketing and advertising andrelated areas.
The European Union and certain individual countries require that food products containinggenetically modified organisms or classes of ingredients derived from them be labeled accordingly.Other countries may adopt similar regulations. The FDA has concluded that there is no basis for similarmandatory labeling under current United States law.
7
Acquisitions and Divestitures
During 2004, the Company acquired a U.S.-based beverage business for a total cost of $137 million.During 2003, the Company acquired a biscuits business in Egypt and trademarks associated with asmall U.S.-based natural foods business. The total cost of these and other smaller acquisitions was$98 million. During 2002, the Company acquired a snacks business in Turkey and a biscuits business inAustralia. The total cost of these and other smaller acquisitions was $122 million.
On November 15, 2004, the Company announced the sale of substantially all of its sugarconfectionery business for approximately $1.5 billion. The proposed sale includes the Life Savers,Creme Savers, Altoids, Trolli and Sugus brands. The transaction, which is subject to regulatory approval,is expected to be completed in the second quarter of 2005. The Company has reflected the results of itssugar confectionery business as discontinued operations on the consolidated statements of earningsfor all years presented. Pursuant to the sugar confectionery sale agreement, the Company has agreed toprovide certain transition and supply services to the buyer. These service arrangements are primarily forterms of one year or less, with the exception of one supply arrangement with a term of not more thanthree years. The expected cash flow from this supply arrangement is not significant.
During 2004, the Company sold a Brazilian snack nuts business and trademarks associated with acandy business in Norway. The aggregate proceeds received from the sale of these businesses were$18 million, on which pre-tax losses of $3 million were recorded. In December 2004, the Companyannounced the sale of its U.K. desserts business for approximately $135 million, which is expected toresult in an estimated gain of $0.04 per share. The transaction closed in the first quarter of 2005. TheCompany also announced in December 2004, the sale of its yogurt business for approximately$59 million, which is expected to result in an after-tax loss of approximately $12 million ($5 million in2004, with the remainder at closing). The transaction, which is also subject to regulatory approval, isexpected to be completed in the first quarter of 2005. During 2003, the Company sold a European ricebusiness and a branded fresh cheese business in Italy. The aggregate proceeds received from sales ofbusinesses during 2003 were $96 million, on which the Company recorded pre-tax gains of $31 million.During 2002, the Company sold several small North American food businesses, some of which had beenpreviously classified as businesses held for sale arising from the acquisition of Nabisco. In addition, theCompany sold its Latin American yeast and industrial bakery ingredients business for approximately$110 million and recorded a pre-tax gain of $69 million. The aggregate proceeds received from sales ofbusinesses during 2002 were $219 million, on which the Company recorded pre-tax gains of $80 million.
The operating results of the acquisitions and divestitures, except for the sale of the sugarconfectionery business, were not material to the Company’s consolidated financial position, results ofoperations or cash flows in any of the periods presented.
Other Matters
Customers
For each of the years ended December 31, 2004 and 2003, the Company’s five largest customersaccounted for approximately 28% of its net revenues, and the Company’s ten largest customersaccounted for approximately 38% of its net revenues. One of the Company’s customers, Wal-MartStores, Inc., accounted for approximately 14% of net revenues for 2004 and approximately 12% of netrevenues for 2003.
Employees
At December 31, 2004, the Company employed approximately 98,000 people worldwide.Approximately 30% of the Company’s 45,000 employees in the United States are represented by laborunions. Most of the unionized workers at the Company’s domestic locations are represented under
8
contracts with the Bakery, Confectionery, Tobacco Workers and Grain Millers International Union; theUnited Food and Commercial Workers International Union; and the International Brotherhood ofTeamsters. These contracts expire at various times throughout the next several years. Outside the UnitedStates, labor unions or workers’ councils represent approximately 50% of the Company’s 53,000employees. The Company’s business units are subject to a number of laws and regulations relating totheir relationships with their employees. These laws and regulations are specific to the location of eachenterprise. In addition, in accordance with European Union requirements, Kraft InternationalCommercial has established European Works Councils composed of management and electedmembers of its workforce. The Company believes that its relations with employees and theirrepresentative organizations are good.
Included in the employees above are approximately 700 employees in the sugar confectionerybusiness, the sale of which is expected to be completed in the second quarter of 2005.
In January 2004, the Company announced a three-year restructuring program. Under this program,the Company anticipates the elimination of approximately 6,000 positions. Specific programsannounced during 2004, as part of the overall restructuring program, will result in the elimination ofapproximately 3,500 positions.
Research and Development
The Company pursues four objectives in research and development: product safety and quality;growth through new products; superior consumer satisfaction; and reduced costs.
The Company’s research and development resources include more than 2,000 food scientists,chemists and engineers, deployed primarily in five key technology centers: East Hanover, New Jersey;Glenview, Illinois; Tarrytown, New York; Banbury, United Kingdom; and Munich, Germany. Thesetechnology centers are equipped with pilot plants and state-of-the-art instruments. Research anddevelopment expense was $388 million in 2004, $374 million in 2003 and $354 million in 2002.
Trademarks and Intellectual Property
Trademarks are of material importance to the Company’s businesses and are protected byregistration or otherwise in the United States and most other markets where the related products aresold. The Company has from time to time granted various parties exclusive or non-exclusive licenses touse one or more of its trademarks in particular locations. The Company does not believe that theselicensing arrangements have had a material effect on the conduct of its business or operating results.
Some of the Company’s products are sold under brands that have been licensed from others onterms that are generally renewable at the Company’s discretion. These licensed brands includeStarbucks bagged coffee for sale in United States grocery stores and other distribution channels, CapriSun aseptic juice drinks for sale in North America, Taco Bell Home Originals Mexican style food productsfor sale in United States grocery stores, California Pizza Kitchen frozen pizzas for sale in grocery stores inthe United States and Canada, Pebbles ready-to-eat cereals, Tazo teas for sale in grocery stores in theUnited States, and Seattle’s Best coffee and Torrefazione Italia coffee for sale in United States grocerystores and other distribution channels.
Similarly, the Company owns thousands of patents worldwide, and the patent portfolio as a whole ismaterial to the Company’s business; however, no one patent or group of related patents is material to theCompany. In addition, the Company has proprietary trade secrets, technology, know-how processesand other intellectual property rights that are not registered.
9
Seasonality
Demand for certain of the Company’s products may be influenced by holidays, changes in seasonsor other annual events. Due to the offsetting nature of demands for the Company’s diversified productportfolio, however, sales of the Company’s products are generally evenly balanced throughout the year.
Environmental Regulation
The Company is subject to various federal, state, local and foreign laws and regulations concerningthe discharge of materials into the environment, or otherwise related to environmental protection,including the Clean Air Act, the Clean Water Act, the Resource Conservation and Recovery Act and theComprehensive Environmental Response, Compensation and Liability Act of 1980 (commonly known as‘‘Superfund’’), which imposes joint and several liability on each responsible party. In 2004, subsidiariesof the Company were involved in 93 active Superfund and other actions in the United States related tocurrent operations and certain former or divested operations for which the Company retains liability.
Outside the United States, the Company is subject to applicable multi-national, national and localenvironmental laws and regulations in the host countries in which the Company does business. TheCompany has specific programs across its international business units designed to meet applicableenvironmental compliance requirements.
Although it is not possible to predict precisely the estimated costs for environmental-relatedexpenditures, compliance with such laws and regulations, including the payment of any remediationcosts and the making of such expenditures, has not had, and is not expected to have, a material adverseeffect on the Company’s results of operations, capital expenditures, financial position, earnings, cashflows or competitive position.
Forward-Looking and Cautionary Statements
The Company and its representatives may from time to time make written or oral forward-lookingstatements, including statements contained in the Company’s filings with the SEC, in its reports toshareholders and in press releases and investor webcasts. One can identify these forward-lookingstatements by use of words such as ‘‘strategy,’’ ‘‘expects,’’ ‘‘plans,’’ ‘‘anticipates,’’ ‘‘believes,’’ ‘‘will,’’‘‘continues,’’ ‘‘estimates,’’ ‘‘intends,’’ ‘‘projects,’’ ‘‘goals,’’ ‘‘targets’’ and other words of similar meaning.One can also identify them by the fact that they do not relate strictly to historical or current facts. TheCompany cannot guarantee that any forward-looking statement will be realized, although it believes thatit has been prudent in its plans and assumptions. Achievement of future results is subject to risks,uncertainties, and the possibility of inaccurate assumptions. Should known or unknown risks oruncertainties materialize, or should underlying assumptions prove inaccurate, actual results could varymaterially from those anticipated, estimated, or projected. Investors should bear this in mind as theyconsider forward-looking statements and whether to invest in or remain invested in the Company’ssecurities. In connection with the ‘‘safe harbor’’ provisions of the Private Securities Litigation Reform Actof 1995, the Company is hereby identifying important factors that could cause actual results andoutcomes to differ materially from those contained in any forward-looking statement made by or onbehalf of the Company; any such statement is qualified by reference to the following cautionarystatements. The Company elaborates on these and other risks that it faces throughout this document,particularly in the ‘‘Business Environment’’ section preceding the discussion of operating results. It is notpossible to predict or identify all risk factors. Consequently, the following should not be considered acomplete discussion of all potential risks or uncertainties. The Company does not undertake to updateany forward-looking statement that it may make from time to time.
Each of the Company’s segments is subject to intense competition, changes in consumerpreferences and demand for its products, including low-carbohydrate diet trends, the effects ofchanging prices for its raw materials and local economic and market conditions. Their results are
10
dependent upon their continued ability to promote brand equity successfully, to anticipate and respondto new consumer trends, to develop new products and markets, to broaden brand portfolios, to competeeffectively with lower priced products in a consolidating environment at the retail and manufacturinglevels and to improve productivity. The Company’s results are also dependent on its ability toconsummate and successfully integrate acquisitions and to realize the cost savings and improved assetutilization contemplated by its restructuring program. The Company may, from time to time, divestbusinesses that are less of a strategic fit within its portfolio, and its results may be impacted by either thegains or losses, or lost operating income, from the sales of those businesses. In addition, the Companyis subject to the effects of foreign economies, currency movements, fluctuations in levels of customerinventories and credit and other business risks related to its customers operating in a challengingeconomic and competitive environment. The Company’s results are affected by its access to creditmarkets, borrowing costs and credit ratings, which may in turn be influenced by the credit ratings ofAltria Group, Inc. The Company’s benefit expense is subject to the investment performance of pensionplan assets, interest rates and cost increases for medical benefits offered to employees and retirees. TheCompany’s assessment of the fair value of its operations for purposes of assessing impairment ofgoodwill and intangibles is based on discounting projections of future cash flows and is affected by theinterest rate market and general economic and market conditions. The food industry continues to besubject to recalls if products become adulterated or misbranded, liability if product consumption causesinjury, ingredient disclosure and labeling laws and regulations and the possibility that consumers couldlose confidence in the safety and quality of certain food products. The food industry is also subject toconcerns and/or regulations regarding genetically modified organisms and the health implications ofobesity and trans-fatty acids. Increased government regulation of the food industry could result inincreased costs to the Company.
(d) Financial Information About Geographic Areas
The amounts of net revenues, total assets and long-lived assets attributable to each of theCompany’s geographic segments for each of the last three fiscal years are set forth in Note 14 to theCompany’s consolidated financial statements contained in Part II hereof.
Kraft’s subsidiaries export coffee products, grocery products, cheese and processed meats. In2004, exports from the United States by these subsidiaries amounted to approximately $122 million.
In 2004, the Company had operations and plants or sold products to third-party distributors locatedin 14 Middle East countries (as defined by the U.S. Department of State, Bureau of Near Eastern Affairs),including a biscuit business acquired during 2003 in Egypt. In the region, the Company had operationsand plants in three countries (Egypt, Morocco, and through a majority owned joint venture, SaudiArabia). In addition, the Company sold products to third-party distributors located in 11 of thesecountries (Algeria, Bahrain, Israel, Jordan, Kuwait, Lebanon, Oman, Qatar, Tunisia, United Arab Emiratesand Yemen). Revenue generated from operations or sales to the third-party distributors in the MiddleEast was approximately $250 million in 2004, representing 3.3% of the net revenue of the Europe, MiddleEast and Africa segment. In addition, in 2004, the Company entered into agreements with third partiesfor the resale of the Company’s products into Iraq, Libya and Syria.
(e) Available Information
The Company is required to file annual, quarterly and special reports, proxy statements and otherinformation with the SEC. Investors may read and copy any document that the Company files, includingthis Annual Report on Form 10-K, at the SEC’s Public Reference Room at 450 Fifth Street, N.W.,Washington, D.C. 20549. Investors may obtain information on the operation of the Public ReferenceRoom by calling the SEC at 1-800-SEC-0330. In addition, the SEC maintains an Internet site atwww.sec.gov that contains reports, proxy and information statements, and other information regardingissuers that file electronically with the SEC, from which investors can electronically access theCompany’s SEC filings.
11
The Company makes available free of charge on or through its website (www.kraft.com) its AnnualReports on Form 10-K, Quarterly Reports on Form 10-Q, Current Reports on Form 8-K and amendmentsto those reports filed or furnished pursuant to Section 13(a) or 15(d) of the Securities Exchange Act of1934, as amended, as soon as reasonably practicable after it electronically files such material with, orfurnishes the material to, the SEC. Investors can also access the Company’s filings with the SEC byvisiting http://ir.ccbn.com/ir.zhtml?t=kft&s=1901. The information on the Company’s website is not, andshall not be deemed to be, a part of this Report or incorporated into any other filings the Companymakes with the SEC.
Item 2. Properties.
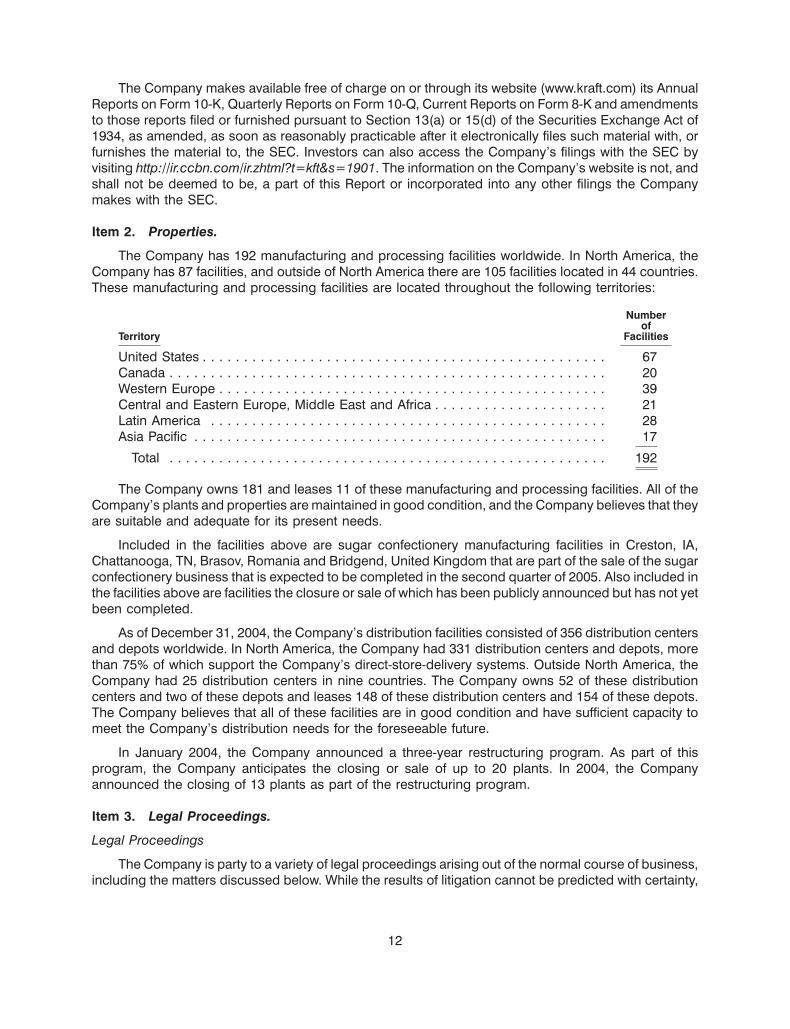
The Company has 192 manufacturing and processing facilities worldwide. In North America, theCompany has 87 facilities, and outside of North America there are 105 facilities located in 44 countries.These manufacturing and processing facilities are located throughout the following territories:
Numberof
Territory Facilities
United States . . . . . . . . . . . . . . . . . . . . . . . . . . . . . . . . . . . . . . . . . . . . . . . . . 67Canada . . . . . . . . . . . . . . . . . . . . . . . . . . . . . . . . . . . . . . . . . . . . . . . . . . . . . 20Western Europe . . . . . . . . . . . . . . . . . . . . . . . . . . . . . . . . . . . . . . . . . . . . . . . 39Central and Eastern Europe, Middle East and Africa . . . . . . . . . . . . . . . . . . . . . 21Latin America . . . . . . . . . . . . . . . . . . . . . . . . . . . . . . . . . . . . . . . . . . . . . . . . 28Asia Pacific . . . . . . . . . . . . . . . . . . . . . . . . . . . . . . . . . . . . . . . . . . . . . . . . . . 17
Total . . . . . . . . . . . . . . . . . . . . . . . . . . . . . . . . . . . . . . . . . . . . . . . . . . . . . 192
The Company owns 181 and leases 11 of these manufacturing and processing facilities. All of theCompany’s plants and properties are maintained in good condition, and the Company believes that theyare suitable and adequate for its present needs.
Included in the facilities above are sugar confectionery manufacturing facilities in Creston, IA,Chattanooga, TN, Brasov, Romania and Bridgend, United Kingdom that are part of the sale of the sugarconfectionery business that is expected to be completed in the second quarter of 2005. Also included inthe facilities above are facilities the closure or sale of which has been publicly announced but has not yetbeen completed.
As of December 31, 2004, the Company’s distribution facilities consisted of 356 distribution centersand depots worldwide. In North America, the Company had 331 distribution centers and depots, morethan 75% of which support the Company’s direct-store-delivery systems. Outside North America, theCompany had 25 distribution centers in nine countries. The Company owns 52 of these distributioncenters and two of these depots and leases 148 of these distribution centers and 154 of these depots.The Company believes that all of these facilities are in good condition and have sufficient capacity tomeet the Company’s distribution needs for the foreseeable future.
In January 2004, the Company announced a three-year restructuring program. As part of thisprogram, the Company anticipates the closing or sale of up to 20 plants. In 2004, the Companyannounced the closing of 13 plants as part of the restructuring program.
Item 3. Legal Proceedings.
Legal Proceedings
The Company is party to a variety of legal proceedings arising out of the normal course of business,including the matters discussed below. While the results of litigation cannot be predicted with certainty,
12
management believes that the final outcome of these proceedings will not have a material adverse effecton the Company’s consolidated financial position, results of operations or cash flows.
In October 2002, Mr. Mustapha Gaouar and five other family members (collectively ‘‘the Gaouars’’)filed suit in the Commercial Court of Casablanca against Kraft Foods Maroc and Mr. Omar Berradaclaiming damages of approximately $31 million arising from a non-compete undertaking signed byMr. Gaouar allegedly under duress. The non-compete clause was contained in an agreement concludedin 1986 between Mr. Gaouar and Mr. Berrada acting for himself and for his group of companies, includingLes Cafes Ennasr (renamed Kraft Foods Maroc), which was acquired by Kraft Foods International, Inc.from Mr. Berrada in 2001. In June 2003, the court issued a preliminary judgment against Kraft FoodsMaroc and Mr. Berrada holding that the Gaouars are entitled to damages for being deprived of thepossibility of engaging in coffee roasting from 1986 due to such non-compete undertaking. At that time,the court appointed two experts to assess the amount of damages to be awarded. In December 2003,these experts delivered a report concluding that they could see no evidence of loss suffered by theGaouars. The Gaouars asked the court that this report be set aside and new court experts be appointed.On April 15, 2004, the court delivered a judgment upholding the defenses of Kraft Foods Maroc andrejecting the claims of the Gaouars. The Gaouars have appealed this judgment. The existence of theclaims of Mr. Gaouar was not disclosed by Mr. Berrada at the time of the Kraft Foods International, Inc.acquisition of Kraft Foods Maroc in 2001. As a result, in the event that the Company is ultimately foundliable on appeal for damages to plaintiff in this case, the Company believes that it may have claimsagainst Mr. Berrada for recovery of all or a portion of the amount.
Environmental Matters
In May 2001, the State of Ohio notified the Company that it may be subject to an enforcement actionfor alleged past violations of the Company’s wastewater discharge permit at its production facility inFarmdale, Ohio. In December 2004, the Company finalized a monetary settlement with the State, whichwas approved by The Court of Common Pleas for Trumball County on January 3, 2005. The settlementamount is not material to the Company.
Item 4. Submission of Matters to a Vote of Security Holders.
None.
13
PART II
Item 5. Market for Registrant’s Common Equity, Related Stockholder Matters and IssuerPurchases of Equity Securities.
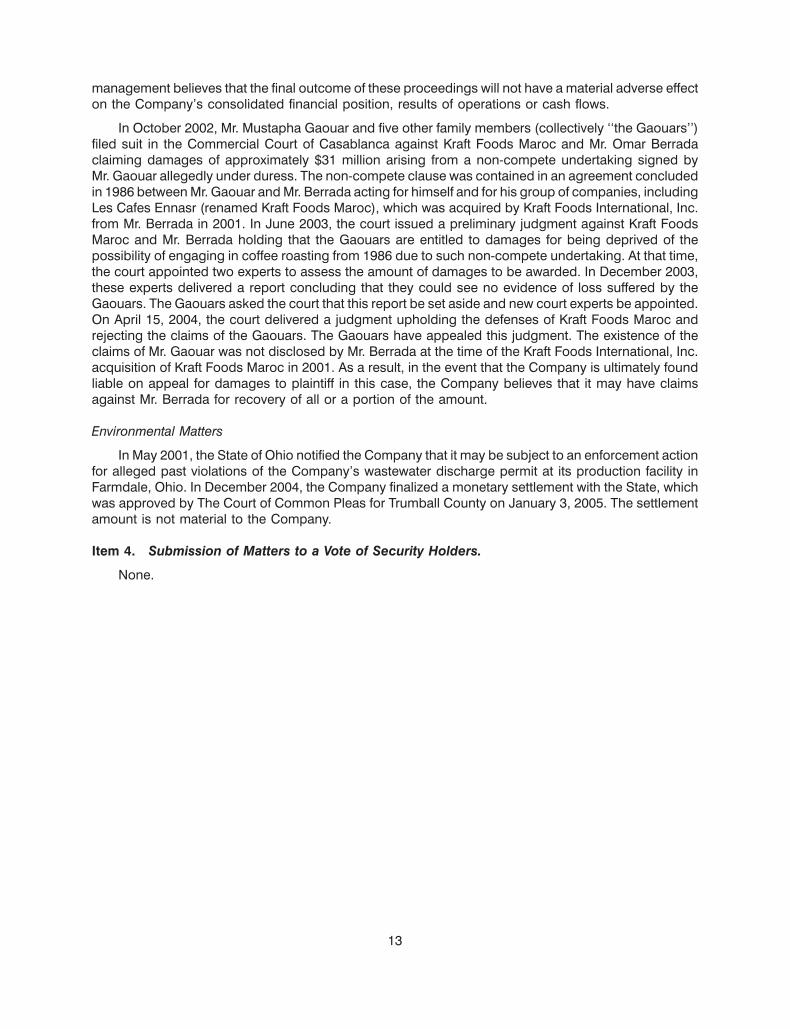
The Company’s share repurchase program activity for each of the three months endedDecember 31, 2004 was as follows:
Total Number of Approximate DollarShares Purchased Value of Shares that
Total Number of Average as Part of Publicly May Yet Be PurchasedShares Price Paid Announced Plans or Under the Plans or
Period Purchased per Share Programs(1)(2) Programs
October 1—October 31, 2004 . . . . . 1,080,000 $32.81 18,036,760 $ 127,065,722November 1—November 30, 2004 . . 2,660,000 $34.45 20,696,760 $ 35,424,688December 1—December 31, 2004 . . 2,430,500 $35.14 23,127,260 $1,450,013,506
For the Quarter EndedDecember 31, 2004 . . . . . . . . . . . 6,170,500 $34.44
(1) In December 2003, Kraft’s Board of Directors approved a share repurchase program of up to$700 million of its Class A common stock. On December 14, 2004, Kraft completed a multi-year$700 million Class A common stock repurchase program, acquiring 21,718,847 Class A shares atan average cost of $32.23 per share. From December 1, 2004 through December 14, 2004, Kraftacquired 1,022,087 shares at a cost of $35 million, or $34.66 per share, under this $700 millionprogram. On December 14, 2004, Kraft commenced repurchasing shares under a new $1.5 billionClass A common stock repurchase authority approved by its Board of Directors in December 2004.Through December 31, 2004, repurchases under the $1.5 billion program were 1,408,413 shares ata cost of $50 million, or $35.49 per share.
(2) Aggregate number of shares repurchased under the share repurchase programs as of the end ofthe period presented.
The other information called for by this Item is hereby incorporated by reference to the paragraphcaptioned ‘‘Quarterly Financial Data (Unaudited)’’ under Item 8 below.
The principal stock exchange on which the Company’s Class A common stock is listed is the NewYork Stock Exchange. At January 31, 2005, there were approximately 2,700 holders of record of theCompany’s Class A common stock.
14
Item 6. Selected Financial Data.
KRAFT FOODS INC.
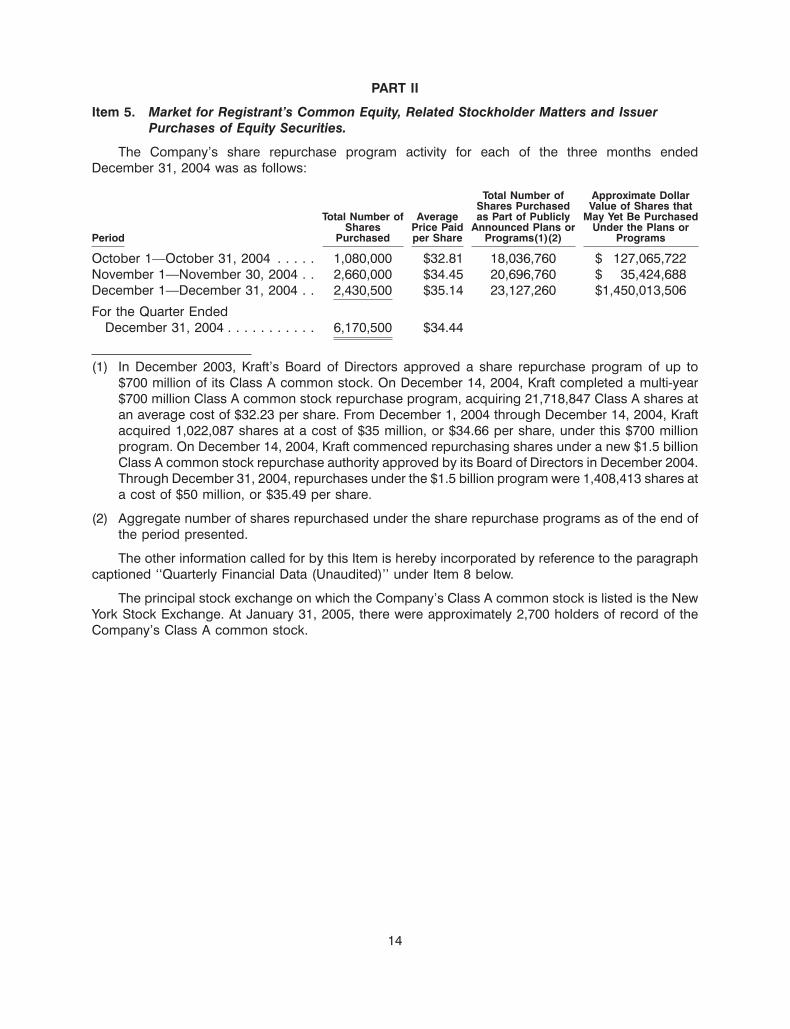
Selected Financial Data—Five Year Review (in millions of dollars, except per share data)
2004 2003 2002 2001 2000
Summary of Operations:Net revenues . . . . . . . . . . . . . . . . . . . . . $ 32,168 $ 30,498 $ 29,248 $ 28,731 $22,720Cost of sales . . . . . . . . . . . . . . . . . . . . . 20,281 18,531 17,463 17,310 13,872Operating income . . . . . . . . . . . . . . . . . . 4,612 5,860 5,961 4,717 3,933Interest and other debt expense, net . . . . . . 666 665 847 1,437 597Earnings from continuing operations, before
income taxes and minority interest . . . . . . 3,946 5,195 5,114 3,280 3,336Pre-tax profit margin from continuing
operations . . . . . . . . . . . . . . . . . . . . . . 12.3% 17.0% 17.5% 11.4% 14.7%Provision for income taxes . . . . . . . . . . . . 1,274 1,812 1,813 1,484 1,380Minority interest in earnings from continuing
operations, net . . . . . . . . . . . . . . . . . . . 3 4 4 — —(Loss) earnings from discontinued
operations, net of income taxes . . . . . . . (4) 97 97 86 45
Net earnings . . . . . . . . . . . . . . . . . . . . . . 2,665 3,476 3,394 1,882 2,001Basic EPS:
Continuing operations . . . . . . . . . . . . . . 1.56 1.95 1.90 1.12 1.35Discounted operations . . . . . . . . . . . . . . — 0.06 0.06 0.05 0.03Net earnings . . . . . . . . . . . . . . . . . . . . 1.56 2.01 1.96 1.17 1.38
Diluted EPS:Continuing operations . . . . . . . . . . . . . . 1.55 1.95 1.90 1.12 1.35Discontinued operations . . . . . . . . . . . . — 0.06 0.06 0.05 0.03Net earnings . . . . . . . . . . . . . . . . . . . . 1.55 2.01 1.96 1.17 1.38
Dividends declared per share . . . . . . . . . . 0.77 0.66 0.56 0.26 —Weighted average shares (millions)—Basic . 1,709 1,727 1,734 1,610 1,455Weighted average shares (millions)—Diluted 1,714 1,728 1,736 1,610 1,455
Capital expenditures . . . . . . . . . . . . . . . . 1,006 1,085 1,184 1,101 906Depreciation . . . . . . . . . . . . . . . . . . . . . . 868 804 709 680 499Property, plant and equipment, net . . . . . . . 9,985 10,155 9,559 9,109 9,405Inventories . . . . . . . . . . . . . . . . . . . . . . . 3,447 3,343 3,382 3,026 3,041Total assets . . . . . . . . . . . . . . . . . . . . . . 59,928 59,285 57,100 55,798 52,071Long-term debt . . . . . . . . . . . . . . . . . . . . 9,723 11,591 10,416 8,134 2,695Notes payable to Altria Group, Inc. and
affiliates . . . . . . . . . . . . . . . . . . . . . . . — — 2,560 5,000 21,407Total debt . . . . . . . . . . . . . . . . . . . . . . . . 12,518 13,462 14,443 16,007 25,826
Total deferred income taxes . . . . . . . . . . . . 5,101 5,175 4,917 4,565 942Shareholders’ equity . . . . . . . . . . . . . . . . 29,911 28,530 25,832 23,478 14,048Common dividends declared as a % of
Basic EPS . . . . . . . . . . . . . . . . . . . . . . 49.4% 32.8% 28.6% 22.2% —Common dividends declared as a % of
Diluted EPS . . . . . . . . . . . . . . . . . . . . . 49.7% 32.8% 28.6% 22.2% —Book value per common share outstanding . 17.54 16.57 14.92 13.53 9.65Market price per Class A common share—
high/low . . . . . . . . . . . . . . . . . . . . . . . 36.06-29.45 39.40-26.35 43.95-32.50 35.57-29.50 —
Closing price of Class A common share atyear end . . . . . . . . . . . . . . . . . . . . . . . 35.61 32.22 38.93 34.03 —
Price/earnings ratio at year end—Basic . . . . 23 16 20 29 —Price/earnings ratio at year end—Diluted . . . 23 16 20 29 —Number of common shares outstanding at
year end (millions) . . . . . . . . . . . . . . . . 1,705 1,722 1,731 1,735 1,455Number of employees . . . . . . . . . . . . . . . 98,000 106,000 109,000 114,000 117,000
15
Item 7. Management’s Discussion and Analysis of Financial Condition and Results ofOperation.
MANAGEMENT’S DISCUSSION AND ANALYSIS OFFINANCIAL CONDITION AND RESULTS OF OPERATIONS
Description of the Company
The Company manufactures and markets packaged food products, consisting principally ofbeverages, cheese, snacks, convenient meals and various packaged grocery products. Kraft managesand reports operating results through two units, Kraft North America Commercial and Kraft InternationalCommercial. Reportable segments for Kraft North America Commercial are organized and managedprincipally by product category. Kraft International Commercial’s operations are organized andmanaged by geographic location. At December 31, 2004, Altria Group, Inc. held 98.0% of the combinedvoting power of Kraft’s outstanding capital stock and owned 85.4% of the outstanding shares of Kraft’scapital stock.
On November 15, 2004, the Company announced the sale of substantially all of its sugarconfectionery business for approximately $1.5 billion. The transaction, which is subject to regulatoryapproval, is expected to be completed in the second quarter of 2005. The Company has reflected theresults of its sugar confectionery business as discontinued operations on the consolidated statements ofearnings for all years presented. Accordingly, historical statements of earnings amounts included inManagement’s Discussion and Analysis of Financial Condition and Results of Operations have beenrestated to reflect the discontinued operation. The assets related to the sugar confectionery businesswere reflected as assets of discontinued operations held for sale on the consolidated balance sheet atDecember 31, 2004.
During January 2004, the Company announced a new global organization structure, which resultedin new segments. During the fourth quarter of 2004, following the sale of its sugar confectionerybusiness, the Company realigned its North American segments. Kraft North America Commercial’s newsegments, which are reflected in this Management’s Discussion and Analysis, are U.S. Beverages;U.S. Cheese, Canada & North America Foodservice; U.S. Convenient Meals; U.S. Grocery; andU.S. Snacks & Cereals. Kraft International Commercial’s segments are Europe, Middle East & Africa; andLatin America & Asia Pacific. The new segment structure in North America reflects a shift of certaindivisions and brands between segments to more closely align these businesses to consumer sectors, toprovide more focus on the separate beverage and grocery businesses, and to benefit from synergies ingrain based products. Historical data have been restated to reflect the new segment structure.
Executive Summary
The following executive summary is intended to provide significant highlights of the Discussion andAnalysis that follows.
Consolidated Operating Results—The changes in the Company’s earnings from continuingoperations and diluted earnings per share (‘‘EPS’’) from continuing operations for the year ended
16
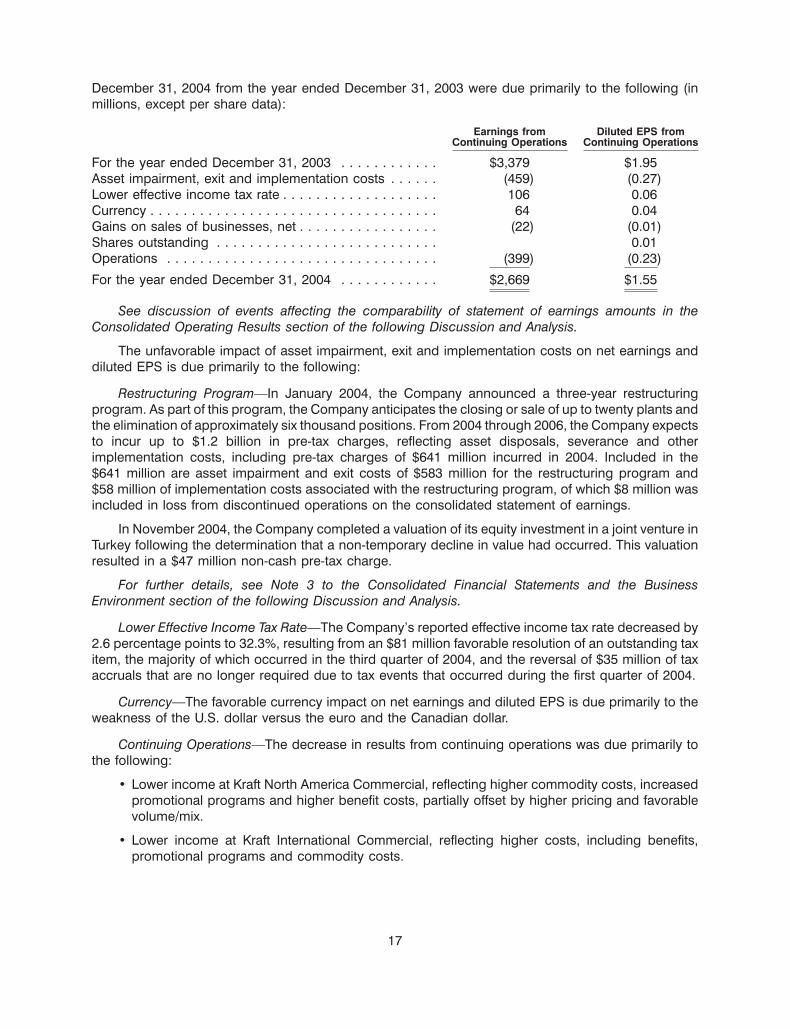
December 31, 2004 from the year ended December 31, 2003 were due primarily to the following (inmillions, except per share data):
Earnings from Diluted EPS fromContinuing Operations Continuing Operations
For the year ended December 31, 2003 . . . . . . . . . . . . $3,379 $1.95Asset impairment, exit and implementation costs . . . . . . (459) (0.27)Lower effective income tax rate . . . . . . . . . . . . . . . . . . . 106 0.06Currency . . . . . . . . . . . . . . . . . . . . . . . . . . . . . . . . . . . 64 0.04Gains on sales of businesses, net . . . . . . . . . . . . . . . . . (22) (0.01)Shares outstanding . . . . . . . . . . . . . . . . . . . . . . . . . . . 0.01Operations . . . . . . . . . . . . . . . . . . . . . . . . . . . . . . . . . (399) (0.23)
For the year ended December 31, 2004 . . . . . . . . . . . . $2,669 $1.55
See discussion of events affecting the comparability of statement of earnings amounts in theConsolidated Operating Results section of the following Discussion and Analysis.
The unfavorable impact of asset impairment, exit and implementation costs on net earnings anddiluted EPS is due primarily to the following:
Restructuring Program—In January 2004, the Company announced a three-year restructuringprogram. As part of this program, the Company anticipates the closing or sale of up to twenty plants andthe elimination of approximately six thousand positions. From 2004 through 2006, the Company expectsto incur up to $1.2 billion in pre-tax charges, reflecting asset disposals, severance and otherimplementation costs, including pre-tax charges of $641 million incurred in 2004. Included in the$641 million are asset impairment and exit costs of $583 million for the restructuring program and$58 million of implementation costs associated with the restructuring program, of which $8 million wasincluded in loss from discontinued operations on the consolidated statement of earnings.
In November 2004, the Company completed a valuation of its equity investment in a joint venture inTurkey following the determination that a non-temporary decline in value had occurred. This valuationresulted in a $47 million non-cash pre-tax charge.
For further details, see Note 3 to the Consolidated Financial Statements and the BusinessEnvironment section of the following Discussion and Analysis.
Lower Effective Income Tax Rate—The Company’s reported effective income tax rate decreased by2.6 percentage points to 32.3%, resulting from an $81 million favorable resolution of an outstanding taxitem, the majority of which occurred in the third quarter of 2004, and the reversal of $35 million of taxaccruals that are no longer required due to tax events that occurred during the first quarter of 2004.
Currency—The favorable currency impact on net earnings and diluted EPS is due primarily to theweakness of the U.S. dollar versus the euro and the Canadian dollar.
Continuing Operations—The decrease in results from continuing operations was due primarily tothe following:
• Lower income at Kraft North America Commercial, reflecting higher commodity costs, increasedpromotional programs and higher benefit costs, partially offset by higher pricing and favorablevolume/mix.
• Lower income at Kraft International Commercial, reflecting higher costs, including benefits,promotional programs and commodity costs.
17
For further details, see the Consolidated Operating Results and Operating Results by BusinessSegment sections of the following Discussion and Analysis.
2005 Forecasted Results—In January 2005, the Company announced that it expects 2005 full-yeardiluted EPS from net earnings in a range of $1.60 to $1.65. This forecast includes anticipated charges of$0.18 for costs related to its restructuring program and $0.12 in one-time impacts upon completion ofdivestitures, and reflects approximately $0.04 in ongoing dilution from divestitures. The Company alsoannounced that it expects 2005 full-year diluted EPS on a continuing operations basis in a range of $1.75to $1.80. The factors described in the section entitled Forward-Looking and Cautionary Statements inPart I, Item 1 of this Annual Report on Form 10-K represent continuing risks to these forecasts.
Discussion and Analysis
Critical Accounting Policies and Estimates
Note 2 to the consolidated financial statements includes a summary of the significant accountingpolicies and methods used in the preparation of the Company’s consolidated financial statements. Inmost instances, the Company must use an accounting policy or method because it is the only policy ormethod permitted under accounting principles generally accepted in the United States of America(‘‘U.S. GAAP’’).
The preparation of all financial statements includes the use of estimates and assumptions that affecta number of amounts included in the Company’s financial statements, including, among other things,employee benefit costs and income taxes. The Company bases its estimates on historical experienceand other assumptions that it believes are reasonable. If actual amounts are ultimately different fromprevious estimates, the revisions are included in the Company’s consolidated results of operations forthe period in which the actual amounts become known. Historically, the aggregate differences, if any,between the Company’s estimates and actual amounts in any year have not had a significant impact onthe Company’s consolidated financial statements.
The selection and disclosure of the Company’s critical accounting policies and estimates have beendiscussed with the Company’s Audit Committee. The following is a review of the more significantassumptions and estimates, as well as the accounting policies and methods used in the preparation ofthe Company’s consolidated financial statements:
Employee Benefit Plans. As discussed in Note 15 to the consolidated financial statements, theCompany provides a range of benefits to its employees and retired employees, including pensions,postretirement health care benefits and postemployment benefits (primarily severance). The Companyrecords amounts relating to these plans based on calculations specified by U.S. GAAP, which includevarious actuarial assumptions, such as discount rates, assumed rates of return on plan assets,compensation increases, turnover rates and health care cost trend rates. The Company reviews itsactuarial assumptions on an annual basis and makes modifications to the assumptions based on currentrates and trends when it is deemed appropriate to do so. As permitted by U.S. GAAP, the effect of themodifications is generally amortized over future periods. The Company believes that the assumptionsutilized in recording its obligations under its plans, which are presented in Note 15 to the consolidatedfinancial statements, are reasonable based on its experience and advice from its actuaries.
18
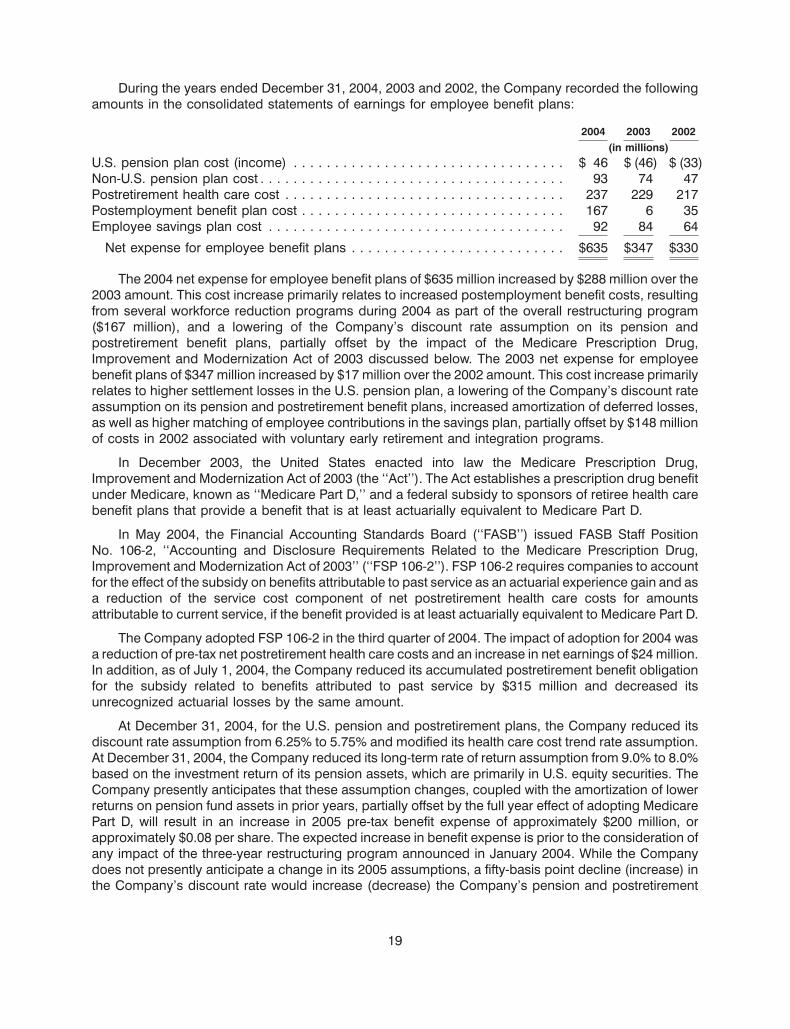
During the years ended December 31, 2004, 2003 and 2002, the Company recorded the followingamounts in the consolidated statements of earnings for employee benefit plans:
2004 2003 2002(in millions)
U.S. pension plan cost (income) . . . . . . . . . . . . . . . . . . . . . . . . . . . . . . . . . $ 46 $ (46) $ (33)Non-U.S. pension plan cost . . . . . . . . . . . . . . . . . . . . . . . . . . . . . . . . . . . . . 93 74 47Postretirement health care cost . . . . . . . . . . . . . . . . . . . . . . . . . . . . . . . . . . 237 229 217Postemployment benefit plan cost . . . . . . . . . . . . . . . . . . . . . . . . . . . . . . . . 167 6 35Employee savings plan cost . . . . . . . . . . . . . . . . . . . . . . . . . . . . . . . . . . . . 92 84 64
Net expense for employee benefit plans . . . . . . . . . . . . . . . . . . . . . . . . . . $635 $347 $330
The 2004 net expense for employee benefit plans of $635 million increased by $288 million over the2003 amount. This cost increase primarily relates to increased postemployment benefit costs, resultingfrom several workforce reduction programs during 2004 as part of the overall restructuring program($167 million), and a lowering of the Company’s discount rate assumption on its pension andpostretirement benefit plans, partially offset by the impact of the Medicare Prescription Drug,Improvement and Modernization Act of 2003 discussed below. The 2003 net expense for employeebenefit plans of $347 million increased by $17 million over the 2002 amount. This cost increase primarilyrelates to higher settlement losses in the U.S. pension plan, a lowering of the Company’s discount rateassumption on its pension and postretirement benefit plans, increased amortization of deferred losses,as well as higher matching of employee contributions in the savings plan, partially offset by $148 millionof costs in 2002 associated with voluntary early retirement and integration programs.
In December 2003, the United States enacted into law the Medicare Prescription Drug,Improvement and Modernization Act of 2003 (the ‘‘Act’’). The Act establishes a prescription drug benefitunder Medicare, known as ‘‘Medicare Part D,’’ and a federal subsidy to sponsors of retiree health carebenefit plans that provide a benefit that is at least actuarially equivalent to Medicare Part D.
In May 2004, the Financial Accounting Standards Board (‘‘FASB’’) issued FASB Staff PositionNo. 106-2, ‘‘Accounting and Disclosure Requirements Related to the Medicare Prescription Drug,Improvement and Modernization Act of 2003’’ (‘‘FSP 106-2’’). FSP 106-2 requires companies to accountfor the effect of the subsidy on benefits attributable to past service as an actuarial experience gain and asa reduction of the service cost component of net postretirement health care costs for amountsattributable to current service, if the benefit provided is at least actuarially equivalent to Medicare Part D.
The Company adopted FSP 106-2 in the third quarter of 2004. The impact of adoption for 2004 wasa reduction of pre-tax net postretirement health care costs and an increase in net earnings of $24 million.In addition, as of July 1, 2004, the Company reduced its accumulated postretirement benefit obligationfor the subsidy related to benefits attributed to past service by $315 million and decreased itsunrecognized actuarial losses by the same amount.
At December 31, 2004, for the U.S. pension and postretirement plans, the Company reduced itsdiscount rate assumption from 6.25% to 5.75% and modified its health care cost trend rate assumption.At December 31, 2004, the Company reduced its long-term rate of return assumption from 9.0% to 8.0%based on the investment return of its pension assets, which are primarily in U.S. equity securities. TheCompany presently anticipates that these assumption changes, coupled with the amortization of lowerreturns on pension fund assets in prior years, partially offset by the full year effect of adopting MedicarePart D, will result in an increase in 2005 pre-tax benefit expense of approximately $200 million, orapproximately $0.08 per share. The expected increase in benefit expense is prior to the consideration ofany impact of the three-year restructuring program announced in January 2004. While the Companydoes not presently anticipate a change in its 2005 assumptions, a fifty-basis point decline (increase) inthe Company’s discount rate would increase (decrease) the Company’s pension and postretirement
19
expense by approximately $65 million. Similarly, a fifty-basis point decrease (increase) in the expectedreturn on plan assets would increase (decrease) the Company’s pension expense for the U.S. pensionplans by approximately $31 million. See Note 15 to the consolidated financial statements for a sensitivitydiscussion of the assumed health care cost trend rates.
Revenue Recognition. As required by U.S. GAAP, the Company recognizes revenues, net of salesincentives, and including shipping and handling charges billed to customers, upon shipment of goodswhen title and risk of loss pass to customers. Shipping and handling costs are classified as part of cost ofsales. Provisions and allowances for estimated sales returns and bad debts are also recorded in theCompany’s consolidated financial statements. The amounts recorded for these provisions and relatedallowances are not significant to the Company’s consolidated financial position or results of operations.
Depreciation, Amortization and Goodwill Valuation. The Company depreciates property, plant andequipment and amortizes definite life intangibles using straight-line methods over the estimated usefullives of the assets.
The Company is required to conduct an annual review of goodwill and intangible assets for potentialimpairment. Goodwill impairment testing requires a comparison between the carrying value and fairvalue of each reporting unit. If the carrying value exceeds the fair value, goodwill is considered impaired.The amount of impairment loss is measured as the difference between the carrying value and implied fairvalue of goodwill, which is determined using discounted cash flows. Impairment testing fornon-amortizable intangible assets requires a comparison between fair value and carrying value of theintangible asset. If the carrying value exceeds fair value, the intangible asset is considered impaired andis reduced to fair value. These calculations may be affected by the market conditions noted below in theBusiness Environment section, as well as interest rates and general economic conditions. During 2004,the Company completed its annual review of goodwill and intangible assets. This review resulted in a$29 million non-cash pre-tax charge related to intangible asset impairments for a small confectionerybusiness in the United States and certain brands in Mexico. A portion of this charge, $12 million, wasrecorded as asset impairment and exit costs on the consolidated statement of earnings. The remainderof the charge, $17 million, is included in discontinued operations.
Impairment of Long-Lived Assets. The Company reviews long-lived assets, including amortizableintangible assets, for impairment whenever events or changes in business circumstances indicate thatthe carrying amount of the assets may not be fully recoverable. The Company performs undiscountedoperating cash flow analyses to determine if an impairment exists. For purposes of recognition andmeasurement of an impairment for assets held for use, the Company groups assets and liabilities at thelowest level for which cash flows are separately identifiable. If an impairment is determined to exist, anyrelated impairment loss is calculated based on fair value. Impairment losses on assets to be disposed of,if any, are based on the estimated proceeds to be received, less costs of disposal.
Marketing and Advertising Costs. As required by U.S. GAAP, the Company records marketingcosts as an expense in the year to which such costs relate. The Company does not defer amounts on itsyear-end consolidated balance sheet with respect to marketing costs. The Company expensesadvertising costs as incurred. Consumer incentive and trade promotion activities are recorded as areduction of revenues based on amounts estimated as being due to customers and consumers at theend of a period, based principally on historical utilization and redemption rates. For interim reportingpurposes, advertising and consumer incentive expenses are charged to operations as a percentage ofvolume, based on estimated volume and related expense for the full year.
Related Party Transactions. As discussed in Note 4 to the consolidated financial statements, AltriaGroup, Inc.’s subsidiary, Altria Corporate Services, Inc., provides the Company with various services,including planning, legal, treasury, accounting, auditing, insurance, human resources, office of thesecretary, corporate affairs, information technology, aviation and tax services. Billings for these services,
20
which were based on the cost to Altria Corporate Services, Inc. to provide such services and amanagement fee, were $310 million, $318 million and $327 million for the years ended December 31,2004, 2003 and 2002, respectively. These costs were paid to Altria Corporate Services, Inc. monthly.Although the cost of these services cannot be quantified on a stand-alone basis, management hasassessed that the billings are reasonable based on the level of support provided by Altria CorporateServices, Inc., and that they reflect all services provided. The cost and nature of the services arereviewed annually by the Company’s Audit Committee, which is comprised of independent directors.The effects of these transactions are included in operating cash flows in the Company’s consolidatedstatements of cash flows.
In December 2004, the Company purchased two corporate aircraft from Altria CorporateServices, Inc. for an aggregate purchase price of approximately $47 million. The Company also enteredinto an Aircraft Management Agreement with Altria Corporate Services, Inc. in December 2004, pursuantto which Altria Corporate Services, Inc. agreed to perform aircraft management, pilot services,maintenance and other aviation services for the Company.
During 2004, Altria Corporate Services, Inc. provided to the Company certain financial services,including payroll and accounts payable processing, at a cost of approximately $25 million, which wasincluded in the $310 million charge shown above. Beginning in 2005, the Company will perform thesefunctions for itself at a similar cost.
At December 31, 2004 and 2003, the Company had short-term amounts payable to AltriaGroup, Inc. of $227 million and $543 million, respectively. Interest on these borrowings is based on theapplicable London Interbank Offered Rate.
Income Taxes. The Company accounts for income taxes in accordance with Statement ofFinancial Accounting Standards (‘‘SFAS’’) No. 109, ‘‘Accounting for Income Taxes.’’ The accounts of theCompany are included in the consolidated federal income tax return of Altria Group, Inc. Income taxesare generally computed on a separate company basis. To the extent that foreign tax credits, capitallosses and other credits generated by the Company, which cannot currently be utilized on a separatecompany basis, are utilized in Altria Group, Inc.’s consolidated federal income tax return, the benefit isrecognized in the calculation of the Company’s provision for income taxes. Based on the Company’scurrent estimate, this benefit is calculated to be approximately $70 million, $100 million and $240 millionfor the years ended December 31, 2004, 2003 and 2002, respectively. The benefit is dependent on avariety of tax attributes that have a tendency to vary year to year. The Company makes payments to, or isreimbursed by, Altria Group, Inc. for the tax effects resulting from its inclusion in Altria Group, Inc.’sconsolidated federal income tax return. The provision for income taxes is based on domestic andinternational statutory income tax rates and tax planning opportunities available to the Company in thejurisdictions in which it operates. Significant judgment is required in determining income tax provisionsand in evaluating tax positions. The Company establishes additional provisions for income taxes when,despite the belief that existing tax positions are fully supportable, there remain certain positions that arelikely to be challenged and that may not be sustained on review by tax authorities. The Company adjuststhese additional accruals in light of changing facts and circumstances. The consolidated tax provisionincludes the impact of changes to accruals that are considered appropriate, as well as the related netinterest. If the Company’s filing positions are ultimately upheld under audits by respective taxingauthorities, it is possible that the provision for income taxes in future years may reflect favorableadjustments.
On October 22, 2004, the American Jobs Creation Act (‘‘the Jobs Act’’) was signed into law. TheJobs Act provides for a deduction of 85% of certain foreign earnings that are repatriated. The Companymay elect to apply this provision to qualifying earnings repatriations in 2005 and is conducting analysesof its effects. The U.S. Treasury Department recently provided additional clarifying language on keyelements of the provision, which is under consideration as part of the Company’s evaluation. The
21
Company expects to complete its evaluation of the effects of the repatriation provision within areasonable period of time. The Company does not expect the repatriation provisions of the Jobs Act tohave a significant impact on its consolidated results of operations or its consolidated cash flows.
The Jobs Act also provides tax relief to U.S. domestic manufacturers by providing a tax deduction ofup to 9% of the lesser of ‘‘qualified production activities income’’ or taxable income. In December 2004,the FASB issued FASB Staff Position 109-1, ‘‘Application of FASB Statement No. 109, ‘Accounting forIncome Taxes,’ to the Tax Deduction on Qualified Production Activities Provided by the American JobsCreation Act of 2004’’ (‘‘FSP 109-1’’). FSP 109-1 requires companies to account for this deduction as a‘‘special deduction’’ rather than a rate reduction, in accordance with SFAS No. 109, and therefore, theCompany will recognize these benefits, which are not expected to be significant, in the year earned.
Consolidation. The consolidated financial statements include Kraft Foods Inc., as well as itswholly-owned and majority-owned subsidiaries. Investments in which Kraft Foods Inc. exercisessignificant influence (20%—50% ownership interest), are accounted for under the equity method ofaccounting. Investments in which Kraft Foods Inc. has an ownership interest of less than 20%, or doesnot exercise significant influence, are accounted for with the cost method of accounting. Allintercompany transactions and balances have been eliminated.
Business Environment
The Company is subject to a number of challenges that may adversely affect its businesses. Thesechallenges, which are discussed below and under the ‘‘Forward-Looking and Cautionary Statements’’section in Part I, Item 1 of this Annual Report on Form 10-K, include:
• fluctuations in commodity prices;
• movements of foreign currencies;
• competitive challenges in various products and markets, including price gaps with competitorproducts and the increasing price-consciousness of consumers;
• a rising cost environment;
• a trend toward increasing consolidation in the retail trade and consequent pricing pressure andinventory reductions;
• a growing presence of hard discount retailers, primarily in Europe, with an emphasis on own-labelproducts;
• changing consumer preferences, including diet trends;
• competitors with different profit objectives and less susceptibility to currency exchange rates; and
• concerns and/or regulations regarding food safety, quality and health, including geneticallymodified organisms, trans-fatty acids and obesity. Increased government regulation of the foodindustry could result in increased costs to the Company.
Fluctuations in commodity prices can lead to retail price volatility and intense price competition, andcan influence consumer and trade buying patterns. During 2004, the Company’s commodity costs onaverage have been higher than those incurred in 2003 (most notably dairy, coffee, meat, nuts, energyand packaging), and have adversely affected earnings. Dairy costs rose to historical highs during thefirst half of 2004, but have moderated during the second half of 2004. For 2004, the Company had anegative pre-tax impact from all commodities of approximately $930 million as compared with 2003.
In the ordinary course of business, the Company is subject to many influences that can impact thetiming of sales to customers, including the timing of holidays and other annual or special events,seasonality of certain products, significant weather conditions, timing of Company and customer
22
incentive programs, customer inventory programs, Company initiatives to improve supply chainefficiency, including efforts to align product shipments more closely with consumption by shifting someof its customer marketing programs to a consumption based approach, financial situations of customersand general economic conditions.
To build its business while confronting these challenges, the Company operates with sevenbusiness strategies: 1) build superior consumer brand value; 2) build shopper demand through superiorcustomer collaboration; 3) transform the portfolio; 4) expand global scale; 5) drive out costs and assets;6) strengthen employee and organizational excellence; and 7) act responsibly.
The first strategy—to build superior consumer brand value—involves improving the Company’sproducts, using more value-added packaging, developing innovative new products and managing pricegaps effectively. During 2004, the Company increased marketing spending by approximately$460 million versus 2003 to manage price gaps, to increase media presence, to drive growth, toenhance brand equity and to support new products.
The second strategy—to build shopper demand through superior customer collaboration—recognizes the importance of the Company’s retail partners in fulfilling its vision. The Company workstogether with its customers to better understand consumer behavior in their stores, to develop in-storeprograms that increase shopper demand, and to reduce costs through more efficient store deliverysystems.
The third strategy is to transform the portfolio. Through innovation, investment, acquisition anddivestiture, the Company is accelerating the shift in its portfolio toward businesses—whether global,regional or local—that offer the Company a sustainable competitive advantage, and will better enable itsmanagement to focus on opportunities that meet consumer needs and create long-term value for theCompany.
In particular, the Company is responding to growing consumer demand for products that meethealth and wellness and convenience needs. The Company is enhancing the nutrition profile of itsportfolio by creating new products and by reformulating existing products, including reducing oreliminating trans-fat wherever possible. The Company is addressing convenience needs by offeringmore convenient packaging, such as single-serve and resealable packaging, and products requiringreduced preparation.
The fourth strategy—to expand the Company’s global scale—focuses on improving its growthprospects in key developing markets that offer the greatest growth potential. In particular, the Companyis expanding its marketing and infrastructure investments in large, growing markets, such as China,Brazil, Mexico and Russia.
The fifth strategy—to drive out costs and assets—includes the Company’s announced three-yearrestructuring program, with the objectives of realigning and lowering its cost structure and optimizingcapacity utilization. As part of this program (which is discussed further in Note 3 to the consolidatedfinancial statements), the Company anticipates the closing or sale of up to twenty plants and theelimination of approximately six thousand positions. From 2004 through 2006, the Company expects toincur up to $1.2 billion in pre-tax charges, reflecting asset disposals, severance and otherimplementation costs, including $641 million incurred in 2004. Approximately one-half of the pre-taxcharges are expected to require cash payments.
In addition, the Company expects to incur approximately $140 million in capital expenditures from2004 through 2006 to implement the restructuring program, including $46 million spent in 2004. Costsavings as a result of the restructuring program were approximately $127 million in 2004, are expected toincrease by an incremental amount between $120 million and $140 million in 2005, and are anticipatedto reach annualized cost savings of approximately $400 million by 2006, all of which are expected to beused in supporting brand-building initiatives.
23
The sixth strategy—to strengthen employee and organizational excellence—reflects the need todevelop organizational capabilities and support employees in meeting the Company’s businesschallenges, wherever they work. In this regard, during 2004 the Company completed a reorganizationand resource alignment for a new global structure. In addition, a new vision for the organization—to helppeople around the world eat and live better—was introduced, while human resource policies, processesand practices were harmonized across the Company.
The final strategy is to act responsibly. As the Company strives for sustainable growth, it seeksbusiness success in ways that honor ethical and legal standards and that respect people, communitiesand the natural environment. This strategy includes a commitment to strong compliance and integrityprograms and sound corporate governance, as well as a number of health and wellness initiatives, suchas enhanced nutrition labeling, the development and funding of community-based programs andvoluntary limitations on advertising to younger children. It also includes taking steps to contribute to thesustainability of the Company’s agricultural supply base through several programs with respectedinternational and local partners. The Company outlines its commitment to corporate responsibility in theKraft Code of Conduct for employees and at www.kraft.com/responsibility/home.aspx.
Acquisitions and Dispositions:
One element of the third strategy is to strengthen the Company’s brand portfolios throughdisciplined programs of selective acquisitions and divestitures. The Company is constantly reviewingpotential acquisition candidates and from time to time sells businesses to accelerate the shift in itsportfolio toward businesses—whether global, regional or local—that offer the Company a sustainablecompetitive advantage. The impact of any future acquisition or divestiture could have a material impacton the Company’s consolidated financial position, results of operations or cash flows.
On November 15, 2004, the Company announced the sale of substantially all of its sugarconfectionery business for approximately $1.5 billion. The proposed sale includes the Life Savers,Creme Savers, Altoids, Trolli and Sugus brands. The transaction, which is subject to regulatory approval,is expected to be completed in the second quarter of 2005. The Company has reflected the results of itssugar confectionery business as discontinued operations on the consolidated statements of earningsfor all years presented. The assets related to the sugar confectionery business were reflected as assetsof discontinued operations held for sale on the consolidated balance sheet at December 31, 2004. Inaddition, the Company anticipates additional tax expense of approximately $270 million to be recordedas a loss on sale of discontinued operations in 2005. In accordance with the provisions of SFAS No. 109,the tax expense will be recorded when the transaction is consummated.
During 2004, the Company acquired a U.S.-based beverage business for a total cost of $137 million.During 2003, the Company acquired a biscuits business in Egypt and trademarks associated with asmall U.S.-based natural foods business. The total cost of these and other smaller acquisitions was$98 million. During 2002, the Company acquired a snacks business in Turkey and a biscuits business inAustralia. The total cost of these and other smaller acquisitions was $122 million.
During 2004, the Company sold a Brazilian snack nuts business and trademarks associated with acandy business in Norway. The aggregate proceeds received from the sale of these businesses were$18 million, on which pre-tax losses of $3 million were recorded. In December 2004, the Companyannounced the sale of its U.K. desserts business for approximately $135 million, which is expected toresult in an estimated gain of $0.04 per share. The transaction closed in the first quarter of 2005. TheCompany also announced in December 2004, the sale of its yogurt business for approximately$59 million, which is expected to result in an after-tax loss of approximately $12 million ($5 million in2004, with the remainder at closing). The transaction, which is also subject to regulatory approval, isexpected to be completed in the first quarter of 2005.
24
During 2003, the Company sold a European rice business and a branded fresh cheese business inItaly. The aggregate proceeds received from sales of businesses were $96 million, on which theCompany recorded pre-tax gains of $31 million.
During 2002, the Company sold several small North American food businesses, some of which hadbeen previously classified as businesses held for sale arising from the acquisition of Nabisco. Inaddition, the Company sold its Latin American yeast and industrial bakery ingredients business forapproximately $110 million and recorded a pre-tax gain of $69 million. The aggregate proceeds receivedfrom sales of businesses were $219 million, on which the Company recorded pre-tax gains of$80 million.
The operating results of the businesses acquired and sold, excluding the sugar confectionerybusiness, were not material to the Company’s consolidated financial position, results of operations orcash flows in any of the periods presented.
25
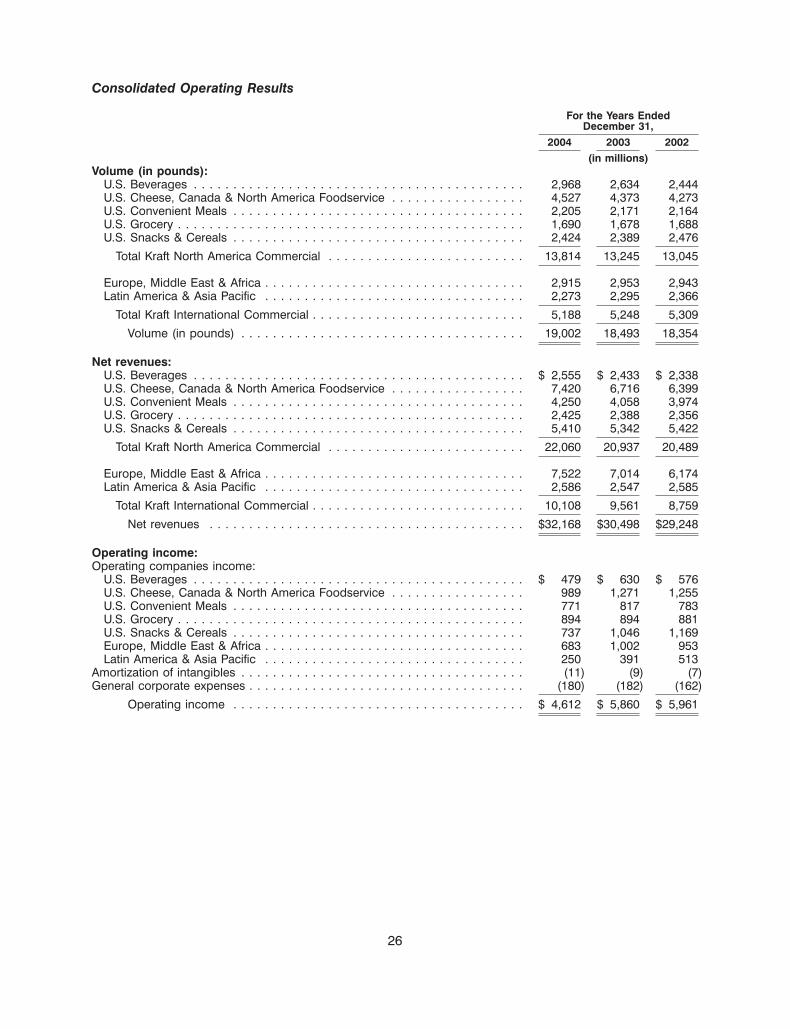
Consolidated Operating Results
For the Years EndedDecember 31,
2004 2003 2002(in millions)
Volume (in pounds):U.S. Beverages . . . . . . . . . . . . . . . . . . . . . . . . . . . . . . . . . . . . . . . . . . 2,968 2,634 2,444U.S. Cheese, Canada & North America Foodservice . . . . . . . . . . . . . . . . . 4,527 4,373 4,273U.S. Convenient Meals . . . . . . . . . . . . . . . . . . . . . . . . . . . . . . . . . . . . . 2,205 2,171 2,164U.S. Grocery . . . . . . . . . . . . . . . . . . . . . . . . . . . . . . . . . . . . . . . . . . . . 1,690 1,678 1,688U.S. Snacks & Cereals . . . . . . . . . . . . . . . . . . . . . . . . . . . . . . . . . . . . . 2,424 2,389 2,476
Total Kraft North America Commercial . . . . . . . . . . . . . . . . . . . . . . . . . 13,814 13,245 13,045
Europe, Middle East & Africa . . . . . . . . . . . . . . . . . . . . . . . . . . . . . . . . . 2,915 2,953 2,943Latin America & Asia Pacific . . . . . . . . . . . . . . . . . . . . . . . . . . . . . . . . . 2,273 2,295 2,366
Total Kraft International Commercial . . . . . . . . . . . . . . . . . . . . . . . . . . . 5,188 5,248 5,309
Volume (in pounds) . . . . . . . . . . . . . . . . . . . . . . . . . . . . . . . . . . . . 19,002 18,493 18,354
Net revenues:U.S. Beverages . . . . . . . . . . . . . . . . . . . . . . . . . . . . . . . . . . . . . . . . . . $ 2,555 $ 2,433 $ 2,338U.S. Cheese, Canada & North America Foodservice . . . . . . . . . . . . . . . . . 7,420 6,716 6,399U.S. Convenient Meals . . . . . . . . . . . . . . . . . . . . . . . . . . . . . . . . . . . . . 4,250 4,058 3,974U.S. Grocery . . . . . . . . . . . . . . . . . . . . . . . . . . . . . . . . . . . . . . . . . . . . 2,425 2,388 2,356U.S. Snacks & Cereals . . . . . . . . . . . . . . . . . . . . . . . . . . . . . . . . . . . . . 5,410 5,342 5,422
Total Kraft North America Commercial . . . . . . . . . . . . . . . . . . . . . . . . . 22,060 20,937 20,489
Europe, Middle East & Africa . . . . . . . . . . . . . . . . . . . . . . . . . . . . . . . . . 7,522 7,014 6,174Latin America & Asia Pacific . . . . . . . . . . . . . . . . . . . . . . . . . . . . . . . . . 2,586 2,547 2,585
Total Kraft International Commercial . . . . . . . . . . . . . . . . . . . . . . . . . . . 10,108 9,561 8,759
Net revenues . . . . . . . . . . . . . . . . . . . . . . . . . . . . . . . . . . . . . . . . $32,168 $30,498 $29,248
Operating income:Operating companies income:
U.S. Beverages . . . . . . . . . . . . . . . . . . . . . . . . . . . . . . . . . . . . . . . . . . $ 479 $ 630 $ 576U.S. Cheese, Canada & North America Foodservice . . . . . . . . . . . . . . . . . 989 1,271 1,255U.S. Convenient Meals . . . . . . . . . . . . . . . . . . . . . . . . . . . . . . . . . . . . . 771 817 783U.S. Grocery . . . . . . . . . . . . . . . . . . . . . . . . . . . . . . . . . . . . . . . . . . . . 894 894 881U.S. Snacks & Cereals . . . . . . . . . . . . . . . . . . . . . . . . . . . . . . . . . . . . . 737 1,046 1,169Europe, Middle East & Africa . . . . . . . . . . . . . . . . . . . . . . . . . . . . . . . . . 683 1,002 953Latin America & Asia Pacific . . . . . . . . . . . . . . . . . . . . . . . . . . . . . . . . . 250 391 513
Amortization of intangibles . . . . . . . . . . . . . . . . . . . . . . . . . . . . . . . . . . . . (11) (9) (7)General corporate expenses . . . . . . . . . . . . . . . . . . . . . . . . . . . . . . . . . . . (180) (182) (162)
Operating income . . . . . . . . . . . . . . . . . . . . . . . . . . . . . . . . . . . . . $ 4,612 $ 5,860 $ 5,961
26
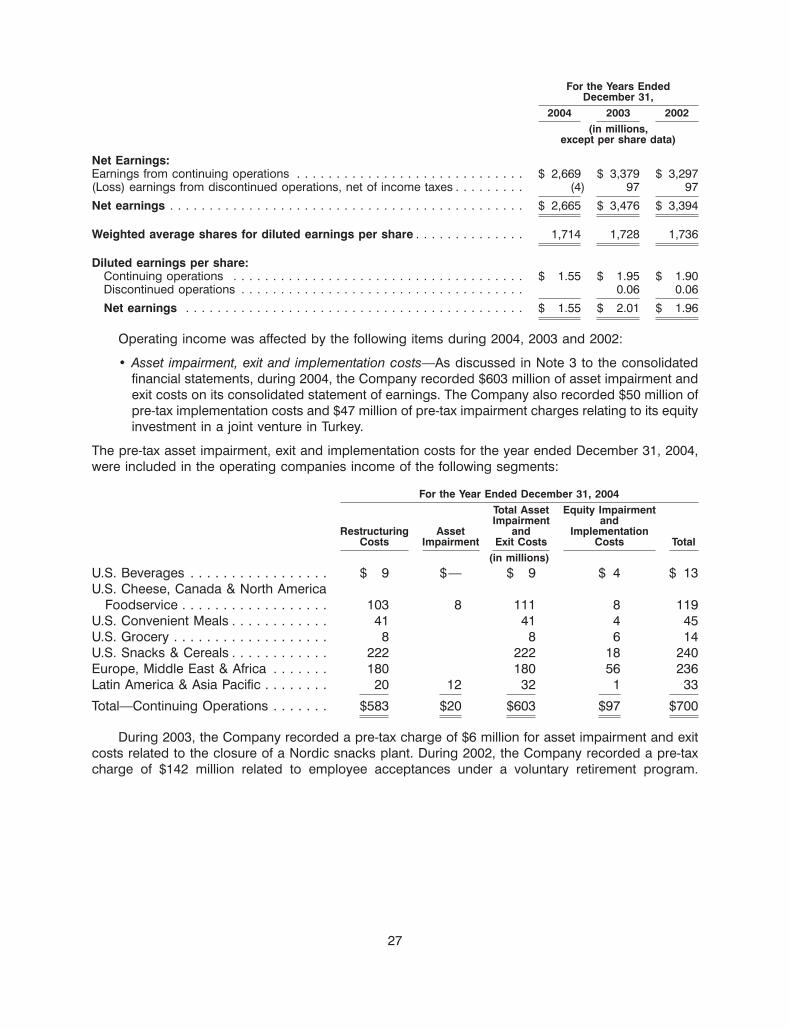
For the Years EndedDecember 31,
2004 2003 2002(in millions,
except per share data)
Net Earnings:Earnings from continuing operations . . . . . . . . . . . . . . . . . . . . . . . . . . . . . $ 2,669 $ 3,379 $ 3,297(Loss) earnings from discontinued operations, net of income taxes . . . . . . . . . (4) 97 97
Net earnings . . . . . . . . . . . . . . . . . . . . . . . . . . . . . . . . . . . . . . . . . . . . . $ 2,665 $ 3,476 $ 3,394
Weighted average shares for diluted earnings per share . . . . . . . . . . . . . . 1,714 1,728 1,736
Diluted earnings per share:Continuing operations . . . . . . . . . . . . . . . . . . . . . . . . . . . . . . . . . . . . . $ 1.55 $ 1.95 $ 1.90Discontinued operations . . . . . . . . . . . . . . . . . . . . . . . . . . . . . . . . . . . . 0.06 0.06
Net earnings . . . . . . . . . . . . . . . . . . . . . . . . . . . . . . . . . . . . . . . . . . . $ 1.55 $ 2.01 $ 1.96
Operating income was affected by the following items during 2004, 2003 and 2002:
• Asset impairment, exit and implementation costs—As discussed in Note 3 to the consolidatedfinancial statements, during 2004, the Company recorded $603 million of asset impairment andexit costs on its consolidated statement of earnings. The Company also recorded $50 million ofpre-tax implementation costs and $47 million of pre-tax impairment charges relating to its equityinvestment in a joint venture in Turkey.
The pre-tax asset impairment, exit and implementation costs for the year ended December 31, 2004,were included in the operating companies income of the following segments:
For the Year Ended December 31, 2004Total Asset Equity ImpairmentImpairment and
Restructuring Asset and ImplementationCosts Impairment Exit Costs Costs Total
(in millions)U.S. Beverages . . . . . . . . . . . . . . . . . $ 9 $— $ 9 $ 4 $ 13U.S. Cheese, Canada & North America
Foodservice . . . . . . . . . . . . . . . . . . 103 8 111 8 119U.S. Convenient Meals . . . . . . . . . . . . 41 41 4 45U.S. Grocery . . . . . . . . . . . . . . . . . . . 8 8 6 14U.S. Snacks & Cereals . . . . . . . . . . . . 222 222 18 240Europe, Middle East & Africa . . . . . . . 180 180 56 236Latin America & Asia Pacific . . . . . . . . 20 12 32 1 33
Total—Continuing Operations . . . . . . . $583 $20 $603 $97 $700
During 2003, the Company recorded a pre-tax charge of $6 million for asset impairment and exitcosts related to the closure of a Nordic snacks plant. During 2002, the Company recorded a pre-taxcharge of $142 million related to employee acceptances under a voluntary retirement program.
27

Approximately 700 employees elected to retire or terminate employment under the program. Thesecharges were included in the operating companies income of the following segments:
For the Years EndedDecember 31,
2003 2002(in millions)
U.S. Beverages . . . . . . . . . . . . . . . . . . . . . . . . . . . . . . . . . . . . . . . . . . $ 27U.S. Cheese, Canada & North America Foodservice . . . . . . . . . . . . . . . . 43U.S. Convenient Meals . . . . . . . . . . . . . . . . . . . . . . . . . . . . . . . . . . . . . 36U.S. Grocery . . . . . . . . . . . . . . . . . . . . . . . . . . . . . . . . . . . . . . . . . . . . 20U.S. Snacks & Cereals . . . . . . . . . . . . . . . . . . . . . . . . . . . . . . . . . . . . . 9Europe, Middle East & Africa . . . . . . . . . . . . . . . . . . . . . . . . . . . . . . . . . $6 5Latin America & Asia Pacific . . . . . . . . . . . . . . . . . . . . . . . . . . . . . . . . . 2
Asset impairment and exit costs . . . . . . . . . . . . . . . . . . . . . . . . . . . . . $6 $142
• Losses (Gains) on Sales of Businesses—During 2004, the Company sold a Brazilian snack nutsbusiness and trademarks associated with a candy business in Norway for aggregate pre-taxlosses of $3 million. During 2003, the Company sold a European rice business and a brandedfresh cheese business in Italy for aggregate pre-tax gains of $31 million. During 2002, theCompany sold its Latin American yeast and industrial bakery ingredients business, resulting in apre-tax gain of $69 million, and several small food businesses, resulting in pre-tax gains of$11 million. These pre-tax losses (gains) were included in the operating companies income of thefollowing segments:
For the Years EndedDecember 31,
2004 2003 2002(in millions)
U.S. Grocery . . . . . . . . . . . . . . . . . . . . . . . . . . . . . . . . . . . . . . . . . . . $ — $ — $ (8)Europe, Middle East & Africa . . . . . . . . . . . . . . . . . . . . . . . . . . . . . . . . (5) (31)Latin America & Asia Pacific . . . . . . . . . . . . . . . . . . . . . . . . . . . . . . . . 8 (72)
Losses (gains) on sales of businesses . . . . . . . . . . . . . . . . . . . . . . . . . $ 3 $(31) $(80)
• Integration Costs and a Loss on Sale of a Food Factory—During 2003, the Company reversed$13 million related to integration charges recorded in 2002 and 2001. During 2002, the Companyrecorded pre-tax integration-related charges of $115 million to consolidate production lines inNorth America, close a Kraft facility and for other consolidation programs. In addition, during2002, the Company reversed $4 million related to the loss on sale of a food factory. These itemswere included in the operating companies income of the following segments:
For the Years EndedDecember 31,
2003 2002(in millions)
U.S. Beverages . . . . . . . . . . . . . . . . . . . . . . . . . . . . . . . . . . . . . . . . . . $ (3) $ 55U.S. Cheese, Canada & North America Foodservice . . . . . . . . . . . . . . . . (1) 7U.S. Convenient Meals . . . . . . . . . . . . . . . . . . . . . . . . . . . . . . . . . . . . . (2) 27U.S. Grocery . . . . . . . . . . . . . . . . . . . . . . . . . . . . . . . . . . . . . . . . . . . . (7) 3U.S. Snacks & Cereals . . . . . . . . . . . . . . . . . . . . . . . . . . . . . . . . . . . . . 2Latin America & Asia Pacific . . . . . . . . . . . . . . . . . . . . . . . . . . . . . . . . . 17
Integration costs and a loss on sale of a food factory . . . . . . . . . . . . . $(13) $111
28
As discussed in Note 14 to the consolidated financial statements, the Company’s managementuses operating companies income, which is defined as operating income before general corporateexpenses and amortization of intangibles, to evaluate segment performance and allocate resources.Management believes it is appropriate to disclose this measure to help investors analyze the businessperformance and trends of the various business segments.
2004 compared with 2003
The following discussion compares consolidated operating results for 2004 with 2003.
Volume increased 509 million pounds (2.8%), due primarily to acquisitions and increasedshipments in the U.S. Cheese, Canada & North America Foodservice segment, partially offset by theimpact of divested businesses.
Net revenues increased $1,670 million (5.5%), due primarily to favorable currency ($838 million),higher volume/mix ($560 million), higher net pricing ($265 million, reflecting commodity-driven pricing,partially offset by increased promotional spending) and the impact of acquisitions ($140 million),partially offset by the impact of divested businesses ($126 million).
Operating income decreased $1,248 million (21.3%), due primarily to the pre-tax charges for assetimpairment and exit costs ($597 million), unfavorable costs, net of higher pricing ($442 million, dueprimarily to higher commodity costs and increased promotional spending), higher marketing,administration and research costs ($306 million), the 2004 implementation costs associated with therestructuring program ($50 million), the 2004 equity investment impairment charge relating to a jointventure in Turkey ($47 million), the unfavorable net impact related to gains and losses on the sales ofbusinesses ($34 million), higher fixed manufacturing costs ($23 million, including higher benefit costs)and the impact of divestitures ($18 million), partially offset by higher volume/mix ($187 million) andfavorable currency ($98 million).
Currency movements increased net revenues by $838 million and operating income by $98 million.These increases were due primarily to the weakness of the U.S. dollar against the euro and the Canadiandollar.
The Company’s reported effective income tax rate decreased by 2.6 percentage points to 32.3%,resulting from an $81 million favorable resolution of an outstanding tax item, the majority of whichoccurred in the third quarter of 2004, and the reversal of $35 million of tax accruals that are no longerrequired due to tax events that occurred during the first quarter of 2004.
Earnings from continuing operations of $2,669 million decreased $710 million (21.0%), dueprimarily to lower operating income, partially offset by a lower effective income tax rate. Diluted EPS fromcontinuing operations, which was $1.55, decreased by 20.5%.
Earnings from discontinued operations, net of income tax, decreased $101 million, resulting in a netloss of $4 million in 2004. The decrease was due primarily to pre-tax non-cash asset impairment chargesin 2004 of $107 million ($69 million after-tax) and an intangible pre-tax asset impairment charge of$17 million ($11 million after-tax).
Net earnings of $2,665 million decreased $811 million (23.3%). Diluted EPS from net earnings,which was $1.55, decreased by 22.9%.
2003 compared with 2002
The following discussion compares consolidated operating results for 2003 with 2002.
Volume increased 139 million pounds (0.8%), due primarily to increased shipments in theU.S. Beverages segment and the U.S. Cheese, Canada & North America Foodservice segment, growth
29
in developing markets and the impact of acquisitions, partially offset by the impact of divestedbusinesses, lower consumption in certain categories, particularly U.S. cookies, trade inventoryreductions, price competition and the impact of a weaker global economy.
Net revenues increased $1,250 million (4.3%), due to favorable currency ($726 million), higherpricing ($477 million, reflecting higher commodity and currency devaluation-driven cost increases,partially offset by higher promotional spending), higher volume/mix ($75 million) and the impact ofacquisitions ($59 million), partially offset by the impact of divested businesses ($87 million).
Operating income decreased $101 million (1.7%), due primarily to higher fixed manufacturing costs($113 million, including higher benefit costs), higher marketing, administration and research costs($106 million), unfavorable costs, net of higher pricing ($77 million, due primarily to higher commoditycosts and increased promotional spending), unfavorable volume/mix ($74 million), the impact of gainson sales of businesses ($49 million) and the impact of divestitures ($18 million), partially offset by theimpact of lower pre-tax charges for asset impairment and exit costs ($136 million) and the impact fromintegration costs and a loss on sale of a food factory ($124 million) and favorable currency ($93 million).The higher benefit costs were primarily related to pension and stock compensation costs.
Currency movements increased net revenues by $726 million and operating income by $93 million.These increases were due primarily to the weakening of the U.S. dollar against the euro, the Canadiandollar and other currencies, partially offset by the strength of the U.S. dollar against certain LatinAmerican currencies.
Interest and other debt expense, net, decreased $182 million. This decrease is due to theCompany’s refinancing of notes payable to Altria Group, Inc. and the use of free cash flow to pay downdebt.
The Company’s reported effective income tax rate decreased by 0.6 percentage points to 34.9%,due primarily to rate differences from foreign operations.
Earnings from continuing operations of $3,379 million increased $82 million (2.5%), due primarily tolower interest expense and a lower effective income tax rate, partially offset by lower operating income.Diluted EPS from continuing operations, which was $1.95, increased by 2.6%.
Net earnings of $3,476 million increased $82 million (2.4%). Diluted EPS from net earnings, whichwas $2.01, increased by 2.6%.
30
Operating Results by Reportable Segment
Kraft North America Commercial
For the Years EndedDecember 31,
2004 2003 2002(in millions)
Volume (in pounds):U.S. Beverages . . . . . . . . . . . . . . . . . . . . . . . . . . . . . . . . . . . . . 2,968 2,634 2,444U.S. Cheese, Canada & North America Foodservice . . . . . . . . . . . 4,527 4,373 4,273U.S. Convenient Meals . . . . . . . . . . . . . . . . . . . . . . . . . . . . . . . . 2,205 2,171 2,164U.S. Grocery . . . . . . . . . . . . . . . . . . . . . . . . . . . . . . . . . . . . . . . 1,690 1,678 1,688U.S. Snacks & Cereals . . . . . . . . . . . . . . . . . . . . . . . . . . . . . . . . 2,424 2,389 2,476
Volume (in pounds) . . . . . . . . . . . . . . . . . . . . . . . . . . . . . . . . . . . 13,814 13,245 13,045
Net revenues:U.S. Beverages . . . . . . . . . . . . . . . . . . . . . . . . . . . . . . . . . . . . . $ 2,555 $ 2,433 $ 2,338U.S. Cheese, Canada & North America Foodservice . . . . . . . . . . . 7,420 6,716 6,399U.S. Convenient Meals . . . . . . . . . . . . . . . . . . . . . . . . . . . . . . . . 4,250 4,058 3,974U.S. Grocery . . . . . . . . . . . . . . . . . . . . . . . . . . . . . . . . . . . . . . . 2,425 2,388 2,356U.S. Snacks & Cereals . . . . . . . . . . . . . . . . . . . . . . . . . . . . . . . . 5,410 5,342 5,422
Net revenues . . . . . . . . . . . . . . . . . . . . . . . . . . . . . . . . . . . . . . . . $22,060 $20,937 $20,489
Operating companies income:U.S. Beverages . . . . . . . . . . . . . . . . . . . . . . . . . . . . . . . . . . . . . $ 479 $ 630 $ 576U.S. Cheese, Canada & North America Foodservice . . . . . . . . . . . 989 1,271 1,255U.S. Convenient Meals . . . . . . . . . . . . . . . . . . . . . . . . . . . . . . . . 771 817 783U.S. Grocery . . . . . . . . . . . . . . . . . . . . . . . . . . . . . . . . . . . . . . . 894 894 881U.S. Snacks & Cereals . . . . . . . . . . . . . . . . . . . . . . . . . . . . . . . . 737 1,046 1,169
Operating companies income . . . . . . . . . . . . . . . . . . . . . . . . . . . $ 3,870 $ 4,658 $ 4,664
2004 compared with 2003
The following discussion compares Kraft North America Commercial’s operating results for 2004with 2003.
Volume increased 4.3%, due primarily to an acquisition in the U.S. Beverages segment andincreased shipments in the U.S. Cheese, Canada & North America Foodservice segment.
Net revenues increased $1,123 million (5.4%), due primarily to higher volume/mix ($537 million),higher net pricing ($312 million, reflecting commodity-driven price increases, partially offset byincreased promotional spending), favorable currency ($164 million) and the impact of acquisitions($117 million).
Operating companies income decreased $788 million (16.9%), due primarily to the 2004 pre-taxcharges for asset impairment and exit costs ($391 million), unfavorable costs, net of higher pricing($356 million, including higher commodity costs and increased promotional spending), highermarketing, administration and research costs ($214 million, including higher benefit costs) and the 2004implementation costs associated with the restructuring program ($40 million), partially offset by highervolume/mix ($197 million) and favorable currency ($29 million).
31
The following discusses operating results within each of Kraft North America Commercial’sreportable segments.
U.S. Beverages. Volume increased 12.7%, due primarily to the 2004 acquisition of a beveragebusiness and new product introductions in refreshment beverages. In coffee, volume also increased,due to product quality improvements and the impact of an expanded distribution arrangement.
Net revenues increased $122 million (5.0%), due primarily to the impact of acquisitions ($94 million)and higher volume/mix ($85 million), partially offset by increased promotional spending ($56 million).
Operating companies income decreased $151 million (24.0%), due primarily to higher marketing,administration and research costs ($98 million), unfavorable costs and higher promotional spending($85 million, including higher commodity costs), the 2004 pre-tax charges for asset impairment and exitcosts ($9 million) and the 2004 implementation costs associated with the restructuring program($4 million), partially offset by higher volume/mix ($49 million).
U.S. Cheese, Canada & North America Foodservice. Volume increased 3.5%, due primarily tohigher volume in foodservice and cheese. Volume in the foodservice business increased, due primarilyto an acquisition of a beverage business in 2004 and higher shipments to national accounts. Cheesevolume also increased, benefiting from increased promotional spending.
Net revenues increased $704 million (10.5%), due primarily to higher volume/mix ($272 million),higher pricing, net of higher promotional reinvestment spending in cheese ($248 million, reflectingcommodity-driven pricing), favorable currency ($164 million) and the impact of acquisitions.
Operating companies income decreased $282 million (22.2%), due primarily to unfavorable costs,net of higher pricing ($214 million, including higher commodity costs and increased promotionalspending), the 2004 pre-tax charges for asset impairment and exit costs ($111 million), higher fixedmanufacturing costs ($50 million, including higher benefit costs), higher marketing, administration andresearch costs ($26 million) and the 2004 implementation costs associated with the restructuringprogram ($8 million), partially offset by higher volume/mix ($99 million) and favorable currency($29 million).
U.S. Convenient Meals. Volume increased 1.6%, due primarily to gains in meats and pizza,partially offset by lower shipments in meals. Meats volume increased driven by higher consumption ofcold cuts, supported by higher investment spending. Pizza volume also increased, aided by newproduct introductions. In meals, volume declined due to the discontinuation of certain product lines inthe second half of 2003.
Net revenues increased $192 million (4.7%), due primarily to higher volume/mix ($114 million),higher pricing ($75 million, reflecting commodity-driven pricing in meats and pizza) and the impact ofacquisitions.
Operating companies income decreased $46 million (5.6%), due primarily to the 2004 pre-taxcharges for asset impairment and exit costs ($41 million), higher marketing, administration and researchcosts ($38 million, including higher benefit costs), the impact of acquisitions ($5 million) and the 2004implementation costs associated with the restructuring program ($4 million), partially offset by highervolume/mix ($40 million) and higher pricing, net of unfavorable costs ($7 million, including highercommodity costs).
U.S. Grocery. Volume increased 0.7%, due primarily to gains in enhancers, partially offset by adecline in desserts. Volume increased in enhancers, due primarily to mayonnaise and salad dressings.In desserts, volume declined, due primarily to lower shipments of fruit snacks, partially offset by highershipments in frozen toppings.
32
Net revenues increased $37 million (1.5%), due primarily to higher pricing and lower promotionalspending ($34 million) and higher volume/mix.
Operating companies income was equal to the prior year, as lower fixed manufacturing costs($17 million) and higher volume/mix ($10 million) were offset by the 2004 pre-tax charges for assetimpairment and exit costs ($8 million), the 2004 implementation costs associated with the restructuringprogram ($6 million), higher marketing, administration and research costs ($5 million) and unfavorablecosts, net of higher pricing.
U.S. Snacks & Cereals. Volume increased 1.5%, as higher salted snacks and biscuits volume waspartially offset by a decline in cereals. Salted snacks volume increased due to consumer nutrition trendsand marketing programs in nuts. In biscuits, volume increased, driven by new product introductions. Incereals, volume declined due to low carbohydrate diet trends, which impacted the category, andincreased competitive activity.
Net revenues increased $68 million (1.3%), due primarily to higher volume/mix ($62 million) andhigher pricing ($11 million, including the absence of high product returns associated with new productsincurred in the prior year, partially offset by increased promotional spending).
Operating companies income decreased $309 million (29.5%), due primarily to the 2004 pre-taxcharges for asset impairment and exit costs ($222 million), unfavorable costs, net of higher pricing($62 million, due to higher commodity costs and increased promotional spending), higher marketing,administration and research costs ($47 million) and the 2004 implementation costs associated with therestructuring program ($18 million), partially offset by lower fixed manufacturing costs ($40 million).
2003 compared with 2002
The following discussion compares Kraft North America Commercial’s operating results for 2003with 2002.
Volume increased 1.5%, due primarily to contributions from new products and increased shipmentsin the U.S. Beverages segment and the U.S. Cheese, Canada & North America Foodservice segment,partially offset by the divestiture of a small confectionery business in 2002, consumption weakness incertain categories, primarily cookies, and trade inventory reductions.
Net revenues increased $448 million (2.2%), due primarily to favorable currency ($162 million),higher pricing, net of increased promotional spending ($157 million) and higher volume/mix($148 million), partially offset by the divestiture of a small confectionery business in 2002 ($21 million).
Operating companies income decreased $6 million (0.1%), due primarily to unfavorable costs, netof higher pricing ($132 million, including higher commodity costs and increased promotional spending),higher fixed manufacturing costs ($82 million, including higher benefit costs) and unfavorable volume/mix ($35 million), partially offset by 2002 pre-tax charges for asset impairment and exit costs($135 million) and the impact of lower integration costs and a loss on sale of a food factory ($107 million).
The following discusses operating results within each of Kraft North America Commercial’sreportable segments.
U.S. Beverages. Volume increased 7.8%, due primarily to higher shipments of ready-to-drinkbeverages, which were aided by new product introductions. In coffee, volume declined, impacted bycompetitive activity and a category decline due to higher prices.
Net revenues increased $95 million (4.1%), due to higher volume/mix ($82 million) and lowerpromotional spending, net of lower pricing ($13 million).
Operating companies income increased $54 million (9.4%), due primarily to the impact of lowerintegration costs ($58 million), higher volume/mix ($33 million) and the 2002 pre-tax charges for asset
33
impairment and exit costs ($27 million), partially offset by unfavorable costs, net of lower promotionalspending ($32 million, including higher commodity costs), higher marketing, administration andresearch costs ($27 million) and higher benefit costs.
U.S. Cheese, Canada & North America Foodservice. Volume increased 2.3%, due primarily tohigher shipments in cheese, foodservice and Canada. Cheese volume increased due primarily toimproved consumption and share trends resulting from the investment program that began in the thirdquarter of 2003. Volume for the foodservice business in the United States also increased, due to highershipments to national accounts. Volume in Canada increased, driven by new beverage productintroductions.
Net revenues increased $317 million (5.0%), due to favorable currency ($162 million), highervolume/mix ($119 million) and higher pricing ($36 million, including the impact of increased promotionalspending).
Operating companies income increased $16 million (1.3%), due primarily to the 2002 pre-taxcharges for asset impairment and exit costs ($43 million), favorable currency ($32 million), highervolume/mix ($21 million) and lower integration costs ($8 million), partially offset by unfavorable costs,net of higher pricing ($49 million, including higher commodity costs and increased promotionalspending), higher marketing, administration and research costs ($20 million) and higher fixedmanufacturing costs ($18 million, including higher benefit costs).
U.S. Convenient Meals. Volume increased 0.3%, due primarily to gains in cold cuts, hot dogs,bacon, soy-based meat alternatives and frozen pizza, partially offset by a decline in meals, due primarilyto the discontinuance of certain product lines.
Net revenues increased $84 million (2.1%), due primarily to higher pricing ($59 million) and highervolume/mix ($23 million).
Operating companies income increased $34 million (4.3%), due primarily to the impact of 2002pre-tax charges for asset impairment and exit costs ($36 million) and integration costs ($29 million),lower fixed manufacturing costs ($18 million) and higher pricing, net of unfavorable costs ($7 million,including higher commodity costs), partially offset by higher marketing, administration and researchcosts ($53 million) and higher benefit costs.
U.S. Grocery. Volume decreased 0.6%, due primarily to the divestiture of a small confectionerybusiness in 2002 and a decline in enhancers, partially offset by higher shipments in desserts. Inenhancers, volume declined due primarily to lower shipments of spoonable dressings, partially offset bygains in pourable dressings, barbeque sauce and steak sauce. In desserts, volume increased dueprimarily to higher shipments of sugar-free items and increased merchandising programs.
Net revenues increased $32 million (1.4%), due primarily to favorable volume/mix ($29 million) andhigher pricing ($24 million, including the impact of increased promotional spending), partially offset bythe divestiture of a small confectionery business in 2002 ($21 million).
Operating companies income increased $13 million (1.5%), due primarily to the 2002 assetimpairment and exit costs ($20 million), favorable volume/mix ($17 million) and the impact of lowerintegration costs ($10 million), partially offset by unfavorable costs, net of higher pricing ($20 million,including higher commodity costs), the gain on sale of a small confectionery business in 2002($8 million) and higher benefit costs.
U.S. Snacks & Cereals. Volume decreased 3.5%, due primarily to lower shipments in biscuits. Inbiscuits, volume declined, due primarily to reduced consumption in cookies, reflecting higher pricing,lower impact of new products, and consumer health and wellness concerns. Snacks volume increased,benefiting from category and consumption gains in snack nuts.
34
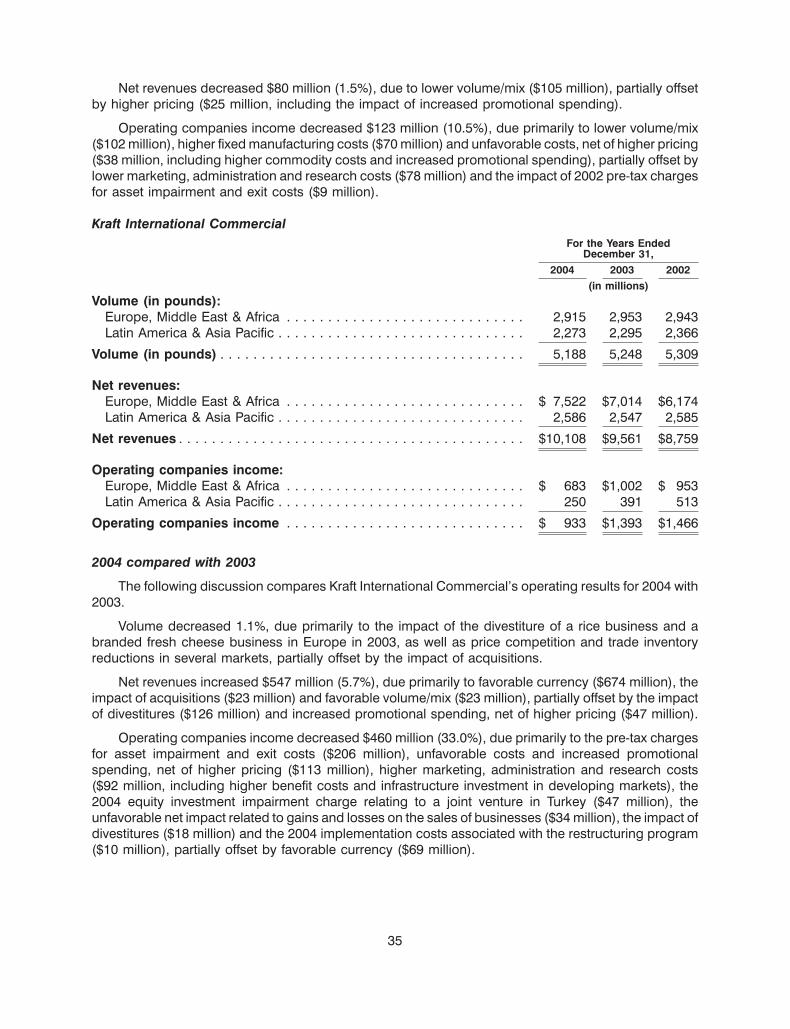
Net revenues decreased $80 million (1.5%), due to lower volume/mix ($105 million), partially offsetby higher pricing ($25 million, including the impact of increased promotional spending).
Operating companies income decreased $123 million (10.5%), due primarily to lower volume/mix($102 million), higher fixed manufacturing costs ($70 million) and unfavorable costs, net of higher pricing($38 million, including higher commodity costs and increased promotional spending), partially offset bylower marketing, administration and research costs ($78 million) and the impact of 2002 pre-tax chargesfor asset impairment and exit costs ($9 million).
Kraft International CommercialFor the Years Ended
December 31,2004 2003 2002
(in millions)Volume (in pounds):
Europe, Middle East & Africa . . . . . . . . . . . . . . . . . . . . . . . . . . . . . 2,915 2,953 2,943Latin America & Asia Pacific . . . . . . . . . . . . . . . . . . . . . . . . . . . . . . 2,273 2,295 2,366
Volume (in pounds) . . . . . . . . . . . . . . . . . . . . . . . . . . . . . . . . . . . . . 5,188 5,248 5,309
Net revenues:Europe, Middle East & Africa . . . . . . . . . . . . . . . . . . . . . . . . . . . . . $ 7,522 $7,014 $6,174Latin America & Asia Pacific . . . . . . . . . . . . . . . . . . . . . . . . . . . . . . 2,586 2,547 2,585
Net revenues . . . . . . . . . . . . . . . . . . . . . . . . . . . . . . . . . . . . . . . . . . $10,108 $9,561 $8,759
Operating companies income:Europe, Middle East & Africa . . . . . . . . . . . . . . . . . . . . . . . . . . . . . $ 683 $1,002 $ 953Latin America & Asia Pacific . . . . . . . . . . . . . . . . . . . . . . . . . . . . . . 250 391 513
Operating companies income . . . . . . . . . . . . . . . . . . . . . . . . . . . . . $ 933 $1,393 $1,466
2004 compared with 2003
The following discussion compares Kraft International Commercial’s operating results for 2004 with2003.
Volume decreased 1.1%, due primarily to the impact of the divestiture of a rice business and abranded fresh cheese business in Europe in 2003, as well as price competition and trade inventoryreductions in several markets, partially offset by the impact of acquisitions.
Net revenues increased $547 million (5.7%), due primarily to favorable currency ($674 million), theimpact of acquisitions ($23 million) and favorable volume/mix ($23 million), partially offset by the impactof divestitures ($126 million) and increased promotional spending, net of higher pricing ($47 million).
Operating companies income decreased $460 million (33.0%), due primarily to the pre-tax chargesfor asset impairment and exit costs ($206 million), unfavorable costs and increased promotionalspending, net of higher pricing ($113 million), higher marketing, administration and research costs($92 million, including higher benefit costs and infrastructure investment in developing markets), the2004 equity investment impairment charge relating to a joint venture in Turkey ($47 million), theunfavorable net impact related to gains and losses on the sales of businesses ($34 million), the impact ofdivestitures ($18 million) and the 2004 implementation costs associated with the restructuring program($10 million), partially offset by favorable currency ($69 million).
35
The following discusses operating results within each of Kraft International Commercial’s reportablesegments.
Europe, Middle East & Africa. Volume decreased 1.3%, due primarily to the divestiture of a ricebusiness and a branded fresh cheese business in Europe in 2003, price competition in France and tradeinventory reductions in Russia, partially offset by the impact of acquisitions and volume growth inGermany, Austria, Italy and Romania. Cheese volume declined, impacted by the divestiture of a brandedfresh cheese business in Europe in 2003, partially offset by increased cream cheese shipments inGermany, Italy and the United Kingdom, and higher process cheese shipments in the United Kingdom.Beverages volume also declined, driven by price competition in coffee in France and lower shipments ofrefreshment beverages in the Middle East. Convenient meals volume declined, impacted by thedivestiture of a rice business in Europe in 2003. In grocery, volume declined across several markets,including Germany and Italy, partially offset by increased volume in Egypt, due to an acquisition. Snacksvolume increased, as gains in biscuits, benefiting from acquisitions, and new confectionery productintroductions across the segment, were partially offset by trade inventory reductions in Russia.
Net revenues increased $508 million (7.2%), due primarily to favorable currency ($649 million),favorable volume/mix ($48 million) and the impact of acquisitions ($21 million), partially offset by theimpact of divestitures ($115 million) and lower pricing and increased promotional spending($95 million).
Operating companies income decreased $319 million (31.8%), due primarily to the pre-tax chargesfor asset impairment and exit costs ($174 million), lower pricing and increased promotional spending($92 million), higher marketing, administration and research costs ($49 million, including higher benefitcosts as well as infrastructure investment in developing markets), the equity investment impairmentcharge relating to a joint venture in Turkey ($47 million), lower gains on the sales of businesses($26 million), the impact of divestitures ($17 million) and the 2004 implementation costs associated withthe restructuring program ($9 million), partially offset by favorable currency ($78 million) and favorablevolume/mix ($15 million).
Latin America & Asia Pacific. Volume decreased 1.0%, due primarily to lower shipments inMexico, Peru and Venezuela, partially offset by growth in Brazil and China. Snacks volume declined,impacted by price competition and trade inventory reductions in Venezuela and Peru. In grocery, volumedeclined across several markets, including Peru, Australia and the Philippines. Cheese volumeincreased, due primarily to gains across several markets, including Japan, Australia and the Philippines.Beverages volume also increased, due primarily to gains in Brazil and China, partially offset by increasedcompetitive activity in Mexico.
Net revenues increased $39 million (1.5%), due primarily to higher pricing ($48 million, reflectingdevaluation-driven cost increases, net of increased promotional spending) and favorable currency($25 million), partially offset by lower volume/mix ($25 million) and the impact of divestitures($11 million).
Operating companies income decreased $141 million (36.1%), due primarily to higher marketing,administration and research costs ($43 million), the 2004 pre-tax charges for asset impairment and exitcosts ($32 million), lower volume/mix ($25 million), unfavorable costs, net of higher pricing ($21 million,including increased promotional spending), unfavorable currency ($9 million) and the 2004 pre-tax losson the sale of a snack nuts business in Brazil ($8 million).
2003 compared with 2002
The following discussion compares Kraft International Commercial’s operating results for 2003 with2002.
36
Volume decreased 1.1%, due to the divestiture of a Latin American bakery ingredients business in2002 and a rice business and a branded fresh cheese business in Europe in 2003, the impact of pricecompetition, particularly in Germany and France, and the adverse impact of a summer heat wave acrossEurope on the chocolate and coffee businesses. These declines were partially offset by growth indeveloping markets, including Russia, Brazil, Mexico and China, and the acquisitions of a snacksbusiness in Turkey and a biscuits business in Egypt.
Net revenues increased $802 million (9.2%), due primarily to favorable currency ($564 million),higher pricing ($320 million, reflecting higher commodity and currency devaluation-driven costincreases in Latin America) and the impact of acquisitions ($57 million), partially offset by lowervolume/mix ($73 million) and the impact of divestitures ($66 million).
Operating companies income decreased $73 million (5.0%), due primarily to higher marketing,administration and research costs ($90 million, including higher benefit costs and infrastructureinvestment in developing markets), the net impact of lower gains on sales of businesses ($41 million),lower volume/mix ($39 million) and the impact of divestitures ($13 million), partially offset by favorablecurrency ($61 million), higher pricing, net of cost increases ($24 million, including fixed manufacturingcosts), the 2002 pre-tax charges for integration costs ($17 million) and the impact of acquisitions($7 million).
The following discusses operating results within each of Kraft International Commercial’s reportablesegments.
Europe, Middle East & Africa. Volume increased 0.3%, due to growth in the Central and EasternEurope, Middle East & Africa region, which benefited from the acquisition of a biscuits business in Egyptin 2003, as well as a snacks business acquisition in Turkey during the third quarter of 2002, and newproduct introductions. These gains were partially offset by the impact of the summer heat wave acrossEurope on the chocolate and coffee businesses, price competition in Germany and France, and thedivestiture of a rice business and a branded fresh cheese business in Europe in 2003. In snacks, volumeincreased in biscuits and salted snacks, benefiting from acquisitions, partially offset by lowerconfectionery volume due to the summer heat wave across Europe and price competition. In beverages,volume declined, due primarily to the summer heat wave across Europe (which had an adverse impacton coffee shipments) and price competition. These declines were partially offset by increased coffeeshipments in Russia, benefiting from expanded distribution, and Poland, aided by new productintroductions. Convenient meals volume also declined, due to the divestiture of a rice business inEurope, partially offset by higher shipments of canned meats in Italy. Cheese volume declined, dueprimarily to the impact of price competition in Germany and Spain, partially offset by gains in creamcheese in Italy.
Net revenues increased $840 million (13.6%), due primarily to favorable currency ($804 million), theimpact of acquisitions ($57 million) and higher pricing ($18 million), partially offset by unfavorablevolume/mix ($41 million).
Operating companies income increased $49 million (5.1%), due primarily to favorable currency($100 million) and the gain on the sale of a rice business and a branded fresh cheese business in Europe($31 million), partially offset by unfavorable costs, net of higher pricing ($40 million, including highercommodity costs and increased promotional spending), unfavorable volume/mix ($26 million) andhigher marketing, administration and research costs ($19 million, including higher benefit costs andinfrastructure investment in eastern Europe).
Latin America & Asia Pacific. Volume decreased 3.0%, due to the divestiture of a Latin Americanbakery ingredients business in 2002, partially offset by growth in Brazil, Mexico, Argentina, Australia andChina. In grocery, volume declined in Latin America, due primarily to the sale of a bakery ingredientsbusiness in the fourth quarter of 2002. In beverages, volume increased due primarily to growth in Brazil,
37
Mexico, Venezuela, and China, aided by new product introductions. Snacks volume also increased, asbiscuits volume growth in Brazil, Argentina, China and Australia, aided by new product introductions,was partially offset by a decline in confectionery, which was impacted by economic weakness, tradeinventory reductions and price competition in Brazil. In cheese, volume increased, due to highershipments in Asia Pacific, benefiting from new products in Australia and promotional programs in thePhilippines, partially offset by declines in Latin America. In convenient meals, volume grew, benefitingfrom gains in Argentina.
Net revenues decreased $38 million (1.5%), due primarily to unfavorable currency ($240 million),the divestiture of a Latin American bakery ingredients business in 2002 ($68 million) and lowervolume/mix ($32 million), partially offset by higher pricing ($302 million, reflecting higher commodity andcurrency devaluation-driven costs).
Operating companies income decreased $122 million (23.8%), due primarily to gains on sales ofbusinesses in 2002 ($72 million), higher marketing, administration and research costs ($71 million),unfavorable currency ($39 million), lower volume/mix ($13 million) and the divestiture of a LatinAmerican bakery ingredients business in 2002 ($10 million), partially offset by higher pricing, net of costincreases ($64 million) and the 2002 pre-tax charges for integration costs ($17 million).
Financial Review
Net Cash Provided by Operating Activities
Net cash provided by operating activities was $4.0 billion in 2004, $4.1 billion in 2003 and$3.7 billion in 2002. The decrease in 2004 operating cash flows from 2003 was due primarily to lower netearnings, cash payments associated with the restructuring program and higher pension contributions,partially offset by a lower use of cash to fund working capital. The increase in 2003 operating cash flowsover 2002 was due primarily to a lower use of cash to fund working capital, partially offset by increasedpension contributions.
Net Cash Used in Investing Activities
One element of the growth strategy of the Company is to strengthen its brand portfolios throughdisciplined programs of selective acquisitions and divestitures. The Company is constantly reviewingpotential acquisition candidates and from time to time sells businesses to accelerate the shift in itsportfolio toward businesses—whether global, regional or local—that offer the Company a sustainablecompetitive advantage. The impact of any future acquisition or divestiture could have a material impacton the Company’s cash flows.
During 2004, 2003 and 2002, net cash used in investing activities was $1.1 billion, $1.0 billion and$1.1 billion, respectively. The increase in 2004 primarily reflected higher uses of cash for the purchase ofbusinesses and the reduction of cash received from the sales of businesses, partially offset by lowercapital expenditures. The decrease in 2003 primarily reflected lower capital expenditures and lowerpurchases of businesses, partially offset by the reduction in the cash received from the sales ofbusinesses.
Capital expenditures, which were funded by operating activities, were $1.0 billion, $1.1 billion and$1.2 billion in 2004, 2003 and 2002, respectively. The 2004 capital expenditures were primarily tomodernize manufacturing facilities, implement the restructuring program and expand productioncapacity for growing product lines. In 2005, capital expenditures are currently expected to be at orslightly above 2004 expenditures, including capital expenditures required for the restructuring program.These expenditures are expected to be funded from operations.
As previously discussed, during the fourth quarter of 2004, the Company announced the sale of itssugar confectionery, U.K. desserts and yogurt businesses for approximately $1.5 billion, $135 million
38
and $59 million, respectively. These transactions, which are subject to regulatory approval, are expectedto be completed during the first half of 2005.
Net Cash Used in Financing Activities
During 2004, net cash of $3.2 billion was used in financing activities, compared with $2.8 billionduring 2003. The increase in cash used in 2004 was due primarily to an increase in the Company’sClass A share repurchases and dividend payments. In November 2004, the Company issued$750 million in third-party long-term debt, the net proceeds of which was used to refinance maturingdebt.
During 2003, net cash of $2.8 billion was used in financing activities, compared with $2.6 billionduring 2002. The increase in cash used in 2003 was due primarily to an increase in the Company’sClass A share repurchases and an increase in dividend payments, partially offset by a decrease in netdebt repayments in 2003 (including amounts due to Altria Group, Inc. and affiliates). During 2003, theCompany issued $1.5 billion of third-party long-term debt, the net proceeds of which were used to repayoutstanding related party indebtedness. Financing activities included net debt repayments ofapproximately $1.4 billion in 2003.
Debt and Liquidity
Debt. The Company’s total debt, including amounts due to Altria Group, Inc. and affiliates, was$12.5 billion at December 31, 2004 and $13.5 billion at December 31, 2003. The Company’sdebt-to-equity ratio was 0.42 at December 31, 2004 and 0.47 at December 31, 2003. The Company’sdebt-to-capitalization ratio was 0.30 at December 31, 2004 and 0.32 at December 31, 2003.
In November 2004, the Company issued $750 million of 5-year notes bearing interest at 4.125%.The net proceeds of the offering were used to refinance maturing debt. The Company has a Form S-3shelf registration statement on file with the Securities and Exchange Commission (‘‘SEC’’) under whichthe Company may sell debt securities and/or warrants to purchase debt securities in one or moreofferings up to a total amount of $4.0 billion. At December 31, 2004, the Company had $3.5 billion ofcapacity remaining under its shelf registration.
At December 31, 2004 and 2003, the Company had short-term amounts payable to AltriaGroup, Inc. of $227 million and $543 million, respectively. Interest on these borrowings is based on theapplicable London Interbank Offered Rate.
Credit Ratings. Following a $10.1 billion judgment on March 21, 2003, against Altria Group, Inc.’sdomestic tobacco subsidiary, Philip Morris USA Inc., the three major credit rating agencies took a seriesof ratings actions resulting in the lowering of the Company’s short-term and long-term debt ratings,despite the fact the Company is neither a party to, nor has exposure to, this litigation. The Company’scredit ratings by Moody’s at December 31, 2004, were ‘‘P-2’’ for short-term debt and ‘‘A3’’ for long-termdebt, with stable outlook. The Company’s credit ratings by Standard & Poor’s at December 31, 2004were ‘‘A-2’’ for short-term debt and ‘‘BBB+’’ for long-term debt, with stable outlook. The Company’scredit ratings by Fitch Rating Services at December 31, 2004 were ‘‘F-2’’ for short-term debt and‘‘BBB+’’ for long-term debt, with stable outlook. As a result of the rating agencies’ actions, borrowingcosts have increased. None of the Company’s debt agreements requires accelerated repayment in theevent of a decrease in credit ratings. The credit rating downgrades by Moody’s, Standard & Poor’s andFitch Rating Services had no impact on any of the Company’s other existing third-party contracts.
Credit Lines. The Company maintains revolving credit facilities that have historically been used tosupport the issuance of commercial paper. The 364-day revolving credit facility expires in July 2005,although it contains a provision allowing the Company to extend the maturity of outstanding borrowings
39
for up to one additional year. At December 31, 2004, credit lines for the Company and the related activitywere as follows (in billions of dollars):
December 31, 2004Commercial Paper
Type Credit Lines Amount Drawn Outstanding
364-day (expires July 2005) . . . . . . . . . . . . . . . . . . . $2.5 $ — $ —Multi-year (expires July 2006) . . . . . . . . . . . . . . . . . . 2.0 1.7
$4.5 $ — $1.7
The Company’s revolving credit facilities, which are for its sole use, require the maintenance of aminimum net worth of $18.2 billion. At December 31, 2004, the Company’s net worth was $29.9 billion.The Company expects to continue to meet this covenant. The foregoing revolving credit facilities do notinclude any other financial tests, any credit rating triggers or any provisions that could require theposting of collateral. The multi-year revolving credit facility enables the Company to reclassify short-termdebt on a long-term basis. At December 31, 2004, in anticipation of the proceeds from the sale of itssugar confectionery business, the Company did not reclassify any short-term debt as long-term debt.The Company expects to refinance long-term and short-term debt from time to time. The nature andamount of the Company’s long-term and short-term debt and the proportionate amount of each can beexpected to vary as a result of future business requirements, market conditions and other factors.
In addition to the above, certain international subsidiaries of Kraft maintain uncommitted credit linesto meet the short-term working capital needs of the international businesses. These credit lines, whichamounted to approximately $600 million as of December 31, 2004, are for the sole use of the Company’sinternational businesses. Borrowings on these lines amounted to approximately $150 million and$220 million at December 31, 2004 and 2003, respectively.
Off-Balance Sheet Arrangements and Aggregate Contractual Obligations
The Company has no off-balance sheet arrangements other than the guarantees and contractualobligations that are discussed below.
Guarantees. As discussed in Note 18 to the consolidated financial statements, the Company hadthird-party guarantees, which are primarily derived from acquisition and divestiture activities, ofapproximately $25 million at December 31, 2004. Substantially all of these guarantees expire through2013, with $1 million expiring during 2005. The Company is required to perform under these guaranteesin the event that a third party fails to make contractual payments or achieve performance measures. TheCompany has a liability of $20 million on its consolidated balance sheet at December 31, 2004, relatingto these guarantees.
In addition, at December 31, 2004, the Company was contingently liable for $142 million ofguarantees related to its own performance. These include surety bonds related to dairy commoditypurchases and guarantees related to the payment of customs duties and taxes, and letters of credit.
Guarantees do not have, and are not expected to have, a significant impact on the Company’sliquidity.
40
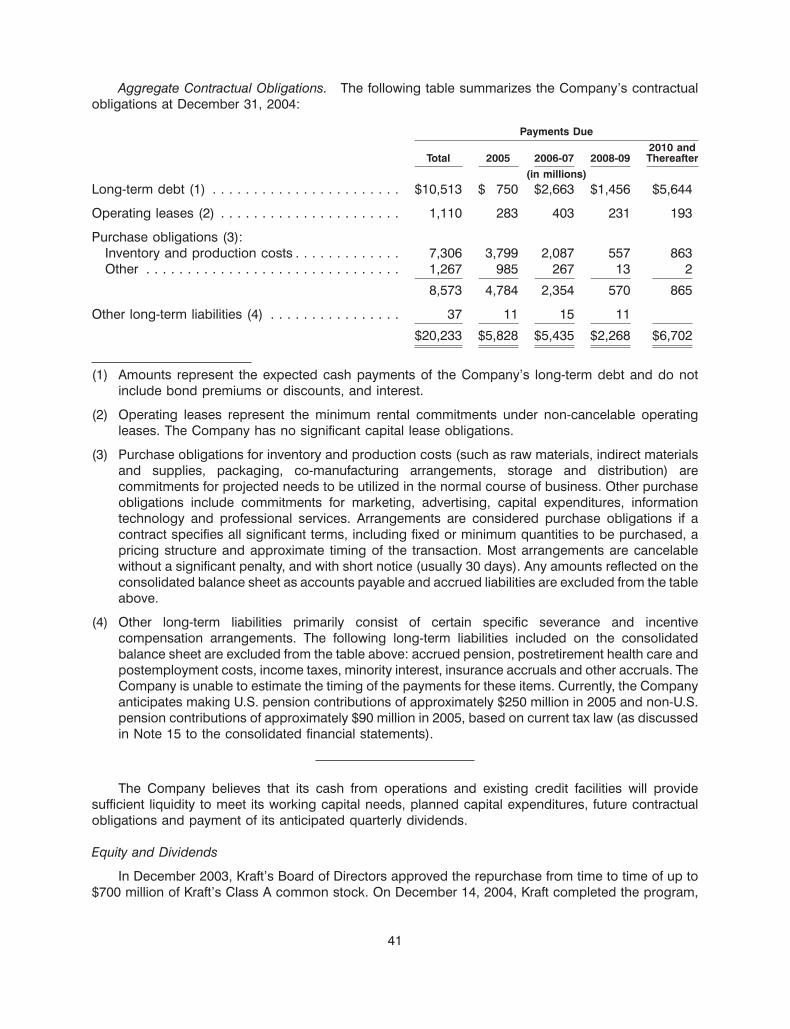
Aggregate Contractual Obligations. The following table summarizes the Company’s contractualobligations at December 31, 2004:
Payments Due2010 and
Total 2005 2006-07 2008-09 Thereafter(in millions)
Long-term debt (1) . . . . . . . . . . . . . . . . . . . . . . . $10,513 $ 750 $2,663 $1,456 $5,644
Operating leases (2) . . . . . . . . . . . . . . . . . . . . . . 1,110 283 403 231 193
Purchase obligations (3):Inventory and production costs . . . . . . . . . . . . . 7,306 3,799 2,087 557 863Other . . . . . . . . . . . . . . . . . . . . . . . . . . . . . . . 1,267 985 267 13 2
8,573 4,784 2,354 570 865
Other long-term liabilities (4) . . . . . . . . . . . . . . . . 37 11 15 11
$20,233 $5,828 $5,435 $2,268 $6,702
(1) Amounts represent the expected cash payments of the Company’s long-term debt and do notinclude bond premiums or discounts, and interest.
(2) Operating leases represent the minimum rental commitments under non-cancelable operatingleases. The Company has no significant capital lease obligations.
(3) Purchase obligations for inventory and production costs (such as raw materials, indirect materialsand supplies, packaging, co-manufacturing arrangements, storage and distribution) arecommitments for projected needs to be utilized in the normal course of business. Other purchaseobligations include commitments for marketing, advertising, capital expenditures, informationtechnology and professional services. Arrangements are considered purchase obligations if acontract specifies all significant terms, including fixed or minimum quantities to be purchased, apricing structure and approximate timing of the transaction. Most arrangements are cancelablewithout a significant penalty, and with short notice (usually 30 days). Any amounts reflected on theconsolidated balance sheet as accounts payable and accrued liabilities are excluded from the tableabove.
(4) Other long-term liabilities primarily consist of certain specific severance and incentivecompensation arrangements. The following long-term liabilities included on the consolidatedbalance sheet are excluded from the table above: accrued pension, postretirement health care andpostemployment costs, income taxes, minority interest, insurance accruals and other accruals. TheCompany is unable to estimate the timing of the payments for these items. Currently, the Companyanticipates making U.S. pension contributions of approximately $250 million in 2005 and non-U.S.pension contributions of approximately $90 million in 2005, based on current tax law (as discussedin Note 15 to the consolidated financial statements).
The Company believes that its cash from operations and existing credit facilities will providesufficient liquidity to meet its working capital needs, planned capital expenditures, future contractualobligations and payment of its anticipated quarterly dividends.
Equity and Dividends
In December 2003, Kraft’s Board of Directors approved the repurchase from time to time of up to$700 million of Kraft’s Class A common stock. On December 14, 2004, Kraft completed the program,
41
acquiring 21,718,847 Class A shares at an average price of $32.23 per share. On December 14, 2004,Kraft commenced repurchasing shares under a new two-year $1.5 billion Class A common stockrepurchase program that was authorized by its Board of Directors in December 2004. ThroughDecember 31, 2004, repurchases under the $1.5 billion program were 1,408,413 shares at a cost of$50 million, or $35.49 per share. During 2004, Kraft repurchased 21.5 million shares at a cost of$700 million, and in 2003 Kraft repurchased 12.5 million shares at a cost of $380 million.
As discussed in Note 11 to the consolidated financial statements, during 2004 and 2003, theCompany granted 4.1 million and 3.7 million restricted Class A shares, respectively, to eligibleU.S.-based employees, and during 2004 and 2003, also issued to eligible non-U.S. employees rights toreceive 1.9 million and 1.6 million Class A equivalent shares, respectively. The market value perrestricted share or right was $32.23 and $36.56 on the dates of the 2004 and 2003 grants, respectively.Restrictions on most of the stock and rights granted in 2004 lapse in the first quarter of 2007, whilerestrictions on grants in 2003 lapse in the first quarter of 2006.
Dividends paid in 2004 and 2003 were $1,280 million and $1,089 million, respectively, an increase of17.5%, reflecting a higher dividend rate in 2004, partially offset by a lower number of shares outstandingas a result of Class A share repurchases. During the third quarter of 2004, Kraft’s Board of Directorsapproved a 13.9% increase in the current quarterly dividend rate to $0.205 per share on its Class A andClass B common stock. As a result, the present annualized dividend rate is $0.82 per common share.The declaration of dividends is subject to the discretion of Kraft’s Board of Directors and will depend onvarious factors, including the Company’s net earnings, financial condition, cash requirements, futureprospects and other factors deemed relevant by Kraft’s Board of Directors.
Market Risk
The Company operates globally, with manufacturing and sales facilities in various locations aroundthe world, and utilizes certain financial instruments to manage its foreign currency and commodityexposures. Derivative financial instruments are used by the Company, principally to reduce exposure tomarket risks resulting from fluctuations in foreign exchange rates and commodity prices by creatingoffsetting exposures. The Company is not a party to leveraged derivatives and, by policy, does not usefinancial instruments for speculative purposes.
During the years ended December 31, 2004, 2003 and 2002, ineffectiveness related to cash flowhedges was not material. At December 31, 2004, the Company was hedging forecasted transactions forperiods not exceeding fifteen months and expects substantially all amounts reported in accumulatedother comprehensive earnings (losses) to be reclassified to the consolidated statement of earningswithin the next twelve months.
Foreign Exchange Rates. The Company uses forward foreign exchange contracts and foreigncurrency options to mitigate its exposure to changes in exchange rates from third-party andintercompany actual and forecasted transactions. Substantially all of the Company’s derivative financialinstruments are effective as hedges. The primary currencies to which the Company is exposed, basedon the size and location of its businesses, include the euro, Swiss franc, British pound and Canadiandollar. At December 31, 2004 and 2003, the Company had foreign exchange option and forwardcontracts with aggregate notional amounts of $2.9 billion and $2.5 billion, respectively. The effectiveportion of unrealized gains and losses associated with forward and option contracts is deferred as acomponent of accumulated other comprehensive earnings (losses) until the underlying hedgedtransactions are reported on the Company’s consolidated statement of earnings.
Commodities. The Company is exposed to price risk related to forecasted purchases of certaincommodities used as raw materials by its businesses. Accordingly, the Company uses commodityforward contracts as cash flow hedges, primarily for coffee, cocoa, milk and cheese. Commodity futuresand options are also used to hedge the price of certain commodities, including milk, coffee, cocoa,
42
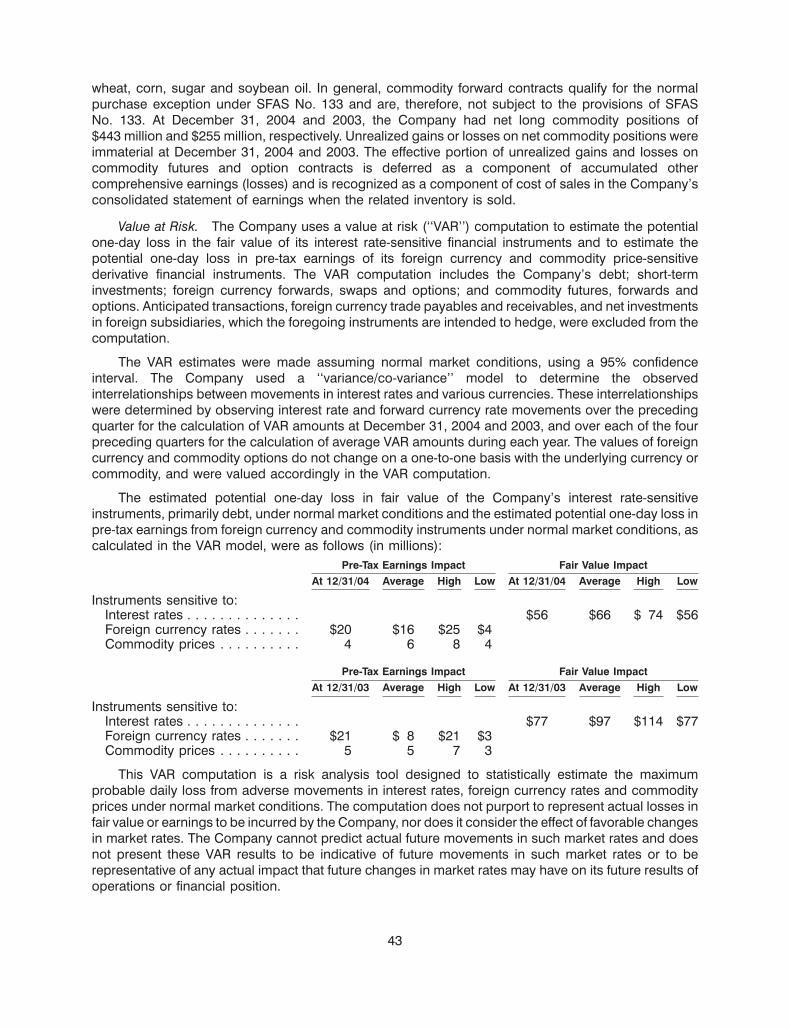
wheat, corn, sugar and soybean oil. In general, commodity forward contracts qualify for the normalpurchase exception under SFAS No. 133 and are, therefore, not subject to the provisions of SFASNo. 133. At December 31, 2004 and 2003, the Company had net long commodity positions of$443 million and $255 million, respectively. Unrealized gains or losses on net commodity positions wereimmaterial at December 31, 2004 and 2003. The effective portion of unrealized gains and losses oncommodity futures and option contracts is deferred as a component of accumulated othercomprehensive earnings (losses) and is recognized as a component of cost of sales in the Company’sconsolidated statement of earnings when the related inventory is sold.
Value at Risk. The Company uses a value at risk (‘‘VAR’’) computation to estimate the potentialone-day loss in the fair value of its interest rate-sensitive financial instruments and to estimate thepotential one-day loss in pre-tax earnings of its foreign currency and commodity price-sensitivederivative financial instruments. The VAR computation includes the Company’s debt; short-terminvestments; foreign currency forwards, swaps and options; and commodity futures, forwards andoptions. Anticipated transactions, foreign currency trade payables and receivables, and net investmentsin foreign subsidiaries, which the foregoing instruments are intended to hedge, were excluded from thecomputation.
The VAR estimates were made assuming normal market conditions, using a 95% confidenceinterval. The Company used a ‘‘variance/co-variance’’ model to determine the observedinterrelationships between movements in interest rates and various currencies. These interrelationshipswere determined by observing interest rate and forward currency rate movements over the precedingquarter for the calculation of VAR amounts at December 31, 2004 and 2003, and over each of the fourpreceding quarters for the calculation of average VAR amounts during each year. The values of foreigncurrency and commodity options do not change on a one-to-one basis with the underlying currency orcommodity, and were valued accordingly in the VAR computation.
The estimated potential one-day loss in fair value of the Company’s interest rate-sensitiveinstruments, primarily debt, under normal market conditions and the estimated potential one-day loss inpre-tax earnings from foreign currency and commodity instruments under normal market conditions, ascalculated in the VAR model, were as follows (in millions):
Pre-Tax Earnings Impact Fair Value ImpactAt 12/31/04 Average High Low At 12/31/04 Average High Low
Instruments sensitive to:Interest rates . . . . . . . . . . . . . . $56 $66 $ 74 $56Foreign currency rates . . . . . . . $20 $16 $25 $4Commodity prices . . . . . . . . . . 4 6 8 4
Pre-Tax Earnings Impact Fair Value ImpactAt 12/31/03 Average High Low At 12/31/03 Average High Low
Instruments sensitive to:Interest rates . . . . . . . . . . . . . . $77 $97 $114 $77Foreign currency rates . . . . . . . $21 $ 8 $21 $3Commodity prices . . . . . . . . . . 5 5 7 3
This VAR computation is a risk analysis tool designed to statistically estimate the maximumprobable daily loss from adverse movements in interest rates, foreign currency rates and commodityprices under normal market conditions. The computation does not purport to represent actual losses infair value or earnings to be incurred by the Company, nor does it consider the effect of favorable changesin market rates. The Company cannot predict actual future movements in such market rates and doesnot present these VAR results to be indicative of future movements in such market rates or to berepresentative of any actual impact that future changes in market rates may have on its future results ofoperations or financial position.
43
New Accounting Standards
See Note 2 to the consolidated financial statements for a discussion of new accounting standards.
Contingencies
See Note 18 to the consolidated financial statements for a discussion of contingencies.
Item 7A. Quantitative and Qualitative Disclosures About Market Risk.
See the paragraphs captioned ‘‘Market Risk’’ and ‘‘Value at Risk’’ in Item 7 above.
44
Item 8. Financial Statements and Supplementary Data.
Report of Management on Internal Control over Financial Reporting
Management of the Company is responsible for establishing and maintaining adequate internalcontrol over financial reporting as defined in Rules 13a-15(f) and 15d-15(f) under the SecuritiesExchange Act of 1934. The Company’s internal control over financial reporting is a process designed toprovide reasonable assurance regarding the reliability of financial reporting and the preparation offinancial statements for external purposes in accordance with accounting principles generally acceptedin the United States of America. The Company’s internal control over financial reporting includes thosewritten policies and procedures that:
• pertain to the maintenance of records that, in reasonable detail, accurately and fairly reflect thetransactions and dispositions of the assets of the Company;
• provide reasonable assurance that transactions are recorded as necessary to permit preparationof financial statements in accordance with accounting principles generally accepted in the UnitedStates of America;
• provide reasonable assurance that receipts and expenditures of the Company are being madeonly in accordance with authorizations of management and directors of the Company; and
• provide reasonable assurance regarding prevention or timely detection of unauthorizedacquisition, use or disposition of assets that could have a material effect on the consolidatedfinancial statements.
Internal control over financial reporting includes the controls themselves, monitoring and internalauditing practices and actions taken to correct deficiencies as identified.
Because of its inherent limitations, internal control over financial reporting may not prevent or detectmisstatements. Also, projections of any evaluation of effectiveness to future periods are subject to therisk that controls may become inadequate because of changes in conditions, or that the degree ofcompliance with the policies or procedures may deteriorate.
Management assessed the effectiveness of the Company’s internal control over financial reportingas of December 31, 2004. Management based this assessment on criteria for effective internal controlover financial reporting described in Internal Control—Integrated Framework issued by the Committee ofSponsoring Organizations of the Treadway Commission (‘‘COSO’’). Management’s assessmentincluded an evaluation of the design of the Company’s internal control over financial reporting andtesting of the operational effectiveness of the Company’s internal control over financial reporting.Management reviewed the results of its assessment with the Audit Committee of the Company’s Boardof Directors.
Based on this assessment, management determined that, as of December 31, 2004, the Companymaintained effective internal control over financial reporting.
PricewaterhouseCoopers LLP, independent registered public accounting firm, who audited andreported on the consolidated financial statements of the Company included in this report, has issued anattestation report on management’s assessment of internal control over financial reporting.
February 2, 2005
45
REPORT OF INDEPENDENT REGISTERED PUBLIC ACCOUNTING FIRM
To the Board of Directors and Shareholders of Kraft Foods Inc.:
We have completed an integrated audit of Kraft Foods Inc.’s 2004 consolidated financial statementsand of its internal control over financial reporting as of December 31, 2004, and audits of its 2003 and2002 consolidated financial statements in accordance with the standards of the Public CompanyAccounting Oversight Board (United States). Our opinions, based on our audits, are presented below.
Consolidated financial statements
In our opinion, the accompanying consolidated balance sheets and the related consolidatedstatements of earnings, shareholders’ equity and cash flows present fairly, in all material respects, thefinancial position of Kraft Foods Inc. and its subsidiaries (the ‘‘Company’’) at December 31, 2004 and2003, and the results of their operations and their cash flows for each of the three years in the periodended December 31, 2004, in conformity with accounting principles generally accepted in the UnitedStates of America. These financial statements are the responsibility of the Company’s management. Ourresponsibility is to express an opinion on these financial statements based on our audits. We conductedour audits of these statements in accordance with the standards of the Public Company AccountingOversight Board (United States). Those standards require that we plan and perform the audit to obtainreasonable assurance about whether the financial statements are free of material misstatement. An auditof financial statements includes examining, on a test basis, evidence supporting the amounts anddisclosures in the financial statements, assessing the accounting principles used and significantestimates made by management, and evaluating the overall financial statement presentation. Webelieve that our audits provide a reasonable basis for our opinion.
Internal control over financial reporting
Also, in our opinion, management’s assessment, included in the Report of Management on InternalControl Over Financial Reporting dated February 2, 2005, that the Company maintained effective internalcontrol over financial reporting as of December 31, 2004 based on criteria established in InternalControl—Integrated Framework issued by the Committee of Sponsoring Organizations of the TreadwayCommission (‘‘COSO’’), is fairly stated, in all material respects, based on those criteria. Furthermore, inour opinion, the Company maintained, in all material respects, effective internal control over financialreporting as of December 31, 2004, based on criteria established in Internal Control—IntegratedFramework issued by the COSO. The Company’s management is responsible for maintaining effectiveinternal control over financial reporting and for its assessment of the effectiveness of internal control overfinancial reporting. Our responsibility is to express opinions on management’s assessment and on theeffectiveness of the Company’s internal control over financial reporting based on our audit. Weconducted our audit of internal control over financial reporting in accordance with the standards of thePublic Company Accounting Oversight Board (United States). Those standards require that we plan andperform the audit to obtain reasonable assurance about whether effective internal control over financialreporting was maintained in all material respects. An audit of internal control over financial reportingincludes obtaining an understanding of internal control over financial reporting, evaluatingmanagement’s assessment, testing and evaluating the design and operating effectiveness of internalcontrol, and performing such other procedures as we consider necessary in the circumstances. Webelieve that our audit provides a reasonable basis for our opinions.
A company’s internal control over financial reporting is a process designed to provide reasonableassurance regarding the reliability of financial reporting and the preparation of financial statements forexternal purposes in accordance with generally accepted accounting principles. A company’s internalcontrol over financial reporting includes those policies and procedures that (i) pertain to themaintenance of records that, in reasonable detail, accurately and fairly reflect the transactions and
46
dispositions of the assets of the company; (ii) provide reasonable assurance that transactions arerecorded as necessary to permit preparation of financial statements in accordance with generallyaccepted accounting principles, and that receipts and expenditures of the company are being madeonly in accordance with authorizations of management and directors of the company; and (iii) providereasonable assurance regarding prevention or timely detection of unauthorized acquisition, use, ordisposition of the company’s assets that could have a material effect on the financial statements.
Because of its inherent limitations, internal control over financial reporting may not prevent or detectmisstatements. Also, projections of any evaluation of effectiveness to future periods are subject to therisk that controls may become inadequate because of changes in conditions, or that the degree ofcompliance with the policies or procedures may deteriorate.
/s/ PRICEWATERHOUSECOOPERS LLP
Chicago, IllinoisFebruary 2, 2005
47
KRAFT FOODS INC. and SUBSIDIARIES
CONSOLIDATED BALANCE SHEETS, at December 31,
(in millions of dollars)
2004 2003
ASSETSCash and cash equivalents . . . . . . . . . . . . . . . . . . . . . . . . . . . . . . . . . . . . . . . . . . . . . . . $ 282 $ 514Receivables (less allowances of $118 in 2004 and $114 in 2003) . . . . . . . . . . . . . . . . . . . . . . . 3,541 3,369Inventories:
Raw materials . . . . . . . . . . . . . . . . . . . . . . . . . . . . . . . . . . . . . . . . . . . . . . . . . . . . . . 1,367 1,375Finished product . . . . . . . . . . . . . . . . . . . . . . . . . . . . . . . . . . . . . . . . . . . . . . . . . . . . 2,080 1,968
3,447 3,343Deferred income taxes . . . . . . . . . . . . . . . . . . . . . . . . . . . . . . . . . . . . . . . . . . . . . . . . . . 749 681Assets of discontinued operations held for sale . . . . . . . . . . . . . . . . . . . . . . . . . . . . . . . . . . 1,458Other current assets . . . . . . . . . . . . . . . . . . . . . . . . . . . . . . . . . . . . . . . . . . . . . . . . . . . 245 217
Total current assets . . . . . . . . . . . . . . . . . . . . . . . . . . . . . . . . . . . . . . . . . . . . . . . . . . . 9,722 8,124Property, plant and equipment, at cost:
Land and land improvements . . . . . . . . . . . . . . . . . . . . . . . . . . . . . . . . . . . . . . . . . . . . 400 407Buildings and building equipment . . . . . . . . . . . . . . . . . . . . . . . . . . . . . . . . . . . . . . . . . 3,545 3,422Machinery and equipment . . . . . . . . . . . . . . . . . . . . . . . . . . . . . . . . . . . . . . . . . . . . . . 11,892 11,293Construction in progress . . . . . . . . . . . . . . . . . . . . . . . . . . . . . . . . . . . . . . . . . . . . . . . 646 683
16,483 15,805Less accumulated depreciation . . . . . . . . . . . . . . . . . . . . . . . . . . . . . . . . . . . . . . . . . . . 6,498 5,650
9,985 10,155Goodwill . . . . . . . . . . . . . . . . . . . . . . . . . . . . . . . . . . . . . . . . . . . . . . . . . . . . . . . . . . . 25,177 25,402Other intangible assets, net . . . . . . . . . . . . . . . . . . . . . . . . . . . . . . . . . . . . . . . . . . . . . . . 10,634 11,477Prepaid pension assets . . . . . . . . . . . . . . . . . . . . . . . . . . . . . . . . . . . . . . . . . . . . . . . . . 3,569 3,243Other assets . . . . . . . . . . . . . . . . . . . . . . . . . . . . . . . . . . . . . . . . . . . . . . . . . . . . . . . . 841 884
TOTAL ASSETS . . . . . . . . . . . . . . . . . . . . . . . . . . . . . . . . . . . . . . . . . . . . . . . . . . . . . $59,928 $59,285
LIABILITIESShort-term borrowings . . . . . . . . . . . . . . . . . . . . . . . . . . . . . . . . . . . . . . . . . . . . . . . . . . $ 1,818 $ 553Current portion of long-term debt . . . . . . . . . . . . . . . . . . . . . . . . . . . . . . . . . . . . . . . . . . . 750 775Due to Altria Group, Inc. and affiliates . . . . . . . . . . . . . . . . . . . . . . . . . . . . . . . . . . . . . . . . 227 543Accounts payable . . . . . . . . . . . . . . . . . . . . . . . . . . . . . . . . . . . . . . . . . . . . . . . . . . . . . 2,207 2,005Accrued liabilities:
Marketing . . . . . . . . . . . . . . . . . . . . . . . . . . . . . . . . . . . . . . . . . . . . . . . . . . . . . . . . . 1,637 1,500Employment costs . . . . . . . . . . . . . . . . . . . . . . . . . . . . . . . . . . . . . . . . . . . . . . . . . . . 732 699Other . . . . . . . . . . . . . . . . . . . . . . . . . . . . . . . . . . . . . . . . . . . . . . . . . . . . . . . . . . . 1,537 1,335
Income taxes . . . . . . . . . . . . . . . . . . . . . . . . . . . . . . . . . . . . . . . . . . . . . . . . . . . . . . . . 170 451
Total current liabilities . . . . . . . . . . . . . . . . . . . . . . . . . . . . . . . . . . . . . . . . . . . . . . . . . 9,078 7,861Long-term debt . . . . . . . . . . . . . . . . . . . . . . . . . . . . . . . . . . . . . . . . . . . . . . . . . . . . . . 9,723 11,591Deferred income taxes . . . . . . . . . . . . . . . . . . . . . . . . . . . . . . . . . . . . . . . . . . . . . . . . . . 5,850 5,856Accrued postretirement health care costs . . . . . . . . . . . . . . . . . . . . . . . . . . . . . . . . . . . . . . 1,887 1,894Other liabilities . . . . . . . . . . . . . . . . . . . . . . . . . . . . . . . . . . . . . . . . . . . . . . . . . . . . . . . 3,479 3,553
Total liabilities . . . . . . . . . . . . . . . . . . . . . . . . . . . . . . . . . . . . . . . . . . . . . . . . . . . . . . 30,017 30,755
Contingencies (Note 18)SHAREHOLDERS’ EQUITY
Class A common stock, no par value (555,000,000 shares issued in 2004 and 2003)Class B common stock, no par value (1,180,000,000 shares issued and outstanding in 2004 and
2003)Additional paid-in capital . . . . . . . . . . . . . . . . . . . . . . . . . . . . . . . . . . . . . . . . . . . . . . . . . 23,762 23,704Earnings reinvested in the business . . . . . . . . . . . . . . . . . . . . . . . . . . . . . . . . . . . . . . . . . . 8,304 7,020Accumulated other comprehensive losses (including currency translation of $(890) in 2004 and
$(1,494) in 2003) . . . . . . . . . . . . . . . . . . . . . . . . . . . . . . . . . . . . . . . . . . . . . . . . . . . . (1,205) (1,792)
30,861 28,932Less cost of repurchased stock (29,644,926 Class A shares in 2004 and 13,062,876 Class A shares
in 2003) . . . . . . . . . . . . . . . . . . . . . . . . . . . . . . . . . . . . . . . . . . . . . . . . . . . . . . . . . . (950) (402)
Total shareholders’ equity . . . . . . . . . . . . . . . . . . . . . . . . . . . . . . . . . . . . . . . . . . . . . . . 29,911 28,530
TOTAL LIABILITIES AND SHAREHOLDERS’ EQUITY . . . . . . . . . . . . . . . . . . . . . . . . . . . . . . $59,928 $59,285
See notes to consolidated financial statements.
48
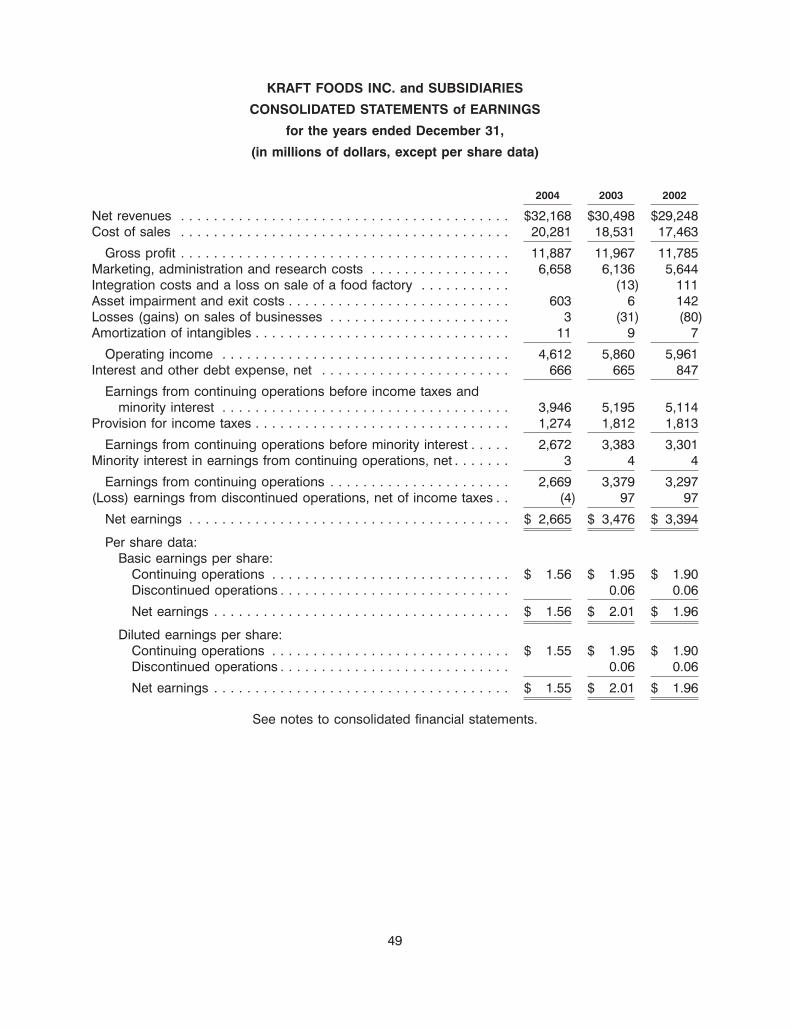
KRAFT FOODS INC. and SUBSIDIARIES
CONSOLIDATED STATEMENTS of EARNINGS
for the years ended December 31,
(in millions of dollars, except per share data)
2004 2003 2002
Net revenues . . . . . . . . . . . . . . . . . . . . . . . . . . . . . . . . . . . . . . . . $32,168 $30,498 $29,248Cost of sales . . . . . . . . . . . . . . . . . . . . . . . . . . . . . . . . . . . . . . . . 20,281 18,531 17,463
Gross profit . . . . . . . . . . . . . . . . . . . . . . . . . . . . . . . . . . . . . . . . 11,887 11,967 11,785Marketing, administration and research costs . . . . . . . . . . . . . . . . . 6,658 6,136 5,644Integration costs and a loss on sale of a food factory . . . . . . . . . . . (13) 111Asset impairment and exit costs . . . . . . . . . . . . . . . . . . . . . . . . . . . 603 6 142Losses (gains) on sales of businesses . . . . . . . . . . . . . . . . . . . . . . 3 (31) (80)Amortization of intangibles . . . . . . . . . . . . . . . . . . . . . . . . . . . . . . . 11 9 7
Operating income . . . . . . . . . . . . . . . . . . . . . . . . . . . . . . . . . . . 4,612 5,860 5,961Interest and other debt expense, net . . . . . . . . . . . . . . . . . . . . . . . 666 665 847
Earnings from continuing operations before income taxes andminority interest . . . . . . . . . . . . . . . . . . . . . . . . . . . . . . . . . . . 3,946 5,195 5,114
Provision for income taxes . . . . . . . . . . . . . . . . . . . . . . . . . . . . . . . 1,274 1,812 1,813
Earnings from continuing operations before minority interest . . . . . 2,672 3,383 3,301Minority interest in earnings from continuing operations, net . . . . . . . 3 4 4
Earnings from continuing operations . . . . . . . . . . . . . . . . . . . . . . 2,669 3,379 3,297(Loss) earnings from discontinued operations, net of income taxes . . (4) 97 97
Net earnings . . . . . . . . . . . . . . . . . . . . . . . . . . . . . . . . . . . . . . . $ 2,665 $ 3,476 $ 3,394
Per share data:Basic earnings per share:
Continuing operations . . . . . . . . . . . . . . . . . . . . . . . . . . . . . $ 1.56 $ 1.95 $ 1.90Discontinued operations . . . . . . . . . . . . . . . . . . . . . . . . . . . . 0.06 0.06
Net earnings . . . . . . . . . . . . . . . . . . . . . . . . . . . . . . . . . . . . $ 1.56 $ 2.01 $ 1.96
Diluted earnings per share:Continuing operations . . . . . . . . . . . . . . . . . . . . . . . . . . . . . $ 1.55 $ 1.95 $ 1.90Discontinued operations . . . . . . . . . . . . . . . . . . . . . . . . . . . . 0.06 0.06
Net earnings . . . . . . . . . . . . . . . . . . . . . . . . . . . . . . . . . . . . $ 1.55 $ 2.01 $ 1.96
See notes to consolidated financial statements.
49
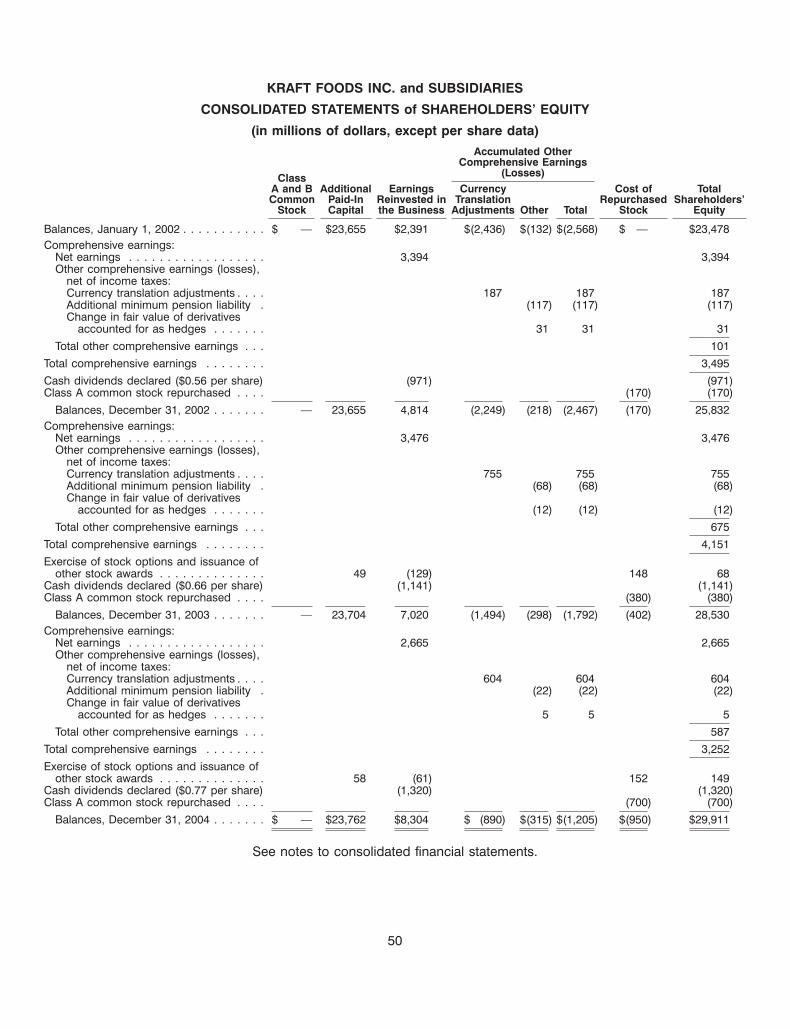
KRAFT FOODS INC. and SUBSIDIARIES
CONSOLIDATED STATEMENTS of SHAREHOLDERS’ EQUITY
(in millions of dollars, except per share data)Accumulated Other
Comprehensive Earnings(Losses)Class
A and B Additional Earnings Currency Cost of TotalCommon Paid-In Reinvested in Translation Repurchased Shareholders’
Stock Capital the Business Adjustments Other Total Stock Equity
Balances, January 1, 2002 . . . . . . . . . . . $ — $23,655 $2,391 $(2,436) $(132) $(2,568) $ — $23,478Comprehensive earnings:
Net earnings . . . . . . . . . . . . . . . . . . 3,394 3,394Other comprehensive earnings (losses),
net of income taxes:Currency translation adjustments . . . . 187 187 187Additional minimum pension liability . (117) (117) (117)Change in fair value of derivatives
accounted for as hedges . . . . . . . 31 31 31
Total other comprehensive earnings . . . 101
Total comprehensive earnings . . . . . . . . 3,495
Cash dividends declared ($0.56 per share) (971) (971)Class A common stock repurchased . . . . (170) (170)
Balances, December 31, 2002 . . . . . . . — 23,655 4,814 (2,249) (218) (2,467) (170) 25,832Comprehensive earnings:
Net earnings . . . . . . . . . . . . . . . . . . 3,476 3,476Other comprehensive earnings (losses),
net of income taxes:Currency translation adjustments . . . . 755 755 755Additional minimum pension liability . (68) (68) (68)Change in fair value of derivatives
accounted for as hedges . . . . . . . (12) (12) (12)
Total other comprehensive earnings . . . 675
Total comprehensive earnings . . . . . . . . 4,151
Exercise of stock options and issuance ofother stock awards . . . . . . . . . . . . . . 49 (129) 148 68
Cash dividends declared ($0.66 per share) (1,141) (1,141)Class A common stock repurchased . . . . (380) (380)
Balances, December 31, 2003 . . . . . . . — 23,704 7,020 (1,494) (298) (1,792) (402) 28,530Comprehensive earnings:
Net earnings . . . . . . . . . . . . . . . . . . 2,665 2,665Other comprehensive earnings (losses),
net of income taxes:Currency translation adjustments . . . . 604 604 604Additional minimum pension liability . (22) (22) (22)Change in fair value of derivatives
accounted for as hedges . . . . . . . 5 5 5
Total other comprehensive earnings . . . 587
Total comprehensive earnings . . . . . . . . 3,252
Exercise of stock options and issuance ofother stock awards . . . . . . . . . . . . . . 58 (61) 152 149
Cash dividends declared ($0.77 per share) (1,320) (1,320)Class A common stock repurchased . . . . (700) (700)
Balances, December 31, 2004 . . . . . . . $ — $23,762 $8,304 $ (890) $(315) $(1,205) $(950) $29,911
See notes to consolidated financial statements.
50
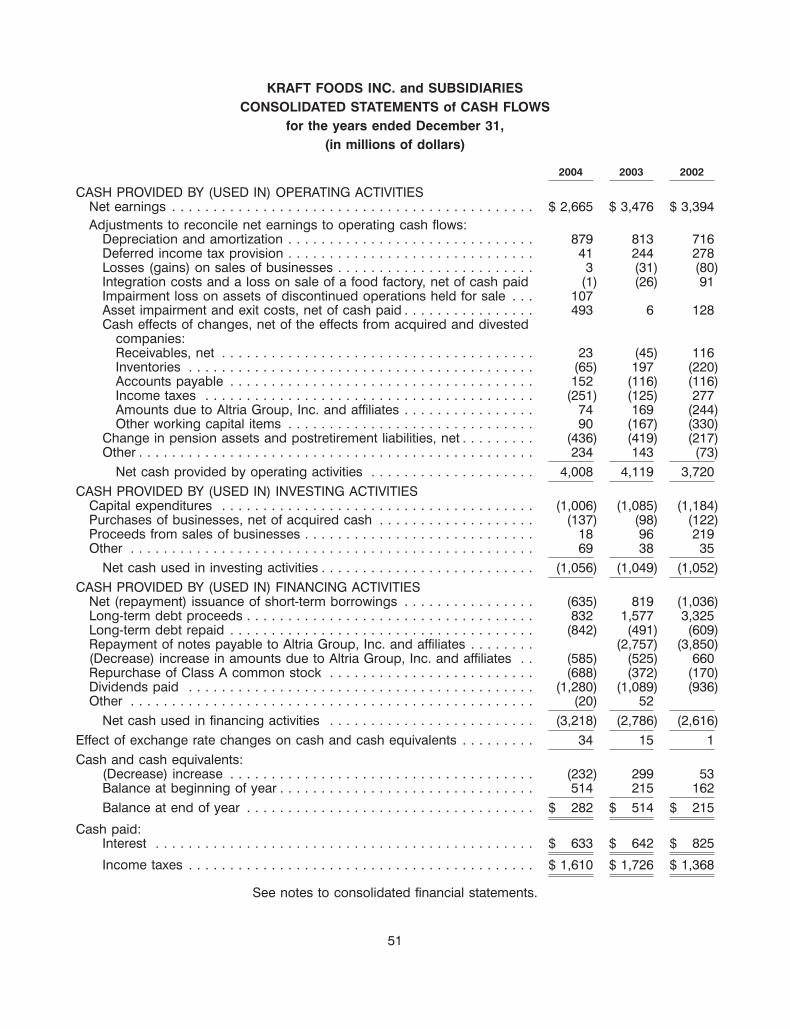
KRAFT FOODS INC. and SUBSIDIARIESCONSOLIDATED STATEMENTS of CASH FLOWS
for the years ended December 31,(in millions of dollars)
2004 2003 2002
CASH PROVIDED BY (USED IN) OPERATING ACTIVITIESNet earnings . . . . . . . . . . . . . . . . . . . . . . . . . . . . . . . . . . . . . . . . . . . . $ 2,665 $ 3,476 $ 3,394Adjustments to reconcile net earnings to operating cash flows:
Depreciation and amortization . . . . . . . . . . . . . . . . . . . . . . . . . . . . . . 879 813 716Deferred income tax provision . . . . . . . . . . . . . . . . . . . . . . . . . . . . . . 41 244 278Losses (gains) on sales of businesses . . . . . . . . . . . . . . . . . . . . . . . . 3 (31) (80)Integration costs and a loss on sale of a food factory, net of cash paid (1) (26) 91Impairment loss on assets of discontinued operations held for sale . . . 107Asset impairment and exit costs, net of cash paid . . . . . . . . . . . . . . . . 493 6 128Cash effects of changes, net of the effects from acquired and divested
companies:Receivables, net . . . . . . . . . . . . . . . . . . . . . . . . . . . . . . . . . . . . . . 23 (45) 116Inventories . . . . . . . . . . . . . . . . . . . . . . . . . . . . . . . . . . . . . . . . . . (65) 197 (220)Accounts payable . . . . . . . . . . . . . . . . . . . . . . . . . . . . . . . . . . . . . 152 (116) (116)Income taxes . . . . . . . . . . . . . . . . . . . . . . . . . . . . . . . . . . . . . . . . (251) (125) 277Amounts due to Altria Group, Inc. and affiliates . . . . . . . . . . . . . . . . 74 169 (244)Other working capital items . . . . . . . . . . . . . . . . . . . . . . . . . . . . . . 90 (167) (330)
Change in pension assets and postretirement liabilities, net . . . . . . . . . (436) (419) (217)Other . . . . . . . . . . . . . . . . . . . . . . . . . . . . . . . . . . . . . . . . . . . . . . . . 234 143 (73)
Net cash provided by operating activities . . . . . . . . . . . . . . . . . . . . 4,008 4,119 3,720CASH PROVIDED BY (USED IN) INVESTING ACTIVITIES
Capital expenditures . . . . . . . . . . . . . . . . . . . . . . . . . . . . . . . . . . . . . . (1,006) (1,085) (1,184)Purchases of businesses, net of acquired cash . . . . . . . . . . . . . . . . . . . (137) (98) (122)Proceeds from sales of businesses . . . . . . . . . . . . . . . . . . . . . . . . . . . . 18 96 219Other . . . . . . . . . . . . . . . . . . . . . . . . . . . . . . . . . . . . . . . . . . . . . . . . . 69 38 35
Net cash used in investing activities . . . . . . . . . . . . . . . . . . . . . . . . . . (1,056) (1,049) (1,052)CASH PROVIDED BY (USED IN) FINANCING ACTIVITIES
Net (repayment) issuance of short-term borrowings . . . . . . . . . . . . . . . . (635) 819 (1,036)Long-term debt proceeds . . . . . . . . . . . . . . . . . . . . . . . . . . . . . . . . . . . 832 1,577 3,325Long-term debt repaid . . . . . . . . . . . . . . . . . . . . . . . . . . . . . . . . . . . . . (842) (491) (609)Repayment of notes payable to Altria Group, Inc. and affiliates . . . . . . . . (2,757) (3,850)(Decrease) increase in amounts due to Altria Group, Inc. and affiliates . . (585) (525) 660Repurchase of Class A common stock . . . . . . . . . . . . . . . . . . . . . . . . . (688) (372) (170)Dividends paid . . . . . . . . . . . . . . . . . . . . . . . . . . . . . . . . . . . . . . . . . . (1,280) (1,089) (936)Other . . . . . . . . . . . . . . . . . . . . . . . . . . . . . . . . . . . . . . . . . . . . . . . . . (20) 52
Net cash used in financing activities . . . . . . . . . . . . . . . . . . . . . . . . . (3,218) (2,786) (2,616)Effect of exchange rate changes on cash and cash equivalents . . . . . . . . . 34 15 1Cash and cash equivalents:
(Decrease) increase . . . . . . . . . . . . . . . . . . . . . . . . . . . . . . . . . . . . . (232) 299 53Balance at beginning of year . . . . . . . . . . . . . . . . . . . . . . . . . . . . . . . 514 215 162Balance at end of year . . . . . . . . . . . . . . . . . . . . . . . . . . . . . . . . . . . $ 282 $ 514 $ 215
Cash paid:Interest . . . . . . . . . . . . . . . . . . . . . . . . . . . . . . . . . . . . . . . . . . . . . . $ 633 $ 642 $ 825
Income taxes . . . . . . . . . . . . . . . . . . . . . . . . . . . . . . . . . . . . . . . . . . $ 1,610 $ 1,726 $ 1,368
See notes to consolidated financial statements.
51
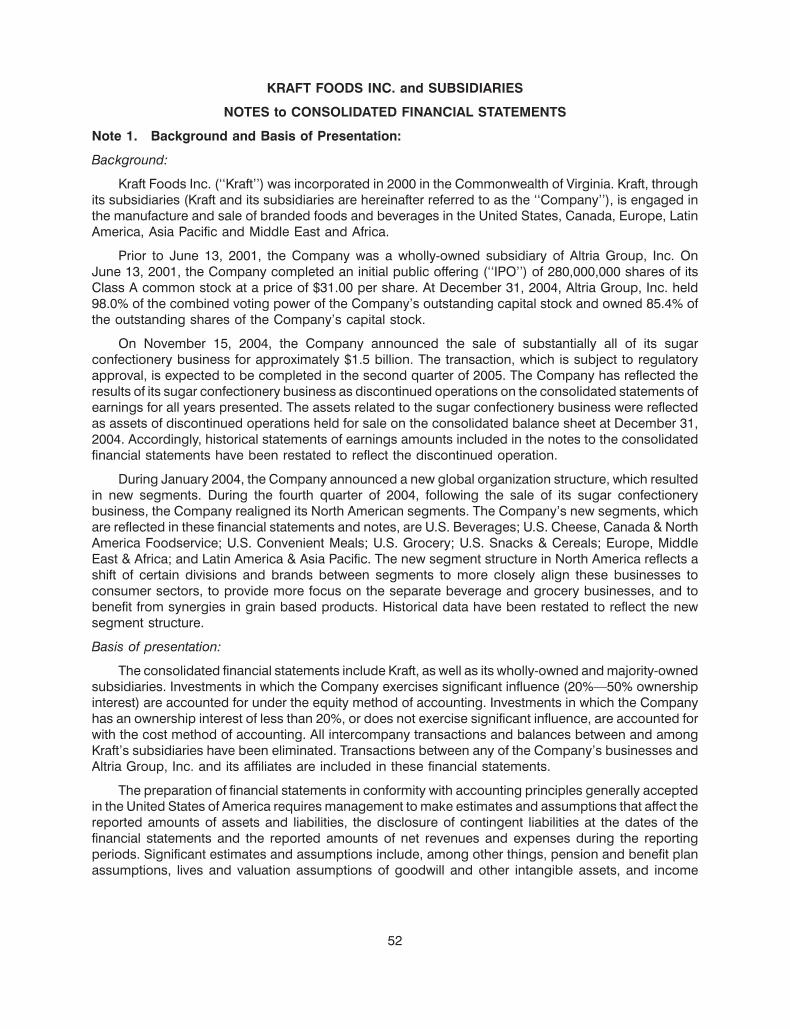
KRAFT FOODS INC. and SUBSIDIARIES
NOTES to CONSOLIDATED FINANCIAL STATEMENTS
Note 1. Background and Basis of Presentation:
Background:
Kraft Foods Inc. (‘‘Kraft’’) was incorporated in 2000 in the Commonwealth of Virginia. Kraft, throughits subsidiaries (Kraft and its subsidiaries are hereinafter referred to as the ‘‘Company’’), is engaged inthe manufacture and sale of branded foods and beverages in the United States, Canada, Europe, LatinAmerica, Asia Pacific and Middle East and Africa.
Prior to June 13, 2001, the Company was a wholly-owned subsidiary of Altria Group, Inc. OnJune 13, 2001, the Company completed an initial public offering (‘‘IPO’’) of 280,000,000 shares of itsClass A common stock at a price of $31.00 per share. At December 31, 2004, Altria Group, Inc. held98.0% of the combined voting power of the Company’s outstanding capital stock and owned 85.4% ofthe outstanding shares of the Company’s capital stock.
On November 15, 2004, the Company announced the sale of substantially all of its sugarconfectionery business for approximately $1.5 billion. The transaction, which is subject to regulatoryapproval, is expected to be completed in the second quarter of 2005. The Company has reflected theresults of its sugar confectionery business as discontinued operations on the consolidated statements ofearnings for all years presented. The assets related to the sugar confectionery business were reflectedas assets of discontinued operations held for sale on the consolidated balance sheet at December 31,2004. Accordingly, historical statements of earnings amounts included in the notes to the consolidatedfinancial statements have been restated to reflect the discontinued operation.
During January 2004, the Company announced a new global organization structure, which resultedin new segments. During the fourth quarter of 2004, following the sale of its sugar confectionerybusiness, the Company realigned its North American segments. The Company’s new segments, whichare reflected in these financial statements and notes, are U.S. Beverages; U.S. Cheese, Canada & NorthAmerica Foodservice; U.S. Convenient Meals; U.S. Grocery; U.S. Snacks & Cereals; Europe, MiddleEast & Africa; and Latin America & Asia Pacific. The new segment structure in North America reflects ashift of certain divisions and brands between segments to more closely align these businesses toconsumer sectors, to provide more focus on the separate beverage and grocery businesses, and tobenefit from synergies in grain based products. Historical data have been restated to reflect the newsegment structure.
Basis of presentation:
The consolidated financial statements include Kraft, as well as its wholly-owned and majority-ownedsubsidiaries. Investments in which the Company exercises significant influence (20%—50% ownershipinterest) are accounted for under the equity method of accounting. Investments in which the Companyhas an ownership interest of less than 20%, or does not exercise significant influence, are accounted forwith the cost method of accounting. All intercompany transactions and balances between and amongKraft’s subsidiaries have been eliminated. Transactions between any of the Company’s businesses andAltria Group, Inc. and its affiliates are included in these financial statements.
The preparation of financial statements in conformity with accounting principles generally acceptedin the United States of America requires management to make estimates and assumptions that affect thereported amounts of assets and liabilities, the disclosure of contingent liabilities at the dates of thefinancial statements and the reported amounts of net revenues and expenses during the reportingperiods. Significant estimates and assumptions include, among other things, pension and benefit planassumptions, lives and valuation assumptions of goodwill and other intangible assets, and income
52
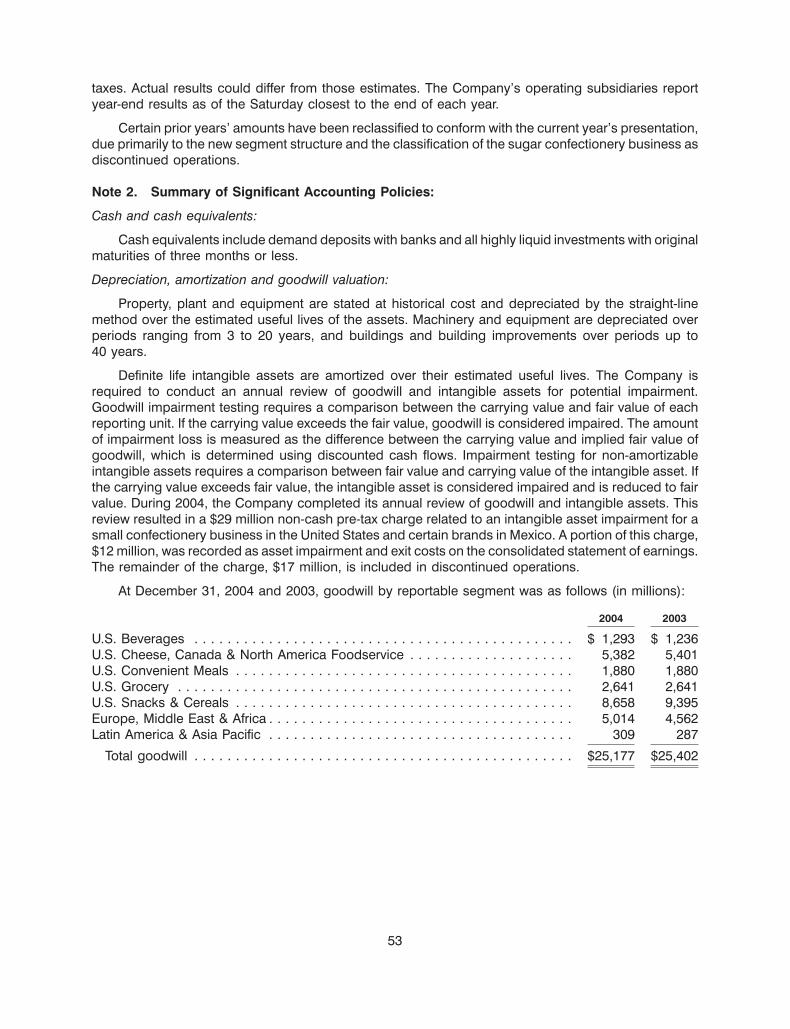
taxes. Actual results could differ from those estimates. The Company’s operating subsidiaries reportyear-end results as of the Saturday closest to the end of each year.
Certain prior years’ amounts have been reclassified to conform with the current year’s presentation,due primarily to the new segment structure and the classification of the sugar confectionery business asdiscontinued operations.
Note 2. Summary of Significant Accounting Policies:
Cash and cash equivalents:
Cash equivalents include demand deposits with banks and all highly liquid investments with originalmaturities of three months or less.
Depreciation, amortization and goodwill valuation:
Property, plant and equipment are stated at historical cost and depreciated by the straight-linemethod over the estimated useful lives of the assets. Machinery and equipment are depreciated overperiods ranging from 3 to 20 years, and buildings and building improvements over periods up to40 years.
Definite life intangible assets are amortized over their estimated useful lives. The Company isrequired to conduct an annual review of goodwill and intangible assets for potential impairment.Goodwill impairment testing requires a comparison between the carrying value and fair value of eachreporting unit. If the carrying value exceeds the fair value, goodwill is considered impaired. The amountof impairment loss is measured as the difference between the carrying value and implied fair value ofgoodwill, which is determined using discounted cash flows. Impairment testing for non-amortizableintangible assets requires a comparison between fair value and carrying value of the intangible asset. Ifthe carrying value exceeds fair value, the intangible asset is considered impaired and is reduced to fairvalue. During 2004, the Company completed its annual review of goodwill and intangible assets. Thisreview resulted in a $29 million non-cash pre-tax charge related to an intangible asset impairment for asmall confectionery business in the United States and certain brands in Mexico. A portion of this charge,$12 million, was recorded as asset impairment and exit costs on the consolidated statement of earnings.The remainder of the charge, $17 million, is included in discontinued operations.
At December 31, 2004 and 2003, goodwill by reportable segment was as follows (in millions):
2004 2003
U.S. Beverages . . . . . . . . . . . . . . . . . . . . . . . . . . . . . . . . . . . . . . . . . . . . . . $ 1,293 $ 1,236U.S. Cheese, Canada & North America Foodservice . . . . . . . . . . . . . . . . . . . . 5,382 5,401U.S. Convenient Meals . . . . . . . . . . . . . . . . . . . . . . . . . . . . . . . . . . . . . . . . . 1,880 1,880U.S. Grocery . . . . . . . . . . . . . . . . . . . . . . . . . . . . . . . . . . . . . . . . . . . . . . . . 2,641 2,641U.S. Snacks & Cereals . . . . . . . . . . . . . . . . . . . . . . . . . . . . . . . . . . . . . . . . . 8,658 9,395Europe, Middle East & Africa . . . . . . . . . . . . . . . . . . . . . . . . . . . . . . . . . . . . . 5,014 4,562Latin America & Asia Pacific . . . . . . . . . . . . . . . . . . . . . . . . . . . . . . . . . . . . . 309 287
Total goodwill . . . . . . . . . . . . . . . . . . . . . . . . . . . . . . . . . . . . . . . . . . . . . . $25,177 $25,402
53
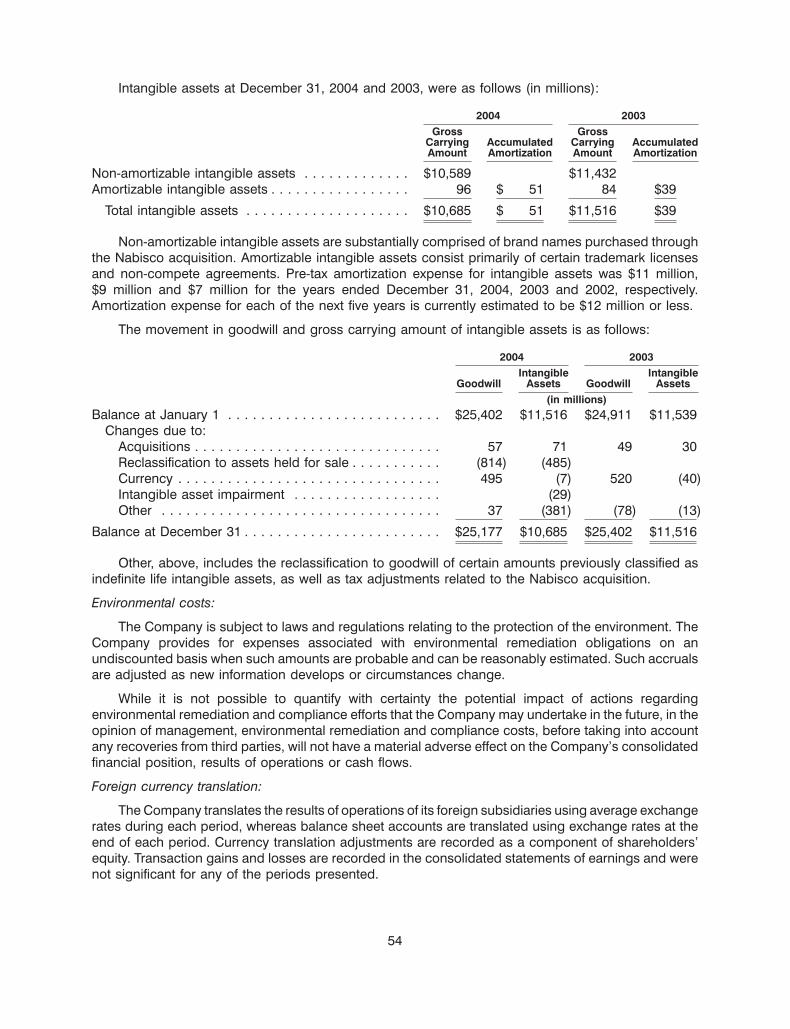
Intangible assets at December 31, 2004 and 2003, were as follows (in millions):
2004 2003Gross Gross
Carrying Accumulated Carrying AccumulatedAmount Amortization Amount Amortization
Non-amortizable intangible assets . . . . . . . . . . . . . $10,589 $11,432Amortizable intangible assets . . . . . . . . . . . . . . . . . 96 $ 51 84 $39
Total intangible assets . . . . . . . . . . . . . . . . . . . . $10,685 $ 51 $11,516 $39
Non-amortizable intangible assets are substantially comprised of brand names purchased throughthe Nabisco acquisition. Amortizable intangible assets consist primarily of certain trademark licensesand non-compete agreements. Pre-tax amortization expense for intangible assets was $11 million,$9 million and $7 million for the years ended December 31, 2004, 2003 and 2002, respectively.Amortization expense for each of the next five years is currently estimated to be $12 million or less.
The movement in goodwill and gross carrying amount of intangible assets is as follows:
2004 2003Intangible Intangible
Goodwill Assets Goodwill Assets(in millions)
Balance at January 1 . . . . . . . . . . . . . . . . . . . . . . . . . . $25,402 $11,516 $24,911 $11,539Changes due to:
Acquisitions . . . . . . . . . . . . . . . . . . . . . . . . . . . . . . 57 71 49 30Reclassification to assets held for sale . . . . . . . . . . . (814) (485)Currency . . . . . . . . . . . . . . . . . . . . . . . . . . . . . . . . 495 (7) 520 (40)Intangible asset impairment . . . . . . . . . . . . . . . . . . (29)Other . . . . . . . . . . . . . . . . . . . . . . . . . . . . . . . . . . 37 (381) (78) (13)
Balance at December 31 . . . . . . . . . . . . . . . . . . . . . . . . $25,177 $10,685 $25,402 $11,516
Other, above, includes the reclassification to goodwill of certain amounts previously classified asindefinite life intangible assets, as well as tax adjustments related to the Nabisco acquisition.
Environmental costs:
The Company is subject to laws and regulations relating to the protection of the environment. TheCompany provides for expenses associated with environmental remediation obligations on anundiscounted basis when such amounts are probable and can be reasonably estimated. Such accrualsare adjusted as new information develops or circumstances change.
While it is not possible to quantify with certainty the potential impact of actions regardingenvironmental remediation and compliance efforts that the Company may undertake in the future, in theopinion of management, environmental remediation and compliance costs, before taking into accountany recoveries from third parties, will not have a material adverse effect on the Company’s consolidatedfinancial position, results of operations or cash flows.
Foreign currency translation:
The Company translates the results of operations of its foreign subsidiaries using average exchangerates during each period, whereas balance sheet accounts are translated using exchange rates at theend of each period. Currency translation adjustments are recorded as a component of shareholders’equity. Transaction gains and losses are recorded in the consolidated statements of earnings and werenot significant for any of the periods presented.
54
Guarantees:
Effective January 1, 2003, the Company adopted Financial Accounting Standards Board (‘‘FASB’’)Interpretation No. 45, ‘‘Guarantor’s Accounting and Disclosure Requirements for Guarantees, IncludingIndirect Guarantees of Indebtedness of Others.’’ Interpretation No. 45 required the disclosure of certainguarantees existing at December 31, 2002. In addition, Interpretation No. 45 requires the recognition of aliability for the fair value of the obligation of qualifying guarantee activities initiated or modified afterDecember 31, 2002. The Company has applied the recognition provisions of Interpretation No. 45 toguarantee activity initiated after December 31, 2002. Adoption of Interpretation No. 45 as of January 1,2003 did not have a material impact on the Company’s consolidated financial statements. See Note 18.Contingencies for a further discussion of guarantees.
Hedging instruments:
Derivative financial instruments are recorded at fair value on the consolidated balance sheets aseither assets or liabilities. Changes in the fair value of derivatives are recorded each period either inaccumulated other comprehensive earnings (losses) or in earnings, depending on whether a derivativeis designated and effective as part of a hedge transaction and, if it is, the type of hedge transaction.Gains and losses on derivative instruments reported in accumulated other comprehensive earnings(losses) are reclassified to the consolidated statement of earnings in the periods in which operatingresults are affected by the hedged item. Cash flows from hedging instruments are classified in the samemanner as the affected hedged item in the consolidated statements of cash flows.
Impairment of long-lived assets:
The Company reviews long-lived assets, including amortizable intangible assets, for impairmentwhenever events or changes in business circumstances indicate that the carrying amount of the assetsmay not be fully recoverable. The Company performs undiscounted operating cash flow analyses todetermine if an impairment exists. For purposes of recognition and measurement of an impairment forassets held for use, the Company groups assets and liabilities at the lowest level for which cash flows areseparately identifiable. If an impairment is determined to exist, any related impairment loss is calculatedbased on fair value. Impairment losses on assets to be disposed of, if any, are based on the estimatedproceeds to be received, less costs of disposal.
Income taxes:
The Company accounts for income taxes in accordance with Statement of Financial AccountingStandards (‘‘SFAS’’) No. 109, ‘‘Accounting for Income Taxes.’’ The accounts of the Company areincluded in the consolidated federal income tax return of Altria Group, Inc. Income taxes are generallycomputed on a separate company basis. To the extent that foreign tax credits, capital losses and othercredits generated by the Company, which cannot currently be utilized on a separate company basis, areutilized in Altria Group, Inc.’s consolidated federal income tax return, the benefit is recognized in thecalculation of the Company’s provision for income taxes. Based on the Company’s current estimate, thisbenefit is calculated to be approximately $70 million, $100 million and $240 million for the years endedDecember 31, 2004, 2003 and 2002, respectively. The Company makes payments to, or is reimbursedby, Altria Group, Inc. for the tax effects resulting from its inclusion in Altria Group, Inc.’s consolidatedfederal income tax return. Significant judgment is required in determining income tax provisions and inevaluating tax positions. The Company establishes additional provisions for income taxes when, despitethe belief that their tax positions are fully supportable, there remain certain positions that are likely to bechallenged and that may not be sustained on review by tax authorities. The Company adjusts theseadditional accruals in light of changing facts and circumstances. The consolidated tax provisionincludes the impact of changes to accruals that are considered appropriate, as well as the related netinterest.
55
Inventories:
Inventories are stated at the lower of cost or market. The last-in, first-out (‘‘LIFO’’) method is used tocost a majority of domestic inventories. The cost of other inventories is principally determined by theaverage cost method.
In 2004, the FASB issued SFAS No. 151, ‘‘Inventory Costs.’’ SFAS No. 151 requires that abnormalidle facility expense, spoilage, freight and handling costs be recognized as current-period charges. Inaddition, SFAS No. 151 requires that allocation of fixed production overhead costs to inventories bebased on the normal capacity of the production facility. The Company is required to adopt the provisionsof SFAS No. 151 prospectively after January 1, 2006, but the effect of adoption is not expected to have amaterial impact on its consolidated results of operations, financial position or cash flows.
Marketing costs:
The Company promotes its products with advertising, consumer incentives and trade promotions.Such programs include, but are not limited to, discounts, coupons, rebates, in-store display incentivesand volume- based incentives. Advertising costs are expensed as incurred. Consumer incentive andtrade promotion activities are recorded as a reduction of revenues based on amounts estimated asbeing due to customers and consumers at the end of a period, based principally on historical utilizationand redemption rates. For interim reporting purposes, advertising and consumer incentive expenses arecharged to operations as a percentage of volume, based on estimated volume and related expense forthe full year.
Revenue recognition:
The Company recognizes revenues, net of sales incentives and including shipping and handlingcharges billed to customers, upon shipment of goods when title and risk of loss pass to customers.Shipping and handling costs are classified as part of cost of sales.
Software costs:
The Company capitalizes certain computer software and software development costs incurred inconnection with developing or obtaining computer software for internal use. Capitalized software costsare included in property, plant and equipment on the consolidated balance sheets and amortized on astraight-line basis over the estimated useful lives of the software, which do not exceed five years.
Stock-based compensation:
The Company accounts for employee stock compensation plans in accordance with the intrinsicvalue-based method permitted by SFAS No. 123, ‘‘Accounting for Stock-Based Compensation,’’ whichhas not resulted in compensation cost for stock options. The market value at date of grant of restrictedstock and rights to receive shares of stock is recorded as compensation expense over the period ofrestriction.
At December 31, 2004, the Company had stock-based employee compensation plans, which aredescribed more fully in Note 11. Stock Plans. The Company applies the recognition and measurementprinciples of Accounting Principles Board Opinion No. 25, ‘‘Accounting for Stock Issued to Employees,’’and related Interpretations in accounting for stock options within those plans. No compensationexpense for employee stock options is reflected in net earnings, as all stock options granted under thoseplans had an exercise price equal to the market value of the common stock on the date of grant. Netearnings, as reported, includes pre-tax compensation expense related to restricted stock and rights toreceive shares of stock of $106 million, $57 million and $4 million for the years ended December 31,2004, 2003 and 2002, respectively. The following table illustrates the effect on net earnings and earningsper share (‘‘EPS’’) if the Company had applied the fair value recognition provisions of SFAS No. 123 to
56
measure stock-based compensation expense for outstanding stock option awards for the years endedDecember 31, 2004, 2003 and 2002 (in millions, except per share data):
2004 2003 2002
Net earnings, as reported . . . . . . . . . . . . . . . . . . . . . . . . . . . . . . . . . . $2,665 $3,476 $3,394Deduct:Total stock-based employee compensation expense determined under
fair value method for all stock option awards, net of related tax effects 7 12 78
Pro forma net earnings . . . . . . . . . . . . . . . . . . . . . . . . . . . . . . . . . . . . $2,658 $3,464 $3,316
Earnings per share:Basic—as reported . . . . . . . . . . . . . . . . . . . . . . . . . . . . . . . . . . . . . $ 1.56 $ 2.01 $ 1.96
Basic—pro forma . . . . . . . . . . . . . . . . . . . . . . . . . . . . . . . . . . . . . . $ 1.56 $ 2.01 $ 1.91
Diluted—as reported . . . . . . . . . . . . . . . . . . . . . . . . . . . . . . . . . . . . $ 1.55 $ 2.01 $ 1.96
Diluted—pro forma . . . . . . . . . . . . . . . . . . . . . . . . . . . . . . . . . . . . . $ 1.55 $ 2.00 $ 1.91
In 2004, the FASB issued SFAS No. 123 (revised 2004), ‘‘Share-Based Payment’’ (‘‘SFASNo. 123R’’). SFAS No. 123R requires companies to measure compensation cost for share-basedpayments at fair value. The Company will adopt this new standard prospectively on July 1, 2005, anddoes not expect the adoption of SFAS No. 123R to have a material impact on its 2005 consolidatedfinancial position, results of operations or cash flows.
Note 3. Asset Impairment, Exit and Implementation Costs:
Restructuring Program:
In January 2004, the Company announced a three-year restructuring program with the objectives ofleveraging the Company’s global scale, realigning and lowering its cost structure, and optimizingcapacity utilization. As part of this program, the Company anticipates the closing or sale of up to twentyplants and the elimination of approximately six thousand positions. From 2004 through 2006, theCompany expects to incur up to $1.2 billion in pre-tax charges, reflecting asset disposals, severance andother implementation costs, including $641 million incurred in 2004. Approximately one-half of thepre-tax charges are expected to require cash payments.
Restructuring Costs:
During 2004, pre-tax charges under the restructuring program of $583 million were recorded asasset impairment and exit costs on the consolidated statement of earnings. These charges resulted fromthe 2004 announcement of the closing of thirteen plants, the termination of co-manufacturingagreements and the commencement of a number of workforce reduction programs. Approximately$216 million of the pre-tax charges incurred in 2004 will require cash payments.
57
Pre-tax restructuring liability activity for the year ended December 31, 2004, was as follows:
AssetSeverance Write-downs Other Total
(in millions)Liability balance, January 1, 2004 . . . . . . . . . . . . . . . $ — $ — $ — $ —
Charges . . . . . . . . . . . . . . . . . . . . . . . . . . . . . . . . 176 363 44 583Cash spent . . . . . . . . . . . . . . . . . . . . . . . . . . . . . . (84) (26) (110)Charges against assets . . . . . . . . . . . . . . . . . . . . . (5) (363) (368)Currency . . . . . . . . . . . . . . . . . . . . . . . . . . . . . . . 4 1 5
Liability balance, December 31, 2004 . . . . . . . . . . . . . $ 91 $ — $ 19 $ 110
Severance costs in the above schedule, which relate to the workforce reduction programs, includethe cost of related benefits. Specific programs announced during 2004, as part of the overallrestructuring program, will result in the elimination of approximately 3,500 positions. Asset write-downsrelate to the impairment of assets caused by the plant closings. Other costs incurred relate primarily tocontract termination costs associated with the plant closings and the termination of co-manufacturingagreements.
Implementation Costs:
During 2004, the Company recorded $58 million of pre-tax implementation costs associated withthe restructuring program, of which $7 million was recorded as a reduction of net revenues, $30 millionwas recorded in cost of sales, $13 million was recorded in marketing, administration and research costs,and $8 million related to the sugar confectionery business was recorded in loss from discontinuedoperations, on the consolidated statement of earnings. These costs include the discontinuance ofcertain product lines and incremental costs related to the integration of functions and closure of facilities.Approximately $36 million of these costs will require cash payments.
Asset Impairment Charges:
During 2004, the Company completed its annual review of goodwill and intangible assets. Thisreview resulted in a $29 million non-cash pre-tax charge related to an intangible asset impairment for asmall confectionery business in the United States and certain brands in Mexico. A portion of this charge,$17 million, relates to the sugar confectionery business and has been recorded in loss fromdiscontinued operations on the consolidated statement of earnings. The remaining charge wasrecorded as asset impairment and exit costs on the consolidated statement of earnings.
In November 2004, the Company completed a valuation of its equity investment in a joint venture inTurkey following the determination that a non-temporary decline in value had occurred. This valuationresulted in a $47 million non-cash pre-tax charge. This charge was recorded as marketing,administration and research costs on the consolidated statement of earnings.
On November 15, 2004, the Company announced the sale of substantially all of its sugarconfectionery business for approximately $1.5 billion. As a result of the anticipated transaction, which isexpected to close in the second quarter of 2005, the Company recorded non-cash asset impairmentstotaling $107 million. This charge was included in loss from discontinued operations on the consolidatedstatement of earnings.
In December 2004, the Company announced the sale of its yogurt business for approximately$59 million. As a result of the anticipated transaction, which is expected to close in the first quarter of2005, the Company recorded asset impairments totaling $8 million. This charge was recorded as assetimpairment and exit costs on the consolidated statement of earnings.
58
Total:
The pre-tax asset impairment, exit and implementation costs discussed above, for the year endedDecember 31, 2004, were included in the operating companies income of the following segments:
Total EquityAsset Impairment
Impairment andRestructuring Asset and Exit Implementation
Costs Impairment Costs Costs Total(in millions)
U.S. Beverages . . . . . . . . . . . . . . . . . $ 9 $ — $ 9 $ 4 $ 13U.S. Cheese, Canada & North America
Foodservice . . . . . . . . . . . . . . . . . . 103 8 111 8 119U.S. Convenient Meals . . . . . . . . . . . . 41 41 4 45U.S. Grocery . . . . . . . . . . . . . . . . . . . 8 8 6 14U.S. Snacks & Cereals . . . . . . . . . . . . 222 222 18 240Europe, Middle East & Africa . . . . . . . 180 180 56 236Latin America & Asia Pacific . . . . . . . . 20 12 32 1 33
Total—Continuing Operations . . . . . . . 583 20 603 97 700Discontinued Operations . . . . . . . . . . 124 124 8 132
Total . . . . . . . . . . . . . . . . . . . . . . . . . $583 $144 $727 $105 $832
Other:
During 2003, the Company recorded a pre-tax charge of $6 million for asset impairment and exitcosts related to the closure of a Nordic snacks plant. During 2002, the Company recorded a pre-taxcharge of $142 million related to employee acceptances under a voluntary retirement program.Approximately 700 employees elected to retire or terminate employment under the program. Thesecharges were included in the operating companies income of the following segments for the yearsended December 31, 2003 and 2002:
2003 2002(in millions)
U.S. Beverages . . . . . . . . . . . . . . . . . . . . . . . . . . . . . . . . . . . . . . . . . . . . . . . . . . . $ 27U.S. Cheese, Canada & North America Foodservice . . . . . . . . . . . . . . . . . . . . . . . . . 43U.S. Convenient Meals . . . . . . . . . . . . . . . . . . . . . . . . . . . . . . . . . . . . . . . . . . . . . . 36U.S. Grocery . . . . . . . . . . . . . . . . . . . . . . . . . . . . . . . . . . . . . . . . . . . . . . . . . . . . . 20U.S. Snacks & Cereals . . . . . . . . . . . . . . . . . . . . . . . . . . . . . . . . . . . . . . . . . . . . . . 9Europe, Middle East & Africa . . . . . . . . . . . . . . . . . . . . . . . . . . . . . . . . . . . . . . . . . . $6 5Latin America & Asia Pacific . . . . . . . . . . . . . . . . . . . . . . . . . . . . . . . . . . . . . . . . . . 2
Asset impairment and exit costs . . . . . . . . . . . . . . . . . . . . . . . . . . . . . . . . . . . . . . $6 $142
Note 4. Related Party Transactions:
Altria Group, Inc.’s subsidiary, Altria Corporate Services, Inc., provides the Company with variousservices, including planning, legal, treasury, accounting, auditing, insurance, human resources, office ofthe secretary, corporate affairs, information technology, aviation and tax services. Billings for theseservices, which were based on the cost to Altria Corporate Services, Inc. to provide such services and amanagement fee, were $310 million, $318 million and $327 million for the years ended December 31,2004, 2003 and 2002, respectively. These costs were paid to Altria Corporate Services, Inc. monthly.Although the cost of these services cannot be quantified on a stand-alone basis, management has
59
assessed that the billings are reasonable based on the level of support provided by Altria CorporateServices, Inc., and that they reflect all services provided. The cost and nature of the services arereviewed annually by the Company’s Audit Committee, which is comprised of independent directors.The effects of these transactions are included in operating cash flows in the Company’s consolidatedstatements of cash flows.
In December 2004, the Company purchased two corporate aircraft from Altria CorporateServices, Inc. for an aggregate purchase price of approximately $47 million. The Company also enteredinto an Aircraft Management Agreement with Altria Corporate Services, Inc. in December 2004, pursuantto which Altria Corporate Services, Inc. agreed to perform aircraft management, pilot services,maintenance and other aviation services for the Company.
During 2004, Altria Corporate Services, Inc. provided to the Company certain financial services,including payroll and accounts payable processing, at a cost of approximately $25 million, which wasincluded in the $310 million charge shown above. Beginning in 2005, the Company will perform thesefunctions for itself at a similar cost.
At December 31, 2004 and 2003, the Company had short-term amounts payable to AltriaGroup, Inc. of $227 million and $543 million, respectively. Interest on these borrowings is based on theapplicable London Interbank Offered Rate.
The fair values of the Company’s short-term amounts due to Altria Group, Inc. and affiliatesapproximate carrying amounts.
Note 5. Divestitures:
Discontinued Operations:
On November 15, 2004, the Company announced the sale of substantially all of its sugarconfectionery business for approximately $1.5 billion. The proposed sale includes the Life Savers,Creme Savers, Altoids, Trolli and Sugus brands. The transaction, which is subject to regulatory approval,is expected to be completed in the second quarter of 2005. The Company has reflected the results of itssugar confectionery business as discontinued operations on the consolidated statements of earningsfor all years presented. Pursuant to the sugar confectionery sale agreement, the Company has agreed toprovide certain transition and supply services to the buyer. These service arrangements are primarily forterms of one year or less, with the exception of one supply arrangement with a term of not more thanthree years. The expected cash flow from this supply arrangement is not significant.
Summary results of operations for the sugar confectionery business were as follows:
For the Years EndedDecember 31,
2004 2003 2002(in millions)
Net revenues . . . . . . . . . . . . . . . . . . . . . . . . . . . . . . . . . . . . . . . . . . . . . . . $477 $512 $475
Earnings before income taxes . . . . . . . . . . . . . . . . . . . . . . . . . . . . . . . . . . . $103 $151 $153Impairment loss on assets of discontinued operations held for sale . . . . . . . . (107)Provision for income taxes . . . . . . . . . . . . . . . . . . . . . . . . . . . . . . . . . . . . . 54 56
(Loss) earnings from discontinued operations, net of income taxes . . . . . . . . $ (4) $ 97 $ 97
60
In addition, the Company expects additional tax expense of approximately $270 million to berecorded as a loss on sale of discontinued operations in 2005. In accordance with the provisions ofSFAS No. 109, the tax expense will be recorded when the transaction is consummated.
The assets of the sugar confectionery business, which were reflected as assets of discontinuedoperations held for sale on the consolidated balance sheet at December 31, 2004, were as follows (inmillions):
Inventories . . . . . . . . . . . . . . . . . . . . . . . . . . . . . . . . . . . . . . . . . . . . . . . . . . . . . . . . . . $ 65Property, plant and equipment, net . . . . . . . . . . . . . . . . . . . . . . . . . . . . . . . . . . . . . . . . . 201Goodwill . . . . . . . . . . . . . . . . . . . . . . . . . . . . . . . . . . . . . . . . . . . . . . . . . . . . . . . . . . . . 814Other intangible assets, net . . . . . . . . . . . . . . . . . . . . . . . . . . . . . . . . . . . . . . . . . . . . . . 485Impairment loss on assets of discontinued operations held for sale . . . . . . . . . . . . . . . . . . (107)
Assets of discontinued operations held for sale . . . . . . . . . . . . . . . . . . . . . . . . . . . . . . $1,458
Other:
During 2004, the Company sold a Brazilian snack nuts business and trademarks associated with acandy business in Norway. The aggregate proceeds received from the sale of these businesses were$18 million, on which pre-tax losses of $3 million were recorded. In December 2004, the Companyannounced the sale of its U.K. desserts business for approximately $135 million, which is expected toresult in an estimated gain of $0.04 per share. The transaction, which is subject to required approvals, isexpected to close in the first quarter of 2005, following completion of necessary employee consultationrequirements. The Company also announced in December 2004, the sale of its yogurt business forapproximately $59 million, which is expected to result in an after-tax loss of approximately $12 million($5 million in 2004, with the remainder at closing). The transaction, which is also subject to regulatoryapproval, is expected to be completed in the first quarter of 2005.
During 2003, the Company sold a European rice business and a branded fresh cheese business inItaly. The aggregate proceeds received from sales of businesses were $96 million, on which theCompany recorded pre-tax gains of $31 million.
During 2002, the Company sold several small North American food businesses, some of which hadbeen previously classified as businesses held for sale arising from the acquisition of Nabisco. The netrevenues and operating results of the businesses held for sale, which were not significant, wereexcluded from the Company’s consolidated statements of earnings, and no gain or loss was recognizedon these sales. In addition, the Company sold its Latin American yeast and industrial bakery ingredientsbusiness for approximately $110 million and recorded a pre-tax gain of $69 million. The aggregateproceeds received from sales of businesses were $219 million, on which the Company recorded pre-taxgains of $80 million.
The operating results of the other businesses sold, discussed above, were not material to theCompany’s consolidated financial position, results of operations or cash flows in any of the periodspresented.
Note 6. Acquisitions:
During 2004, the Company acquired a U.S.-based beverage business for a total cost of $137 million.
During 2003, the Company acquired a biscuits business in Egypt and trademarks associated with asmall U.S.-based natural foods business. The total cost of these and other smaller acquisitions was$98 million.
During 2002, the Company acquired a snacks business in Turkey and a biscuits business inAustralia. The total cost of these and other smaller acquisitions was $122 million.
61
The effects of these acquisitions were not material to the Company’s consolidated financial position,results of operations or cash flows in any of the periods presented.
Note 7. Inventories:
The cost of approximately 37% and 39% of inventories in 2004 and 2003, respectively, wasdetermined using the LIFO method. The stated LIFO amounts of inventories were approximately$81 million and $155 million higher than the current cost of inventories at December 31, 2004 and 2003,respectively.
Note 8. Short-Term Borrowings and Borrowing Arrangements:
At December 31, 2004 and 2003, the Company had short-term borrowings of $1,818 million and$2,453 million, respectively, consisting principally of commercial paper borrowings with an averageyear-end interest rate of 2.4% and 1.4%, respectively. Of these amounts, the Company reclassified$1,900 million at December 31, 2003, of the commercial paper borrowings to long-term debt basedupon its intent and ability to refinance these borrowings on a long-term basis.
The fair values of the Company’s short-term borrowings at December 31, 2004 and 2003, basedupon current market interest rates, approximate the amounts disclosed above.
Following a $10.1 billion judgment on March 21, 2003, against Altria Group, Inc.’s domestic tobaccosubsidiary, Philip Morris USA Inc., the three major credit rating agencies took a series of ratings actionsresulting in the lowering of the Company’s short-term and long-term debt ratings, despite the fact theCompany is neither a party to, nor has exposure to, this litigation. The Company’s credit ratings byMoody’s at December 31, 2004, were ‘‘P-2’’ for short-term debt and ‘‘A3’’ for long-term-debt, with stableoutlook. The Company’s credit ratings by Standard & Poor’s at December 31, 2004 were ‘‘A-2’’ forshort-term debt and ‘‘BBB+’’ for long-term debt, with stable outlook. The Company’s credit ratings byFitch Rating Services at December 31, 2004 were ‘‘F-2’’ for short-term debt and ‘‘BBB+’’ for long-termdebt, with stable outlook. None of the Company’s debt agreements requires accelerated repayment inthe event of a decrease in credit ratings.
The Company maintains revolving credit facilities that have historically been used to support theissuance of commercial paper. The 364-day revolving credit facility expires in July 2005, although itcontains a provision allowing the Company to extend the maturity of outstanding borrowings for up toone additional year. At December 31, 2004, credit lines for the Company and the related activity were asfollows (in billions of dollars):
CommercialCredit Amount Paper
Type Lines Drawn Outstanding
364-day (expires July 2005) . . . . . . . . . . . . . . . . . . . . . . . . . . . . . . . $2.5 $ — $ —Multi-year (expires July 2006) . . . . . . . . . . . . . . . . . . . . . . . . . . . . . . 2.0 1.7
$4.5 $ — $1.7
The Company’s revolving credit facilities, which are for its sole use, require the maintenance of aminimum net worth of $18.2 billion. At December 31, 2004, the Company’s net worth was $29.9 billion.The Company expects to continue to meet this covenant. The foregoing revolving credit facilities do notinclude any other financial tests, any credit rating triggers or any provisions that could require theposting of collateral.
In addition to the above, certain international subsidiaries of Kraft maintain uncommitted credit linesto meet the short-term working capital needs of the international businesses. These credit lines, whichamounted to approximately $600 million as of December 31, 2004, are for the sole use of the Company’s
62
international businesses. Borrowings on these lines amounted to approximately $150 million and$220 million at December 31, 2004 and 2003, respectively.
Note 9. Long-Term Debt:
At December 31, 2004 and 2003, the Company’s long-term debt consisted of the following:
2004 2003(in millions)
Short-term borrowings, reclassified as long-term debt . . . . . . . . . . . . . . . . . . . $ — $ 1,900Notes, 4.00% to 7.55% (average effective rate 5.57%), due through 2031 . . . . . 10,259 10,2567% Debenture (effective rate 11.32%), $200 million face amount, due 2011 . . . 161 157Foreign currency obligations . . . . . . . . . . . . . . . . . . . . . . . . . . . . . . . . . . . . . 15 16Other . . . . . . . . . . . . . . . . . . . . . . . . . . . . . . . . . . . . . . . . . . . . . . . . . . . . . . 38 37
10,473 12,366Less current portion of long-term debt . . . . . . . . . . . . . . . . . . . . . . . . . . . . . . (750) (775)
$ 9,723 $11,591
Aggregate maturities of long-term debt are as follows (in millions):
2005 . . . . . . . . . . . . . . . . . . . . . . . . . . . . . . . . . . . . . . . . . . . . . . . . . . . $ 7502006 . . . . . . . . . . . . . . . . . . . . . . . . . . . . . . . . . . . . . . . . . . . . . . . . . . . 1,2602007 . . . . . . . . . . . . . . . . . . . . . . . . . . . . . . . . . . . . . . . . . . . . . . . . . . . 1,4032008 . . . . . . . . . . . . . . . . . . . . . . . . . . . . . . . . . . . . . . . . . . . . . . . . . . . 7042009 . . . . . . . . . . . . . . . . . . . . . . . . . . . . . . . . . . . . . . . . . . . . . . . . . . . 7522010-2014 . . . . . . . . . . . . . . . . . . . . . . . . . . . . . . . . . . . . . . . . . . . . . . . 4,504Thereafter . . . . . . . . . . . . . . . . . . . . . . . . . . . . . . . . . . . . . . . . . . . . . . . 1,140
Based on market quotes, where available, or interest rates currently available to the Company forissuance of debt with similar terms and remaining maturities, the aggregate fair value of the Company’slong-term debt, including the current portion of long-term debt, was $11,017 million and $12,873 millionat December 31, 2004 and 2003, respectively.
63
Note 10. Capital Stock:
The Company’s articles of incorporation authorize 3.0 billion shares of Class A common stock,2.0 billion shares of Class B common stock and 500 million shares of preferred stock. Shares of Class Acommon stock issued, repurchased and outstanding were as follows:
Shares SharesShares Issued Repurchased Outstanding
Balance at January 1, 2002 . . . . . . . . . . . . . . . . . . . . . 555,000,000 — 555,000,000Repurchase of shares . . . . . . . . . . . . . . . . . . . . . . . . . (4,383,150) (4,383,150)Exercise of stock options . . . . . . . . . . . . . . . . . . . . . . . 2,000 2,000
Balance at December 31, 2002 . . . . . . . . . . . . . . . . . . . 555,000,000 (4,381,150) 550,618,850Repurchase of shares . . . . . . . . . . . . . . . . . . . . . . . . . (12,508,908) (12,508,908)Exercise of stock options and issuance of other stock
awards . . . . . . . . . . . . . . . . . . . . . . . . . . . . . . . . . . 3,827,182 3,827,182
Balance at December 31, 2003 . . . . . . . . . . . . . . . . . . . 555,000,000 (13,062,876) 541,937,124Repurchase of shares . . . . . . . . . . . . . . . . . . . . . . . . . (21,543,660) (21,543,660)Exercise of stock options and issuance of other stock
awards . . . . . . . . . . . . . . . . . . . . . . . . . . . . . . . . . . 4,961,610 4,961,610
Balance at December 31, 2004 . . . . . . . . . . . . . . . . . . . 555,000,000 (29,644,926) 525,355,074
Kraft repurchases its Class A common stock in open market transactions. On December 14, 2004,Kraft completed a multi-year $700 million Class A common stock repurchase program, acquiring21,718,847 Class A shares at an average price of $32.23 per share. During 2004, repurchases under the$700 million program were 20,135,247 shares at a cost of $650 million, or $32.28 per share. OnDecember 14, 2004, the Company commenced repurchasing shares under a new $1.5 billion Class Acommon stock repurchase program that was authorized by the Board of Directors on December 2, 2004.Through December 31, 2004, repurchases under the $1.5 billion program were 1,408,413 shares at acost of $50 million, or $35.49 per share. On December 3, 2003, Kraft completed a $500 million Class Acommon stock repurchase program, acquiring 15,308,458 Class A shares at an average price of $32.66per share.
In addition, 1.18 billion Class B common shares were issued and outstanding at December 31, 2004and 2003. Altria Group, Inc. holds 276.5 million Class A common shares and all of the Class B commonshares at December 31, 2004. There are no preferred shares issued and outstanding. Class A commonshares are entitled to one vote each, while Class B common shares are entitled to ten votes each.Therefore, Altria Group, Inc. holds 98.0% of the combined voting power of the Company’s outstandingcapital stock at December 31, 2004. At December 31, 2004, 66,663,515 shares of common stock werereserved for stock options and other stock awards.
64
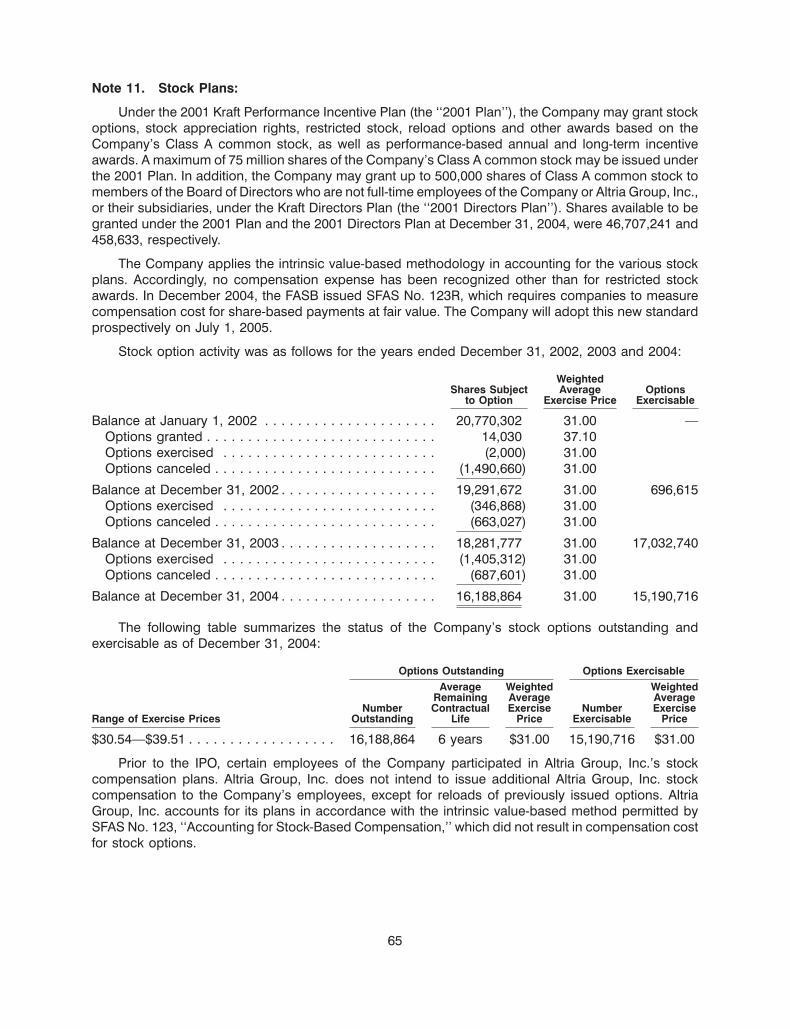
Note 11. Stock Plans:
Under the 2001 Kraft Performance Incentive Plan (the ‘‘2001 Plan’’), the Company may grant stockoptions, stock appreciation rights, restricted stock, reload options and other awards based on theCompany’s Class A common stock, as well as performance-based annual and long-term incentiveawards. A maximum of 75 million shares of the Company’s Class A common stock may be issued underthe 2001 Plan. In addition, the Company may grant up to 500,000 shares of Class A common stock tomembers of the Board of Directors who are not full-time employees of the Company or Altria Group, Inc.,or their subsidiaries, under the Kraft Directors Plan (the ‘‘2001 Directors Plan’’). Shares available to begranted under the 2001 Plan and the 2001 Directors Plan at December 31, 2004, were 46,707,241 and458,633, respectively.
The Company applies the intrinsic value-based methodology in accounting for the various stockplans. Accordingly, no compensation expense has been recognized other than for restricted stockawards. In December 2004, the FASB issued SFAS No. 123R, which requires companies to measurecompensation cost for share-based payments at fair value. The Company will adopt this new standardprospectively on July 1, 2005.
Stock option activity was as follows for the years ended December 31, 2002, 2003 and 2004:
WeightedShares Subject Average Options
to Option Exercise Price Exercisable
Balance at January 1, 2002 . . . . . . . . . . . . . . . . . . . . . 20,770,302 31.00 —Options granted . . . . . . . . . . . . . . . . . . . . . . . . . . . . 14,030 37.10Options exercised . . . . . . . . . . . . . . . . . . . . . . . . . . (2,000) 31.00Options canceled . . . . . . . . . . . . . . . . . . . . . . . . . . . (1,490,660) 31.00
Balance at December 31, 2002 . . . . . . . . . . . . . . . . . . . 19,291,672 31.00 696,615Options exercised . . . . . . . . . . . . . . . . . . . . . . . . . . (346,868) 31.00Options canceled . . . . . . . . . . . . . . . . . . . . . . . . . . . (663,027) 31.00
Balance at December 31, 2003 . . . . . . . . . . . . . . . . . . . 18,281,777 31.00 17,032,740Options exercised . . . . . . . . . . . . . . . . . . . . . . . . . . (1,405,312) 31.00Options canceled . . . . . . . . . . . . . . . . . . . . . . . . . . . (687,601) 31.00
Balance at December 31, 2004 . . . . . . . . . . . . . . . . . . . 16,188,864 31.00 15,190,716
The following table summarizes the status of the Company’s stock options outstanding andexercisable as of December 31, 2004:
Options Outstanding Options ExercisableAverage Weighted Weighted
Remaining Average AverageNumber Contractual Exercise Number Exercise
Range of Exercise Prices Outstanding Life Price Exercisable Price
$30.54—$39.51 . . . . . . . . . . . . . . . . . . 16,188,864 6 years $31.00 15,190,716 $31.00
Prior to the IPO, certain employees of the Company participated in Altria Group, Inc.’s stockcompensation plans. Altria Group, Inc. does not intend to issue additional Altria Group, Inc. stockcompensation to the Company’s employees, except for reloads of previously issued options. AltriaGroup, Inc. accounts for its plans in accordance with the intrinsic value-based method permitted bySFAS No. 123, ‘‘Accounting for Stock-Based Compensation,’’ which did not result in compensation costfor stock options.
65
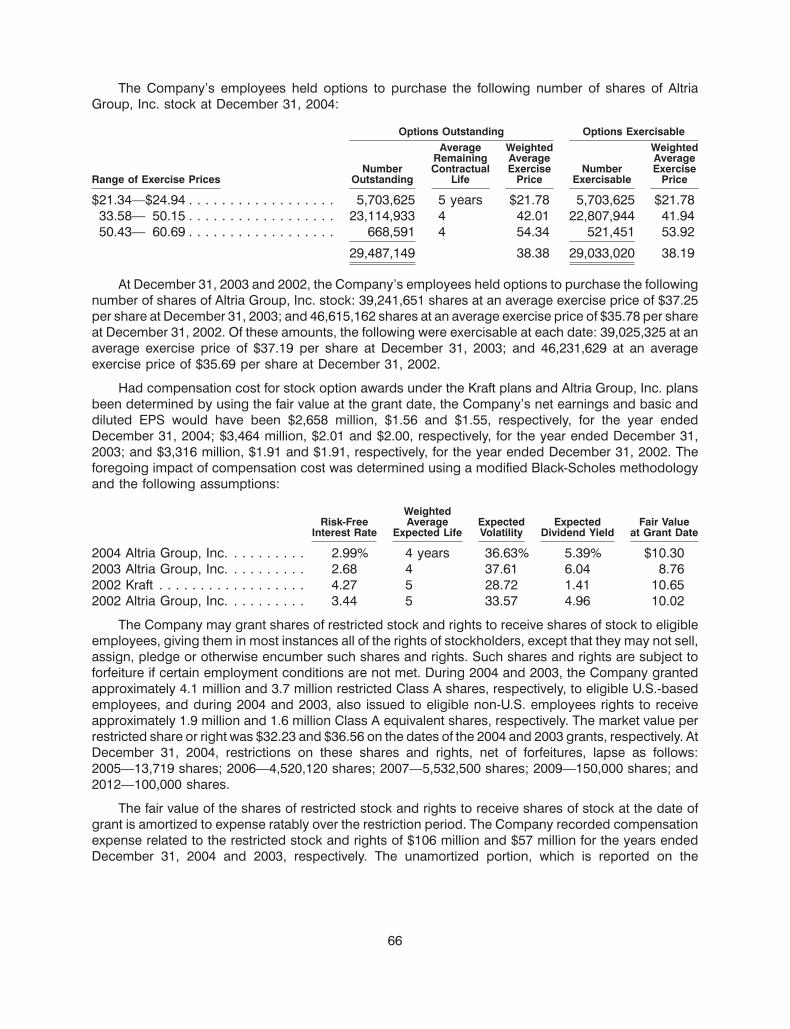
The Company’s employees held options to purchase the following number of shares of AltriaGroup, Inc. stock at December 31, 2004:
Options Outstanding Options ExercisableAverage Weighted Weighted
Remaining Average AverageNumber Contractual Exercise Number Exercise
Range of Exercise Prices Outstanding Life Price Exercisable Price
$21.34—$24.94 . . . . . . . . . . . . . . . . . . 5,703,625 5 years $21.78 5,703,625 $21.7833.58— 50.15 . . . . . . . . . . . . . . . . . . 23,114,933 4 42.01 22,807,944 41.9450.43— 60.69 . . . . . . . . . . . . . . . . . . 668,591 4 54.34 521,451 53.92
29,487,149 38.38 29,033,020 38.19
At December 31, 2003 and 2002, the Company’s employees held options to purchase the followingnumber of shares of Altria Group, Inc. stock: 39,241,651 shares at an average exercise price of $37.25per share at December 31, 2003; and 46,615,162 shares at an average exercise price of $35.78 per shareat December 31, 2002. Of these amounts, the following were exercisable at each date: 39,025,325 at anaverage exercise price of $37.19 per share at December 31, 2003; and 46,231,629 at an averageexercise price of $35.69 per share at December 31, 2002.
Had compensation cost for stock option awards under the Kraft plans and Altria Group, Inc. plansbeen determined by using the fair value at the grant date, the Company’s net earnings and basic anddiluted EPS would have been $2,658 million, $1.56 and $1.55, respectively, for the year endedDecember 31, 2004; $3,464 million, $2.01 and $2.00, respectively, for the year ended December 31,2003; and $3,316 million, $1.91 and $1.91, respectively, for the year ended December 31, 2002. Theforegoing impact of compensation cost was determined using a modified Black-Scholes methodologyand the following assumptions:
WeightedRisk-Free Average Expected Expected Fair Value
Interest Rate Expected Life Volatility Dividend Yield at Grant Date
2004 Altria Group, Inc. . . . . . . . . . 2.99% 4 years 36.63% 5.39% $10.302003 Altria Group, Inc. . . . . . . . . . 2.68 4 37.61 6.04 8.762002 Kraft . . . . . . . . . . . . . . . . . . 4.27 5 28.72 1.41 10.652002 Altria Group, Inc. . . . . . . . . . 3.44 5 33.57 4.96 10.02
The Company may grant shares of restricted stock and rights to receive shares of stock to eligibleemployees, giving them in most instances all of the rights of stockholders, except that they may not sell,assign, pledge or otherwise encumber such shares and rights. Such shares and rights are subject toforfeiture if certain employment conditions are not met. During 2004 and 2003, the Company grantedapproximately 4.1 million and 3.7 million restricted Class A shares, respectively, to eligible U.S.-basedemployees, and during 2004 and 2003, also issued to eligible non-U.S. employees rights to receiveapproximately 1.9 million and 1.6 million Class A equivalent shares, respectively. The market value perrestricted share or right was $32.23 and $36.56 on the dates of the 2004 and 2003 grants, respectively. AtDecember 31, 2004, restrictions on these shares and rights, net of forfeitures, lapse as follows:2005—13,719 shares; 2006—4,520,120 shares; 2007—5,532,500 shares; 2009—150,000 shares; and2012—100,000 shares.
The fair value of the shares of restricted stock and rights to receive shares of stock at the date ofgrant is amortized to expense ratably over the restriction period. The Company recorded compensationexpense related to the restricted stock and rights of $106 million and $57 million for the years endedDecember 31, 2004 and 2003, respectively. The unamortized portion, which is reported on the
66
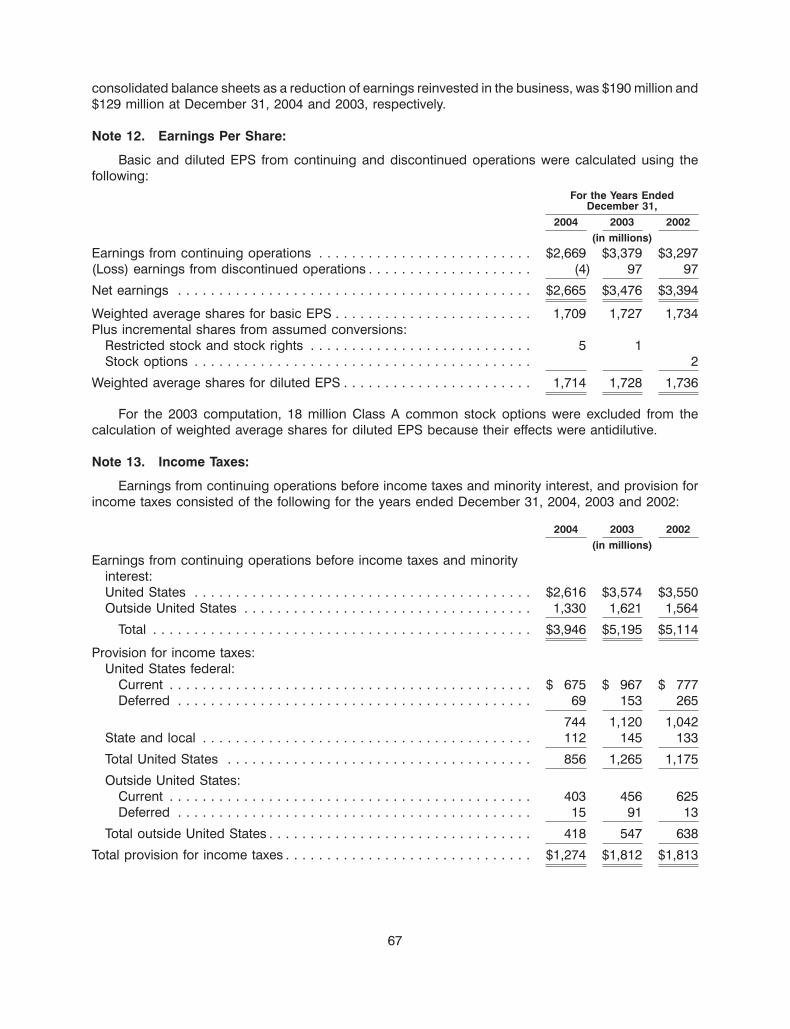
consolidated balance sheets as a reduction of earnings reinvested in the business, was $190 million and$129 million at December 31, 2004 and 2003, respectively.
Note 12. Earnings Per Share:
Basic and diluted EPS from continuing and discontinued operations were calculated using thefollowing:
For the Years EndedDecember 31,
2004 2003 2002(in millions)
Earnings from continuing operations . . . . . . . . . . . . . . . . . . . . . . . . . . $2,669 $3,379 $3,297(Loss) earnings from discontinued operations . . . . . . . . . . . . . . . . . . . . (4) 97 97
Net earnings . . . . . . . . . . . . . . . . . . . . . . . . . . . . . . . . . . . . . . . . . . . $2,665 $3,476 $3,394
Weighted average shares for basic EPS . . . . . . . . . . . . . . . . . . . . . . . . 1,709 1,727 1,734Plus incremental shares from assumed conversions:
Restricted stock and stock rights . . . . . . . . . . . . . . . . . . . . . . . . . . . 5 1Stock options . . . . . . . . . . . . . . . . . . . . . . . . . . . . . . . . . . . . . . . . . 2
Weighted average shares for diluted EPS . . . . . . . . . . . . . . . . . . . . . . . 1,714 1,728 1,736
For the 2003 computation, 18 million Class A common stock options were excluded from thecalculation of weighted average shares for diluted EPS because their effects were antidilutive.
Note 13. Income Taxes:
Earnings from continuing operations before income taxes and minority interest, and provision forincome taxes consisted of the following for the years ended December 31, 2004, 2003 and 2002:
2004 2003 2002(in millions)
Earnings from continuing operations before income taxes and minorityinterest:United States . . . . . . . . . . . . . . . . . . . . . . . . . . . . . . . . . . . . . . . . . $2,616 $3,574 $3,550Outside United States . . . . . . . . . . . . . . . . . . . . . . . . . . . . . . . . . . . 1,330 1,621 1,564
Total . . . . . . . . . . . . . . . . . . . . . . . . . . . . . . . . . . . . . . . . . . . . . . $3,946 $5,195 $5,114
Provision for income taxes:United States federal:
Current . . . . . . . . . . . . . . . . . . . . . . . . . . . . . . . . . . . . . . . . . . . . $ 675 $ 967 $ 777Deferred . . . . . . . . . . . . . . . . . . . . . . . . . . . . . . . . . . . . . . . . . . . 69 153 265
744 1,120 1,042State and local . . . . . . . . . . . . . . . . . . . . . . . . . . . . . . . . . . . . . . . . 112 145 133
Total United States . . . . . . . . . . . . . . . . . . . . . . . . . . . . . . . . . . . . . 856 1,265 1,175
Outside United States:Current . . . . . . . . . . . . . . . . . . . . . . . . . . . . . . . . . . . . . . . . . . . . 403 456 625Deferred . . . . . . . . . . . . . . . . . . . . . . . . . . . . . . . . . . . . . . . . . . . 15 91 13
Total outside United States . . . . . . . . . . . . . . . . . . . . . . . . . . . . . . . . 418 547 638
Total provision for income taxes . . . . . . . . . . . . . . . . . . . . . . . . . . . . . . $1,274 $1,812 $1,813
67
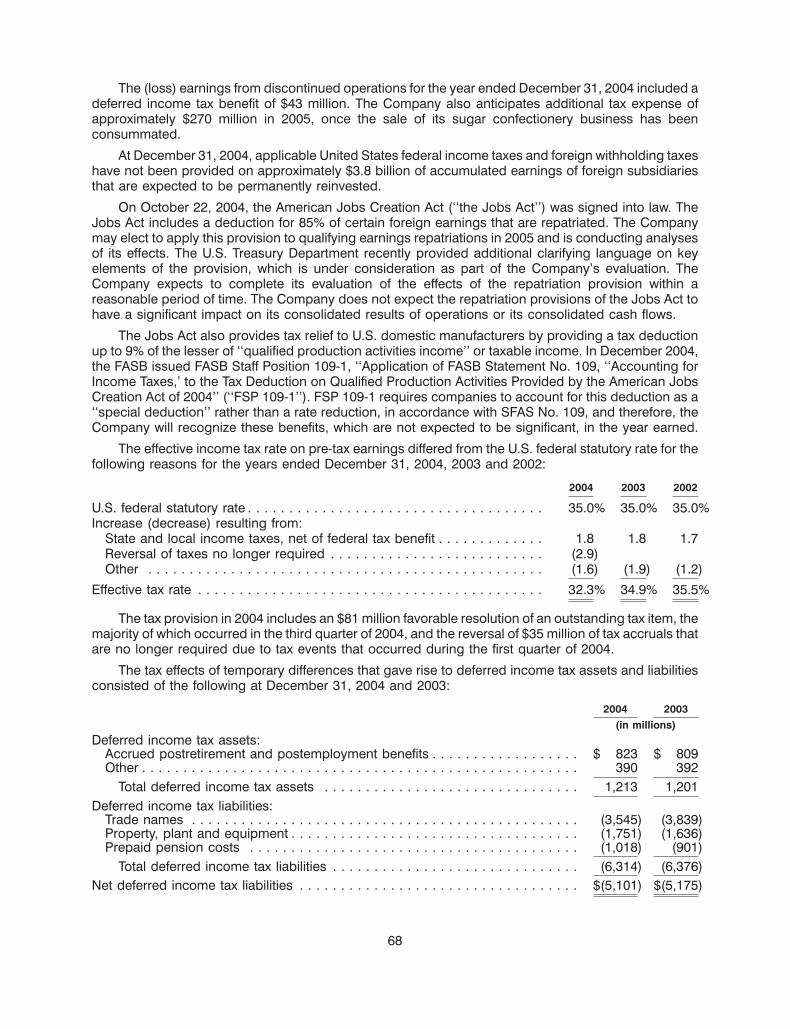
The (loss) earnings from discontinued operations for the year ended December 31, 2004 included adeferred income tax benefit of $43 million. The Company also anticipates additional tax expense ofapproximately $270 million in 2005, once the sale of its sugar confectionery business has beenconsummated.
At December 31, 2004, applicable United States federal income taxes and foreign withholding taxeshave not been provided on approximately $3.8 billion of accumulated earnings of foreign subsidiariesthat are expected to be permanently reinvested.
On October 22, 2004, the American Jobs Creation Act (‘‘the Jobs Act’’) was signed into law. TheJobs Act includes a deduction for 85% of certain foreign earnings that are repatriated. The Companymay elect to apply this provision to qualifying earnings repatriations in 2005 and is conducting analysesof its effects. The U.S. Treasury Department recently provided additional clarifying language on keyelements of the provision, which is under consideration as part of the Company’s evaluation. TheCompany expects to complete its evaluation of the effects of the repatriation provision within areasonable period of time. The Company does not expect the repatriation provisions of the Jobs Act tohave a significant impact on its consolidated results of operations or its consolidated cash flows.
The Jobs Act also provides tax relief to U.S. domestic manufacturers by providing a tax deductionup to 9% of the lesser of ‘‘qualified production activities income’’ or taxable income. In December 2004,the FASB issued FASB Staff Position 109-1, ‘‘Application of FASB Statement No. 109, ‘‘Accounting forIncome Taxes,’ to the Tax Deduction on Qualified Production Activities Provided by the American JobsCreation Act of 2004’’ (‘‘FSP 109-1’’). FSP 109-1 requires companies to account for this deduction as a‘‘special deduction’’ rather than a rate reduction, in accordance with SFAS No. 109, and therefore, theCompany will recognize these benefits, which are not expected to be significant, in the year earned.
The effective income tax rate on pre-tax earnings differed from the U.S. federal statutory rate for thefollowing reasons for the years ended December 31, 2004, 2003 and 2002:
2004 2003 2002
U.S. federal statutory rate . . . . . . . . . . . . . . . . . . . . . . . . . . . . . . . . . . . . 35.0% 35.0% 35.0%Increase (decrease) resulting from:
State and local income taxes, net of federal tax benefit . . . . . . . . . . . . . 1.8 1.8 1.7Reversal of taxes no longer required . . . . . . . . . . . . . . . . . . . . . . . . . . (2.9)Other . . . . . . . . . . . . . . . . . . . . . . . . . . . . . . . . . . . . . . . . . . . . . . . . (1.6) (1.9) (1.2)
Effective tax rate . . . . . . . . . . . . . . . . . . . . . . . . . . . . . . . . . . . . . . . . . . 32.3% 34.9% 35.5%
The tax provision in 2004 includes an $81 million favorable resolution of an outstanding tax item, themajority of which occurred in the third quarter of 2004, and the reversal of $35 million of tax accruals thatare no longer required due to tax events that occurred during the first quarter of 2004.
The tax effects of temporary differences that gave rise to deferred income tax assets and liabilitiesconsisted of the following at December 31, 2004 and 2003:
2004 2003(in millions)
Deferred income tax assets:Accrued postretirement and postemployment benefits . . . . . . . . . . . . . . . . . . $ 823 $ 809Other . . . . . . . . . . . . . . . . . . . . . . . . . . . . . . . . . . . . . . . . . . . . . . . . . . . . . 390 392
Total deferred income tax assets . . . . . . . . . . . . . . . . . . . . . . . . . . . . . . . 1,213 1,201Deferred income tax liabilities:
Trade names . . . . . . . . . . . . . . . . . . . . . . . . . . . . . . . . . . . . . . . . . . . . . . . (3,545) (3,839)Property, plant and equipment . . . . . . . . . . . . . . . . . . . . . . . . . . . . . . . . . . . (1,751) (1,636)Prepaid pension costs . . . . . . . . . . . . . . . . . . . . . . . . . . . . . . . . . . . . . . . . (1,018) (901)
Total deferred income tax liabilities . . . . . . . . . . . . . . . . . . . . . . . . . . . . . . (6,314) (6,376)Net deferred income tax liabilities . . . . . . . . . . . . . . . . . . . . . . . . . . . . . . . . . . $(5,101) $(5,175)
68
Note 14. Segment Reporting:
The Company manufactures and markets packaged food products, consisting principally ofbeverages, cheese, snacks, convenient meals and various packaged grocery products. Kraft managesand reports operating results through two units, Kraft North America Commercial and Kraft InternationalCommercial. Reportable segments for Kraft North America Commercial are organized and managedprincipally by product category. Kraft International Commercial’s operations are organized andmanaged by geographic location.
During January 2004, the Company announced a new global organizational structure, whichresulted in new segments. During the fourth quarter of 2004, following the sale of its sugar confectionerybusiness, as discussed in Note 5. Divestitures, the Company realigned its North American segments.Kraft North America Commercial’s new segments are U.S. Beverages; U.S. Cheese, Canada & NorthAmerica Foodservice; U.S. Convenient Meals; U.S. Grocery; and U.S. Snacks & Cereals. KraftInternational Commercial’s segments are Europe, Middle East & Africa; and Latin America & Asia Pacific.The new segment structure in North America reflects a shift of certain divisions and brands betweensegments to more closely align these businesses to consumer sectors, to provide more focus on theseparate beverage and grocery businesses, and to benefit from synergies in grain based products.Historical data have been restated to reflect the new segment structure.
The Company’s management uses operating companies income, which is defined as operatingincome before general corporate expenses and amortization of intangibles, to evaluate segmentperformance and allocate resources. Management believes it is appropriate to disclose this measure tohelp investors analyze the business performance and trends of the various business segments. Interestand other debt expense, net, and provision for income taxes are centrally managed and, accordingly,such items are not presented by segment since they are not included in the measure of segmentprofitability reviewed by management. The Company’s assets, which are principally in the United Statesand Europe, are managed geographically. The accounting policies of the segments are the same asthose described in Note 2. Summary of Significant Accounting Policies.
69
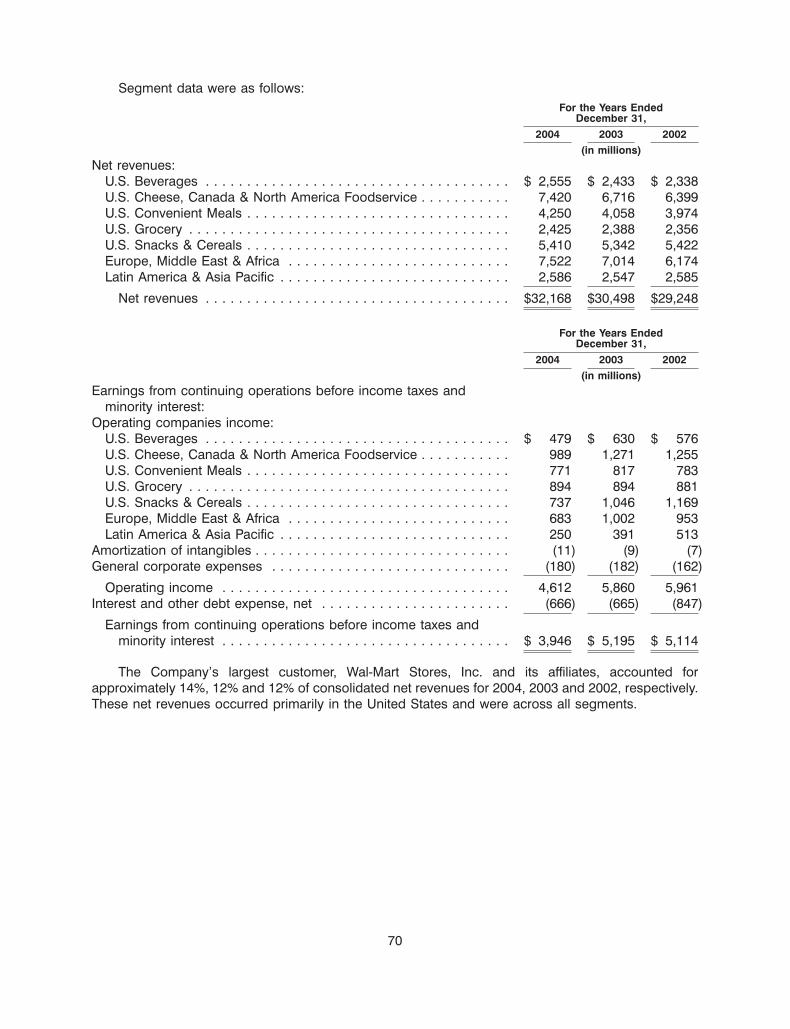
Segment data were as follows:For the Years Ended
December 31,2004 2003 2002
(in millions)Net revenues:
U.S. Beverages . . . . . . . . . . . . . . . . . . . . . . . . . . . . . . . . . . . . . $ 2,555 $ 2,433 $ 2,338U.S. Cheese, Canada & North America Foodservice . . . . . . . . . . . 7,420 6,716 6,399U.S. Convenient Meals . . . . . . . . . . . . . . . . . . . . . . . . . . . . . . . . 4,250 4,058 3,974U.S. Grocery . . . . . . . . . . . . . . . . . . . . . . . . . . . . . . . . . . . . . . . 2,425 2,388 2,356U.S. Snacks & Cereals . . . . . . . . . . . . . . . . . . . . . . . . . . . . . . . . 5,410 5,342 5,422Europe, Middle East & Africa . . . . . . . . . . . . . . . . . . . . . . . . . . . 7,522 7,014 6,174Latin America & Asia Pacific . . . . . . . . . . . . . . . . . . . . . . . . . . . . 2,586 2,547 2,585
Net revenues . . . . . . . . . . . . . . . . . . . . . . . . . . . . . . . . . . . . . $32,168 $30,498 $29,248
For the Years EndedDecember 31,
2004 2003 2002(in millions)
Earnings from continuing operations before income taxes andminority interest:
Operating companies income:U.S. Beverages . . . . . . . . . . . . . . . . . . . . . . . . . . . . . . . . . . . . . $ 479 $ 630 $ 576U.S. Cheese, Canada & North America Foodservice . . . . . . . . . . . 989 1,271 1,255U.S. Convenient Meals . . . . . . . . . . . . . . . . . . . . . . . . . . . . . . . . 771 817 783U.S. Grocery . . . . . . . . . . . . . . . . . . . . . . . . . . . . . . . . . . . . . . . 894 894 881U.S. Snacks & Cereals . . . . . . . . . . . . . . . . . . . . . . . . . . . . . . . . 737 1,046 1,169Europe, Middle East & Africa . . . . . . . . . . . . . . . . . . . . . . . . . . . 683 1,002 953Latin America & Asia Pacific . . . . . . . . . . . . . . . . . . . . . . . . . . . . 250 391 513
Amortization of intangibles . . . . . . . . . . . . . . . . . . . . . . . . . . . . . . . (11) (9) (7)General corporate expenses . . . . . . . . . . . . . . . . . . . . . . . . . . . . . (180) (182) (162)
Operating income . . . . . . . . . . . . . . . . . . . . . . . . . . . . . . . . . . . 4,612 5,860 5,961Interest and other debt expense, net . . . . . . . . . . . . . . . . . . . . . . . (666) (665) (847)
Earnings from continuing operations before income taxes andminority interest . . . . . . . . . . . . . . . . . . . . . . . . . . . . . . . . . . . $ 3,946 $ 5,195 $ 5,114
The Company’s largest customer, Wal-Mart Stores, Inc. and its affiliates, accounted forapproximately 14%, 12% and 12% of consolidated net revenues for 2004, 2003 and 2002, respectively.These net revenues occurred primarily in the United States and were across all segments.
70
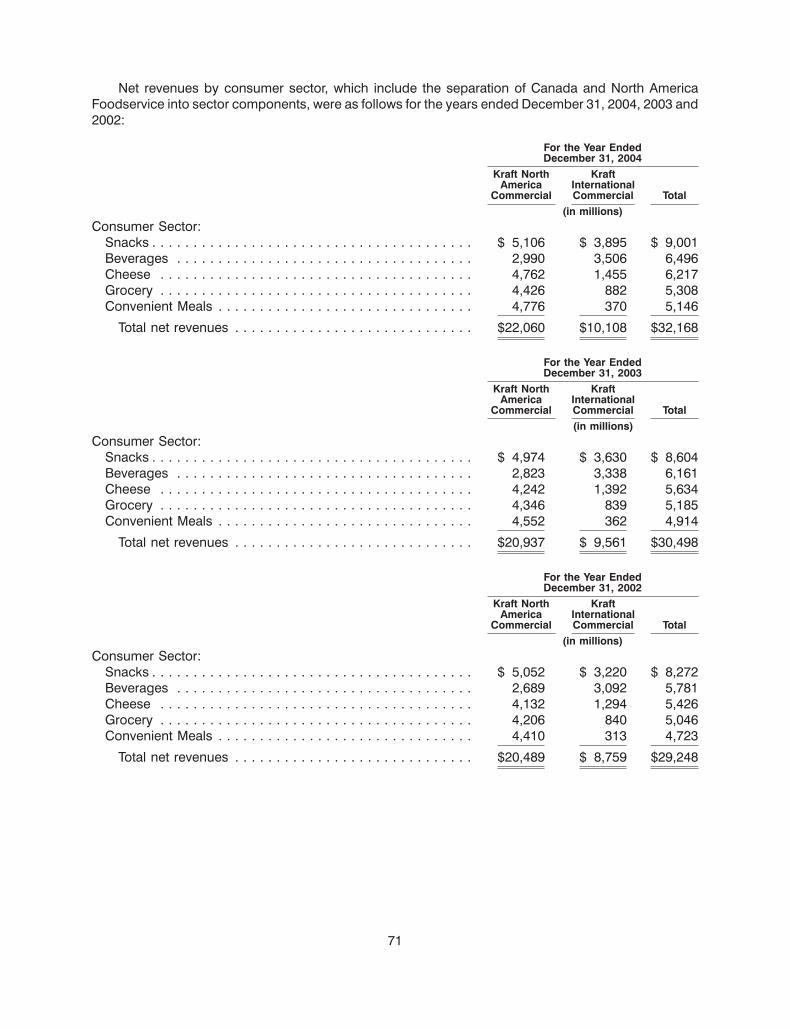
Net revenues by consumer sector, which include the separation of Canada and North AmericaFoodservice into sector components, were as follows for the years ended December 31, 2004, 2003 and2002:
For the Year EndedDecember 31, 2004
Kraft North KraftAmerica International
Commercial Commercial Total(in millions)
Consumer Sector:Snacks . . . . . . . . . . . . . . . . . . . . . . . . . . . . . . . . . . . . . . . $ 5,106 $ 3,895 $ 9,001Beverages . . . . . . . . . . . . . . . . . . . . . . . . . . . . . . . . . . . . 2,990 3,506 6,496Cheese . . . . . . . . . . . . . . . . . . . . . . . . . . . . . . . . . . . . . . 4,762 1,455 6,217Grocery . . . . . . . . . . . . . . . . . . . . . . . . . . . . . . . . . . . . . . 4,426 882 5,308Convenient Meals . . . . . . . . . . . . . . . . . . . . . . . . . . . . . . . 4,776 370 5,146
Total net revenues . . . . . . . . . . . . . . . . . . . . . . . . . . . . . $22,060 $10,108 $32,168
For the Year EndedDecember 31, 2003
Kraft North KraftAmerica International
Commercial Commercial Total(in millions)
Consumer Sector:Snacks . . . . . . . . . . . . . . . . . . . . . . . . . . . . . . . . . . . . . . . $ 4,974 $ 3,630 $ 8,604Beverages . . . . . . . . . . . . . . . . . . . . . . . . . . . . . . . . . . . . 2,823 3,338 6,161Cheese . . . . . . . . . . . . . . . . . . . . . . . . . . . . . . . . . . . . . . 4,242 1,392 5,634Grocery . . . . . . . . . . . . . . . . . . . . . . . . . . . . . . . . . . . . . . 4,346 839 5,185Convenient Meals . . . . . . . . . . . . . . . . . . . . . . . . . . . . . . . 4,552 362 4,914
Total net revenues . . . . . . . . . . . . . . . . . . . . . . . . . . . . . $20,937 $ 9,561 $30,498
For the Year EndedDecember 31, 2002
Kraft North KraftAmerica International
Commercial Commercial Total(in millions)
Consumer Sector:Snacks . . . . . . . . . . . . . . . . . . . . . . . . . . . . . . . . . . . . . . . $ 5,052 $ 3,220 $ 8,272Beverages . . . . . . . . . . . . . . . . . . . . . . . . . . . . . . . . . . . . 2,689 3,092 5,781Cheese . . . . . . . . . . . . . . . . . . . . . . . . . . . . . . . . . . . . . . 4,132 1,294 5,426Grocery . . . . . . . . . . . . . . . . . . . . . . . . . . . . . . . . . . . . . . 4,206 840 5,046Convenient Meals . . . . . . . . . . . . . . . . . . . . . . . . . . . . . . . 4,410 313 4,723
Total net revenues . . . . . . . . . . . . . . . . . . . . . . . . . . . . . $20,489 $ 8,759 $29,248
71
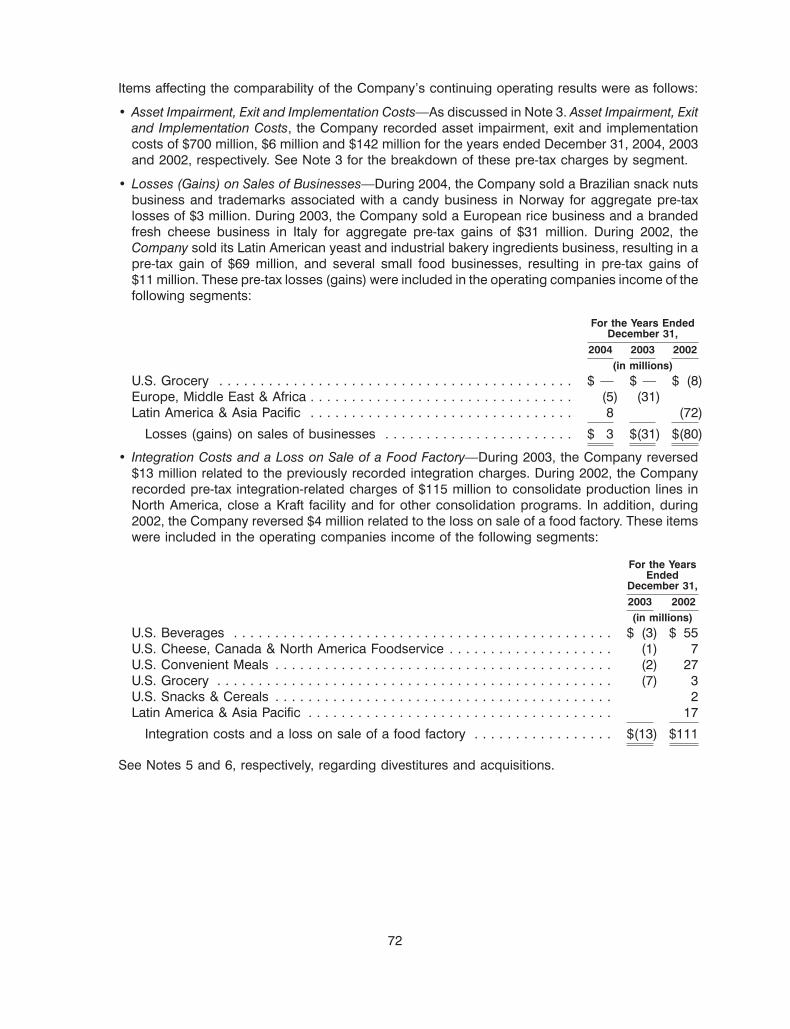
Items affecting the comparability of the Company’s continuing operating results were as follows:
• Asset Impairment, Exit and Implementation Costs—As discussed in Note 3. Asset Impairment, Exitand Implementation Costs, the Company recorded asset impairment, exit and implementationcosts of $700 million, $6 million and $142 million for the years ended December 31, 2004, 2003and 2002, respectively. See Note 3 for the breakdown of these pre-tax charges by segment.
• Losses (Gains) on Sales of Businesses—During 2004, the Company sold a Brazilian snack nutsbusiness and trademarks associated with a candy business in Norway for aggregate pre-taxlosses of $3 million. During 2003, the Company sold a European rice business and a brandedfresh cheese business in Italy for aggregate pre-tax gains of $31 million. During 2002, theCompany sold its Latin American yeast and industrial bakery ingredients business, resulting in apre-tax gain of $69 million, and several small food businesses, resulting in pre-tax gains of$11 million. These pre-tax losses (gains) were included in the operating companies income of thefollowing segments:
For the Years EndedDecember 31,
2004 2003 2002(in millions)
U.S. Grocery . . . . . . . . . . . . . . . . . . . . . . . . . . . . . . . . . . . . . . . . . . . $ — $ — $ (8)Europe, Middle East & Africa . . . . . . . . . . . . . . . . . . . . . . . . . . . . . . . . (5) (31)Latin America & Asia Pacific . . . . . . . . . . . . . . . . . . . . . . . . . . . . . . . . 8 (72)
Losses (gains) on sales of businesses . . . . . . . . . . . . . . . . . . . . . . . $ 3 $(31) $(80)
• Integration Costs and a Loss on Sale of a Food Factory—During 2003, the Company reversed$13 million related to the previously recorded integration charges. During 2002, the Companyrecorded pre-tax integration-related charges of $115 million to consolidate production lines inNorth America, close a Kraft facility and for other consolidation programs. In addition, during2002, the Company reversed $4 million related to the loss on sale of a food factory. These itemswere included in the operating companies income of the following segments:
For the YearsEnded
December 31,2003 2002(in millions)
U.S. Beverages . . . . . . . . . . . . . . . . . . . . . . . . . . . . . . . . . . . . . . . . . . . . . . $ (3) $ 55U.S. Cheese, Canada & North America Foodservice . . . . . . . . . . . . . . . . . . . . (1) 7U.S. Convenient Meals . . . . . . . . . . . . . . . . . . . . . . . . . . . . . . . . . . . . . . . . . (2) 27U.S. Grocery . . . . . . . . . . . . . . . . . . . . . . . . . . . . . . . . . . . . . . . . . . . . . . . . (7) 3U.S. Snacks & Cereals . . . . . . . . . . . . . . . . . . . . . . . . . . . . . . . . . . . . . . . . . 2Latin America & Asia Pacific . . . . . . . . . . . . . . . . . . . . . . . . . . . . . . . . . . . . . 17
Integration costs and a loss on sale of a food factory . . . . . . . . . . . . . . . . . $(13) $111
See Notes 5 and 6, respectively, regarding divestitures and acquisitions.
72
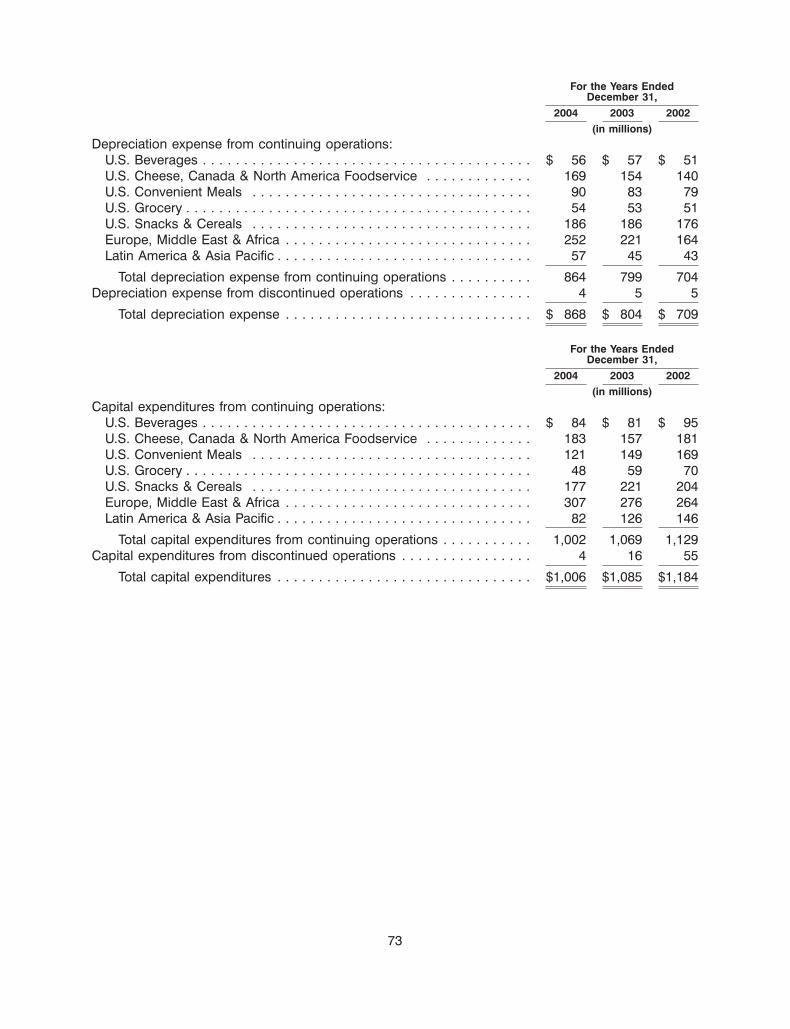
For the Years EndedDecember 31,
2004 2003 2002(in millions)
Depreciation expense from continuing operations:U.S. Beverages . . . . . . . . . . . . . . . . . . . . . . . . . . . . . . . . . . . . . . . . $ 56 $ 57 $ 51U.S. Cheese, Canada & North America Foodservice . . . . . . . . . . . . . 169 154 140U.S. Convenient Meals . . . . . . . . . . . . . . . . . . . . . . . . . . . . . . . . . . 90 83 79U.S. Grocery . . . . . . . . . . . . . . . . . . . . . . . . . . . . . . . . . . . . . . . . . . 54 53 51U.S. Snacks & Cereals . . . . . . . . . . . . . . . . . . . . . . . . . . . . . . . . . . 186 186 176Europe, Middle East & Africa . . . . . . . . . . . . . . . . . . . . . . . . . . . . . . 252 221 164Latin America & Asia Pacific . . . . . . . . . . . . . . . . . . . . . . . . . . . . . . . 57 45 43
Total depreciation expense from continuing operations . . . . . . . . . . 864 799 704Depreciation expense from discontinued operations . . . . . . . . . . . . . . . 4 5 5
Total depreciation expense . . . . . . . . . . . . . . . . . . . . . . . . . . . . . . $ 868 $ 804 $ 709
For the Years EndedDecember 31,
2004 2003 2002(in millions)
Capital expenditures from continuing operations:U.S. Beverages . . . . . . . . . . . . . . . . . . . . . . . . . . . . . . . . . . . . . . . . $ 84 $ 81 $ 95U.S. Cheese, Canada & North America Foodservice . . . . . . . . . . . . . 183 157 181U.S. Convenient Meals . . . . . . . . . . . . . . . . . . . . . . . . . . . . . . . . . . 121 149 169U.S. Grocery . . . . . . . . . . . . . . . . . . . . . . . . . . . . . . . . . . . . . . . . . . 48 59 70U.S. Snacks & Cereals . . . . . . . . . . . . . . . . . . . . . . . . . . . . . . . . . . 177 221 204Europe, Middle East & Africa . . . . . . . . . . . . . . . . . . . . . . . . . . . . . . 307 276 264Latin America & Asia Pacific . . . . . . . . . . . . . . . . . . . . . . . . . . . . . . . 82 126 146
Total capital expenditures from continuing operations . . . . . . . . . . . 1,002 1,069 1,129Capital expenditures from discontinued operations . . . . . . . . . . . . . . . . 4 16 55
Total capital expenditures . . . . . . . . . . . . . . . . . . . . . . . . . . . . . . . $1,006 $1,085 $1,184
73
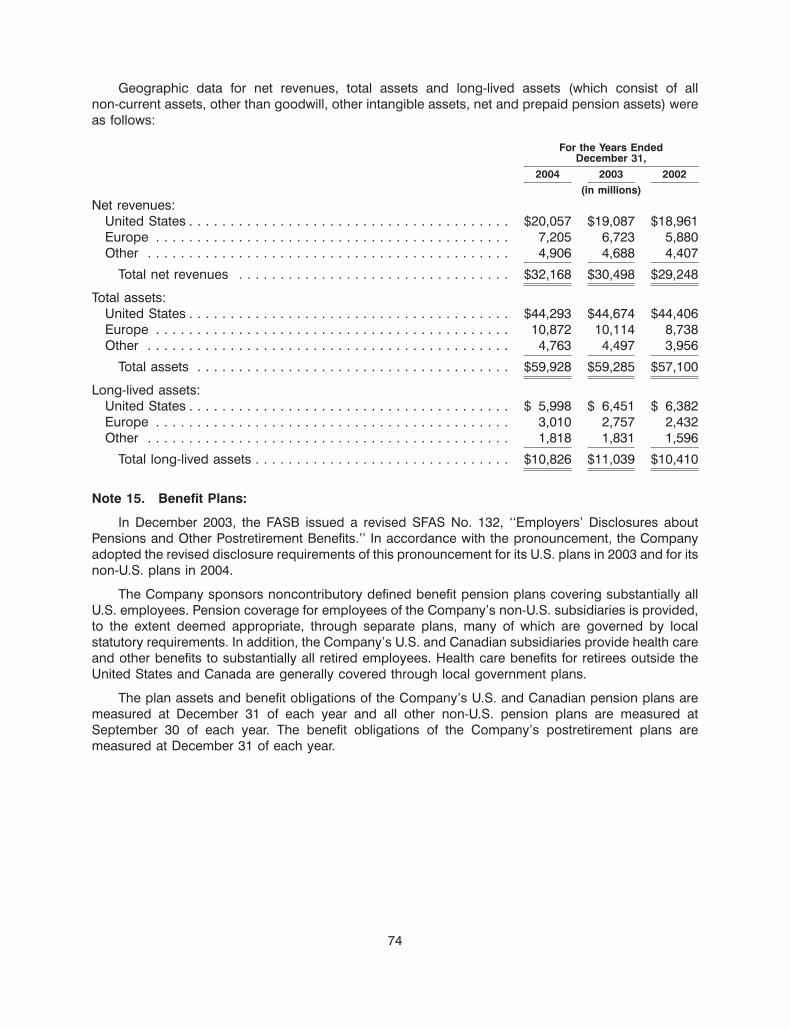
Geographic data for net revenues, total assets and long-lived assets (which consist of allnon-current assets, other than goodwill, other intangible assets, net and prepaid pension assets) wereas follows:
For the Years EndedDecember 31,
2004 2003 2002(in millions)
Net revenues:United States . . . . . . . . . . . . . . . . . . . . . . . . . . . . . . . . . . . . . . . $20,057 $19,087 $18,961Europe . . . . . . . . . . . . . . . . . . . . . . . . . . . . . . . . . . . . . . . . . . . 7,205 6,723 5,880Other . . . . . . . . . . . . . . . . . . . . . . . . . . . . . . . . . . . . . . . . . . . . 4,906 4,688 4,407
Total net revenues . . . . . . . . . . . . . . . . . . . . . . . . . . . . . . . . . $32,168 $30,498 $29,248
Total assets:United States . . . . . . . . . . . . . . . . . . . . . . . . . . . . . . . . . . . . . . . $44,293 $44,674 $44,406Europe . . . . . . . . . . . . . . . . . . . . . . . . . . . . . . . . . . . . . . . . . . . 10,872 10,114 8,738Other . . . . . . . . . . . . . . . . . . . . . . . . . . . . . . . . . . . . . . . . . . . . 4,763 4,497 3,956
Total assets . . . . . . . . . . . . . . . . . . . . . . . . . . . . . . . . . . . . . . $59,928 $59,285 $57,100
Long-lived assets:United States . . . . . . . . . . . . . . . . . . . . . . . . . . . . . . . . . . . . . . . $ 5,998 $ 6,451 $ 6,382Europe . . . . . . . . . . . . . . . . . . . . . . . . . . . . . . . . . . . . . . . . . . . 3,010 2,757 2,432Other . . . . . . . . . . . . . . . . . . . . . . . . . . . . . . . . . . . . . . . . . . . . 1,818 1,831 1,596
Total long-lived assets . . . . . . . . . . . . . . . . . . . . . . . . . . . . . . . $10,826 $11,039 $10,410
Note 15. Benefit Plans:
In December 2003, the FASB issued a revised SFAS No. 132, ‘‘Employers’ Disclosures aboutPensions and Other Postretirement Benefits.’’ In accordance with the pronouncement, the Companyadopted the revised disclosure requirements of this pronouncement for its U.S. plans in 2003 and for itsnon-U.S. plans in 2004.
The Company sponsors noncontributory defined benefit pension plans covering substantially allU.S. employees. Pension coverage for employees of the Company’s non-U.S. subsidiaries is provided,to the extent deemed appropriate, through separate plans, many of which are governed by localstatutory requirements. In addition, the Company’s U.S. and Canadian subsidiaries provide health careand other benefits to substantially all retired employees. Health care benefits for retirees outside theUnited States and Canada are generally covered through local government plans.
The plan assets and benefit obligations of the Company’s U.S. and Canadian pension plans aremeasured at December 31 of each year and all other non-U.S. pension plans are measured atSeptember 30 of each year. The benefit obligations of the Company’s postretirement plans aremeasured at December 31 of each year.
74
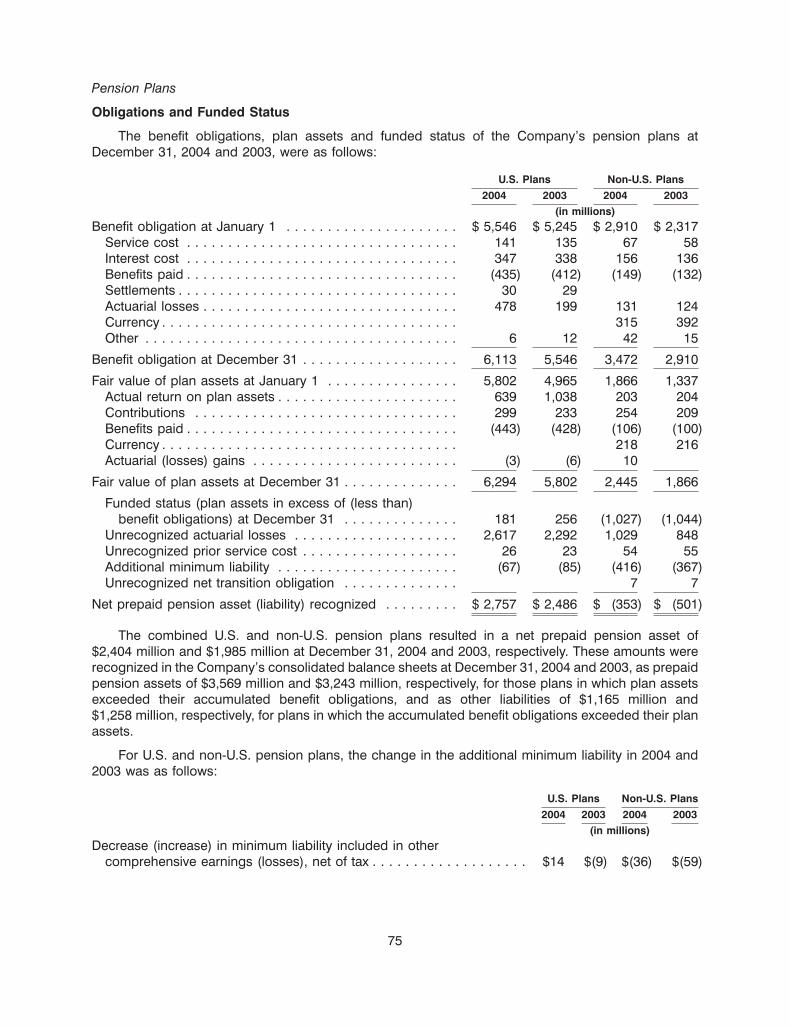
Pension Plans
Obligations and Funded Status
The benefit obligations, plan assets and funded status of the Company’s pension plans atDecember 31, 2004 and 2003, were as follows:
U.S. Plans Non-U.S. Plans2004 2003 2004 2003
(in millions)Benefit obligation at January 1 . . . . . . . . . . . . . . . . . . . . . $ 5,546 $ 5,245 $ 2,910 $ 2,317
Service cost . . . . . . . . . . . . . . . . . . . . . . . . . . . . . . . . . 141 135 67 58Interest cost . . . . . . . . . . . . . . . . . . . . . . . . . . . . . . . . . 347 338 156 136Benefits paid . . . . . . . . . . . . . . . . . . . . . . . . . . . . . . . . . (435) (412) (149) (132)Settlements . . . . . . . . . . . . . . . . . . . . . . . . . . . . . . . . . . 30 29Actuarial losses . . . . . . . . . . . . . . . . . . . . . . . . . . . . . . . 478 199 131 124Currency . . . . . . . . . . . . . . . . . . . . . . . . . . . . . . . . . . . . 315 392Other . . . . . . . . . . . . . . . . . . . . . . . . . . . . . . . . . . . . . . 6 12 42 15
Benefit obligation at December 31 . . . . . . . . . . . . . . . . . . . 6,113 5,546 3,472 2,910
Fair value of plan assets at January 1 . . . . . . . . . . . . . . . . 5,802 4,965 1,866 1,337Actual return on plan assets . . . . . . . . . . . . . . . . . . . . . . 639 1,038 203 204Contributions . . . . . . . . . . . . . . . . . . . . . . . . . . . . . . . . 299 233 254 209Benefits paid . . . . . . . . . . . . . . . . . . . . . . . . . . . . . . . . . (443) (428) (106) (100)Currency . . . . . . . . . . . . . . . . . . . . . . . . . . . . . . . . . . . . 218 216Actuarial (losses) gains . . . . . . . . . . . . . . . . . . . . . . . . . (3) (6) 10
Fair value of plan assets at December 31 . . . . . . . . . . . . . . 6,294 5,802 2,445 1,866
Funded status (plan assets in excess of (less than)benefit obligations) at December 31 . . . . . . . . . . . . . . 181 256 (1,027) (1,044)
Unrecognized actuarial losses . . . . . . . . . . . . . . . . . . . . 2,617 2,292 1,029 848Unrecognized prior service cost . . . . . . . . . . . . . . . . . . . 26 23 54 55Additional minimum liability . . . . . . . . . . . . . . . . . . . . . . (67) (85) (416) (367)Unrecognized net transition obligation . . . . . . . . . . . . . . 7 7
Net prepaid pension asset (liability) recognized . . . . . . . . . $ 2,757 $ 2,486 $ (353) $ (501)
The combined U.S. and non-U.S. pension plans resulted in a net prepaid pension asset of$2,404 million and $1,985 million at December 31, 2004 and 2003, respectively. These amounts wererecognized in the Company’s consolidated balance sheets at December 31, 2004 and 2003, as prepaidpension assets of $3,569 million and $3,243 million, respectively, for those plans in which plan assetsexceeded their accumulated benefit obligations, and as other liabilities of $1,165 million and$1,258 million, respectively, for plans in which the accumulated benefit obligations exceeded their planassets.
For U.S. and non-U.S. pension plans, the change in the additional minimum liability in 2004 and2003 was as follows:
U.S. Plans Non-U.S. Plans2004 2003 2004 2003
(in millions)Decrease (increase) in minimum liability included in other
comprehensive earnings (losses), net of tax . . . . . . . . . . . . . . . . . . . $14 $(9) $(36) $(59)
75
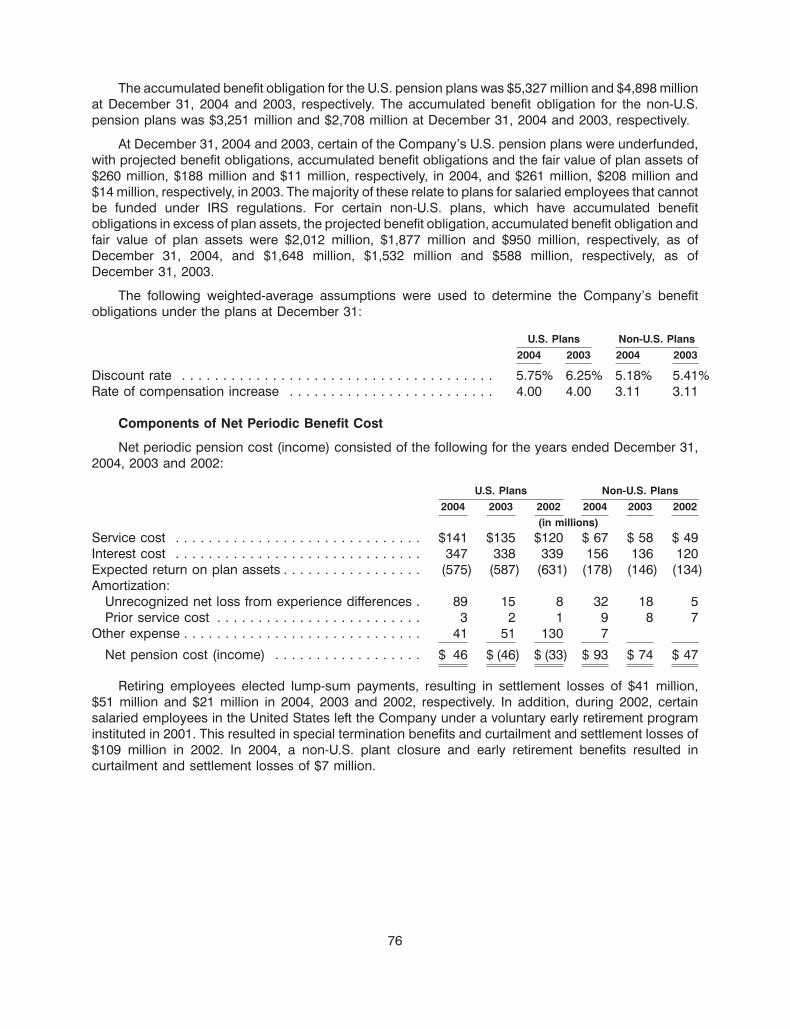
The accumulated benefit obligation for the U.S. pension plans was $5,327 million and $4,898 millionat December 31, 2004 and 2003, respectively. The accumulated benefit obligation for the non-U.S.pension plans was $3,251 million and $2,708 million at December 31, 2004 and 2003, respectively.
At December 31, 2004 and 2003, certain of the Company’s U.S. pension plans were underfunded,with projected benefit obligations, accumulated benefit obligations and the fair value of plan assets of$260 million, $188 million and $11 million, respectively, in 2004, and $261 million, $208 million and$14 million, respectively, in 2003. The majority of these relate to plans for salaried employees that cannotbe funded under IRS regulations. For certain non-U.S. plans, which have accumulated benefitobligations in excess of plan assets, the projected benefit obligation, accumulated benefit obligation andfair value of plan assets were $2,012 million, $1,877 million and $950 million, respectively, as ofDecember 31, 2004, and $1,648 million, $1,532 million and $588 million, respectively, as ofDecember 31, 2003.
The following weighted-average assumptions were used to determine the Company’s benefitobligations under the plans at December 31:
U.S. Plans Non-U.S. Plans2004 2003 2004 2003
Discount rate . . . . . . . . . . . . . . . . . . . . . . . . . . . . . . . . . . . . . . 5.75% 6.25% 5.18% 5.41%Rate of compensation increase . . . . . . . . . . . . . . . . . . . . . . . . . 4.00 4.00 3.11 3.11
Components of Net Periodic Benefit Cost
Net periodic pension cost (income) consisted of the following for the years ended December 31,2004, 2003 and 2002:
U.S. Plans Non-U.S. Plans2004 2003 2002 2004 2003 2002
(in millions)Service cost . . . . . . . . . . . . . . . . . . . . . . . . . . . . . . $141 $135 $120 $ 67 $ 58 $ 49Interest cost . . . . . . . . . . . . . . . . . . . . . . . . . . . . . . 347 338 339 156 136 120Expected return on plan assets . . . . . . . . . . . . . . . . . (575) (587) (631) (178) (146) (134)Amortization:
Unrecognized net loss from experience differences . 89 15 8 32 18 5Prior service cost . . . . . . . . . . . . . . . . . . . . . . . . . 3 2 1 9 8 7
Other expense . . . . . . . . . . . . . . . . . . . . . . . . . . . . . 41 51 130 7
Net pension cost (income) . . . . . . . . . . . . . . . . . . $ 46 $ (46) $ (33) $ 93 $ 74 $ 47
Retiring employees elected lump-sum payments, resulting in settlement losses of $41 million,$51 million and $21 million in 2004, 2003 and 2002, respectively. In addition, during 2002, certainsalaried employees in the United States left the Company under a voluntary early retirement programinstituted in 2001. This resulted in special termination benefits and curtailment and settlement losses of$109 million in 2002. In 2004, a non-U.S. plant closure and early retirement benefits resulted incurtailment and settlement losses of $7 million.
76
The following weighted-average assumptions were used to determine the Company’s net pensioncost for the years ended December 31:
U.S. Plans Non-U.S. Plans2004 2003 2002 2004 2003 2002
Discount rate . . . . . . . . . . . . . . . . . . . . . . . . . . . . . . . 6.25% 6.50% 7.00% 5.41% 5.56% 5.80%Expected rate of return on plan assets . . . . . . . . . . . . . 9.00 9.00 9.00 8.31 8.41 8.49Rate of compensation increase . . . . . . . . . . . . . . . . . . 4.00 4.00 4.50 3.11 3.12 3.36
The Company’s expected rate of return on plan assets is determined by the plan assets’ historicallong-term investment performance, current asset allocation and estimates of future long-term returns byasset class. The Company has reduced this assumption to 8% in determining its U.S. plans pensionexpense for 2005. In 2005, the discount rate used to determine the Company’s net pension cost for itsU.S. plans will be 5.75% and the rate of compensation increase for its U.S. plans will be 4.00%.
Kraft and certain of its subsidiaries sponsor employee savings plans, to which the Companycontributes. These plans cover certain salaried, non-union and union employees. The Company’scontributions and costs are determined by the matching of employee contributions, as defined by theplans. Amounts charged to expense for defined contribution plans totaled $92 million, $84 million and$64 million in 2004, 2003 and 2002, respectively.
Plan Assets
The percentage of fair value of pension plan assets at December 31, 2004 and 2003, was as follows:
U.S. Plans Non-U.S. PlansAsset Category 2004 2003 2004 2003
Equity securities . . . . . . . . . . . . . . . . . . . . . . . . . . . . . . . . . . . . . 73% 70% 60% 56%Debt securities . . . . . . . . . . . . . . . . . . . . . . . . . . . . . . . . . . . . . . 26 26 35 37Real estate . . . . . . . . . . . . . . . . . . . . . . . . . . . . . . . . . . . . . . . . . 1 3 4Other . . . . . . . . . . . . . . . . . . . . . . . . . . . . . . . . . . . . . . . . . . . . . 1 3 2 3
Total . . . . . . . . . . . . . . . . . . . . . . . . . . . . . . . . . . . . . . . . . . . . . 100% 100% 100% 100%
The Company’s investment strategy is based on an expectation that equity securities willoutperform debt securities over the long term. Accordingly, the composition of the Company’s U.S. planassets is broadly characterized as a 70%/30% allocation between equity and debt securities. Thestrategy utilizes indexed U.S. equity securities and actively managed investment grade debt securities(which constitute 80% or more of debt securities) with lesser allocations to high yield and internationaldebt securities.
For the plans outside the U.S., the investment strategy is subject to local regulations and the asset/liability profiles of the plans in each individual country. These specific circumstances result in a level ofequity exposure that is typically less than the U.S. plans. In aggregate, the actual asset allocations of thenon-U.S. plans are virtually identical to their respective asset policy targets.
The Company attempts to mitigate investment risk by rebalancing between equity and debt assetclasses as the Company’s contributions and monthly benefit payments are made.
The Company presently plans to make contributions, to the extent that they are tax deductible, inorder to maintain plan assets in excess of the accumulated benefit obligation of its funded U.S. andnon-U.S. plans. Currently, the Company anticipates making contributions of approximately $250 millionin 2005 to its U.S. plans and approximately $90 million in 2005 to its non-U.S. plans, based on current taxlaw. However, these estimates are subject to change as a result of changes in tax law, as well as asset
77
performance significantly above or below the assumed long-term rate of return on pension assets, orsignificant changes in interest rates.
The estimated future benefit payments from the Company’s pension plans at December 31, 2004,were as follows:
U.S. Plans Non-U.S. Plans(in millions)
2005 . . . . . . . . . . . . . . . . . . . . . . . . . . . . . . . . . . . . . . . . . . . . . . . $ 390 $1602006 . . . . . . . . . . . . . . . . . . . . . . . . . . . . . . . . . . . . . . . . . . . . . . . 385 1622007 . . . . . . . . . . . . . . . . . . . . . . . . . . . . . . . . . . . . . . . . . . . . . . . 380 1662008 . . . . . . . . . . . . . . . . . . . . . . . . . . . . . . . . . . . . . . . . . . . . . . . 377 1702009 . . . . . . . . . . . . . . . . . . . . . . . . . . . . . . . . . . . . . . . . . . . . . . . 387 1752010-2014 . . . . . . . . . . . . . . . . . . . . . . . . . . . . . . . . . . . . . . . . . . . 2,355 941
Postretirement Benefit Plans
Net postretirement health care costs consisted of the following for the years ended December 31,2004, 2003 and 2002:
2004 2003 2002(in millions)
Service cost . . . . . . . . . . . . . . . . . . . . . . . . . . . . . . . . . . . . . . . . . . . . . . . . $ 43 $ 41 $ 32Interest cost . . . . . . . . . . . . . . . . . . . . . . . . . . . . . . . . . . . . . . . . . . . . . . . . 173 173 168Amortization:
Unrecognized net loss from experience differences . . . . . . . . . . . . . . . . . . 46 40 21Unrecognized prior service cost . . . . . . . . . . . . . . . . . . . . . . . . . . . . . . . . (25) (25) (20)
Other expense . . . . . . . . . . . . . . . . . . . . . . . . . . . . . . . . . . . . . . . . . . . . . . 16
Net postretirement health care costs . . . . . . . . . . . . . . . . . . . . . . . . . . . . . $237 $229 $217
During 2002, certain salaried employees in the United States left the Company under a voluntaryearly retirement program instituted in 2001. This resulted in curtailment losses of $16 million in 2002,which are included in other expense above.
In December 2003, the United States enacted into law the Medicare Prescription Drug,Improvement and Modernization Act of 2003 (the ‘‘Act’’). The Act establishes a prescription drug benefitunder Medicare, known as ‘‘Medicare Part D,’’ and a federal subsidy to sponsors of retiree health carebenefit plans that provide a benefit that is at least actuarially equivalent to Medicare Part D.
In May 2004, the FASB issued FASB Staff Position No. 106-2, ‘‘Accounting and DisclosureRequirements Related to the Medicare Prescription Drug, Improvement and Modernization Act of 2003’’(‘‘FSP 106-2’’). FSP 106-2 requires companies to account for the effect of the subsidy on benefitsattributable to past service as an actuarial experience gain and as a reduction of the service costcomponent of net postretirement health care costs for amounts attributable to current service, if thebenefit provided is at least actuarially equivalent to Medicare Part D.
The Company adopted FSP 106-2 in the third quarter of 2004. The impact of adoption for 2004 wasa reduction of pre-tax net postretirement health care costs and an increase in net earnings of $24 million,which is included above as a reduction of $3 million in service cost, $10 million in interest cost and$11 million in amortization of unrecognized net loss from experience differences. In addition, as of July 1,2004, the Company reduced its accumulated postretirement benefit obligation for the subsidy related tobenefits attributed to past service by $315 million and decreased its unrecognized actuarial losses by thesame amount.
78
The following weighted-average assumptions were used to determine the Company’s netpostretirement cost for the years ended December 31:
U.S. Plans Canadian Plans2004 2003 2002 2004 2003 2002
Discount rate . . . . . . . . . . . . . . 6.25% 6.50% 7.00% 6.50% 6.75% 6.75%Health care cost trend rate . . . . 10.00 8.00 6.20 8.00 7.00 8.00
In 2005, the discount rate used to determine the Company’s net postretirement cost will be 5.75%and the health care cost trend rate will be 8.00% for its U.S. plans and 9.50% for its Canadian plans.
The Company’s postretirement health care plans are not funded. The changes in the accumulatedbenefit obligation and net amount accrued at December 31, 2004 and 2003, were as follows:
2004 2003(in millions)
Accumulated postretirement benefit obligation at January 1 . . . . . . . . . . . . . . . $ 2,955 $ 2,712Service cost . . . . . . . . . . . . . . . . . . . . . . . . . . . . . . . . . . . . . . . . . . . . . . . . 43 41Interest cost . . . . . . . . . . . . . . . . . . . . . . . . . . . . . . . . . . . . . . . . . . . . . . . . 173 173Benefits paid . . . . . . . . . . . . . . . . . . . . . . . . . . . . . . . . . . . . . . . . . . . . . . . (239) (189)Plan amendments . . . . . . . . . . . . . . . . . . . . . . . . . . . . . . . . . . . . . . . . . . . . (28)Medicare Prescription Drug, Improvement and Modernization Act of 2003 . . . (315)Currency . . . . . . . . . . . . . . . . . . . . . . . . . . . . . . . . . . . . . . . . . . . . . . . . . . 10 18Assumption changes . . . . . . . . . . . . . . . . . . . . . . . . . . . . . . . . . . . . . . . . . 268 174Actuarial losses . . . . . . . . . . . . . . . . . . . . . . . . . . . . . . . . . . . . . . . . . . . . . 36 54
Accumulated postretirement benefit obligation at December 31 . . . . . . . . . . . . . 2,931 2,955
Unrecognized actuarial losses . . . . . . . . . . . . . . . . . . . . . . . . . . . . . . . . . . . (1,005) (1,064)Unrecognized prior service cost . . . . . . . . . . . . . . . . . . . . . . . . . . . . . . . . . . 178 202
Accrued postretirement health care costs . . . . . . . . . . . . . . . . . . . . . . . . . . . . $ 2,104 $ 2,093
The current portion of the Company’s accrued postretirement health care costs of $217 million and$199 million at December 31, 2004 and 2003, respectively, are included in other accrued liabilities on theconsolidated balance sheets.
The following weighted-average assumptions were used to determine the Company’spostretirement benefit obligations at December 31:
U.S. Plans Canadian Plans2004 2003 2004 2003
Discount rate . . . . . . . . . . . . . . . . . . . . . . . . . . . . . . . . . . . . 5.75% 6.25% 5.75% 6.50%Health care cost trend rate assumed for next year . . . . . . . . . 8.00 10.00 9.50 8.00
Ultimate trend rate . . . . . . . . . . . . . . . . . . . . . . . . . . . . . . 5.00 5.00 6.00 5.00Year that the rate reaches the ultimate trend rate . . . . . . . . . 2008 2006 2012 2010
Assumed health care cost trend rates have a significant effect on the amounts reported for thehealth care plans. A one-percentage-point change in assumed health care cost trend rates would havethe following effects as of December 31, 2004:
One-Percentage-Point One-Percentage-PointIncrease Decrease
Effect on total of service and interest cost . . . . . . . . . . . . 12.5% (10.2)%Effect on postretirement benefit obligation . . . . . . . . . . . . 9.6 (8.1)
79
The Company’s estimated future benefit payments for its postretirement health care plans atDecember 31, 2004, were as follows:
U.S. Plans Canadian Plans(in millions)
2005 . . . . . . . . . . . . . . . . . . . . . . . . . . . . . . . . . . . . . . . . . . . . . . . $210 $ 72006 . . . . . . . . . . . . . . . . . . . . . . . . . . . . . . . . . . . . . . . . . . . . . . . 190 72007 . . . . . . . . . . . . . . . . . . . . . . . . . . . . . . . . . . . . . . . . . . . . . . . 189 72008 . . . . . . . . . . . . . . . . . . . . . . . . . . . . . . . . . . . . . . . . . . . . . . . 186 82009 . . . . . . . . . . . . . . . . . . . . . . . . . . . . . . . . . . . . . . . . . . . . . . . 184 82010-2014 . . . . . . . . . . . . . . . . . . . . . . . . . . . . . . . . . . . . . . . . . . . 924 46
Postemployment Benefit Plans
Kraft and certain of its affiliates sponsor postemployment benefit plans covering substantially allsalaried and certain hourly employees. The cost of these plans is charged to expense over the workinglife of the covered employees. Net postemployment costs consisted of the following for the years endedDecember 31, 2004, 2003 and 2002:
2004 2003 2002(in millions)
Service cost . . . . . . . . . . . . . . . . . . . . . . . . . . . . . . . . . . . . . . . . . . . . . $ 7 $10 $19Amortization of unrecognized net gains . . . . . . . . . . . . . . . . . . . . . . . . . (7) (5) (7)Other expense . . . . . . . . . . . . . . . . . . . . . . . . . . . . . . . . . . . . . . . . . . . 167 1 23
Net postemployment costs . . . . . . . . . . . . . . . . . . . . . . . . . . . . . . . . $167 $ 6 $35
As previously discussed in Note 3. Asset Impairment, Exit and Implementation Costs, the Companyannounced several workforce reduction programs during 2004 as part of the overall restructuringprogram. The cost of these programs, $167 million, is included in other expense above. During 2002,certain salaried employees in the United States left the Company under voluntary early retirement andintegration programs. These programs resulted in incremental postemployment costs of $23 million,which are included in other expense above.
The Company’s postemployment plans are not funded. The changes in the benefit obligations ofthe plans at December 31, 2004 and 2003, were as follows:
2004 2003(in millions)
Accumulated benefit obligation at January 1 . . . . . . . . . . . . . . . . . . . . . . . . . . . . . . $241 $295Service cost . . . . . . . . . . . . . . . . . . . . . . . . . . . . . . . . . . . . . . . . . . . . . . . . . . . . 7 10Restructuring program . . . . . . . . . . . . . . . . . . . . . . . . . . . . . . . . . . . . . . . . . . . . 167Benefits paid . . . . . . . . . . . . . . . . . . . . . . . . . . . . . . . . . . . . . . . . . . . . . . . . . . . (135) (106)Actuarial (gains) losses . . . . . . . . . . . . . . . . . . . . . . . . . . . . . . . . . . . . . . . . . . . . (28) 42
Accumulated benefit obligation at December 31 . . . . . . . . . . . . . . . . . . . . . . . . . . . 252 241Unrecognized experience gains . . . . . . . . . . . . . . . . . . . . . . . . . . . . . . . . . . . . . 74 56
Accrued postemployment costs . . . . . . . . . . . . . . . . . . . . . . . . . . . . . . . . . . . . . . . $326 $297
The accumulated benefit obligation was determined using an assumed ultimate annual turnoverrate of 0.3% in 2004 and 2003, assumed compensation cost increases of 4.0% in 2004 and 2003, andassumed benefits as defined in the respective plans. Postemployment costs arising from actions thatoffer employees benefits in excess of those specified in the respective plans are charged to expensewhen incurred.
80
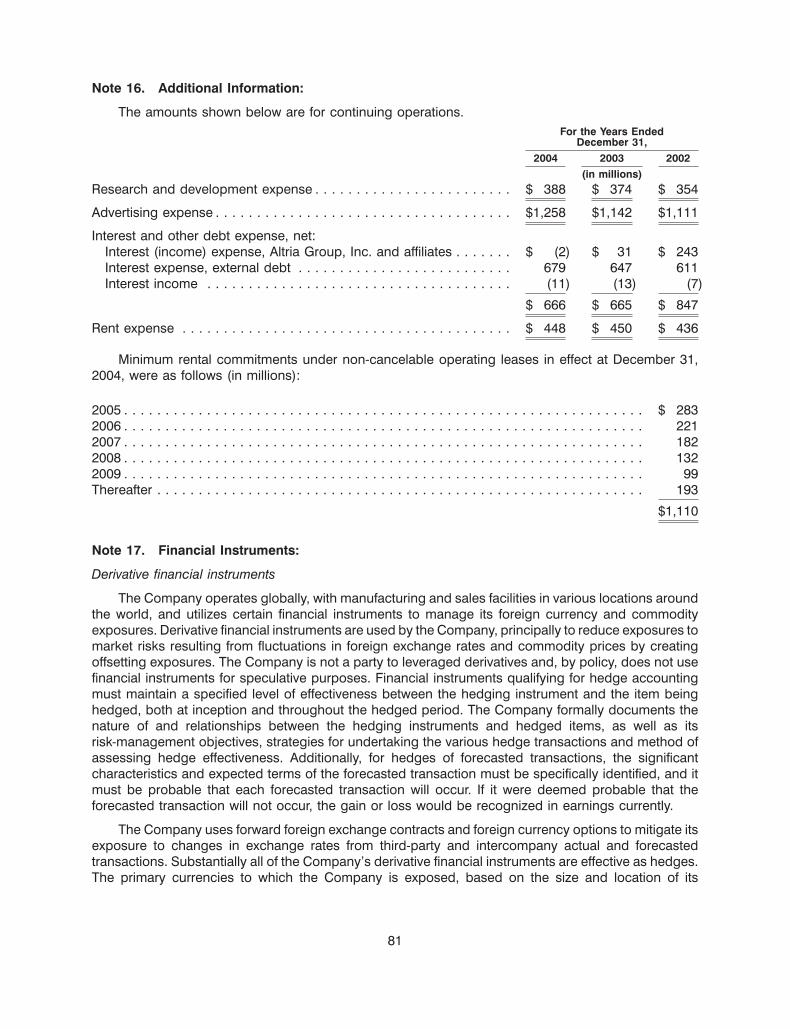
Note 16. Additional Information:
The amounts shown below are for continuing operations.For the Years Ended
December 31,2004 2003 2002
(in millions)Research and development expense . . . . . . . . . . . . . . . . . . . . . . . . $ 388 $ 374 $ 354
Advertising expense . . . . . . . . . . . . . . . . . . . . . . . . . . . . . . . . . . . . $1,258 $1,142 $1,111
Interest and other debt expense, net:Interest (income) expense, Altria Group, Inc. and affiliates . . . . . . . $ (2) $ 31 $ 243Interest expense, external debt . . . . . . . . . . . . . . . . . . . . . . . . . . 679 647 611Interest income . . . . . . . . . . . . . . . . . . . . . . . . . . . . . . . . . . . . . (11) (13) (7)
$ 666 $ 665 $ 847
Rent expense . . . . . . . . . . . . . . . . . . . . . . . . . . . . . . . . . . . . . . . . $ 448 $ 450 $ 436
Minimum rental commitments under non-cancelable operating leases in effect at December 31,2004, were as follows (in millions):
2005 . . . . . . . . . . . . . . . . . . . . . . . . . . . . . . . . . . . . . . . . . . . . . . . . . . . . . . . . . . . . . . . $ 2832006 . . . . . . . . . . . . . . . . . . . . . . . . . . . . . . . . . . . . . . . . . . . . . . . . . . . . . . . . . . . . . . . 2212007 . . . . . . . . . . . . . . . . . . . . . . . . . . . . . . . . . . . . . . . . . . . . . . . . . . . . . . . . . . . . . . . 1822008 . . . . . . . . . . . . . . . . . . . . . . . . . . . . . . . . . . . . . . . . . . . . . . . . . . . . . . . . . . . . . . . 1322009 . . . . . . . . . . . . . . . . . . . . . . . . . . . . . . . . . . . . . . . . . . . . . . . . . . . . . . . . . . . . . . . 99Thereafter . . . . . . . . . . . . . . . . . . . . . . . . . . . . . . . . . . . . . . . . . . . . . . . . . . . . . . . . . . . 193
$1,110
Note 17. Financial Instruments:
Derivative financial instruments
The Company operates globally, with manufacturing and sales facilities in various locations aroundthe world, and utilizes certain financial instruments to manage its foreign currency and commodityexposures. Derivative financial instruments are used by the Company, principally to reduce exposures tomarket risks resulting from fluctuations in foreign exchange rates and commodity prices by creatingoffsetting exposures. The Company is not a party to leveraged derivatives and, by policy, does not usefinancial instruments for speculative purposes. Financial instruments qualifying for hedge accountingmust maintain a specified level of effectiveness between the hedging instrument and the item beinghedged, both at inception and throughout the hedged period. The Company formally documents thenature of and relationships between the hedging instruments and hedged items, as well as itsrisk-management objectives, strategies for undertaking the various hedge transactions and method ofassessing hedge effectiveness. Additionally, for hedges of forecasted transactions, the significantcharacteristics and expected terms of the forecasted transaction must be specifically identified, and itmust be probable that each forecasted transaction will occur. If it were deemed probable that theforecasted transaction will not occur, the gain or loss would be recognized in earnings currently.
The Company uses forward foreign exchange contracts and foreign currency options to mitigate itsexposure to changes in exchange rates from third-party and intercompany actual and forecastedtransactions. Substantially all of the Company’s derivative financial instruments are effective as hedges.The primary currencies to which the Company is exposed, based on the size and location of its
81
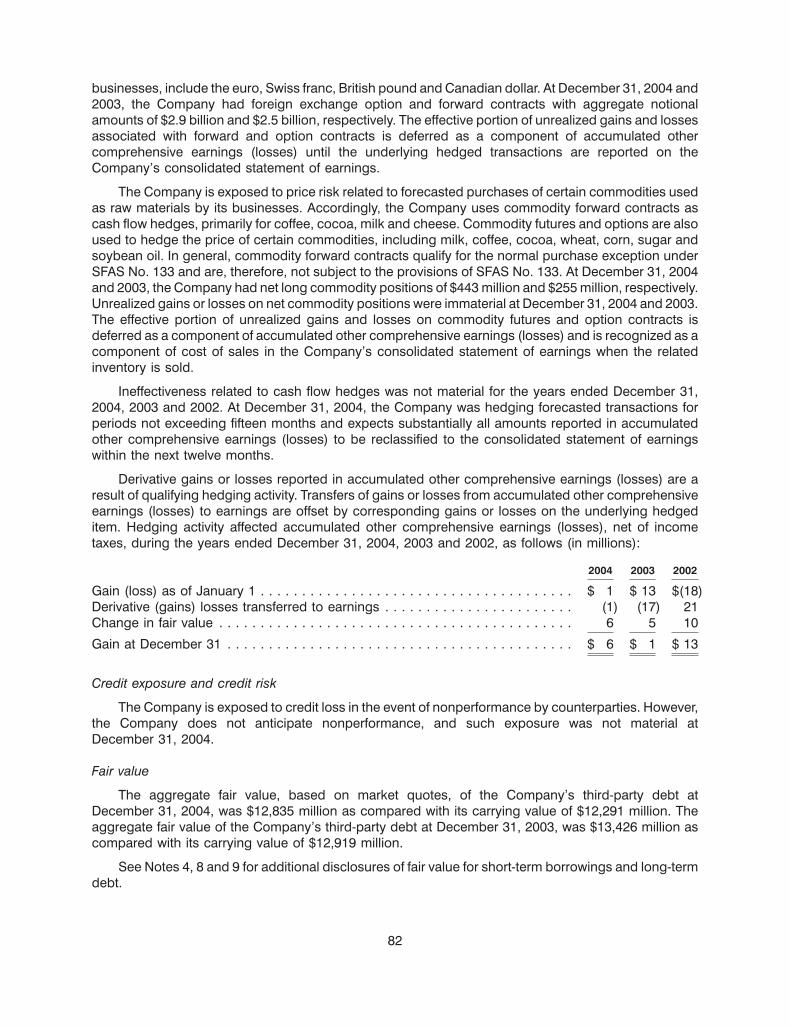
businesses, include the euro, Swiss franc, British pound and Canadian dollar. At December 31, 2004 and2003, the Company had foreign exchange option and forward contracts with aggregate notionalamounts of $2.9 billion and $2.5 billion, respectively. The effective portion of unrealized gains and lossesassociated with forward and option contracts is deferred as a component of accumulated othercomprehensive earnings (losses) until the underlying hedged transactions are reported on theCompany’s consolidated statement of earnings.
The Company is exposed to price risk related to forecasted purchases of certain commodities usedas raw materials by its businesses. Accordingly, the Company uses commodity forward contracts ascash flow hedges, primarily for coffee, cocoa, milk and cheese. Commodity futures and options are alsoused to hedge the price of certain commodities, including milk, coffee, cocoa, wheat, corn, sugar andsoybean oil. In general, commodity forward contracts qualify for the normal purchase exception underSFAS No. 133 and are, therefore, not subject to the provisions of SFAS No. 133. At December 31, 2004and 2003, the Company had net long commodity positions of $443 million and $255 million, respectively.Unrealized gains or losses on net commodity positions were immaterial at December 31, 2004 and 2003.The effective portion of unrealized gains and losses on commodity futures and option contracts isdeferred as a component of accumulated other comprehensive earnings (losses) and is recognized as acomponent of cost of sales in the Company’s consolidated statement of earnings when the relatedinventory is sold.
Ineffectiveness related to cash flow hedges was not material for the years ended December 31,2004, 2003 and 2002. At December 31, 2004, the Company was hedging forecasted transactions forperiods not exceeding fifteen months and expects substantially all amounts reported in accumulatedother comprehensive earnings (losses) to be reclassified to the consolidated statement of earningswithin the next twelve months.
Derivative gains or losses reported in accumulated other comprehensive earnings (losses) are aresult of qualifying hedging activity. Transfers of gains or losses from accumulated other comprehensiveearnings (losses) to earnings are offset by corresponding gains or losses on the underlying hedgeditem. Hedging activity affected accumulated other comprehensive earnings (losses), net of incometaxes, during the years ended December 31, 2004, 2003 and 2002, as follows (in millions):
2004 2003 2002
Gain (loss) as of January 1 . . . . . . . . . . . . . . . . . . . . . . . . . . . . . . . . . . . . . . $ 1 $ 13 $(18)Derivative (gains) losses transferred to earnings . . . . . . . . . . . . . . . . . . . . . . . (1) (17) 21Change in fair value . . . . . . . . . . . . . . . . . . . . . . . . . . . . . . . . . . . . . . . . . . . 6 5 10
Gain at December 31 . . . . . . . . . . . . . . . . . . . . . . . . . . . . . . . . . . . . . . . . . . $ 6 $ 1 $ 13
Credit exposure and credit risk
The Company is exposed to credit loss in the event of nonperformance by counterparties. However,the Company does not anticipate nonperformance, and such exposure was not material atDecember 31, 2004.
Fair value
The aggregate fair value, based on market quotes, of the Company’s third-party debt atDecember 31, 2004, was $12,835 million as compared with its carrying value of $12,291 million. Theaggregate fair value of the Company’s third-party debt at December 31, 2003, was $13,426 million ascompared with its carrying value of $12,919 million.
See Notes 4, 8 and 9 for additional disclosures of fair value for short-term borrowings and long-termdebt.
82
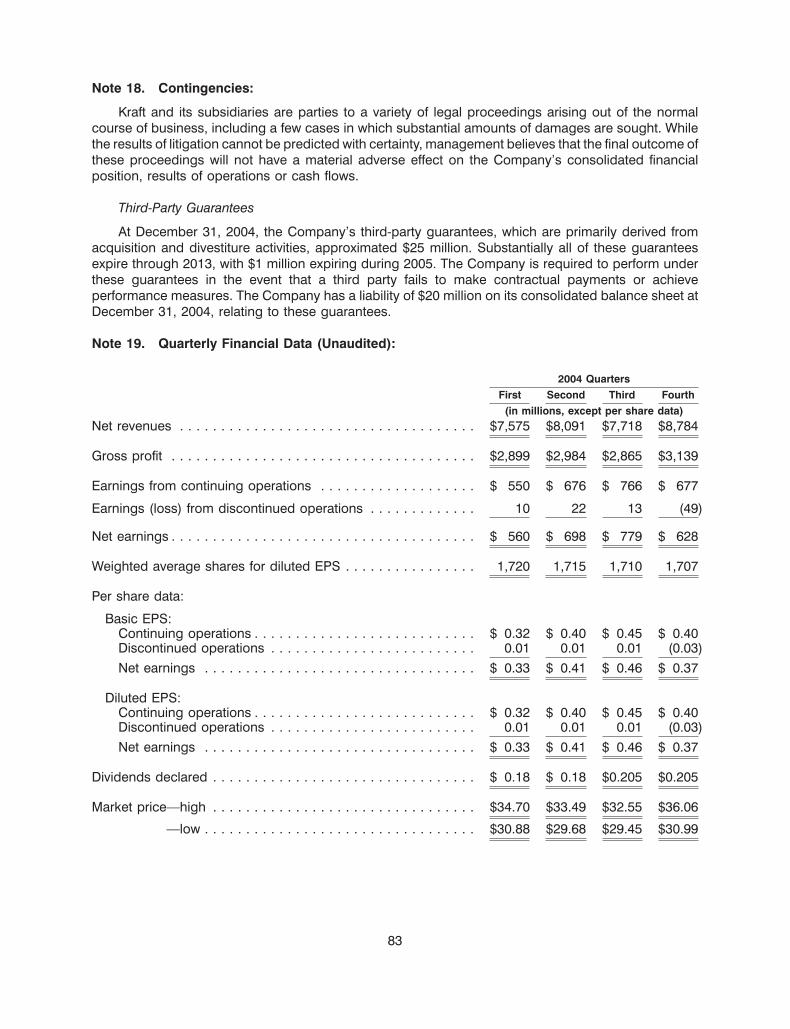
Note 18. Contingencies:
Kraft and its subsidiaries are parties to a variety of legal proceedings arising out of the normalcourse of business, including a few cases in which substantial amounts of damages are sought. Whilethe results of litigation cannot be predicted with certainty, management believes that the final outcome ofthese proceedings will not have a material adverse effect on the Company’s consolidated financialposition, results of operations or cash flows.
Third-Party Guarantees
At December 31, 2004, the Company’s third-party guarantees, which are primarily derived fromacquisition and divestiture activities, approximated $25 million. Substantially all of these guaranteesexpire through 2013, with $1 million expiring during 2005. The Company is required to perform underthese guarantees in the event that a third party fails to make contractual payments or achieveperformance measures. The Company has a liability of $20 million on its consolidated balance sheet atDecember 31, 2004, relating to these guarantees.
Note 19. Quarterly Financial Data (Unaudited):
2004 QuartersFirst Second Third Fourth
(in millions, except per share data)Net revenues . . . . . . . . . . . . . . . . . . . . . . . . . . . . . . . . . . . . $7,575 $8,091 $7,718 $8,784
Gross profit . . . . . . . . . . . . . . . . . . . . . . . . . . . . . . . . . . . . . $2,899 $2,984 $2,865 $3,139
Earnings from continuing operations . . . . . . . . . . . . . . . . . . . $ 550 $ 676 $ 766 $ 677
Earnings (loss) from discontinued operations . . . . . . . . . . . . . 10 22 13 (49)
Net earnings . . . . . . . . . . . . . . . . . . . . . . . . . . . . . . . . . . . . . $ 560 $ 698 $ 779 $ 628
Weighted average shares for diluted EPS . . . . . . . . . . . . . . . . 1,720 1,715 1,710 1,707
Per share data:
Basic EPS:Continuing operations . . . . . . . . . . . . . . . . . . . . . . . . . . . $ 0.32 $ 0.40 $ 0.45 $ 0.40Discontinued operations . . . . . . . . . . . . . . . . . . . . . . . . . 0.01 0.01 0.01 (0.03)
Net earnings . . . . . . . . . . . . . . . . . . . . . . . . . . . . . . . . . $ 0.33 $ 0.41 $ 0.46 $ 0.37
Diluted EPS:Continuing operations . . . . . . . . . . . . . . . . . . . . . . . . . . . $ 0.32 $ 0.40 $ 0.45 $ 0.40Discontinued operations . . . . . . . . . . . . . . . . . . . . . . . . . 0.01 0.01 0.01 (0.03)
Net earnings . . . . . . . . . . . . . . . . . . . . . . . . . . . . . . . . . $ 0.33 $ 0.41 $ 0.46 $ 0.37
Dividends declared . . . . . . . . . . . . . . . . . . . . . . . . . . . . . . . . $ 0.18 $ 0.18 $0.205 $0.205
Market price—high . . . . . . . . . . . . . . . . . . . . . . . . . . . . . . . . $34.70 $33.49 $32.55 $36.06
—low . . . . . . . . . . . . . . . . . . . . . . . . . . . . . . . . . $30.88 $29.68 $29.45 $30.99
83
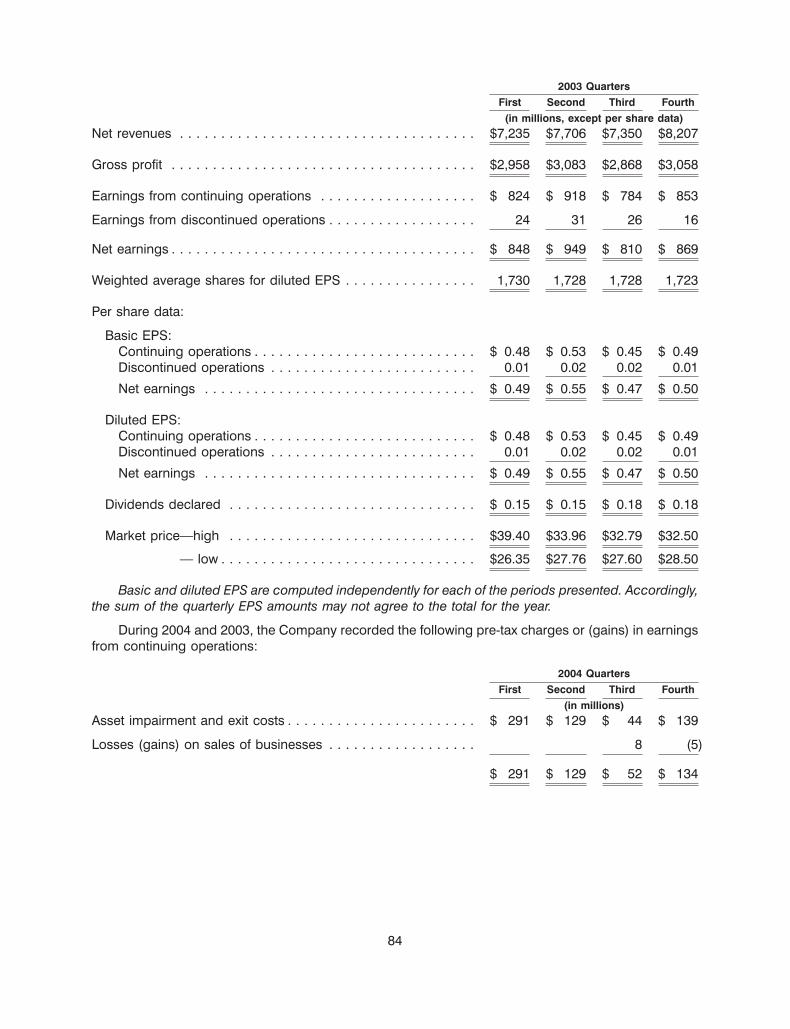
2003 QuartersFirst Second Third Fourth
(in millions, except per share data)Net revenues . . . . . . . . . . . . . . . . . . . . . . . . . . . . . . . . . . . . $7,235 $7,706 $7,350 $8,207
Gross profit . . . . . . . . . . . . . . . . . . . . . . . . . . . . . . . . . . . . . $2,958 $3,083 $2,868 $3,058
Earnings from continuing operations . . . . . . . . . . . . . . . . . . . $ 824 $ 918 $ 784 $ 853
Earnings from discontinued operations . . . . . . . . . . . . . . . . . . 24 31 26 16
Net earnings . . . . . . . . . . . . . . . . . . . . . . . . . . . . . . . . . . . . . $ 848 $ 949 $ 810 $ 869
Weighted average shares for diluted EPS . . . . . . . . . . . . . . . . 1,730 1,728 1,728 1,723
Per share data:
Basic EPS:Continuing operations . . . . . . . . . . . . . . . . . . . . . . . . . . . $ 0.48 $ 0.53 $ 0.45 $ 0.49Discontinued operations . . . . . . . . . . . . . . . . . . . . . . . . . 0.01 0.02 0.02 0.01
Net earnings . . . . . . . . . . . . . . . . . . . . . . . . . . . . . . . . . $ 0.49 $ 0.55 $ 0.47 $ 0.50
Diluted EPS:Continuing operations . . . . . . . . . . . . . . . . . . . . . . . . . . . $ 0.48 $ 0.53 $ 0.45 $ 0.49Discontinued operations . . . . . . . . . . . . . . . . . . . . . . . . . 0.01 0.02 0.02 0.01
Net earnings . . . . . . . . . . . . . . . . . . . . . . . . . . . . . . . . . $ 0.49 $ 0.55 $ 0.47 $ 0.50
Dividends declared . . . . . . . . . . . . . . . . . . . . . . . . . . . . . . $ 0.15 $ 0.15 $ 0.18 $ 0.18
Market price—high . . . . . . . . . . . . . . . . . . . . . . . . . . . . . . $39.40 $33.96 $32.79 $32.50
— low . . . . . . . . . . . . . . . . . . . . . . . . . . . . . . . $26.35 $27.76 $27.60 $28.50
Basic and diluted EPS are computed independently for each of the periods presented. Accordingly,the sum of the quarterly EPS amounts may not agree to the total for the year.
During 2004 and 2003, the Company recorded the following pre-tax charges or (gains) in earningsfrom continuing operations:
2004 QuartersFirst Second Third Fourth
(in millions)Asset impairment and exit costs . . . . . . . . . . . . . . . . . . . . . . . $ 291 $ 129 $ 44 $ 139
Losses (gains) on sales of businesses . . . . . . . . . . . . . . . . . . 8 (5)
$ 291 $ 129 $ 52 $ 134
84
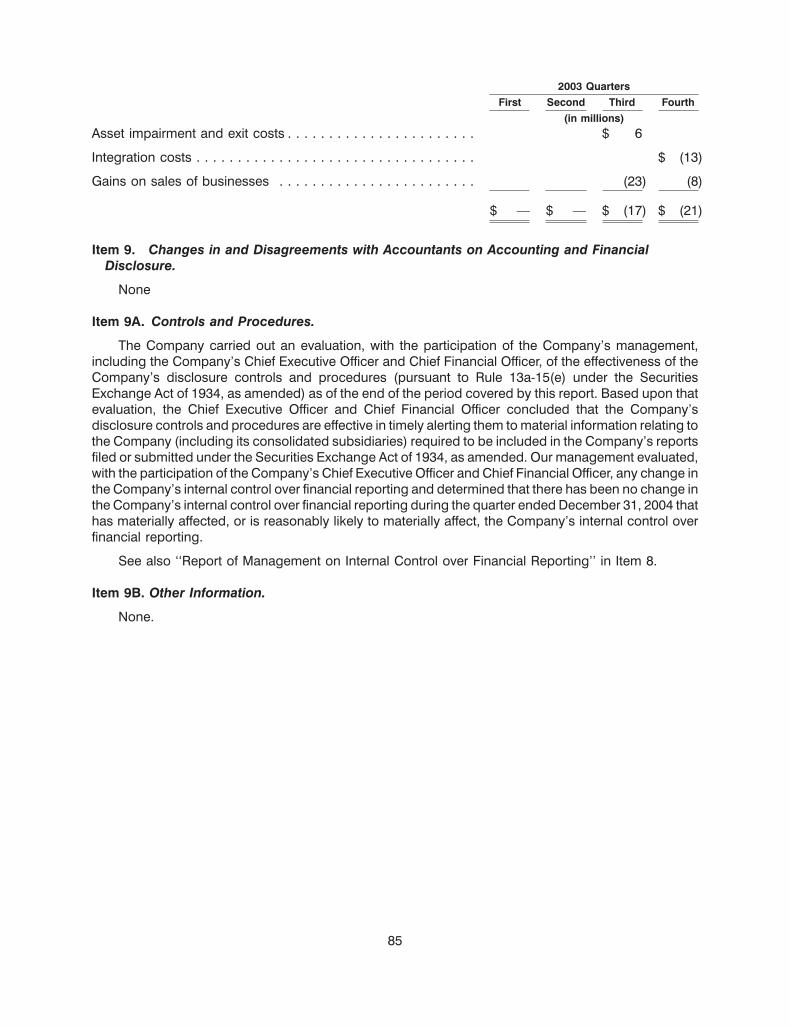
2003 QuartersFirst Second Third Fourth
(in millions)Asset impairment and exit costs . . . . . . . . . . . . . . . . . . . . . . . $ 6
Integration costs . . . . . . . . . . . . . . . . . . . . . . . . . . . . . . . . . . $ (13)
Gains on sales of businesses . . . . . . . . . . . . . . . . . . . . . . . . (23) (8)
$ — $ — $ (17) $ (21)
Item 9. Changes in and Disagreements with Accountants on Accounting and FinancialDisclosure.
None
Item 9A. Controls and Procedures.
The Company carried out an evaluation, with the participation of the Company’s management,including the Company’s Chief Executive Officer and Chief Financial Officer, of the effectiveness of theCompany’s disclosure controls and procedures (pursuant to Rule 13a-15(e) under the SecuritiesExchange Act of 1934, as amended) as of the end of the period covered by this report. Based upon thatevaluation, the Chief Executive Officer and Chief Financial Officer concluded that the Company’sdisclosure controls and procedures are effective in timely alerting them to material information relating tothe Company (including its consolidated subsidiaries) required to be included in the Company’s reportsfiled or submitted under the Securities Exchange Act of 1934, as amended. Our management evaluated,with the participation of the Company’s Chief Executive Officer and Chief Financial Officer, any change inthe Company’s internal control over financial reporting and determined that there has been no change inthe Company’s internal control over financial reporting during the quarter ended December 31, 2004 thathas materially affected, or is reasonably likely to materially affect, the Company’s internal control overfinancial reporting.
See also ‘‘Report of Management on Internal Control over Financial Reporting’’ in Item 8.
Item 9B. Other Information.
None.
85
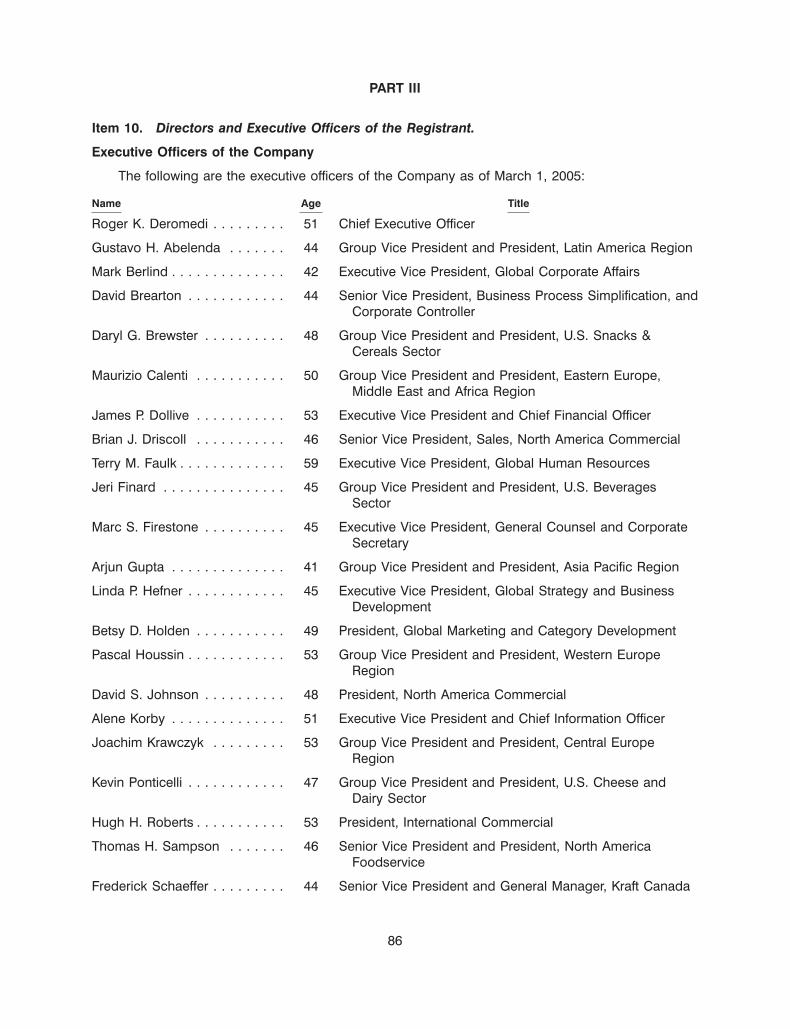
PART III
Item 10. Directors and Executive Officers of the Registrant.
Executive Officers of the Company
The following are the executive officers of the Company as of March 1, 2005:
Name Age Title
Roger K. Deromedi . . . . . . . . . 51 Chief Executive Officer
Gustavo H. Abelenda . . . . . . . 44 Group Vice President and President, Latin America Region
Mark Berlind . . . . . . . . . . . . . . 42 Executive Vice President, Global Corporate Affairs
David Brearton . . . . . . . . . . . . 44 Senior Vice President, Business Process Simplification, andCorporate Controller
Daryl G. Brewster . . . . . . . . . . 48 Group Vice President and President, U.S. Snacks &Cereals Sector
Maurizio Calenti . . . . . . . . . . . 50 Group Vice President and President, Eastern Europe,Middle East and Africa Region
James P. Dollive . . . . . . . . . . . 53 Executive Vice President and Chief Financial Officer
Brian J. Driscoll . . . . . . . . . . . 46 Senior Vice President, Sales, North America Commercial
Terry M. Faulk . . . . . . . . . . . . . 59 Executive Vice President, Global Human Resources
Jeri Finard . . . . . . . . . . . . . . . 45 Group Vice President and President, U.S. BeveragesSector
Marc S. Firestone . . . . . . . . . . 45 Executive Vice President, General Counsel and CorporateSecretary
Arjun Gupta . . . . . . . . . . . . . . 41 Group Vice President and President, Asia Pacific Region
Linda P. Hefner . . . . . . . . . . . . 45 Executive Vice President, Global Strategy and BusinessDevelopment
Betsy D. Holden . . . . . . . . . . . 49 President, Global Marketing and Category Development
Pascal Houssin . . . . . . . . . . . . 53 Group Vice President and President, Western EuropeRegion
David S. Johnson . . . . . . . . . . 48 President, North America Commercial
Alene Korby . . . . . . . . . . . . . . 51 Executive Vice President and Chief Information Officer
Joachim Krawczyk . . . . . . . . . 53 Group Vice President and President, Central EuropeRegion
Kevin Ponticelli . . . . . . . . . . . . 47 Group Vice President and President, U.S. Cheese andDairy Sector
Hugh H. Roberts . . . . . . . . . . . 53 President, International Commercial
Thomas H. Sampson . . . . . . . 46 Senior Vice President and President, North AmericaFoodservice
Frederick Schaeffer . . . . . . . . . 44 Senior Vice President and General Manager, Kraft Canada
86
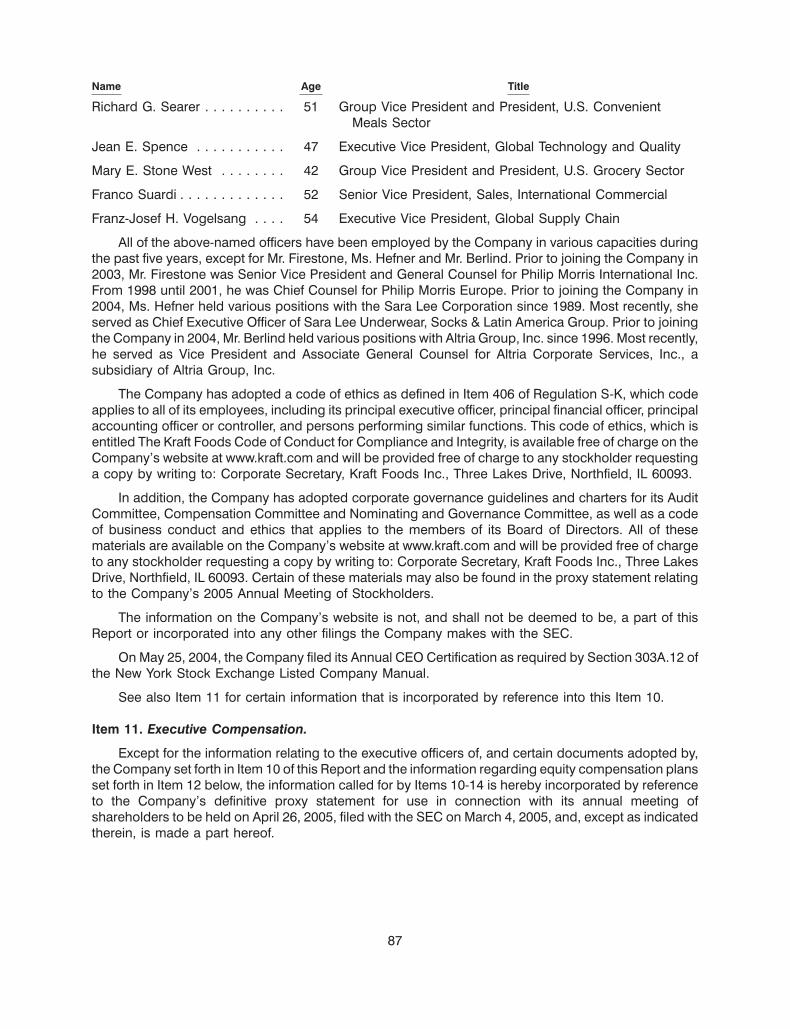
Name Age Title
Richard G. Searer . . . . . . . . . . 51 Group Vice President and President, U.S. ConvenientMeals Sector
Jean E. Spence . . . . . . . . . . . 47 Executive Vice President, Global Technology and Quality
Mary E. Stone West . . . . . . . . 42 Group Vice President and President, U.S. Grocery Sector
Franco Suardi . . . . . . . . . . . . . 52 Senior Vice President, Sales, International Commercial
Franz-Josef H. Vogelsang . . . . 54 Executive Vice President, Global Supply Chain
All of the above-named officers have been employed by the Company in various capacities duringthe past five years, except for Mr. Firestone, Ms. Hefner and Mr. Berlind. Prior to joining the Company in2003, Mr. Firestone was Senior Vice President and General Counsel for Philip Morris International Inc.From 1998 until 2001, he was Chief Counsel for Philip Morris Europe. Prior to joining the Company in2004, Ms. Hefner held various positions with the Sara Lee Corporation since 1989. Most recently, sheserved as Chief Executive Officer of Sara Lee Underwear, Socks & Latin America Group. Prior to joiningthe Company in 2004, Mr. Berlind held various positions with Altria Group, Inc. since 1996. Most recently,he served as Vice President and Associate General Counsel for Altria Corporate Services, Inc., asubsidiary of Altria Group, Inc.
The Company has adopted a code of ethics as defined in Item 406 of Regulation S-K, which codeapplies to all of its employees, including its principal executive officer, principal financial officer, principalaccounting officer or controller, and persons performing similar functions. This code of ethics, which isentitled The Kraft Foods Code of Conduct for Compliance and Integrity, is available free of charge on theCompany’s website at www.kraft.com and will be provided free of charge to any stockholder requestinga copy by writing to: Corporate Secretary, Kraft Foods Inc., Three Lakes Drive, Northfield, IL 60093.
In addition, the Company has adopted corporate governance guidelines and charters for its AuditCommittee, Compensation Committee and Nominating and Governance Committee, as well as a codeof business conduct and ethics that applies to the members of its Board of Directors. All of thesematerials are available on the Company’s website at www.kraft.com and will be provided free of chargeto any stockholder requesting a copy by writing to: Corporate Secretary, Kraft Foods Inc., Three LakesDrive, Northfield, IL 60093. Certain of these materials may also be found in the proxy statement relatingto the Company’s 2005 Annual Meeting of Stockholders.
The information on the Company’s website is not, and shall not be deemed to be, a part of thisReport or incorporated into any other filings the Company makes with the SEC.
On May 25, 2004, the Company filed its Annual CEO Certification as required by Section 303A.12 ofthe New York Stock Exchange Listed Company Manual.
See also Item 11 for certain information that is incorporated by reference into this Item 10.
Item 11. Executive Compensation.
Except for the information relating to the executive officers of, and certain documents adopted by,the Company set forth in Item 10 of this Report and the information regarding equity compensation plansset forth in Item 12 below, the information called for by Items 10-14 is hereby incorporated by referenceto the Company’s definitive proxy statement for use in connection with its annual meeting ofshareholders to be held on April 26, 2005, filed with the SEC on March 4, 2005, and, except as indicatedtherein, is made a part hereof.
87
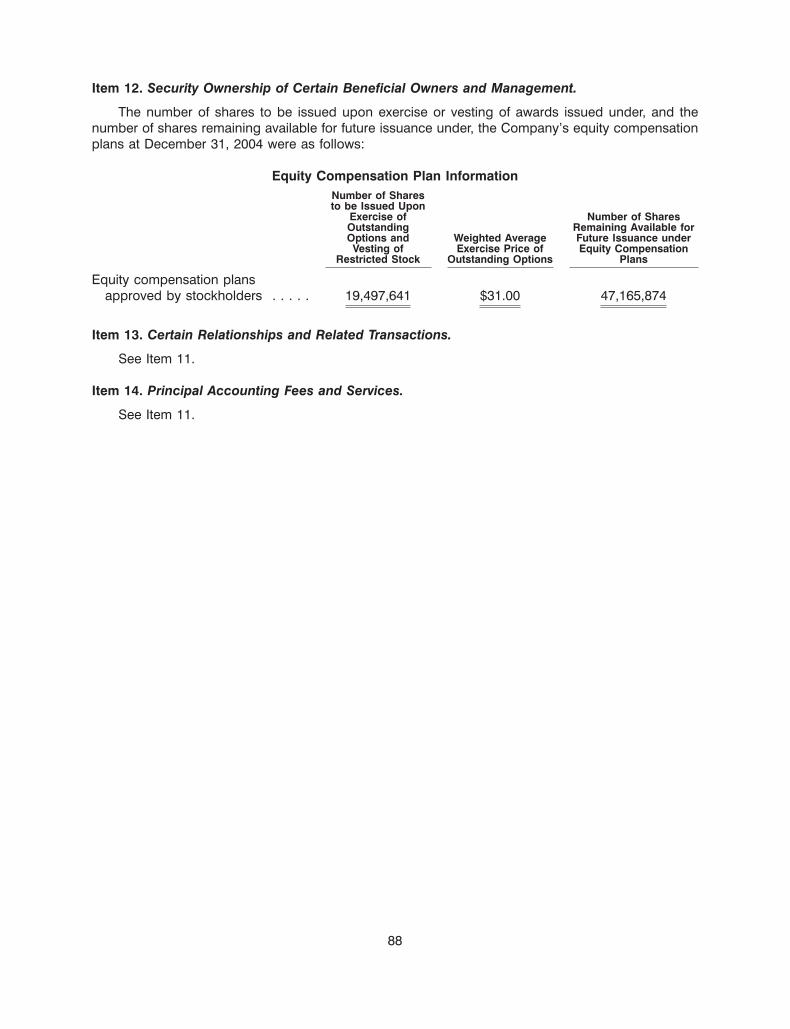
Item 12. Security Ownership of Certain Beneficial Owners and Management.
The number of shares to be issued upon exercise or vesting of awards issued under, and thenumber of shares remaining available for future issuance under, the Company’s equity compensationplans at December 31, 2004 were as follows:
Equity Compensation Plan InformationNumber of Sharesto be Issued Upon
Exercise of Number of SharesOutstanding Remaining Available forOptions and Weighted Average Future Issuance underVesting of Exercise Price of Equity Compensation
Restricted Stock Outstanding Options Plans
Equity compensation plansapproved by stockholders . . . . . 19,497,641 $31.00 47,165,874
Item 13. Certain Relationships and Related Transactions.
See Item 11.
Item 14. Principal Accounting Fees and Services.
See Item 11.
88
PART IV
Item 15. Exhibits and Financial Statement Schedules.
(a) Index to Consolidated Financial Statements and Schedules
Page
Report of Management on Internal Control over Financial Reporting . . . . . . . . . . . . . . . . . . 45Report of Independent Registered Public Accounting Firm . . . . . . . . . . . . . . . . . . . . . . . . . 46Consolidated Balance Sheets at December 31, 2004 and 2003 . . . . . . . . . . . . . . . . . . . . . . 48Consolidated Statements of Earnings for the years ended December 31, 2004, 2003 and
2002 . . . . . . . . . . . . . . . . . . . . . . . . . . . . . . . . . . . . . . . . . . . . . . . . . . . . . . . . . . . . . . 49Consolidated Statements of Shareholders’ Equity for the years ended December 31, 2004,
2003 and 2002 . . . . . . . . . . . . . . . . . . . . . . . . . . . . . . . . . . . . . . . . . . . . . . . . . . . . . . . 50Consolidated Statements of Cash Flows for the years ended December 31, 2004, 2003 and
2002 . . . . . . . . . . . . . . . . . . . . . . . . . . . . . . . . . . . . . . . . . . . . . . . . . . . . . . . . . . . . . . 51Notes to Consolidated Financial Statements . . . . . . . . . . . . . . . . . . . . . . . . . . . . . . . . . . . 52Report of Independent Registered Public Accounting Firm on Financial Statement Schedule . S-1Financial Statement Schedule—Valuation and Qualifying Accounts . . . . . . . . . . . . . . . . . . . S-2
Schedules other than those listed above have been omitted either because such schedules are notrequired or are not applicable.
(b) The following exhibits are filed as part of this Report (Exhibit Nos. 10.4 through 10.13, 10.16,10.17 and 10.22 are management contracts, compensatory plans or arrangements):
3.1 Articles of Incorporation of the Registrant(1)3.2 Articles of Amendment to the Articles of Incorporation of the
Registrant(1)3.3 Registrant’s Amended and Restated By-Laws (2)4.1 Indenture between the Registrant and JPMorgan Chase Bank, Trustee,
dated as of October 17, 2001(3)4.2 The Registrant agrees to furnish copies of any instruments defining the
rights of holders of long-term debt of the Registrant and itsconsolidated subsidiaries that does not exceed 10 percent of the totalassets of the Registrant and its consolidated subsidiaries to theCommission upon request.
10.1 Corporate Agreement between Altria Group, Inc. and the Registrant(4)10.2 Services Agreement between Altria Corporate Services, Inc. and the
Registrant (including Exhibits)(5)10.3 Tax-Sharing Agreement between Altria Group, Inc. and the
Registrant(6)10.4 2001 Kraft Foods Inc. Performance Incentive Plan(4)10.5 2001 Kraft Foods Inc. Compensation Plan for Non-Employee Directors,
as amended(7)10.6 Form of Employment Agreement entered into by Altria Group, Inc. with
each of Betsy D. Holden and Roger K. Deromedi(6)10.7 Kraft Foods Inc. Supplemental Benefits Plan I (including First
Amendment adding Supplement A)(6)10.8 Kraft Foods Inc. Supplemental Benefits Plan II(6)10.9 Form of Employee Grantor Trust Enrollment Agreement (8)(12)
10.10 The Altria Group, Inc. 1992 Incentive Compensation and Stock OptionPlan (9)(12)
89
10.11 The Altria Group, Inc. 1997 Performance Incentive Plan (10)(12)10.12 The Altria Group, Inc. 2000 Performance Incentive Plan (11)(12)10.13 2001 Kraft Foods Inc. Compensation Plan for Non-Employee Directors
(Deferred Compensation)(13)10.14 Five-Year Revolving Credit Agreement dated as of July 24, 2001(7)10.15 364 Day Revolving Credit Agreement dated as of July 13, 2004(14)10.16 Letter Agreement with Betsy D. Holden (15)10.17 Description of Agreement with Roger K. Deromedi (15)10.18 Pre-Owned Aircraft Purchase and Sales Agreements, between Altria
Corporate Services, Inc. and Kraft Foods Aviation, LLC (16)10.19 Assignment and Consent, among Gulfstream Aerospace Corporation,
Altria Corporate Services, Inc., and Kraft Foods Aviation, LLC (17)10.20 Aircraft Management Agreement between Kraft Foods Global, Inc. and
Altria Corporate Services, Inc. (18)10.21 Assignment and consent to assignment by and among Gulfstream
Aerospace Corporation, Altria Corporate Services, Inc. and Kraft FoodsAviation, LLC (19)
10.22 Form of Restricted Stock Agreement (20)12 Statements re: computation of ratios (21)21 Subsidiaries of the Registrant23 Consent of PricewaterhouseCoopers LLP, Independent Registered
Public Accounting Firm24 Powers of Attorney
31.1 Certification of the Registrant’s Chief Executive Officer pursuant to Rule13a-14(a)/15d-14(a) of the Securities Exchange Act of 1934, asamended, as adopted pursuant to Section 302 of the Sarbanes-OxleyAct of 2002.
31.2 Certification of the Registrant’s Chief Financial Officer pursuant to Rule13a-14(a)/15d-14(a) of the Securities Exchange Act of 1934, asamended, as adopted pursuant to Section 302 of the Sarbanes-OxleyAct of 2002.
32.1 Certification of the Registrant’s Chief Executive Officer pursuant to18 U.S.C. 1350, as adopted pursuant to Section 906 of the Sarbanes-Oxley Act of 2002.
32.2 Certification of the Registrant’s Chief Financial Officer pursuant to18 U.S.C. 1350, as adopted pursuant to Section 906 of the Sarbanes-Oxley Act of 2002.
(1) Incorporated by reference to the Registrant’s Form S-1 filed with the Securities and ExchangeCommission on March 16, 2001 (SEC File No. 333-57162).
(2) Incorporated by reference to the Registrant’s Form 8-K filed with the Securities and ExchangeCommission on December 8, 2004 (SEC File No. 1-16483).
(3) Incorporated by reference to the Registrant’s Form S-3 filed with the Securities and ExchangeCommission on August 16, 2001 (SEC File No. 333-67770).
(4) Incorporated by reference to the Registrant’s Amendment No. 5 to Form S-1 filed with the Securitiesand Exchange Commission on June 8, 2001 (SEC File No. 333-57162).
(5) Incorporated by reference to the Registrant’s Amendment No. 2 to Form S-1 filed with the Securitiesand Exchange Commission on May 11, 2001 (SEC File No. 333-57162).
90
(6) Incorporated by reference to the Registrant’s Amendment No. 1 to Form S-1 filed with the Securitiesand Exchange Commission on May 2, 2001 (SEC File No. 333-57162).
(7) Incorporated by reference to the Registrant’s Quarterly Report on Form 10-Q for the quarter endedMarch 31, 2003 (SEC File No. 1-16483).
(8) Incorporated by reference to the Annual Report on Form 10-K of Altria Group, Inc. for the yearended December 31, 1995 (SEC File No. 1-8940).
(9) Incorporated by reference to the Annual Report on Form 10-K of Altria Group, Inc. for the yearended December 31, 1997 (SEC File No. 1-8940).
(10) Incorporated by reference to the Proxy Statement of Altria Group, Inc. dated March 10, 1997(SEC File No. 1-8940).
(11) Incorporated by reference to the Proxy Statement of Altria Group, Inc. dated March 10, 2000(SEC File No. 1-8940).
(12) Compensation plans maintained by Altria Group, Inc. and its subsidiaries in which officers of theRegistrant have historically participated.
(13) Incorporated by reference to the Registrant’s Annual Report on Form 10-K for the year endedDecember 31, 2001 (SEC File No. 1-16483).
(14) Incorporated by reference to the Registrant’s Quarterly Report on Form 10-Q for the quarter endedJune 30, 2004 (SEC File No. 1-16483).
(15) Incorporated by reference to the Registrant’s Annual Report on Form 10-K for the year endedDecember 31, 2003 (SEC File No. 1-16483).
(16) Incorporated by reference to the Registrant’s Form 8-K filed with the Securities and ExchangeCommission on December 20, 2004 (SEC File No. 1-16483).
(17) Incorporated by reference to the Registrant’s Form 8-K filed with the Securities and ExchangeCommission on December 22, 2004 (SEC File No. 1-16483).
(18) Incorporated by reference to the Registrant’s Form 8-K filed with the Securities and ExchangeCommission on January 4, 2005 (SEC File No. 1-16483).
(19) Incorporated by reference to the Registrant’s Form 8-K filed with the Securities and ExchangeCommission on January 26, 2005 (SEC File No. 1-16483).
(20) Incorporated by reference to the Registrant’s Form 8-K filed with the Securities and ExchangeCommission on January 28, 2005 (SEC File No. 1-16483).
(21) Incorporated by reference to the Registrant’s Current Report on Form 8-K filed with the Securitiesand Exchange Commission on February 2, 2005 (SEC File No. 1-16483).
91
SIGNATURES
Pursuant to the requirements of Section 13 or 15(d) of the Securities Exchange Act of 1934,the registrant has duly caused this report to be signed on its behalf by the undersigned, thereuntoduly authorized.
KRAFT FOODS INC.
By: /s/ JAMES P. DOLLIVE
(James P. Dollive,Executive Vice President
and Chief Financial Officer)
Date: March 11, 2005
Pursuant to the requirements of the Securities Exchange Act of 1934, this report has beensigned below by the following persons on behalf of the registrant and in the capacities and on thedate indicated:
Signature Title Date
/s/ ROGER K. DEROMEDI Director and Chief Executive March 11, 2005Officer(Roger K. Deromedi)
/s/ JAMES P. DOLLIVE Executive Vice President and March 11, 2005Chief Financial Officer(James P. Dollive)
/s/ DAVID BREARTON Senior Vice President, March 11, 2005Business Process(David Brearton)Simplification, and CorporateController
*JAN BENNINK,LOUIS C. CAMILLERI,DINYAR S. DEVITRE,W. JAMES FARRELL,BETSY D. HOLDEN,RICHARD A. LERNER,JOHN C. POPE,MARY L. SCHAPIRO,CHARLES R. WALL,DEBORAH C. WRIGHT Directors
*By: /s/ JAMES P. DOLLIVE March 11, 2005
(James P. Dollive,Attorney-in-fact)
REPORT OF INDEPENDENT REGISTERED PUBLIC ACCOUNTING FIRMON FINANCIAL STATEMENT SCHEDULE
To the Board of Directors and Shareholders ofKraft Foods Inc.:
Our audits of the consolidated financial statements, of management’s assessment of theCompany’s internal control over financial reporting and of the effectiveness of the Company’s internalcontrol over financial reporting referred to in our report dated February 2, 2005 appearing in this AnnualReport on Form 10-K also included an audit of the financial statement schedule listed in Item 15(a) of thisForm 10-K. In our opinion, this financial statement schedule presents fairly, in all material respects, theinformation set forth therein when read in conjunction with the related consolidated financial statements.
/s/ PRICEWATERHOUSECOOPERS LLP
Chicago, IllinoisFebruary 2, 2005
S-1
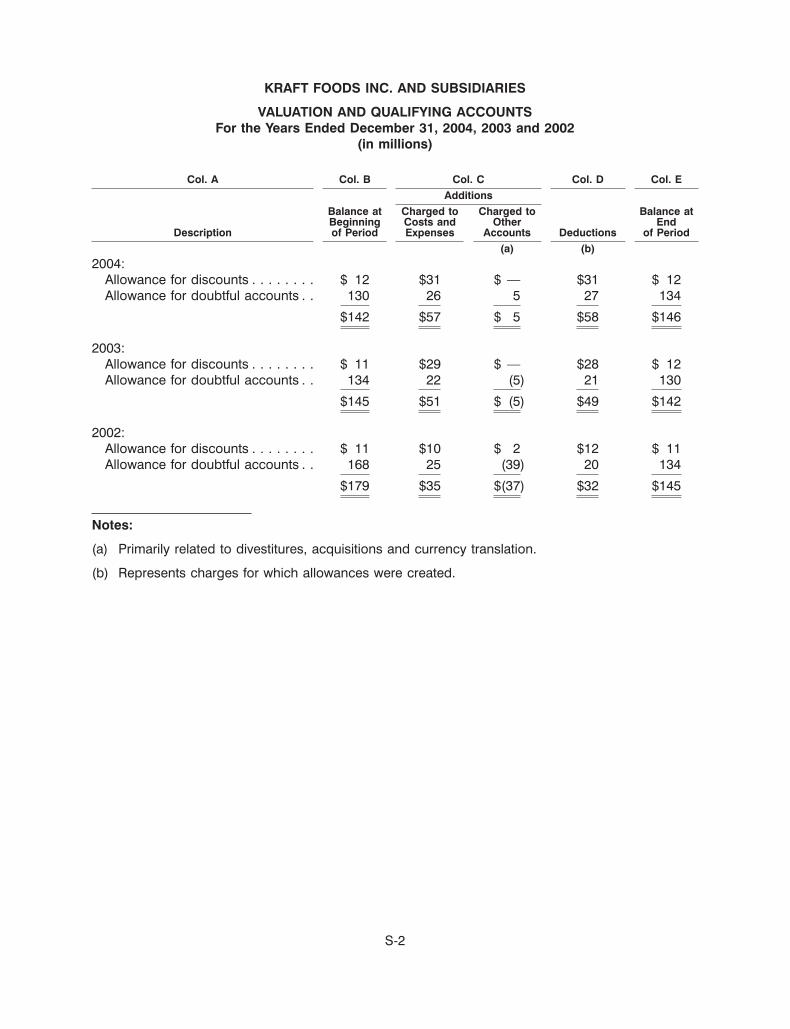
KRAFT FOODS INC. AND SUBSIDIARIES
VALUATION AND QUALIFYING ACCOUNTSFor the Years Ended December 31, 2004, 2003 and 2002
(in millions)
Col. A Col. B Col. C Col. D Col. EAdditions
Balance at Charged to Charged to Balance atBeginning Costs and Other End
Description of Period Expenses Accounts Deductions of Period(a) (b)
2004:Allowance for discounts . . . . . . . . $ 12 $31 $ — $31 $ 12Allowance for doubtful accounts . . 130 26 5 27 134
$142 $57 $ 5 $58 $146
2003:Allowance for discounts . . . . . . . . $ 11 $29 $ — $28 $ 12Allowance for doubtful accounts . . 134 22 (5) 21 130
$145 $51 $ (5) $49 $142
2002:Allowance for discounts . . . . . . . . $ 11 $10 $ 2 $12 $ 11Allowance for doubtful accounts . . 168 25 (39) 20 134
$179 $35 $(37) $32 $145
Notes:
(a) Primarily related to divestitures, acquisitions and currency translation.
(b) Represents charges for which allowances were created.
S-2