kraft foods Annual Reports 2003
66
How we will grow grow our our future future. Kraft Foods Inc. 2003 Annual Report
-
Upload
finance7 -
Category
Economy & Finance
-
view
227 -
download
1
Transcript of kraft foods Annual Reports 2003

How we will grow grow ourour future future..
Kraft Foods Inc. 2003 Annual Report

We can say it in six simple words. Value. Transform
We are committed to delivering sustainable growth – top
must delight the world with the right benefits at the right
a step ahead of tomorrow. We must expand our global
We must be organized to leverage our strengths. And
That’s exactly what we intend to do.
ation. Scale. Cost. Organization. Responsibility.
line, bottom line and cash flow. To do it, we know our brands
price. We must continuously transform our products
scale. We must capture cost savings to fuel our growth.
we must act responsibly throughout the world community.
2003 Financial Highlights. Consolidated Results
2
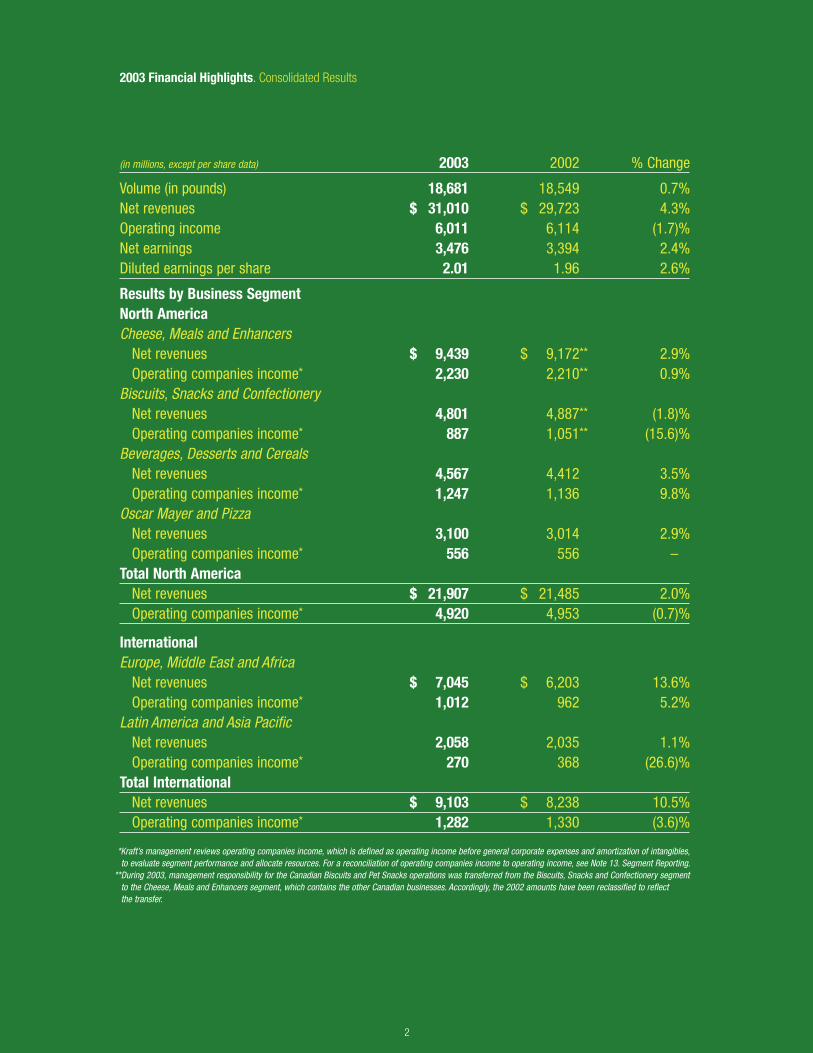
(in millions, except per share data) 2003 2002 % Change
Volume (in pounds) 18,681 18,549 0.7%Net revenues $ 31,010 $ 29,723 4.3%Operating income 6,011 6,114 (1.7)%Net earnings 3,476 3,394 2.4%Diluted earnings per share 2.01 1.96 2.6%
Results by Business SegmentNorth AmericaCheese, Meals and Enhancers Net revenues $ 9,439 $ 9,172** 2.9% Operating companies income* 2,230 2,210** 0.9%Biscuits, Snacks and Confectionery Net revenues 4,801 4,887** (1.8)% Operating companies income* 887 1,051** (15.6)%Beverages, Desserts and Cereals Net revenues 4,567 4,412 3.5% Operating companies income* 1,247 1,136 9.8%Oscar Mayer and Pizza Net revenues 3,100 3,014 2.9% Operating companies income* 556 556 –Total North America Net revenues $ 21,907 $ 21,485 2.0% Operating companies income* 4,920 4,953 (0.7)%
InternationalEurope, Middle East and Africa Net revenues $ 7,045 $ 6,203 13.6% Operating companies income* 1,012 962 5.2%Latin America and Asia Pacific Net revenues 2,058 2,035 1.1% Operating companies income* 270 368 (26.6)%Total International Net revenues $ 9,103 $ 8,238 10.5% Operating companies income* 1,282 1,330 (3.6)%
*Kraft’s management reviews operating companies income, which is defined as operating income before general corporate expenses and amortization of intangibles, to evaluate segment performance and allocate resources. For a reconciliation of operating companies income to operating income, see Note 13. Segment Reporting.**During 2003, management responsibility for the Canadian Biscuits and Pet Snacks operations was transferred from the Biscuits, Snacks and Confectionery segment to the Cheese, Meals and Enhancers segment, which contains the other Canadian businesses. Accordingly, the 2002 amounts have been reclassified to reflect the transfer.
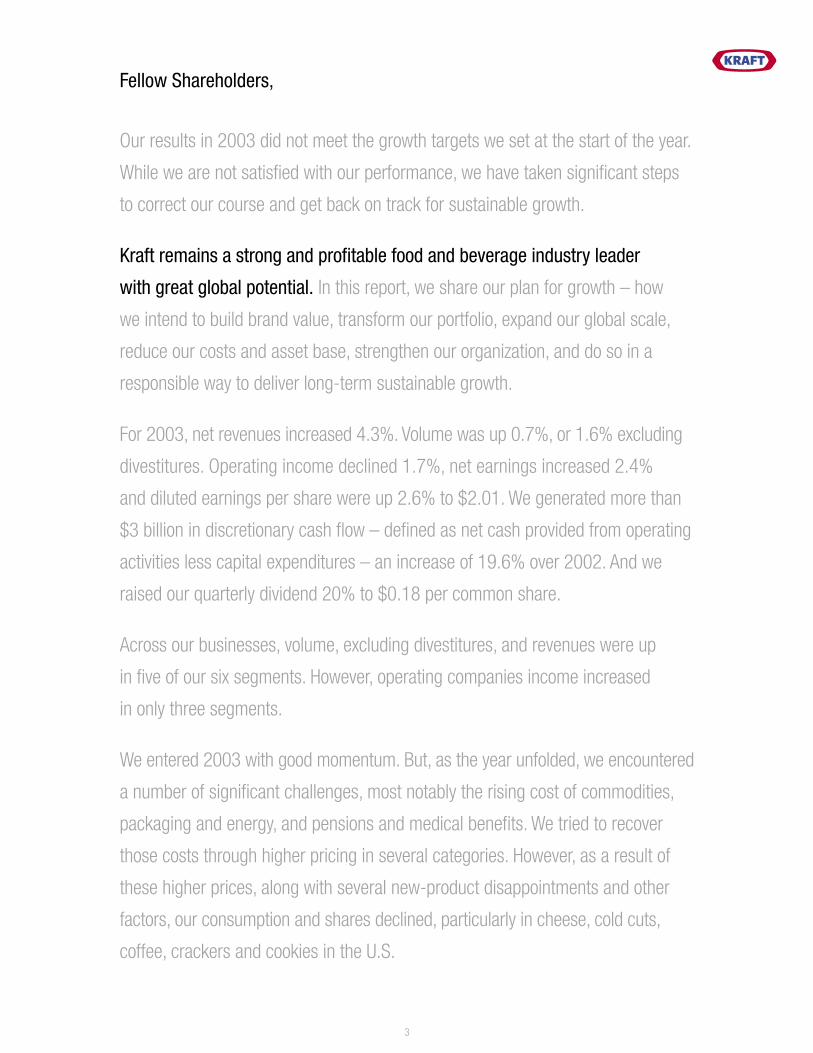
Our results in 2003 did not meet the growth targets we set at the start of the year.
While we are not satisfied with our performance, we have taken significant steps
to correct our course and get back on track for sustainable growth.
Kraft remains a strong and profitable food and beverage industry leader
with great global potential. In this report, we share our plan for growth – how
we intend to build brand value, transform our portfolio, expand our global scale,
reduce our costs and asset base, strengthen our organization, and do so in a
responsible way to deliver long-term sustainable growth.
For 2003, net revenues increased 4.3%. Volume was up 0.7%, or 1.6% excluding
divestitures. Operating income declined 1.7%, net earnings increased 2.4%
and diluted earnings per share were up 2.6% to $2.01. We generated more than
$3 billion in discretionary cash flow – defined as net cash provided from operating
activities less capital expenditures – an increase of 19.6% over 2002. And we
raised our quarterly dividend 20% to $0.18 per common share.
Across our businesses, volume, excluding divestitures, and revenues were up
in five of our six segments. However, operating companies income increased
in only three segments.
We entered 2003 with good momentum. But, as the year unfolded, we encountered
a number of significant challenges, most notably the rising cost of commodities,
packaging and energy, and pensions and medical benefits. We tried to recover
those costs through higher pricing in several categories. However, as a result of
these higher prices, along with several new-product disappointments and other
factors, our consumption and shares declined, particularly in cheese, cold cuts,
coffee, crackers and cookies in the U.S.
Fellow Shareholders,
3
In September, we initiated a reinvestment program to restore our brand value
in those focus categories. We invested nearly $200 million in the last four months
of the year to increase marketing and manage prices, and by January of 2004,
we witnessed good progress. With the important exception of cookies, consumption
and share trends improved across the other focus categories of cheese, cold cuts,
coffee and crackers.
We were encouraged, but recognized we needed to do more than simply reverse
these declines. We had to address several critical realities in a changed operating
environment:
• Consumers and retailers are increasingly value-conscious.
• Powerful trends are reshaping the food business, including health and wellness,
convenience, shifts in retail channels and the growth of the multicultural
population in the United States.
• The competitive need for global scale has never been greater.
• Costs will continue to rise.
With these realities in mind, we decided to realign our organizational structure,
reenergize our performance with a Sustainable Growth Plan and set new
financial targets.
Our new global structure links three organizational dimensions – a Global Marketing
& Category Development group to create global category strategies and new-
product growth platforms; North America Commercial and International Commercial
units to drive sales and marketing execution country by country; and global
functions to foster best practices around the world in a cost-effective manner.
4
With a “best of global, best of local” organization, we’re set up to deliver
our four-point Sustainable Growth Plan.
First, to build superior brand value, we must deliver more product benefits for
the price paid than our competitors.
We have an exceptional portfolio of brands. To ensure we continue to grow our
leading brands, we are targeting an increase in our marketing spending in 2004
of $500 million to $600 million. This stepped-up rate of spending, based on a
category-by-category, country-by-country analysis, will give us the resources
we need to market and price our products competitively.
Second, to transform our portfolio, we are aligning our products with key
consumer and customer trends, retail channels and demographic groups.
As more consumers focus on health and wellness, we’re responding with products
like Triscuit crackers with zero grams trans fat; Kool-Aid Jammers 10 with only
10 calories per serving; and Tang Plus with fortification and flavors tailored to the
nutritional needs and taste preferences of different countries.
We’re meeting the growing need for convenience with products like single-serve
Philadelphia Minis in Europe, nutritionally balanced Lunchables Fun Fuel in the
U.S., and the launch in France later in 2004 of Tassimo, our innovative new,
on-demand, hot beverage system.
Third, to expand our global scale, particularly in fast-growing developing countries,
we are capturing the growth potential of our core categories in markets where we
already operate, and we are building our infrastructure in new high-potential markets.
5

And fourth, to reduce our costs and asset base, we announced in January 2004
a major cost restructuring program that goes beyond our ongoing productivity
efforts and that will help fund our growth initiatives. Over the next three years,
we anticipate exiting or closing up to 20 production facilities and reducing our
global work force by approximately 6%, or about 6,000 positions across all
levels of the organization.
The program is expected to result in pre-tax charges of about $1.2 billion, with
the majority occurring in 2004 and 2005. We expect to generate approximately
$400 million in annual pre-tax savings by 2006, which is more than 50% of the
cash outlays required to implement the program.
It’s never easy to close a plant or eliminate a job because of the impact it has
on the people who have worked hard to make this company successful. However
difficult these steps may be, achieving sustainable growth is ultimately the best
way to build a stronger company and meet our responsibilities to the greatest
number of employees, investors and communities.
We believe our Sustainable Growth Plan will deliver consistent results over
the long term. In 2004, we expect constant currency revenue growth to be around
3%, including tack-on acquisitions and excluding divestitures, driven by volume
growth of 2%-3%. However, the step-up in marketing spending and an anticipated
$0.30 per share in restructuring charges will lower diluted earnings per share to
a projected range of $1.63-$1.70, versus $2.01 in 2003.
On a longer-term basis, we believe we can grow constant currency revenues,
including tack-on acquisitions and excluding divestitures, in the 3% range,
supported by volume growth of 2%-3%. And we expect to deliver long-term
annual earnings per share growth of 6%-9%.
6
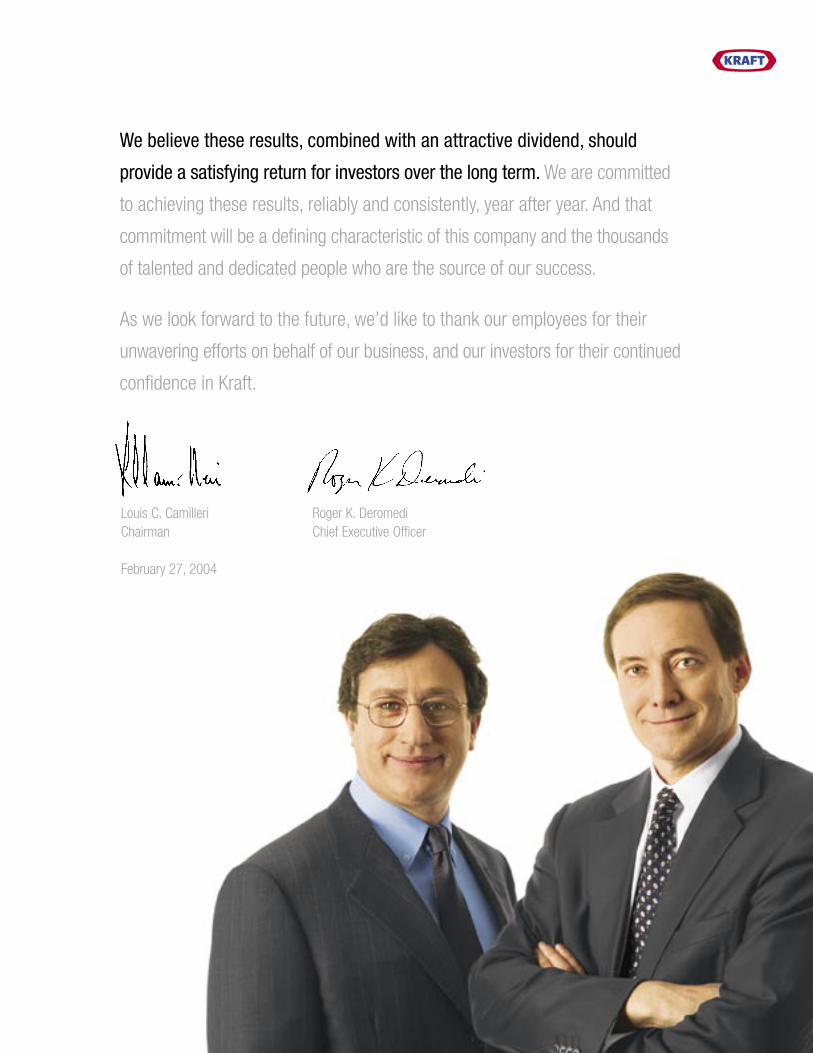
We believe these results, combined with an attractive dividend, should
provide a satisfying return for investors over the long term. We are committed
to achieving these results, reliably and consistently, year after year. And that
commitment will be a defining characteristic of this company and the thousands
of talented and dedicated people who are the source of our success.
As we look forward to the future, we’d like to thank our employees for their
unwavering efforts on behalf of our business, and our investors for their continued
confidence in Kraft.
Louis C. Camilleri Roger K. DeromediChairman Chief Executive Officer
February 27, 2004

8
Value.Value. The ultimate measure of a brand.
9
Food may be a trillion-dollar business, but every dollar of sales is still
earned one purchase at a time. And nothing determines a buying decision
more than brand value – delivering the right benefits at the right price.
It usually takes only an instant for consumers to weigh the benefits each
brand offers, consider the price, then reach for what they want. At that
moment of choice, we want to be the choice they make.
That’s why our highest priority – the thing we must do first, quickest and best
– is invest in brand value. We are fixing the value equation wherever it’s out
of balance and continuing to build brand value across our entire portfolio.
The bundle of benefits each brand offers may include superior taste, more
convenient packaging or simple availability wherever people expect to
find a product. Or it may be nutrition or even the service a brand provides.
Supported by our world-class R&D capabilities, we must innovate constantly
and refresh the benefits we offer.
Whatever those benefits are, they must come at an attractive price.
We must anticipate market forces and manage our costs to ensure our
pricing is competitive. And we must support our brands with the optimal
level of marketing. The additional funds we reinvested in marketing and
price management in 2003 helped restore brand value in our focus
categories. The progress was encouraging, and we’re planning on an
increase in spending of $500 million to $600 million in 2004.
There’s no better long-term investment we can make than building
the value of our brands.
10
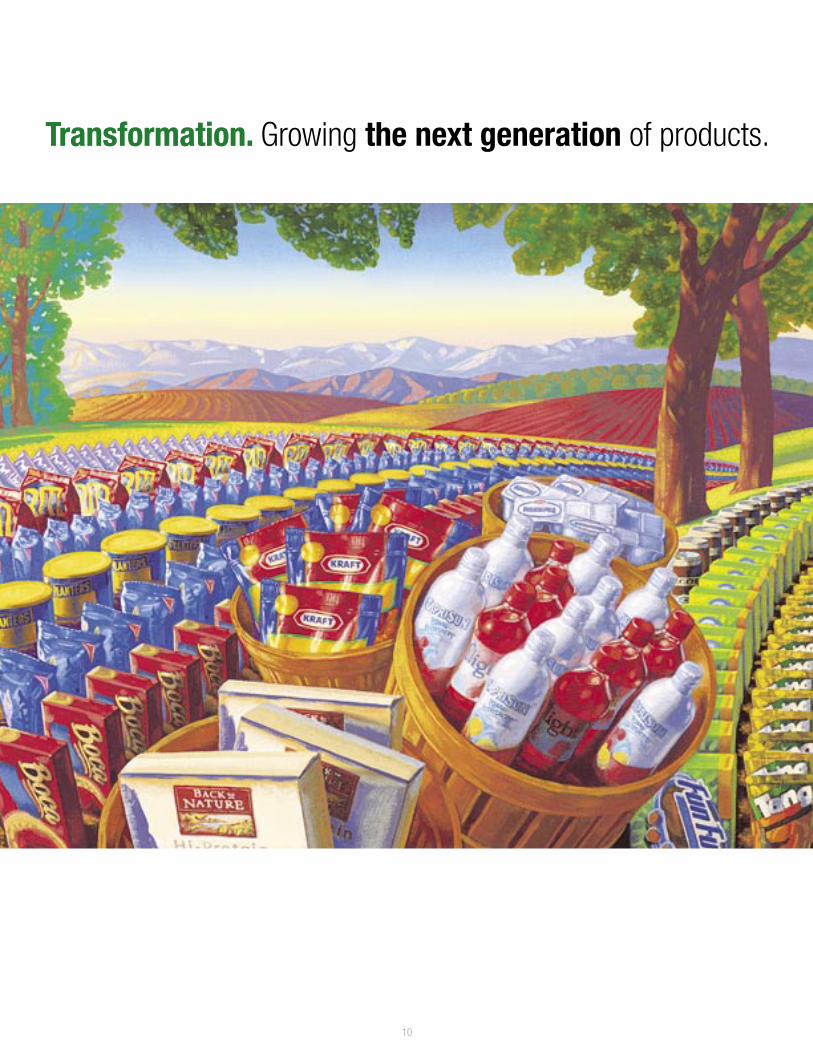
TransformationTransformation.. Growing the next generation of products.
11
In a world of change, we have to run just to stand still. To achieve
sustainable growth, we must stay a step ahead of tomorrow.
We are accelerating a shift in our portfolio to satisfy the growing demand
for health and wellness, and convenience. We are developing additional
products and packages that fit fast-growing distribution channels.
And we are deepening our connection to multicultural households
with more products and services tailored to their needs.
We are bringing to market a generation of new products to help consumers
meet a range of health and wellness needs – weight management, natural
and organic foods, performance nutrition, health management and general
nutrition. To answer the call for convenience, we’re introducing products
that are easier to prepare, more portable and pre-portioned.
As more volume shifts to newer and broader retail channels, we are
customizing our portfolio and programs to build our share. We’re placing
our brands in fast-growing food-away-from-home venues, not only to gain
volume but also to create billions of consumer brand impressions.
And in the U.S., where the Hispanic population continues to grow rapidly,
our on-the-ground dedicated marketing teams are introducing more
specialty products, bilingual packaging and outreach programs to suit
local preferences, local culture and local community needs.
Tomorrow, the world will want something different than it wants today.
We need to anticipate, identify, develop and market it faster and better
than ever before.

12
ScaleScale.. Extending our global reach.
13
We must become a more global company. The greater our scale,
the more profitable our growth. And nowhere is that more true than
in the developing world, where faster population and income growth
rates are driving increased demand for branded consumer goods.
Today, developing markets account for 84% of the world’s population,
30% of its packaged food consumption and 23% of its gross domestic
product. Yet, these markets account for only 11% of our revenues.
We’re focusing first on countries like Russia, China, Brazil and Mexico,
where we have the scale and efficiency to grow most profitably. We’re
growing by expanding our core categories where they already exist.
So, for example, in China we are building our biscuits business with new
introductions that leverage our global technologies but deliver a local taste.
We’re also expanding our core categories into current markets where
they don’t yet exist. For instance, we added Philadelphia cream cheese to
our established portfolio of products in Brazil last year, and after only six
months, we became the number one cream cheese in the country.
But we’re also targeting new markets where we can build scale and
ultimately accelerate growth. Our acquisition a couple of years ago in
Russia of the Stollwerck confectionery business is a good example. With
the scale we gained, not only did we grow the confectionery business we
acquired, we also were able to expand our coffee business as well and
drive more than 14% growth in overall volume in Russia in 2003.
We’re now at home in more than 150 countries around the world.
But we’ve only begun to reach our global growth potential.
14
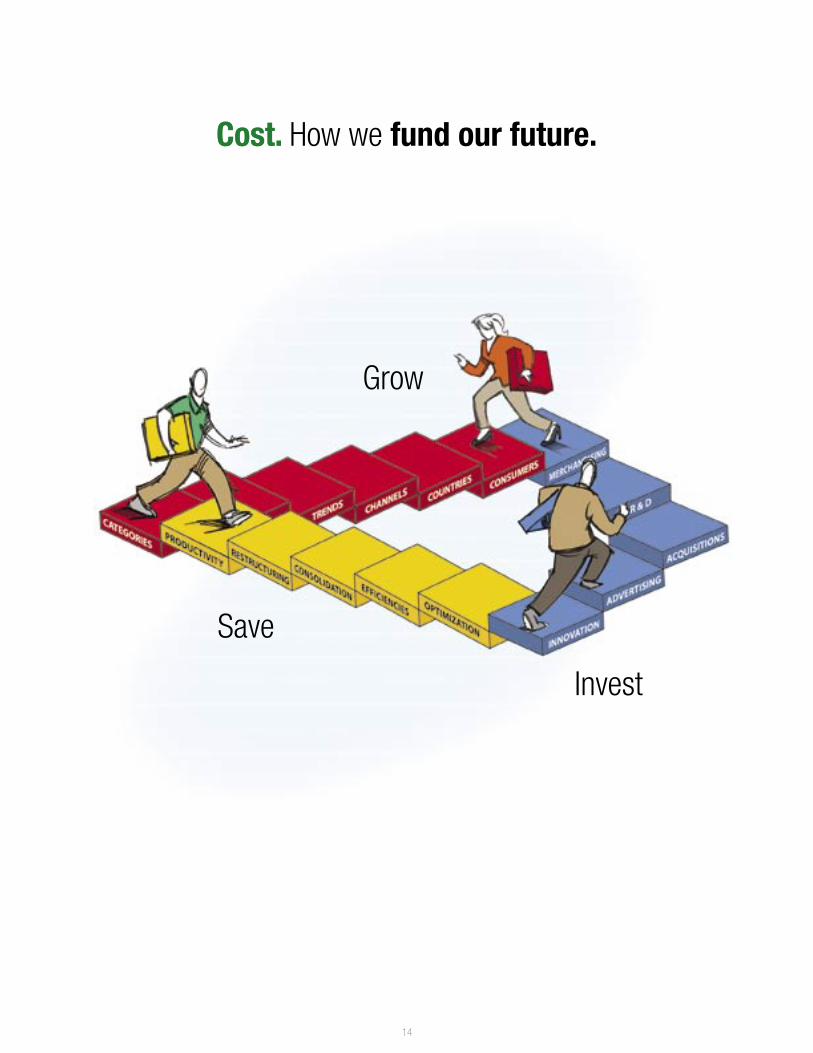
CostCost.. How we fund our future.
Invest
Save
Grow

15
Save, invest, grow. It’s the continuous cycle that drives long-term,
sustainable results.
Productivity – and the steady flow of savings it creates – will continue to be
a hallmark of Kraft. While it comes from many sources, we see two areas
that offer particular opportunity for ongoing cost savings.
The first is supply chain initiatives, where we will further leverage
our procurement scale on a global basis and rationalize less profitable
product variations to help us achieve greater production and
distribution efficiencies.
The second is through advances in technology. We will continue to automate
our plants and distribution centers, formulate our products in lower-cost
ways that improve or maintain our product quality, and seek out alternative,
lower-cost packaging materials.
Beginning in 2004, we’re taking additional steps that are right for the
future but difficult in the present. To increase our investment in growth,
we must become an even more efficient company. So we are beginning
an estimated $1.2 billion pre-tax, three-year cost restructuring program.
By leveraging our global scale, lowering our cost structure and optimizing
our capacity utilization, we expect this program to generate about
$400 million in annual pre-tax savings by 2006 to invest back in our
brands and accelerate top-line-driven earnings growth.
We know the actions we take to reduce our costs today will give us the
financial flexibility to fund our success tomorrow.
16
OrganizationOrganization.. The best of global, best of local.
world.company.team.
17
With one world to serve, we are now organized into a unified, global
team. But in going global, we’re still ready to meet the local needs of
consumers and customers around the world.
Our new structure brings together three organizational dimensions – a new
global marketing and category development group, our geographic-based
commercial units and our key global functions.
The power of this new organizational structure lies in its ability to accelerate
the flow of innovation from market to market, create true worldwide
category and functional expertise, ensure superior local execution and
develop our management strength—all at a faster pace than ever before.
This new structure is also more efficient. It eliminates duplication within
functions and provides the opportunity to further consolidate facilities.
Of course, an organizational structure is nothing more than lines and boxes
on a page without the people who bring it alive. We believe we have one of
the strongest and most experienced leadership teams in the food industry.
From the 12 senior leaders on the new Kraft Executive Team to the tens of
thousands of dedicated employees around the world who put quality into
every Kraft product, it’s their talent, insight, experience and passion that
make the difference.
No matter what else changes, one thing will remain the same. We can
create a new organizational structure, we can develop a new plan, we can
set any growth target we wish, but we can do nothing without our people.

18
ResponsibilityResponsibility.. Helping people eat and live better.
19
Achieving sustainable growth is not enough. We must do it in a
responsible way. In fact, we think business success is not sustainable
if it ignores the economic, social and environmental consequences
on which it is built.
To ensure we meet our responsibilities as a public company and global
citizen, we have formed a Corporate Responsibility Council of senior
leaders from across the company. The council is focused on three primary
areas. First, we strengthened our already rigorous governance programs
by updating our corporate code of conduct and providing training for
employees around the world. Second, we provided more than $90 million
in food and financial support to communities worldwide. And third, we took
important steps to address key societal issues relevant to our business.
Two initiatives were of particular note.
With the help of an advisory council of experts, we increased our
response to the rise in obesity by initiating an ongoing program to modify
the nutritional profile of our products, revise our marketing policies and
practices, increase nutrition labeling and advocate for constructive
public policy changes.
Recognizing the importance of a viable supply chain, we joined with
the Rainforest Alliance to strengthen Kraft’s decade-long commitment to
promoting sustainable coffee production. The goals: to improve conditions
on coffee farms, provide a better economic return for coffee growers and
help move sustainable coffee from market niche to the mainstream.
Ultimately, the success of any business depends on the public’s trust.
We are committed to earning that trust every day.
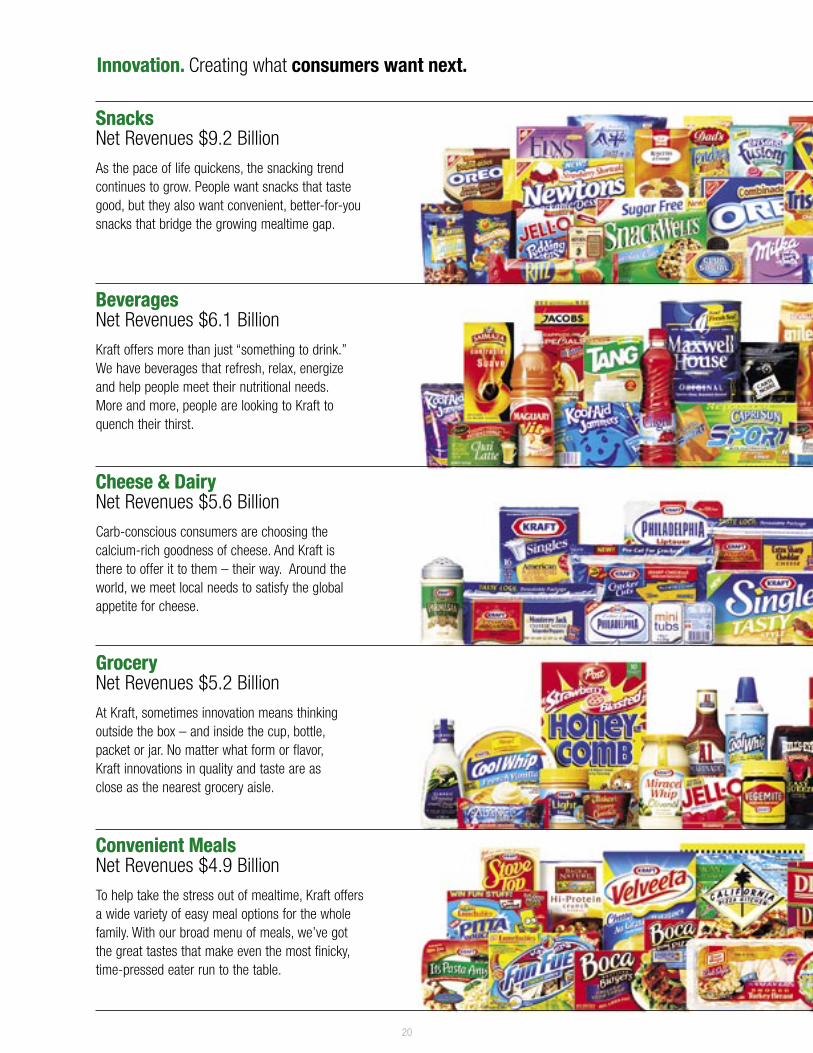
SnacksSnacksNet Revenues $9.2 BillionAs the pace of life quickens, the snacking trend continues to grow. People want snacks that taste good, but they also want convenient, better-for-you snacks that bridge the growing mealtime gap.
BeveragesBeveragesNet Revenues $6.1 BillionKraft offers more than just “something to drink.” We have beverages that refresh, relax, energize and help people meet their nutritional needs. More and more, people are looking to Kraft to quench their thirst.
20
GroceryGroceryNet Revenues $5.2 BillionAt Kraft, sometimes innovation means thinking outside the box – and inside the cup, bottle, packet or jar. No matter what form or flavor, Kraft innovations in quality and taste are as close as the nearest grocery aisle.
Cheese & DairyCheese & DairyNet Revenues $5.6 BillionCarb-conscious consumers are choosing the calcium-rich goodness of cheese. And Kraft is there to offer it to them – their way. Around the world, we meet local needs to satisfy the global appetite for cheese.
Convenient MealsConvenient MealsNet Revenues $4.9 BillionTo help take the stress out of mealtime, Kraft offers a wide variety of easy meal options for the whole family. With our broad menu of meals, we’ve got the great tastes that make even the most finicky, time-pressed eater run to the table.
Innovation.Innovation. Creating what consumers want next.
• Ritz, America’s number-one-selling cracker has an oven-toasted chip with less fat than regular fried potato chips. Since its introduction in August 2003, Ritz Chips has achieved a 2.8% share of the U.S. cracker category.
• New crispy, aromatic Pacific Soda Seaweed crackers helped grow total Pacific Soda share of the biscuits category in China. The cracker is well aligned with the health and wellness trend.
• There’s good news in nuts. Not only did consumption of Planters nuts in the U.S. grow double digits in 2003, but a new heart health claim and a good fit with carb-conscious diets pave the way for future growth.
• The U.K. launch of fun and convenient Terry’s Chocolate Orange Segsations twist-wrapped chocolates drove a 3% increase in U.K. confectionery volume.
• With its launch in September 2003, In A Biskit crackers’ new Vegemite flavor built on the strong Vegemite franchise, expanding it into the snacks category and capturing 7.2% of the Australian flavored snacks segment.
• Ready-to-drink beverages continued their rapid volume growth in the U.S. with strong performances from new products, including Capri Sun Refreshers, packaged in an innovative bottle-can.
• We successfully launched Tang Plus fortified with vitamins and minerals in 10 developing markets in 2003.
• In Brazil, we introduced Maguary Vit, a combination of three fruits, which, when added to milk, becomes a tasty and nutritious drink for the whole family.
• Our Maxwell House coffee easy-open Fresh Seal can in the U.S. eliminated an important “dissatisfier” in coffee – the need for a can opener.
• Designed especially to quench the thirsty Hispanic market, Kool-Aid Aguas Frescas, a new line of Kool-Aid powdered soft drinks, was launched in the U.S.
• In France, Carte Noire Voluptuoso soft pods offer the deep Carte Noire flavor topped with a smooth foam. It’s designed for the coffee-machine owner looking for on-demand convenience.
• Kraft Singles with “Double the Calcium” taps into parents’ need to get more calcium in kids’ diets. Its debut in the U.S. helped grow consumption by more than four points and share by nearly two points.
• Introduced in the second quarter of 2003 in the U.K., Ireland and Italy, Philadelphia Minis offer four individually sealed tubs of cream cheese in one package – perfect for a fresh and portable snack. It helped increase U.K. Philadelphia share by 2.5 points to more than 60% for the year.
• Designed for easy use, new Kraft Cracker Cuts feature 18 pre-cut, cracker-sized slices. This innovation has helped grow the natural cheese business and maintain our number one branded share position in chunk cheese in the U.S.
• Launched in Australia in August, two new Kraft Individually Wrapped Singles flavors – Swiss Style and Tasty Style – have captured 5.6% of the singles segment.
• Introduced in the U.S., Jell-O Smoothies – a wholesome, 100-calorie treat – is the first fruit-based product from the Jell-O brand and the first packaged smoothie you eat with a spoon.
• In 2003, Kraft Canada launched Miracle Whip, Miracle Whip Light and Miracle Whip Hot ‘n Spicy Dressing in an easy-to-use upside-down squeeze bottle.
• In the fast-growing nutritional and energy bar category, we took our most popular Balance sub-line in the U.S. and extended it with the launch of four great Balance Gold Crunch items.
• A.1. Chicago Steakhouse Marinade has become the number one item in the brand’s marinades line and one of the top selling in the category. In the U.S., A.1. Marinades consumption is up nearly 35%, and share is up about two points.
• In Brazil, we recently introduced Fresh Gelatin, using a hybrid sweetener system that delivers more servings per easy-to-use pouch. Fresh Gelatin is available in four flavors – strawberry, lemon, pineapple and grape.
• Since its U.S. national introduction in April, Oscar Mayer Deli Style Shaved Ham & Turkey has gained a dollar share point of the large cold cuts category. The fast-selling Deli Style Shaved line will be expanded in 2004.
• Kraft acquired Back to Nature cereal and granola in the U.S. as a platform for expansion into a range of fast-growing, natural and organic food categories.
• Lunchables Fun Fuel, a new nutritionally balanced meal combination, drove Lunchables U.S. pound share to more than 89%.
• Since its U.S. national launch in April, Boca Rising Crust Supreme Pizza has become the number one item in dollar share in the meat alternatives pizza segment.
• Dairylea Lunchables Pitta Pouches launched in the U.K. and is available in regular and Funpack formats.
• Our Kraft Dinner Macaroni and Cheese continued its leading performance in Canada, with 2.4 points of pound share growth and a 6.6% jump in consumption.
21
Financial Contents
Management’s Discussion and Analysis of Financial Condition and Results of Operations .......................... 23
Selected Financial Data – Five Year Review ................................................................................................. 39
Consolidated Balance Sheets ...................................................................................................................... 40
Consolidated Statements of Earnings .......................................................................................................... 41
Consolidated Statements of Cash Flows ..................................................................................................... 42
Consolidated Statements of Shareholders’ Equity ....................................................................................... 43
Notes to Consolidated Financial Statements ............................................................................................... 44
Report of Independent Auditors ................................................................................................................... 60
Company Report on Financial Statements ................................................................................................... 60
Kraft Foods Inc. Financial Review
22
For easy reference, areas that may be of interest to investors are highlighted in the index below.
Benefit Plans (See Note 14) ........................................................................................................................ 53
Related Party Transactions (See Note 3) .................................................................................................... 47
Segment Reporting (See Note 13) .............................................................................................................. 51
Stock Plans (See Note 10) .......................................................................................................................... 49
Kraft Foods Inc. Guide to Select Disclosures
Overview
Kraft Foods Inc. (“Kraft”), together with its subsidiaries (collectivelyreferred to as the “Company”), is the largest branded food andbeverage company headquartered in the United States. Prior toJune 13, 2001, Kraft was a wholly-owned subsidiary of Altria Group,Inc. On June 13, 2001, Kraft completed an initial public offering(“IPO”) of 280,000,000 shares of its Class A common stock at a priceof $31.00 per share. The IPO proceeds, net of the underwritingdiscount and expenses, of $8.4 billion were used to retire a portionof an $11.0 billion long-term note payable to Altria Group, Inc.,incurred in connection with the acquisition of Nabisco HoldingsCorp. (“Nabisco”). After the IPO, Altria Group, Inc. ownedapproximately 83.9% of the outstanding shares of Kraft’s capitalstock through its ownership of 49.5% of Kraft’s Class A commonstock and 100% of Kraft’s Class B common stock. Kraft’s Class Acommon stock has one vote per share, while Kraft’s Class Bcommon stock has ten votes per share. At December 31, 2003,Altria Group, Inc. held 97.9% of the combined voting power of Kraft’soutstanding capital stock and owned approximately 84.6% of theoutstanding shares of Kraft’s capital stock.
The Company conducts its global business through twosubsidiaries: Kraft Foods North America, Inc. (“KFNA”) and KraftFoods International, Inc. (“KFI”). KFNA manages its operationsprincipally by product category, while KFI manages its operations bygeographic region. During 2003, 2002 and 2001, KFNA’s segmentswere Cheese, Meals and Enhancers; Biscuits, Snacks andConfectionery; Beverages, Desserts and Cereals; and Oscar Mayerand Pizza. KFNA’s food service business within the United Statesand its businesses in Canada, Mexico and Puerto Rico werereported through the Cheese, Meals and Enhancers segment. KFI’ssegments were Europe, Middle East and Africa; and Latin Americaand Asia Pacific.
During January 2004, the Company announced a new globalorganizational structure, which will result in new segments forfinancial reporting purposes. Beginning in 2004, the Company’snew segments will be U.S. Beverages & Grocery; U.S. Snacks; U.S.Cheese, Canada & North America Foodservice; U.S. ConvenientMeals; Europe, Middle East & Africa; and Latin America & AsiaPacific. The new segment structure in North America reflects ashift of certain divisions and brands between segments to alignbusinesses with consumer targets. Results for the Mexico andPuerto Rico businesses will be reported in the Latin America andAsia Pacific segment.
The Company’s 2003, 2002 and 2001 results by segment arediscussed herein under the reporting structure in place during 2003.The Company will report financial results in the new segmentstructure beginning with the results for the first quarter of 2004, andhistorical amounts will be restated.
Critical Accounting Policies
Note 2 to the consolidated financial statements includes a summaryof the significant accounting policies and methods used in thepreparation of the Company’s consolidated financial statements.In most instances, the Company must use an accounting policyor method because it is the only policy or method permitted underaccounting principles generally accepted in the United States ofAmerica (“U.S. GAAP”).
The preparation of all financial statements includes the use ofestimates and assumptions that affect a number of amountsincluded in the Company’s financial statements, including, amongother things, employee benefit costs and income taxes. TheCompany bases its estimates on historical experience and otherassumptions that it believes are reasonable. If actual amountsare ultimately different from previous estimates, the revisions areincluded in the Company’s consolidated results of operations forthe period in which the actual amounts become known. Historically,the aggregate differences, if any, between the Company’s estimatesand actual amounts in any year have not had a significant impacton the Company’s consolidated financial statements.
23
Kraft Foods Inc. Management’s Discussion and Analysis of Financial Condition and Results of Operations
Kraft Foods Inc. Management’s Discussion and Analysis of Financial Condition and Results of Operations
The selection and disclosure of the Company’s critical accountingpolicies and estimates have been discussed with the Company’sAudit Committee. The following is a review of the more significantassumptions and estimates, as well as the accounting policies andmethods used in the preparation of the Company’s consolidatedfinancial statements:
Employee Benefit Plans: As discussed in Note 14 to theconsolidated financial statements, the Company provides a range ofbenefits to its employees and retired employees, including pensions,postretirement health care benefits and postemployment benefits(primarily severance). The Company records amounts relating tothese plans based on calculations specified by U.S. GAAP, whichinclude various actuarial assumptions, such as discount rates,assumed rates of return on plan assets, compensation increases,turnover rates and health care cost trend rates. The Companyreviews its actuarial assumptions on an annual basis and makesmodifications to the assumptions based on current rates and trendswhen it is deemed appropriate to do so. As required by U.S. GAAP,the effect of the modifications is generally amortized over futureperiods. The Company believes that the assumptions utilized inrecording its obligations under its plans, which are presented inNote 14 to the consolidated financial statements, are reasonablebased on its experience and advice from its actuaries.
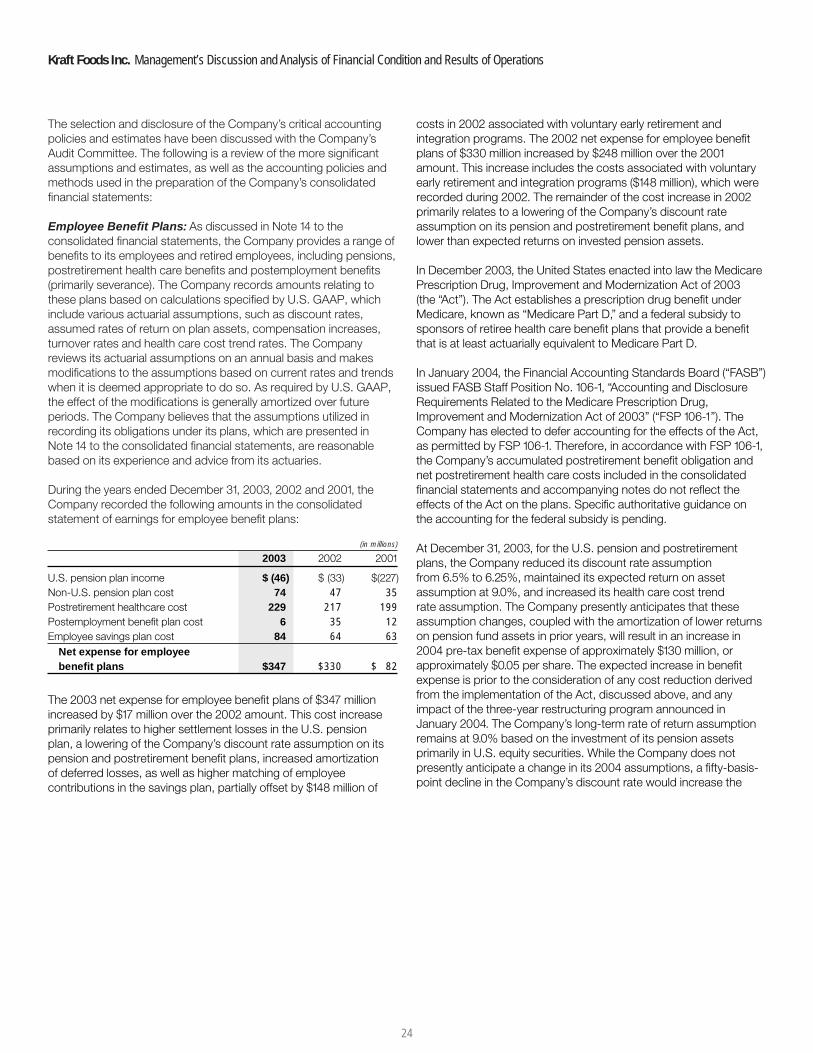
During the years ended December 31, 2003, 2002 and 2001, theCompany recorded the following amounts in the consolidatedstatement of earnings for employee benefit plans:
(in millions)
2003 2002 2001
U.S. pension plan income $ (46) $ (33) $(227)Non-U.S. pension plan cost 74 47 35Postretirement healthcare cost 229 217 199Postemployment benefit plan cost 6 35 12Employee savings plan cost 84 64 63
Net expense for employee benefit plans $347 $330 $ 82
The 2003 net expense for employee benefit plans of $347 millionincreased by $17 million over the 2002 amount. This cost increaseprimarily relates to higher settlement losses in the U.S. pensionplan, a lowering of the Company’s discount rate assumption on itspension and postretirement benefit plans, increased amortizationof deferred losses, as well as higher matching of employeecontributions in the savings plan, partially offset by $148 million of
costs in 2002 associated with voluntary early retirement andintegration programs. The 2002 net expense for employee benefitplans of $330 million increased by $248 million over the 2001amount. This increase includes the costs associated with voluntaryearly retirement and integration programs ($148 million), which wererecorded during 2002. The remainder of the cost increase in 2002primarily relates to a lowering of the Company’s discount rateassumption on its pension and postretirement benefit plans, andlower than expected returns on invested pension assets.
In December 2003, the United States enacted into law the MedicarePrescription Drug, Improvement and Modernization Act of 2003(the “Act”). The Act establishes a prescription drug benefit underMedicare, known as “Medicare Part D,” and a federal subsidy tosponsors of retiree health care benefit plans that provide a benefitthat is at least actuarially equivalent to Medicare Part D.
In January 2004, the Financial Accounting Standards Board (“FASB”)issued FASB Staff Position No. 106-1, “Accounting and DisclosureRequirements Related to the Medicare Prescription Drug,Improvement and Modernization Act of 2003” (“FSP 106-1”). TheCompany has elected to defer accounting for the effects of the Act,as permitted by FSP 106-1. Therefore, in accordance with FSP 106-1,the Company’s accumulated postretirement benefit obligation andnet postretirement health care costs included in the consolidatedfinancial statements and accompanying notes do not reflect theeffects of the Act on the plans. Specific authoritative guidance onthe accounting for the federal subsidy is pending.
At December 31, 2003, for the U.S. pension and postretirementplans, the Company reduced its discount rate assumptionfrom 6.5% to 6.25%, maintained its expected return on assetassumption at 9.0%, and increased its health care cost trendrate assumption. The Company presently anticipates that theseassumption changes, coupled with the amortization of lower returnson pension fund assets in prior years, will result in an increase in2004 pre-tax benefit expense of approximately $130 million, orapproximately $0.05 per share. The expected increase in benefitexpense is prior to the consideration of any cost reduction derivedfrom the implementation of the Act, discussed above, and anyimpact of the three-year restructuring program announced inJanuary 2004. The Company’s long-term rate of return assumptionremains at 9.0% based on the investment of its pension assetsprimarily in U.S. equity securities. While the Company does notpresently anticipate a change in its 2004 assumptions, a fifty-basis-point decline in the Company’s discount rate would increase the
24
Company’s pension and postretirement expense by approximately$65 million, while a fifty-basis-point increase in the discount ratewould decrease pension and postretirement expense byapproximately $55 million. Similarly, a fifty-basis-point decrease(increase) in the expected return on plan assets would increase(decrease) the Company’s pension expense for the U.S. pensionplans by approximately $30 million. See Note 14 to the consolidatedfinancial statements for a sensitivity discussion of the assumedhealth care cost trend rates.
Revenue Recognition: As required by U.S. GAAP, the Companyrecognizes revenues, net of sales incentives, and including shippingand handling charges billed to customers, upon shipment ofgoods when title and risk of loss pass to customers. Shipping andhandling costs are classified as part of cost of sales. Provisionsand allowances for estimated sales returns and bad debts are alsorecorded in the Company’s consolidated financial statements. Theamounts recorded for these provisions and related allowances arenot significant to the Company’s consolidated financial position orresults of operations.
Depreciation and Amortization: The Company depreciatesproperty, plant and equipment and amortizes definite life intangiblesusing straight-line methods over the estimated useful lives ofthe assets. As discussed in Note 2 to the consolidated financialstatements, on January 1, 2002, the Company adopted theprovisions of a new accounting standard and, as a result, stoppedrecording the amortization of goodwill as a charge to earnings asof January 1, 2002.
Marketing and Advertising Costs: As required by U.S. GAAP,the Company records marketing costs as an expense in the year towhich such costs relate. The Company does not defer amounts onits year-end consolidated balance sheet with respect to marketingcosts. The Company expenses advertising costs in the yearincurred. The Company records consumer incentive and tradepromotion costs as a reduction of revenues in the year in whichthese programs are offered, based on estimates of utilization andredemption rates that are developed from historical information.
Related Party Transactions: As discussed in Note 3 to theconsolidated financial statements, Altria Group, Inc.’s subsidiary,Altria Corporate Services, Inc., provides the Company with variousservices, including planning, legal, treasury, accounting, auditing,insurance, human resources, office of the secretary, corporateaffairs, information technology and tax services. Billings for theseservices, which were based on the cost to Altria CorporateServices, Inc. to provide such services and a management fee,were $318 million, $327 million and $339 million for the years endedDecember 31, 2003, 2002 and 2001, respectively. Although the
cost of these services cannot be quantified on a stand-alone basis,management has assessed that the billings are reasonable based onthe level of support provided by Altria Corporate Services, Inc., andthat they reflect all services provided. The cost and nature of theservices are reviewed annually by the Company’s Audit Committee,which consists solely of independent directors. The effects of thesetransactions are included in operating cash flows in the Company’sconsolidated statements of cash flows.
The Company had long-term notes payable to Altria Group, Inc. andits affiliates as follows:
(in millions)
At December 31, 2003 2002
Notes payable in 2009, interest at 7.0% $— $1,150Short-term due to Altria Group, Inc. and affiliates
reclassified as long-term 1,410$— $2,560
During 2003, the Company repaid Altria Group, Inc. the remaining$1,150 million on the 7.0% note, as well as the $1,410 million of short-term borrowings reclassified to long-term. In addition, at December31, 2003 and 2002, the Company had short-term amounts payableto Altria Group, Inc. of $543 million and $895 million, respectively.Interest on these borrowings is based on the applicable LondonInterbank Offered Rate.
Income Taxes: The Company accounts for income taxes inaccordance with Statement of Financial Accounting Standards(“SFAS”) No. 109, “Accounting for Income Taxes.” The accounts ofthe Company are included in the consolidated federal income taxreturn of Altria Group, Inc. Income taxes are generally computedon a separate company basis. To the extent that foreign tax credits,capital losses and other credits generated by the Company, whichcannot currently be utilized on a separate company basis, areutilized in Altria Group, Inc.’s consolidated federal income tax return,the benefit is recognized in the calculation of the Company’sprovision for income taxes. Based on the Company’s currentestimate, this benefit is calculated to be approximately $100 million,$240 million and $220 million for the years ended December 31,2003, 2002 and 2001, respectively. The benefit is dependent on avariety of tax attributes which have a tendency to vary year to year.The Company makes payments to, or is reimbursed by, Altria Group,Inc. for the tax effects resulting from its inclusion in Altria Group,Inc.’s consolidated federal income tax return. The provision forincome taxes is based on domestic and international statutoryincome tax rates and tax planning opportunities available to theCompany in the jurisdictions in which it operates. Significantjudgment is required in determining income tax provisions and in
25

Kraft Foods Inc. Management’s Discussion and Analysis of Financial Condition and Results of Operations
evaluating tax positions. The Company establishes additionalprovisions for income taxes when, despite the belief that existing taxpositions are fully supportable, there remain certain positions thatare likely to be challenged and that may not be sustained on reviewby tax authorities. The Company adjusts these additional accrualsin light of changing facts and circumstances. The consolidatedtax provision includes the impact of changes to accruals that areconsidered appropriate, as well as the related net interest. If theCompany’s filing positions are ultimately upheld under audits byrespective taxing authorities, it is possible that the provision forincome taxes in future years may reflect favorable adjustments.
Business Environment
The Company is subject to a number of challenges that mayadversely affect its businesses. These challenges, which arediscussed below and under the “Forward-Looking and CautionaryStatements” section include:
• fluctuations in commodity prices;
• movements of foreign currencies against the U.S. dollar;
• competitive challenges in various products and markets, includingprice gaps with competitor products and the increasing price-consciousness of consumers;
• a rising cost environment;
• a trend toward increasing consolidation in the retail trade andconsequent inventory reductions;
• changing consumer preferences;
• competitors with different profit objectives and less susceptibility tocurrency exchange rates; and
• consumer concerns about food safety, quality and health, includingconcerns about genetically modified organisms, trans-fatty acidsand obesity.
To confront these challenges, the Company continues to take stepsto build the value of its brands, to improve its food business portfoliowith new product and marketing initiatives, to reduce costs throughproductivity and to address consumer concerns about food safety,quality and health. In July 2003, the Company announced a rangeof initiatives addressing product nutrition, marketing practices,consumer information, and public advocacy and dialogue.
During 2003, several factors contributed to lower than anticipatedvolume growth. These factors included higher price gaps in somekey categories and countries, trade inventory reductions resultingfrom several customers experiencing financial difficulty, warehouseconsolidations, store closings and retailers’ stated initiatives toreduce working capital, as well as the combined adverse effectof global economic weakness. To improve volume and sharetrends, the Company increased spending behind certain businessesduring the second half of 2003 by approximately $200 million morethan had previously been planned. The Company also anticipates$500 million to $600 million of increased spending in 2004 over2003 across all its businesses.
In January 2004, the Company announced its adoption of a four-point plan to achieve sustainable growth. The first element of theplan is to build brand value by continuing to improve its products,to use more value-added packaging, to develop innovative newproducts, to effectively manage price gaps and to build closerrelationships with consumers.
The second element of the plan is to accelerate the shift in theCompany’s brand portfolio to address growing consumer demandfor products meeting their health and wellness concerns and theirdesire for convenience. The Company is reducing trans-fat in itsproducts, identifying its products that are low in carbohydrates,introducing more sugar-free products, and emphasizing positivenutrition products. The Company is addressing convenience needsby offering more convenient packaging, such as single-serve andresealable packaging, and products requiring reduced preparation.The Company is also offering packaging that is customized to suitthe needs of growing alternate channels of distribution such assupercenters, mass merchandisers, drugstores and club stores.The Company also plans to shift its portfolio to reflect changingdemographics, for example, by expanding the availability ofHispanic products and bilingual packaging.
The third component of the plan is to expand the Company’sglobal scale through international growth, particularly in developingmarkets. These markets account for 84% of the world’s populationand 30% of its packaged food consumption, but only 11% of theCompany’s net revenues. The plan calls for the Company to capturethe growth potential of its core categories in existing markets andto expand its core categories into new markets.
As the final component of its plan, the Company announced a three-year restructuring program with the objectives of leveraging theCompany’s global scale, realigning and lowering the cost structure,and optimizing capacity utilization. As part of this program, theCompany anticipates the exit or closing of up to twenty plants andthe elimination of approximately six thousand positions. Over thenext three years, the Company expects to incur up to $1.2 billion inpre-tax charges, reflecting asset disposals, severance and otherimplementation costs, including an estimated range of $750 millionto $800 million in 2004. Approximately one-half of the pre-tax
26
27
charges are expected to require cash payments. In addition, theCompany expects to spend approximately $140 million in capitalover the next three years to implement the program, includingapproximately $50 million in 2004. Cost savings as a result of thisprogram in 2004 are expected to be approximately $120 million to$140 million and are anticipated to reach annual cost savings ofapproximately $400 million by 2006, all of which are expected tobe used in supporting brand-building initiatives.
Fluctuations in commodity prices can lead to retail price volatilityand intensive price competition, and can influence consumer andtrade buying patterns. KFNA’s and KFI’s businesses are subjectto fluctuating commodity costs, including dairy, coffee and cocoacosts. In 2003, the Company’s commodity costs on average werehigher than those incurred in 2002 and adversely affected earnings.
The Company’s performance in 2003 was also affected by a risingcost environment, which is expected to continue. In particular,the Company experienced increased pension, medical, packagingand energy costs.
During 2003, the Company acquired a biscuits business in Egyptand trademarks associated with a small U.S.-based natural foodsbusiness. The total cost of these and other smaller acquisitions was$98 million. During 2002, the Company acquired a snacks businessin Turkey and a biscuits business in Australia. The total cost of theseand other smaller acquisitions was $122 million. During 2001, theCompany purchased coffee businesses in Romania, Morocco andBulgaria and also acquired confectionery businesses in Russia andPoland. The total cost of these and other smaller acquisitions was$194 million. The effects of these acquisitions were not material tothe Company’s consolidated financial position, results of operationsor cash flows in any of the periods presented.
During 2003, the Company sold a European rice business and abranded fresh cheese business in Italy. The aggregate proceedsreceived from sales of businesses were $96 million, on which theCompany recorded pre-tax gains of $31 million.
During 2002, the Company sold several small North American foodbusinesses, some of which were previously classified as businessesheld for sale. The net revenues and operating results of thebusinesses held for sale, which were not significant, were excludedfrom the Company’s consolidated statements of earnings, andno gain or loss was recognized on these sales. In addition, theCompany sold its Latin American yeast and industrial bakeryingredients business for $110 million and recorded a pre-tax gainof $69 million. The aggregate proceeds received from sales ofbusinesses during 2002 were $219 million, on which the Companyrecorded pre-tax gains of $80 million.
During 2001, the Company sold several small food businesses. Theaggregate proceeds received in these transactions were $21 million,on which the Company recorded pre-tax gains of $8 million.
The operating results of the businesses sold were not material to theCompany’s consolidated financial position, results of operations orcash flows in any of the periods presented.
In November 2003, the Company was advised by the Fort WorthDistrict Office of the Securities and Exchange Commission (“SEC”)that the staff is considering recommending that the SEC bring a civilinjunctive action against the Company charging it with aiding andabetting Fleming Companies (“Fleming”) in violations of the securitieslaws. District staff alleges that a Company employee, who received asimilar “Wells” notice, signed documents requested by Fleming,which Fleming used in order to accelerate its revenue recognition.The notice does not contain any allegations or statements regardingthe Company’s accounting for transactions with Fleming. TheCompany believes that it properly recorded the transactions inaccordance with U.S. GAAP. The Company has submitted aresponse to the staff indicating why it believes that no enforcementaction should be brought against it. The Company has cooperatedfully with the SEC with respect to this matter and the SEC’sinvestigation of Fleming.
Consolidated Operating Results
(in millions, except per share data)
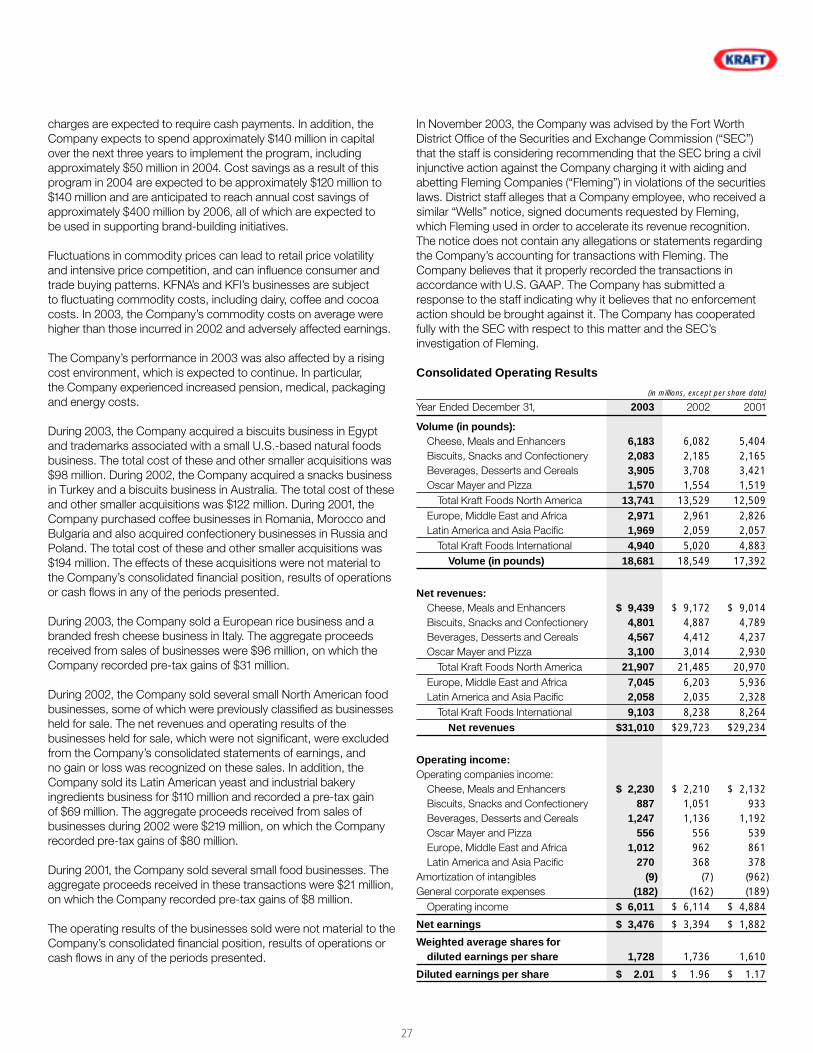
Year Ended December 31, 2003 2002 2001
Volume (in pounds):Cheese, Meals and Enhancers 6,183 6,082 5,404Biscuits, Snacks and Confectionery 2,083 2,185 2,165Beverages, Desserts and Cereals 3,905 3,708 3,421Oscar Mayer and Pizza 1,570 1,554 1,519
Total Kraft Foods North America 13,741 13,529 12,509Europe, Middle East and Africa 2,971 2,961 2,826Latin America and Asia Pacific 1,969 2,059 2,057
Total Kraft Foods International 4,940 5,020 4,883Volume (in pounds) 18,681 18,549 17,392
Net revenues:Cheese, Meals and Enhancers $ 9,439 $ 9,172 $ 9,014Biscuits, Snacks and Confectionery 4,801 4,887 4,789Beverages, Desserts and Cereals 4,567 4,412 4,237Oscar Mayer and Pizza 3,100 3,014 2,930
Total Kraft Foods North America 21,907 21,485 20,970Europe, Middle East and Africa 7,045 6,203 5,936Latin America and Asia Pacific 2,058 2,035 2,328
Total Kraft Foods International 9,103 8,238 8,264Net revenues $31,010 $29,723 $29,234
Operating income:Operating companies income:
Cheese, Meals and Enhancers $ 2,230 $ 2,210 $ 2,132Biscuits, Snacks and Confectionery 887 1,051 933Beverages, Desserts and Cereals 1,247 1,136 1,192Oscar Mayer and Pizza 556 556 539Europe, Middle East and Africa 1,012 962 861Latin America and Asia Pacific 270 368 378
Amortization of intangibles (9) (7) (962)General corporate expenses (182) (162) (189)
Operating income $ 6,011 $ 6,114 $ 4,884
Net earnings $ 3,476 $ 3,394 $ 1,882
Weighted average shares for diluted earnings per share 1,728 1,736 1,610
Diluted earnings per share $ 2.01 $ 1.96 $ 1.17
Kraft Foods Inc. Management’s Discussion and Analysis of Financial Condition and Results of Operations
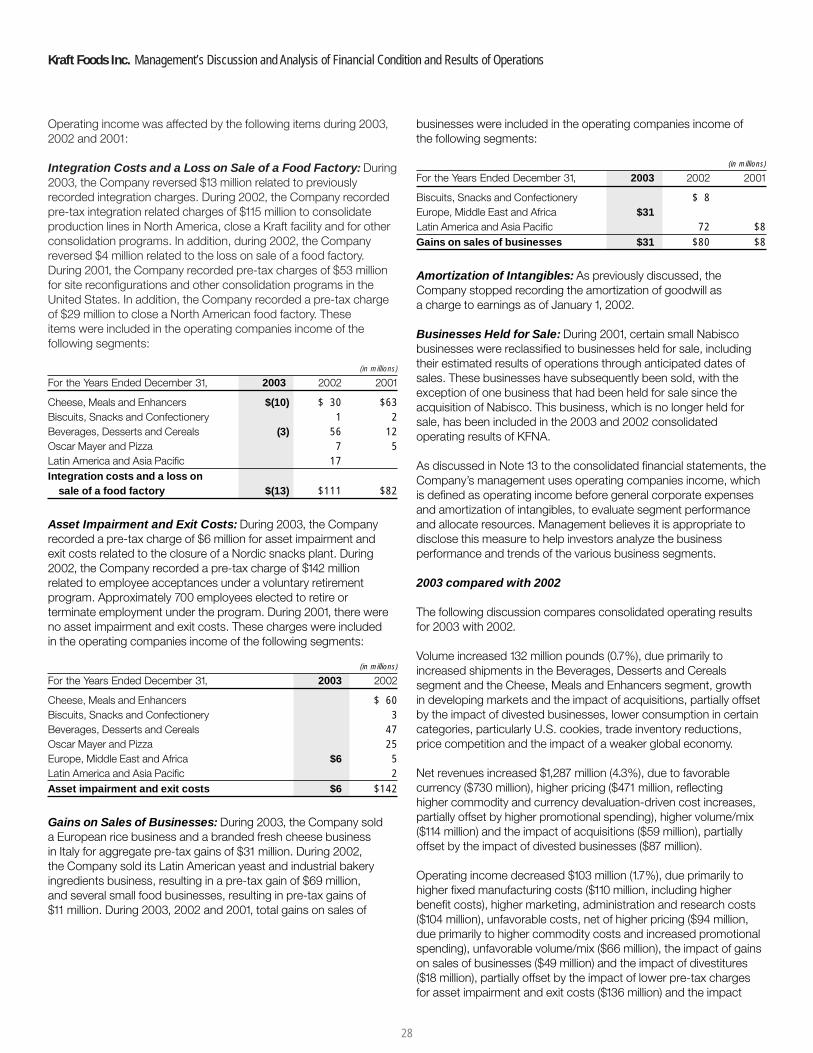
Operating income was affected by the following items during 2003,2002 and 2001:
Integration Costs and a Loss on Sale of a Food Factory: During2003, the Company reversed $13 million related to previouslyrecorded integration charges. During 2002, the Company recordedpre-tax integration related charges of $115 million to consolidateproduction lines in North America, close a Kraft facility and for otherconsolidation programs. In addition, during 2002, the Companyreversed $4 million related to the loss on sale of a food factory.During 2001, the Company recorded pre-tax charges of $53 millionfor site reconfigurations and other consolidation programs in theUnited States. In addition, the Company recorded a pre-tax chargeof $29 million to close a North American food factory. Theseitems were included in the operating companies income of thefollowing segments:
(in millions)
For the Years Ended December 31, 2003 2002 2001
Cheese, Meals and Enhancers $(10) $ 30 $63Biscuits, Snacks and Confectionery 1 2Beverages, Desserts and Cereals (3) 56 12Oscar Mayer and Pizza 7 5Latin America and Asia Pacific 17Integration costs and a loss on
sale of a food factory $(13) $111 $82
Asset Impairment and Exit Costs: During 2003, the Companyrecorded a pre-tax charge of $6 million for asset impairment andexit costs related to the closure of a Nordic snacks plant. During2002, the Company recorded a pre-tax charge of $142 millionrelated to employee acceptances under a voluntary retirementprogram. Approximately 700 employees elected to retire orterminate employment under the program. During 2001, there wereno asset impairment and exit costs. These charges were includedin the operating companies income of the following segments:
(in millions)
For the Years Ended December 31, 2003 2002
Cheese, Meals and Enhancers $ 60Biscuits, Snacks and Confectionery 3Beverages, Desserts and Cereals 47Oscar Mayer and Pizza 25Europe, Middle East and Africa $6 5Latin America and Asia Pacific 2Asset impairment and exit costs $6 $142
Gains on Sales of Businesses: During 2003, the Company solda European rice business and a branded fresh cheese businessin Italy for aggregate pre-tax gains of $31 million. During 2002,the Company sold its Latin American yeast and industrial bakeryingredients business, resulting in a pre-tax gain of $69 million,and several small food businesses, resulting in pre-tax gains of$11 million. During 2003, 2002 and 2001, total gains on sales of
businesses were included in the operating companies income ofthe following segments:
(in millions)
For the Years Ended December 31, 2003 2002 2001
Biscuits, Snacks and Confectionery $ 8Europe, Middle East and Africa $31Latin America and Asia Pacific 72 $8Gains on sales of businesses $31 $80 $8
Amortization of Intangibles: As previously discussed, theCompany stopped recording the amortization of goodwill asa charge to earnings as of January 1, 2002.
Businesses Held for Sale: During 2001, certain small Nabiscobusinesses were reclassified to businesses held for sale, includingtheir estimated results of operations through anticipated dates ofsales. These businesses have subsequently been sold, with theexception of one business that had been held for sale since theacquisition of Nabisco. This business, which is no longer held forsale, has been included in the 2003 and 2002 consolidatedoperating results of KFNA.
As discussed in Note 13 to the consolidated financial statements, theCompany’s management uses operating companies income, whichis defined as operating income before general corporate expensesand amortization of intangibles, to evaluate segment performanceand allocate resources. Management believes it is appropriate todisclose this measure to help investors analyze the businessperformance and trends of the various business segments.
2003 compared with 2002
The following discussion compares consolidated operating resultsfor 2003 with 2002.
Volume increased 132 million pounds (0.7%), due primarily toincreased shipments in the Beverages, Desserts and Cerealssegment and the Cheese, Meals and Enhancers segment, growthin developing markets and the impact of acquisitions, partially offsetby the impact of divested businesses, lower consumption in certaincategories, particularly U.S. cookies, trade inventory reductions,price competition and the impact of a weaker global economy.
Net revenues increased $1,287 million (4.3%), due to favorablecurrency ($730 million), higher pricing ($471 million, reflectinghigher commodity and currency devaluation-driven cost increases,partially offset by higher promotional spending), higher volume/mix($114 million) and the impact of acquisitions ($59 million), partiallyoffset by the impact of divested businesses ($87 million).
Operating income decreased $103 million (1.7%), due primarily tohigher fixed manufacturing costs ($110 million, including higherbenefit costs), higher marketing, administration and research costs($104 million), unfavorable costs, net of higher pricing ($94 million,due primarily to higher commodity costs and increased promotionalspending), unfavorable volume/mix ($66 million), the impact of gainson sales of businesses ($49 million) and the impact of divestitures($18 million), partially offset by the impact of lower pre-tax chargesfor asset impairment and exit costs ($136 million) and the impact
28

from integration costs and a loss on sale of a food factory ($124 mil-lion) and favorable currency ($94 million). The higher benefit costswere primarily related to pension and stock compensation costs.
Currency movements increased net revenues by $730 million andoperating income by $94 million. These increases were due primarilyto the further weakening of the U.S. dollar against the euro, theCanadian dollar and other currencies, partially offset by the strengthof the U.S. dollar against certain Latin American currencies.
Interest and other debt expense, net, decreased $182 million. Thisdecrease is due to the Company’s refinancing of notes payable toAltria Group, Inc. and the use of free cash flow to pay down debt.
The Company’s reported effective tax rate decreased by 0.6percentage points to 34.9%, due primarily to rate differences fromforeign operations.
Net earnings of $3,476 million increased $82 million (2.4%), dueprimarily to lower interest expense and a lower effective tax rate,partially offset by lower operating income. Diluted and basic earningsper share (“EPS”), which were both $2.01, increased by 2.6%.
2002 compared with 2001
The following discussion compares consolidated operating resultsfor 2002 with 2001.
Volume increased 1,157 million pounds (6.7%), due primarily to theinclusion in 2002 of a business previously considered held for sale,new product introductions, geographic expansion and acquisitions.
Net revenues increased $489 million (1.7%), due primarily to highervolume/mix ($401 million), the inclusion in 2002 of a businesspreviously considered held for sale ($252 million) and the impact ofacquisitions ($191 million), partially offset by the adverse effect ofcurrency exchange rates ($291 million) and lower sales prices oncheese and coffee products (driven by commodity-related declines).
Operating income increased $1,230 million (25.2%), due primarilyto the elimination of substantially all goodwill amortization, volumegrowth and favorable margins.
Currency movements decreased net revenues by $291 million andoperating income by $4 million. These decreases in net revenuesand operating income were due primarily to the strength of theU.S. dollar against certain Latin American currencies, partiallyoffset by the weakness of the U.S. dollar against the euro andother currencies.
Interest and other debt expense, net, decreased $590 million. Thisdecrease was due primarily to lower debt levels after the repaymentof Nabisco acquisition borrowings with the proceeds from theCompany’s IPO, as well as the Company’s refinancing of notespayable to Altria Group, Inc. and lower short-term interest rates.
The Company’s effective tax rate decreased by 9.9 percentagepoints to 35.5%, due primarily to the adoption of SFAS No. 141 andSFAS No. 142, under which the Company is no longer required toamortize goodwill as a charge to earnings.
Net earnings of $3,394 million increased $1,512 million (80.3%), dueprimarily to growth in operating income and lower interest expense.Diluted and basic EPS, which were both $1.96, increased by 67.5%.
Operating Results by Reportable Segment
Kraft Foods North America
(in millions)
For the Years Ended December 31, 2003 2002 2001
Volume (in pounds):Cheese, Meals and Enhancers 6,183 6,082 5,404Biscuits, Snacks and Confectionery 2,083 2,185 2,165Beverages, Desserts and Cereals 3,905 3,708 3,421Oscar Mayer and Pizza 1,570 1,554 1,519
Volume (in pounds) 13,741 13,529 12,509
Net revenues:Cheese, Meals and Enhancers $ 9,439 $ 9,172 $ 9,014Biscuits, Snacks and Confectionery 4,801 4,887 4,789Beverages, Desserts and Cereals 4,567 4,412 4,237Oscar Mayer and Pizza 3,100 3,014 2,930
Net revenues $21,907 $21,485 $20,970
Operating companies income:Cheese, Meals and Enhancers $ 2,230 $ 2,210 $ 2,132Biscuits, Snacks and Confectionery 887 1,051 933Beverages, Desserts and Cereals 1,247 1,136 1,192Oscar Mayer and Pizza 556 556 539
Operating companies income $ 4,920 $ 4,953 $ 4,796
2003 compared with 2002
The following discussion compares KFNA’s operating results for2003 with 2002.
During the first quarter of 2003, the Company transferredmanagement responsibility of its Canadian Biscuits and Pet Snacksoperations from the Biscuits, Snacks and Confectionery segment tothe Cheese, Meals and Enhancers segment, which contains theCompany’s other Canadian businesses. Accordingly, all prior periodamounts have been reclassified to reflect the transfer.
Volume increased 1.6%, due primarily to contributions from newproducts and increased shipments in the Beverages, Desserts andCereals segment and the Cheese, Meals and Enhancers segment,partially offset by the divestiture of a small confectionery business in2002, consumption weakness in certain categories, primarilycookies, and trade inventory reductions.
29
Kraft Foods Inc. Management’s Discussion and Analysis of Financial Condition and Results of Operations
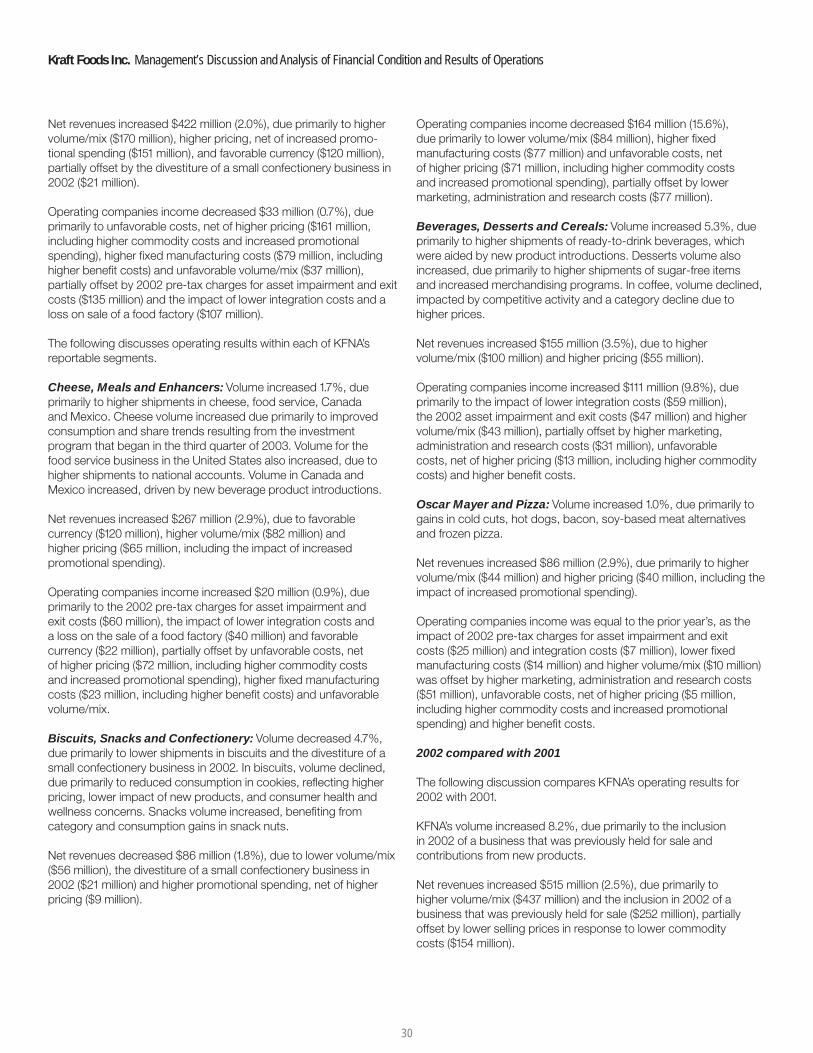
Net revenues increased $422 million (2.0%), due primarily to highervolume/mix ($170 million), higher pricing, net of increased promo-tional spending ($151 million), and favorable currency ($120 million),partially offset by the divestiture of a small confectionery business in2002 ($21 million).
Operating companies income decreased $33 million (0.7%), dueprimarily to unfavorable costs, net of higher pricing ($161 million,including higher commodity costs and increased promotionalspending), higher fixed manufacturing costs ($79 million, includinghigher benefit costs) and unfavorable volume/mix ($37 million),partially offset by 2002 pre-tax charges for asset impairment and exitcosts ($135 million) and the impact of lower integration costs and aloss on sale of a food factory ($107 million).
The following discusses operating results within each of KFNA’sreportable segments.
Cheese, Meals and Enhancers: Volume increased 1.7%, dueprimarily to higher shipments in cheese, food service, Canadaand Mexico. Cheese volume increased due primarily to improvedconsumption and share trends resulting from the investmentprogram that began in the third quarter of 2003. Volume for thefood service business in the United States also increased, due tohigher shipments to national accounts. Volume in Canada andMexico increased, driven by new beverage product introductions.
Net revenues increased $267 million (2.9%), due to favorablecurrency ($120 million), higher volume/mix ($82 million) andhigher pricing ($65 million, including the impact of increasedpromotional spending).
Operating companies income increased $20 million (0.9%), dueprimarily to the 2002 pre-tax charges for asset impairment andexit costs ($60 million), the impact of lower integration costs anda loss on the sale of a food factory ($40 million) and favorablecurrency ($22 million), partially offset by unfavorable costs, netof higher pricing ($72 million, including higher commodity costsand increased promotional spending), higher fixed manufacturingcosts ($23 million, including higher benefit costs) and unfavorablevolume/mix.
Biscuits, Snacks and Confectionery: Volume decreased 4.7%,due primarily to lower shipments in biscuits and the divestiture of asmall confectionery business in 2002. In biscuits, volume declined,due primarily to reduced consumption in cookies, reflecting higherpricing, lower impact of new products, and consumer health andwellness concerns. Snacks volume increased, benefiting fromcategory and consumption gains in snack nuts.
Net revenues decreased $86 million (1.8%), due to lower volume/mix($56 million), the divestiture of a small confectionery business in2002 ($21 million) and higher promotional spending, net of higherpricing ($9 million).
Operating companies income decreased $164 million (15.6%),due primarily to lower volume/mix ($84 million), higher fixedmanufacturing costs ($77 million) and unfavorable costs, netof higher pricing ($71 million, including higher commodity costsand increased promotional spending), partially offset by lowermarketing, administration and research costs ($77 million).
Beverages, Desserts and Cereals: Volume increased 5.3%, dueprimarily to higher shipments of ready-to-drink beverages, whichwere aided by new product introductions. Desserts volume alsoincreased, due primarily to higher shipments of sugar-free itemsand increased merchandising programs. In coffee, volume declined,impacted by competitive activity and a category decline due tohigher prices.
Net revenues increased $155 million (3.5%), due to highervolume/mix ($100 million) and higher pricing ($55 million).
Operating companies income increased $111 million (9.8%), dueprimarily to the impact of lower integration costs ($59 million),the 2002 asset impairment and exit costs ($47 million) and highervolume/mix ($43 million), partially offset by higher marketing,administration and research costs ($31 million), unfavorablecosts, net of higher pricing ($13 million, including higher commoditycosts) and higher benefit costs.
Oscar Mayer and Pizza: Volume increased 1.0%, due primarily togains in cold cuts, hot dogs, bacon, soy-based meat alternativesand frozen pizza.
Net revenues increased $86 million (2.9%), due primarily to highervolume/mix ($44 million) and higher pricing ($40 million, including theimpact of increased promotional spending).
Operating companies income was equal to the prior year’s, as theimpact of 2002 pre-tax charges for asset impairment and exitcosts ($25 million) and integration costs ($7 million), lower fixedmanufacturing costs ($14 million) and higher volume/mix ($10 million)was offset by higher marketing, administration and research costs($51 million), unfavorable costs, net of higher pricing ($5 million,including higher commodity costs and increased promotionalspending) and higher benefit costs.
2002 compared with 2001
The following discussion compares KFNA’s operating results for2002 with 2001.
KFNA’s volume increased 8.2%, due primarily to the inclusionin 2002 of a business that was previously held for sale andcontributions from new products.
Net revenues increased $515 million (2.5%), due primarily tohigher volume/mix ($437 million) and the inclusion in 2002 of abusiness that was previously held for sale ($252 million), partiallyoffset by lower selling prices in response to lower commoditycosts ($154 million).
30
Operating companies income increased $157 million (3.3%), dueprimarily to higher volume/mix ($174 million), favorable margins($176 million, driven by lower commodity-related costs andproductivity) and Nabisco synergy savings, partially offset byhigher benefit expense, including the 2002 charge for assetimpairment and exit costs ($135 million).
The following discusses operating results within each of KFNA’sreportable segments.
Cheese, Meals and Enhancers: Volume increased 12.5%, dueprimarily to the inclusion in 2002 of a business that was previouslyheld for sale and volume gains in enhancers, meals and foodservice, partially offset by a decline in cheese. Volume gains inenhancers and meals were led by Kraft pourable dressings,barbecue sauce, macaroni & cheese dinners and the 2001acquisition of It’s Pasta Anytime. In cheese, volume declined aslower dairy costs resulted in aggressive competitive activity byprivate label manufacturers as they reduced prices and increasedmerchandising levels.
Net revenues increased $158 million (1.8%), due primarily to theinclusion in 2002 of a business that was previously held for sale($252 million) and higher volume/mix ($34 million), partially offsetby lower net pricing ($118 million, primarily related to lower dairycommodity costs).
Operating companies income increased $78 million (3.7%), dueprimarily to favorable margins ($63 million, due primarily to lowercheese commodity costs and productivity savings), lower integrationrelated costs in 2002 ($33 million), higher volume/mix ($31 million)and the inclusion in 2002 of a business that was previously heldfor sale ($23 million), partially offset by higher benefit expenses,including the 2002 charge for asset impairment and exit costs($60 million).
Biscuits, Snacks and Confectionery: Volume increased 0.9%,as volume gains in biscuits and snacks were partially offset by adecline in confectionery shipments. In biscuits, volume increased,driven by new product initiatives in both cookies and crackers.In snacks, volume also increased, due primarily to promotionalinitiatives. Confectionery volume declined, resulting primarily fromcompetitive activity in the breath-freshening category, partiallyoffset by new product introductions in the non-chocolateconfectionery business.
Net revenues increased $98 million (2.0%), due primarily to highervolume/mix ($61 million) and higher net pricing ($35 million).
Operating companies income increased $118 million (12.6%), dueprimarily to favorable margins ($81 million, due primarily to highernet pricing and lower commodity costs for nuts), Nabisco synergysavings and higher volume/mix.
Beverages, Desserts and Cereals: Volume increased 8.4%, dueprimarily to growth in ready-to-drink beverages. In coffee, volumeincreased, driven by merchandising programs and packaginginnovation. In the desserts business, volume increases were ledby dry packaged desserts and frozen toppings, which benefitedfrom holiday programs, and in ready-to-eat desserts, aided bynew products.
Net revenues increased $175 million (4.1%), due primarily to highervolume/mix ($245 million), partially offset by lower net pricing($58 million).
Operating companies income decreased $56 million (4.7%), primarily reflecting the 2002 charge for asset impairment and exitcosts ($47 million), higher integration-related costs ($44 million),higher marketing, administration and research costs ($36 million,including higher benefit costs) and lower margins ($18 million),partially offset by higher volume/mix ($98 million) and productivitysavings.
Oscar Mayer and Pizza: Volume increased 2.3%, due to volumegains in processed meats and pizza. The increase in processedmeats was driven by gains in hot dogs, bacon and soy-based meatalternatives, aided by new product introductions. The pizza businessalso benefited from new products.
Net revenues increased $84 million (2.9%), due to higher volume/mix($97 million), partially offset by lower net pricing ($13 million).
Operating companies income increased $17 million (3.2%), primarilyreflecting favorable costs ($50 million, due primarily to lower meatand cheese commodity costs and productivity savings) and highervolume/mix ($30 million), partially offset by the 2002 charge for assetimpairment and exit costs ($25 million), higher marketing,administration and research costs ($24 million, including higherbenefit costs) and higher manufacturing costs.
Kraft Foods International
(in millions)
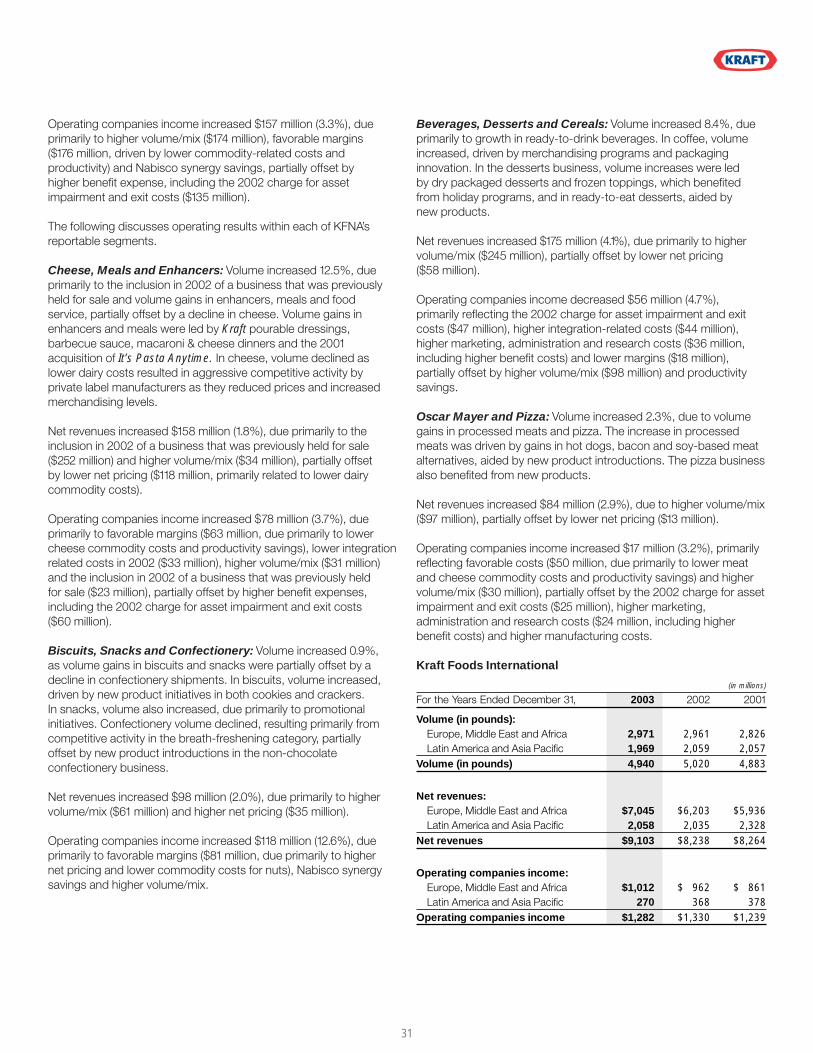
For the Years Ended December 31, 2003 2002 2001
Volume (in pounds):Europe, Middle East and Africa 2,971 2,961 2,826Latin America and Asia Pacific 1,969 2,059 2,057
Volume (in pounds) 4,940 5,020 4,883
Net revenues:Europe, Middle East and Africa $7,045 $6,203 $5,936Latin America and Asia Pacific 2,058 2,035 2,328
Net revenues $9,103 $8,238 $8,264
Operating companies income:Europe, Middle East and Africa $1,012 $ 962 $ 861Latin America and Asia Pacific 270 368 378
Operating companies income $1,282 $1,330 $1,239
31
Kraft Foods Inc. Management’s Discussion and Analysis of Financial Condition and Results of Operations
2003 compared with 2002The following discussion compares KFI’s operating results for 2003with 2002.
Volume decreased 1.6%, due to the divestiture of a Latin Americanbakery ingredients business in 2002 and a rice business and abranded fresh cheese business in Europe in 2003, the impactof price competition, particularly in Germany and France, and theadverse impact of a summer heat wave across Europe on thechocolate and coffee businesses. These declines were partiallyoffset by growth in developing markets, including Russia, Braziland China, and the acquisitions of a snacks business in Turkeyand a biscuits business in Egypt.
Net revenues increased $865 million (10.5%), due to favorablecurrency ($610 million), higher pricing ($320 million, reflecting highercommodity and currency devaluation-driven cost increases in LatinAmerica) and the impact of acquisitions ($57 million), partially offsetby the impact of divestitures ($66 million) and lower volume/mix($56 million).
Operating companies income decreased $48 million (3.6%), dueprimarily to higher marketing, administration and research costs ($98million, including higher benefit costs and infrastructure investmentin developing markets), the net impact of lower gains on sales ofbusinesses ($41 million), lower volume/mix ($29 million) and theimpact of divestitures ($13 million), partially offset by favorablecurrency ($72 million), higher pricing, net of cost increases ($36million, including fixed manufacturing costs), the 2002 pre-taxcharges for integration costs ($17 million) and the impact ofacquisitions ($7 million).
The following discusses operating results within each of KFI’sreportable segments.
Europe, Middle East and Africa: Volume increased 0.3%, dueto volume growth in the Central and Eastern Europe, Middle Eastand Africa region, which benefited from the acquisition of a biscuitsbusiness in Egypt in 2003 as well as a snacks business acquisition inTurkey during the third quarter of 2002, and new productintroductions. These gains were partially offset by the impact ofthe summer heat wave across Europe on the chocolate and coffeebusinesses, price competition in Germany and France, and thedivestiture of a rice business and a branded fresh cheese businessin Europe in 2003. In snacks, volume increased in biscuits andsalted snacks, benefiting from acquisitions, partially offset by lowerconfectionery volume due to the summer heat wave across Europeand price competition. In beverages, volume declined, due primarilyto the summer heat wave across Europe (which had an adverseimpact on coffee shipments) and price competition. These declineswere partially offset by increased coffee shipments in Russia,benefiting from expanded distribution, and Poland, aided by newproduct introductions. Convenient meals volume also declined, due
to the divestiture of a rice business in Europe, partially offset byhigher shipments of canned meats in Italy. Cheese volume declined,due primarily to the impact of price competition in Germany andSpain, partially offset by gains in cream cheese in Italy.
Net revenues increased $842 million (13.6%), due primarily tofavorable currency ($808 million), the impact of acquisitions($57 million) and higher pricing ($18 million), partially offset byunfavorable volume/mix ($43 million).
Operating companies income increased $50 million (5.2%), dueprimarily to favorable currency ($100 million) and the gain on the saleof a rice business and a branded fresh cheese business in Europe($31 million), partially offset by unfavorable costs, net of higherpricing ($39 million, including higher commodity costs and increasedpromotional spending), unfavorable volume/mix ($28 million) andhigher marketing, administration and research costs ($17 million,including higher benefit costs and infrastructure investment ineastern Europe).
Latin America and Asia Pacific: Volume decreased 4.4%, due tothe divestiture of a Latin American bakery ingredients business in2002, partially offset by growth in Argentina, Brazil, China andAustralia. In grocery, volume declined in Latin America, due primarilyto the sale of a bakery ingredients business in the fourth quarter of2002. In beverages, volume increased, due primarily to growth inBrazil, Venezuela and China, aided by new product introductions.Snacks volume also increased, as biscuits volume growth in Brazil,Argentina, China and Australia, aided by new product introductions,was partially offset by a decline in confectionery, which wasimpacted by economic weakness, trade inventory reductions andprice competition in Brazil. In cheese, volume increased, due tohigher shipments in Asia Pacific, benefiting from new products inAustralia and promotional programs in the Philippines, partially offsetby declines in Latin America. In convenient meals, volume grew,benefiting from gains in Argentina.
Net revenues increased $23 million (1.1%), due to higher pricing ($302 million, reflecting higher commodity and currency devaluation-driven costs), partially offset by unfavorable currency($198 million), the divestiture of a Latin American bakery ingredientsbusiness in 2002 ($68 million) and lower volume/mix ($13 million).
Operating companies income decreased $98 million (26.6%), dueprimarily to higher marketing, administration and research costs($81 million), gains on sales of businesses in 2002 ($72 million),unfavorable currency ($28 million) and the divestiture of a LatinAmerican bakery ingredients business in 2002 ($10 million), partiallyoffset by higher pricing, net of cost increases ($75 million) and the2002 pre-tax charges for integration costs ($17 million).
32

2002 compared with 2001
The following discussion compares KFI’s operating results for 2002with 2001.
KFI’s volume increased 2.8% due primarily to acquisitions, newproduct introductions, geographic expansion and marketingprograms. This increase in volume was partially offset by the impactof economic weakness in several Latin American countries and theimpact of businesses sold.
Net revenues decreased $26 million (0.3%), due primarily tounfavorable currency movements ($271 million), lower volume/mix($36 million) and revenues of divested businesses ($22 million),partially offset by the impact of acquisitions ($181 million) and highernet pricing ($122 million).
Operating companies income increased $91 million (7.3%), dueprimarily to gains on sales of businesses ($64 million), favorablemargins ($37 million, including productivity savings), lowermarketing, administration and research costs ($23 million, includingsynergy savings) and the impact of acquisitions ($18 million), partiallyoffset by lower volume/mix ($19 million), 2002 integration costs($17 million) and income of divested businesses ($8 million).
The following discusses operating results within each of KFI’sreportable segments.
Europe, Middle East and Africa: Volume increased 4.8%, drivenby acquisitions and volume growth across most markets includingItaly, the United Kingdom, Sweden, the Ukraine, the Middle Eastand Poland, partially offset by declines in Germany and Romania.Snacks volume increased, benefiting from confectionery acquisitionsin Russia and Poland, a snacks acquisition in Turkey and newproduct introductions across the segment. Snacks volume growthwas moderated by a decline in Germany, reflecting aggressivecompetitive activity, and in Romania, due to lower consumerpurchasing power. In beverages, volume increased in both coffeeand refreshment beverages. Coffee volume grew in most markets,driven by new product introductions, and acquisitions in Romania,Morocco and Bulgaria. In Germany, coffee volume decreased,reflecting market softness and increased price competition.Refreshment beverages volume also increased, driven by thegeographic expansion of powdered beverages and new productintroductions. Cheese volume increased with gains in Philadelphiacream cheese, benefiting from advertising and new productintroductions. In convenient meals, volume increased, due primarilyto higher canned meats volume in Italy against a weak comparisonin 2001, and new product introductions of lunch combinations inthe United Kingdom.
Net revenues increased $267 million (4.5%), due primarily tofavorable currency movements ($197 million), the acquisitions ofcoffee, confectionery and snacks businesses ($147 million) andhigher volume/mix ($22 million), partially offset by lower netpricing ($99 million, due primarily to commodity-driven coffeeprice declines).
Operating companies income increased $101 million (11.7%), dueprimarily to favorable margins ($42 million), favorable currencymovements ($37 million), higher volume/mix ($19 million) andacquisitions ($16 million), partially offset by higher marketing,administration and research costs.
Latin America and Asia Pacific: Volume increased slightly, asthe acquisition of a biscuits business in Australia and gains acrossnumerous markets were partially offset by a volume decline inArgentina due to economic weakness, lower results in China andthe impact of businesses sold. In snacks, volume growth wasdriven by gains in biscuits, benefiting from geographic expansion ofcookies and crackers in Latin America, new product introductionsand the acquisition of a biscuits business in Australia. Snacksvolume growth was partially offset by the negative impact of thecontinued economic weakness in Argentina and distributor inventoryreductions in China. Beverages volume also increased, due primarilyto growth in powdered beverages in numerous markets acrossLatin America and Asia Pacific, which benefited from new productintroductions. In grocery, volume declined in both Latin Americaand Asia Pacific.
Net revenues decreased $293 million (12.6%), due primarily tounfavorable currency movements ($468 million), lower volume/mix($58 million) and revenues from divested businesses ($22 million),partially offset by higher net pricing ($221 million) and the 2002acquisition of a biscuits business in Australia ($34 million).
Operating companies income decreased $10 million (2.6%), dueprimarily to lower volume/mix ($38 million), unfavorable currencymovements ($37 million), 2002 integration costs ($17 million) andthe operating companies income of disposed businesses, partiallyoffset by gains on sales of businesses ($64 million) and lowermarketing, administration and research costs ($31 million, includingsynergy savings).
Financial Review
Net Cash Provided by Operating Activities
Net cash provided by operating activities was $4.1 billion in 2003,$3.7 billion in 2002 and $3.3 billion in 2001. The increase in 2003operating cash flows over 2002 was due primarily to a lower use ofcash to fund working capital, partially offset by increased pensioncontributions. The increase in 2002 operating cash flows over 2001primarily reflected cash flow from increased net earnings.
Net Cash Used in Investing Activities
One element of the growth strategy of the Company is tostrengthen its brand portfolios through disciplined programs ofselective acquisitions and divestitures. The Company is constantlyinvestigating potential acquisition candidates and from time totime sells businesses that are outside its core categories or thatdo not meet its growth or profitability targets.
33
Kraft Foods Inc. Management’s Discussion and Analysis of Financial Condition and Results of Operations
During 2003, 2002 and 2001, net cash used in investing activitieswas $1.0 billion, $1.1 billion and $1.2 billion, respectively. The decrease in 2003 primarily reflected lower capital expendituresand lower purchases of businesses, partially offset by the reductionin the cash received from the sales of businesses. The decreasein 2002 primarily reflected lower purchases of businesses andan increase in the cash received from the sales of businesses,partially offset by higher capital expenditures related to theintegration of Nabisco.
Capital expenditures, which were funded by operating activities,were $1.1 billion, $1.2 billion and $1.1 billion in 2003, 2002 and 2001,respectively. The capital expenditures were primarily to modernizemanufacturing facilities, lower cost of production and expandproduction capacity for growing product lines. In 2004, capitalexpenditures are currently expected to be at or slightly above2003 expenditures, including capital expenditures required forthe restructuring program announced in January 2004. Theseexpenditures are expected to be funded from operations.
Net Cash Used in Financing Activities
During 2003, net cash of $2.8 billion was used in financing activities,compared with $2.6 billion during 2002. The increase in cash used in2003 was due primarily to an increase in the Company’s Class Ashare repurchases and an increase in dividend payments, partiallyoffset by a decrease in net debt repayments in 2003 (includingamounts due to Altria Group, Inc. and affiliates). During 2003, theCompany issued $1.5 billion of third-party long-term debt, the netproceeds of which were used to repay outstanding related partyindebtedness. Financing activities included net debt repaymentsof approximately $1.4 billion in 2003.
During 2002, net cash of $2.6 billion was used in financing activities,compared with $2.1 billion during 2001. The increase in cash usedwas due primarily to dividends paid during 2002 and repurchases ofthe Company’s Class A common stock. During 2002, Kraft issued$2.5 billion of global bonds and $750 million of floating rate notes,the net proceeds of which were used to repay outstanding relatedparty indebtedness. Financing activities included net debtrepayments of approximately $1.5 billion in 2002.
Debt and Liquidity
Financial Reporting Release No. 61 sets forth the views of theSecurities and Exchange Commission (“SEC”) regarding enhanceddisclosures relating to liquidity and capital resources. Theinformation provided below about the Company’s debt, creditfacilities, guarantees and future commitments is included here tofacilitate a review of the Company’s liquidity.
Debt: The Company’s total debt, including amounts due to AltriaGroup, Inc. and affiliates, was $13.5 billion at December 31, 2003and $14.4 billion at December 31, 2002. The decrease in total debt isdue primarily to the repayment of amounts due to Altria Group, Inc.and affiliates, partially offset by an increase in third-party borrowings.The Company’s debt-to-equity ratio was 0.47 at December 31, 2003and 0.56 at December 31, 2002.
During 2003, the Company repaid the remaining $1,150 million of the7.0% long-term notes payable to Altria Group, Inc. and affiliates, aswell as the $1,410 million of short-term borrowings reclassified tolong-term. In September 2003, Kraft issued $1.5 billion of third-partylong-term debt, including $700 million of 5-year notes bearinginterest at a rate of 4.0% and $800 million of 10-year notes bearinginterest at 5.25%. The net proceeds from the offering were usedto repay outstanding related party indebtedness. At December 31,2003 and 2002, the Company had short-term amounts payableto Altria Group, Inc. of $543 million and $895 million, respectively.Interest on these borrowings is based on the applicable LondonInterbank Offered Rate.
Credit Ratings: Following a $10.1 billion judgment on March 21,2003 against Altria Group, Inc.’s domestic tobacco subsidiary,Philip Morris USA Inc., the three major credit rating agencies took aseries of ratings actions resulting in the lowering of the Company’sshort-term and long-term debt ratings, despite the fact theCompany is neither a party to, nor has exposure to, this litigation.Moody’s lowered the Company’s short-term debt rating from “P-1”to “P-2” and its long-term debt rating from “A2” to “A3,” with stableoutlook. Standard & Poor’s lowered the Company’s short-term debtrating from “A-1” to “A-2” and its long-term debt rating from “A-” to“BBB+,” with stable outlook. Fitch Rating Services lowered theCompany’s short-term debt rating from “F-1” to “F-2” and its long-term debt rating from “A” to “BBB+,” with stable outlook. As a resultof the credit rating agencies’ actions, the Company temporarilylost access to the commercial paper market, and borrowing costsincreased. None of the Company’s debt agreements requiresaccelerated repayment in the event of a decrease in credit ratings.
Credit Lines: The Company maintains revolving credit facilities thathave historically been used to support the issuance of commercialpaper. At December 31, 2003, credit lines for the Company and therelated activity were as follows:
(in billions of dollars)
CommercialCredit Amount Paper
Type Lines Drawn Outstanding
364-day (expires July 2004) $2.5 $— $0.3Multi-year (expires July 2006) 2.0 1.9
$4.5 $— $2.2
34
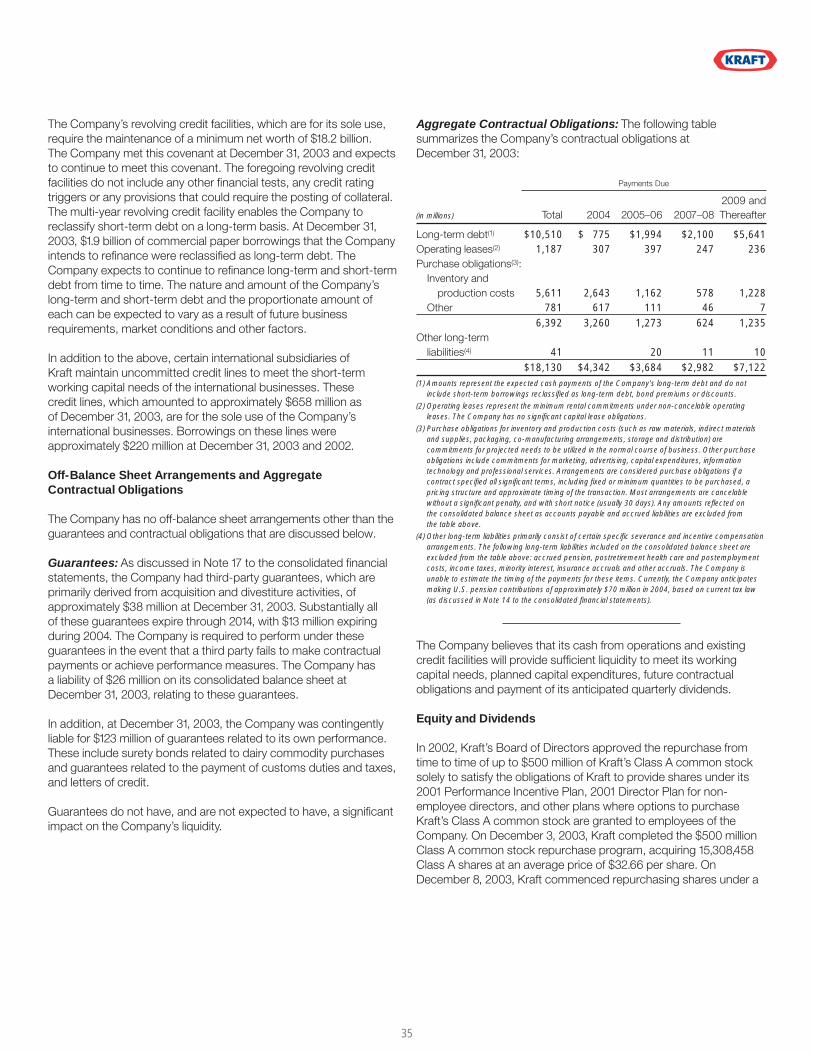
The Company’s revolving credit facilities, which are for its sole use,require the maintenance of a minimum net worth of $18.2 billion.The Company met this covenant at December 31, 2003 and expectsto continue to meet this covenant. The foregoing revolving creditfacilities do not include any other financial tests, any credit ratingtriggers or any provisions that could require the posting of collateral.The multi-year revolving credit facility enables the Company toreclassify short-term debt on a long-term basis. At December 31,2003, $1.9 billion of commercial paper borrowings that the Companyintends to refinance were reclassified as long-term debt. TheCompany expects to continue to refinance long-term and short-termdebt from time to time. The nature and amount of the Company’slong-term and short-term debt and the proportionate amount ofeach can be expected to vary as a result of future businessrequirements, market conditions and other factors.
In addition to the above, certain international subsidiaries ofKraft maintain uncommitted credit lines to meet the short-termworking capital needs of the international businesses. Thesecredit lines, which amounted to approximately $658 million asof December 31, 2003, are for the sole use of the Company’sinternational businesses. Borrowings on these lines wereapproximately $220 million at December 31, 2003 and 2002.
Off-Balance Sheet Arrangements and AggregateContractual Obligations
The Company has no off-balance sheet arrangements other than theguarantees and contractual obligations that are discussed below.
Guarantees: As discussed in Note 17 to the consolidated financialstatements, the Company had third-party guarantees, which areprimarily derived from acquisition and divestiture activities, ofapproximately $38 million at December 31, 2003. Substantially allof these guarantees expire through 2014, with $13 million expiringduring 2004. The Company is required to perform under theseguarantees in the event that a third party fails to make contractualpayments or achieve performance measures. The Company hasa liability of $26 million on its consolidated balance sheet atDecember 31, 2003, relating to these guarantees.
In addition, at December 31, 2003, the Company was contingentlyliable for $123 million of guarantees related to its own performance.These include surety bonds related to dairy commodity purchasesand guarantees related to the payment of customs duties and taxes,and letters of credit.
Guarantees do not have, and are not expected to have, a significantimpact on the Company’s liquidity.
Aggregate Contractual Obligations: The following tablesummarizes the Company’s contractual obligations at December 31, 2003:
Payments Due
2009 and(in millions) Total 2004 2005–06 2007–08 Thereafter
Long-term debt(1) $10,510 $ 775 $1,994 $2,100 $5,641Operating leases(2) 1,187 307 397 247 236Purchase obligations(3):
Inventory and production costs 5,611 2,643 1,162 578 1,228
Other 781 617 111 46 76,392 3,260 1,273 624 1,235
Other long-term liabilities(4) 41 20 11 10
$18,130 $4,342 $3,684 $2,982 $7,122(1) Amounts represent the expected cash payments of the Company’s long-term debt and do not
include short-term borrowings reclassified as long-term debt, bond premiums or discounts.
(2) Operating leases represent the minimum rental commitments under non-cancelable operatingleases. The Company has no significant capital lease obligations.
(3) Purchase obligations for inventory and production costs (such as raw materials, indirect materialsand supplies, packaging, co-manufacturing arrangements, storage and distribution) arecommitments for projected needs to be utilized in the normal course of business. Other purchaseobligations include commitments for marketing, advertising, capital expenditures, informationtechnology and professional services. Arrangements are considered purchase obligations if acontract specified all significant terms, including fixed or minimum quantities to be purchased, apricing structure and approximate timing of the transaction. Most arrangements are cancelablewithout a significant penalty, and with short notice (usually 30 days). Any amounts reflected onthe consolidated balance sheet as accounts payable and accrued liabilities are excluded fromthe table above.
(4) Other long-term liabilities primarily consist of certain specific severance and incentive compensationarrangements. The following long-term liabilities included on the consolidated balance sheet areexcluded from the table above: accrued pension, postretirement health care and postemploymentcosts, income taxes, minority interest, insurance accruals and other accruals. The Company isunable to estimate the timing of the payments for these items. Currently, the Company anticipatesmaking U.S. pension contributions of approximately $70 million in 2004, based on current tax law(as discussed in Note 14 to the consolidated financial statements).
The Company believes that its cash from operations and existingcredit facilities will provide sufficient liquidity to meet its workingcapital needs, planned capital expenditures, future contractualobligations and payment of its anticipated quarterly dividends.
Equity and Dividends
In 2002, Kraft’s Board of Directors approved the repurchase fromtime to time of up to $500 million of Kraft’s Class A common stocksolely to satisfy the obligations of Kraft to provide shares under its2001 Performance Incentive Plan, 2001 Director Plan for non-employee directors, and other plans where options to purchaseKraft’s Class A common stock are granted to employees of theCompany. On December 3, 2003, Kraft completed the $500 millionClass A common stock repurchase program, acquiring 15,308,458Class A shares at an average price of $32.66 per share. OnDecember 8, 2003, Kraft commenced repurchasing shares under a
35
Kraft Foods Inc. Management’s Discussion and Analysis of Financial Condition and Results of Operations
new $700 million Class A common stock repurchase authorityapproved by its Board of Directors in 2003. Through December 31,2003, repurchases under the $700 million program were 1,583,600shares at a cost of $50 million, or $31.57 per share. During 2003,Kraft repurchased 12.5 million shares at a cost of $380 million, and in2002 Kraft repurchased 4.4 million shares at a cost of $170 million.
Concurrently with the IPO, certain employees of Altria Group, Inc.and its subsidiaries received a one-time grant of options to purchaseshares of Kraft’s Class A common stock held by Altria Group, Inc. atthe IPO price of $31.00 per share. In order to completely satisfy thisobligation, Altria Group, Inc. purchased 1.6 million shares of Kraft’sClass A common stock in open market transactions during 2002.
During the first quarter of 2003, the Company granted shares ofrestricted stock and rights to receive shares of stock to eligibleemployees, giving them in most instances all of the rights ofstockholders, except that they may not sell, assign, pledge orotherwise encumber such shares and rights. Such shares andrights are subject to forfeiture if certain employment conditions arenot met. During the first quarter of 2003, the Company grantedapproximately 3.7 million restricted Class A shares to eligible U.S.-based employees and also issued to eligible non-U.S. employeesrights to receive approximately 1.6 million Class A equivalent shares.Restrictions on the stock and rights lapse in the first quarter of 2006.The market value per restricted share or right was $36.56 on thedate of grant.
The fair value of the shares of restricted stock and rights to receiveshares of stock at the date of grant is amortized to expense ratablyover the restriction period. The Company recorded compensationexpense related to the restricted stock and rights of $57 millionfor the year ended December 31, 2003. The unamortized portion,which is reported on the consolidated balance sheet as a reductionof earnings reinvested in the business, was $129 million at December31, 2003.
Dividends paid in 2003 and 2002 were $1,089 million and $936 mil-lion, respectively, reflecting a higher dividend rate in 2003, partiallyoffset by lower shares outstanding as a result of Class A sharerepurchases. During the third quarter of 2003, Kraft’s Board ofDirectors approved a 20% increase in the quarterly dividend rateto $0.18 per share on its Class A and Class B common stock. As aresult, the present annualized dividend rate is $0.72 per commonshare. The declaration of dividends is subject to the discretion ofKraft’s Board of Directors and will depend on various factors,including the Company’s net earnings, financial condition, cashrequirements, future prospects and other factors deemed relevantby Kraft’s Board of Directors.
Market Risk
The Company operates globally, with manufacturing and salesfacilities in various locations around the world, and utilizescertain financial instruments to manage its foreign currencyand commodity exposures, which primarily relate to forecastedtransactions. Derivative financial instruments are used by theCompany, principally to reduce exposures to market risks resultingfrom fluctuations in foreign exchange rates and commodity pricesby creating offsetting exposures. The Company is not a partyto leveraged derivatives and, by policy, does not use financialinstruments for speculative purposes.
Substantially all of the Company’s derivative financial instrumentsare effective as hedges. During the year ended December 31, 2003,ineffectiveness related to cash flow hedges resulted in a gain of$13 million, which was recorded in cost of sales on the consolidatedstatement of earnings. Ineffectiveness related to cash flow hedgesduring the year ended December 31, 2002 was not material.At December 31, 2003, the Company was hedging forecastedtransactions for periods not exceeding twelve months andexpects substantially all amounts reported in accumulatedother comprehensive earnings (losses) to be reclassified to theconsolidated statement of earnings within the next twelve months.
Foreign Exchange Rates: The Company uses forward foreignexchange contracts and foreign currency options to mitigate itsexposure to changes in foreign currency exchange rates from third-party and intercompany forecasted transactions. The primarycurrencies to which the Company is exposed, based on the sizeand location of its businesses, include the euro, Swiss franc, Britishpound and Canadian dollar. At December 31, 2003 and 2002, theCompany had option and forward foreign exchange contracts withaggregate notional amounts of $2,486 million and $575 million,respectively, which are comprised of contracts for the purchase andsale of foreign currencies. The effective portion of unrealized gainsand losses associated with forward contracts is deferred as acomponent of accumulated other comprehensive earnings (losses)until the underlying hedged transactions are reported on theCompany’s consolidated statement of earnings.
36
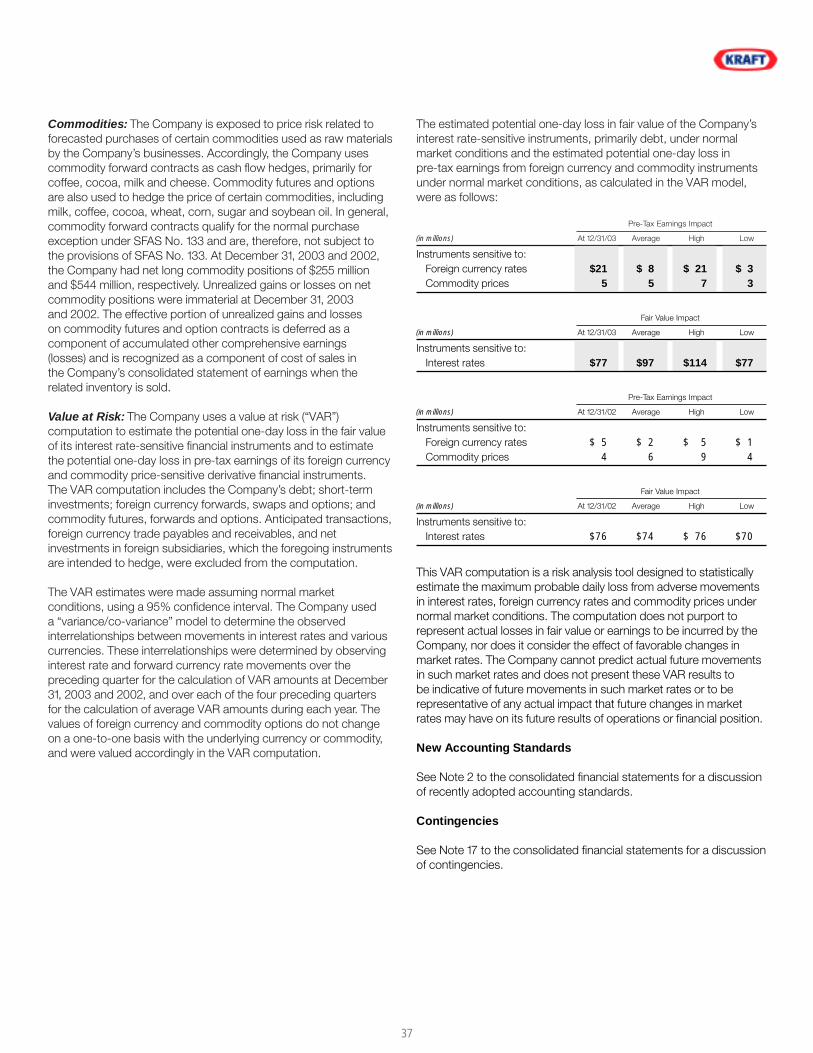
Commodities: The Company is exposed to price risk related toforecasted purchases of certain commodities used as raw materialsby the Company’s businesses. Accordingly, the Company usescommodity forward contracts as cash flow hedges, primarily forcoffee, cocoa, milk and cheese. Commodity futures and optionsare also used to hedge the price of certain commodities, includingmilk, coffee, cocoa, wheat, corn, sugar and soybean oil. In general,commodity forward contracts qualify for the normal purchaseexception under SFAS No. 133 and are, therefore, not subject tothe provisions of SFAS No. 133. At December 31, 2003 and 2002,the Company had net long commodity positions of $255 millionand $544 million, respectively. Unrealized gains or losses on netcommodity positions were immaterial at December 31, 2003and 2002. The effective portion of unrealized gains and losseson commodity futures and option contracts is deferred as acomponent of accumulated other comprehensive earnings(losses) and is recognized as a component of cost of sales inthe Company’s consolidated statement of earnings when therelated inventory is sold.
Value at Risk: The Company uses a value at risk (“VAR”)computation to estimate the potential one-day loss in the fair valueof its interest rate-sensitive financial instruments and to estimatethe potential one-day loss in pre-tax earnings of its foreign currencyand commodity price-sensitive derivative financial instruments.The VAR computation includes the Company’s debt; short-terminvestments; foreign currency forwards, swaps and options; andcommodity futures, forwards and options. Anticipated transactions,foreign currency trade payables and receivables, and netinvestments in foreign subsidiaries, which the foregoing instrumentsare intended to hedge, were excluded from the computation.
The VAR estimates were made assuming normal marketconditions, using a 95% confidence interval. The Company useda “variance/co-variance” model to determine the observedinterrelationships between movements in interest rates and variouscurrencies. These interrelationships were determined by observinginterest rate and forward currency rate movements over thepreceding quarter for the calculation of VAR amounts at December31, 2003 and 2002, and over each of the four preceding quartersfor the calculation of average VAR amounts during each year. Thevalues of foreign currency and commodity options do not changeon a one-to-one basis with the underlying currency or commodity,and were valued accordingly in the VAR computation.
The estimated potential one-day loss in fair value of the Company’sinterest rate-sensitive instruments, primarily debt, under normalmarket conditions and the estimated potential one-day loss inpre-tax earnings from foreign currency and commodity instrumentsunder normal market conditions, as calculated in the VAR model,were as follows:
Pre-Tax Earnings Impact
(in millions) At 12/31/03 Average High Low
Instruments sensitive to:Foreign currency rates $21 $ 8 $ 21 $ 3Commodity prices 5 5 7 3
Fair Value Impact
(in millions) At 12/31/03 Average High Low
Instruments sensitive to:Interest rates $77 $97 $114 $77
Pre-Tax Earnings Impact
(in millions) At 12/31/02 Average High Low
Instruments sensitive to:Foreign currency rates $ 5 $ 2 $ 5 $ 1Commodity prices 4 6 9 4
Fair Value Impact
(in millions) At 12/31/02 Average High Low
Instruments sensitive to:Interest rates $76 $74 $ 76 $70
This VAR computation is a risk analysis tool designed to statisticallyestimate the maximum probable daily loss from adverse movementsin interest rates, foreign currency rates and commodity prices undernormal market conditions. The computation does not purport torepresent actual losses in fair value or earnings to be incurred by theCompany, nor does it consider the effect of favorable changes inmarket rates. The Company cannot predict actual future movementsin such market rates and does not present these VAR results tobe indicative of future movements in such market rates or to berepresentative of any actual impact that future changes in marketrates may have on its future results of operations or financial position.
New Accounting Standards
See Note 2 to the consolidated financial statements for a discussionof recently adopted accounting standards.
Contingencies
See Note 17 to the consolidated financial statements for a discussionof contingencies.
37
38
Kraft Foods Inc. Management’s Discussion and Analysis of Financial Condition and Results of Operations
Forward-Looking and Cautionary Statements
The Company and its representatives may from time to time makewritten or oral forward-looking statements, including statementscontained in the Company’s filings with the Securities and ExchangeCommission (“SEC”) and in its reports to shareholders. One canidentify these forward-looking statements by use of words such as“strategy,” “expects,” “plans,” “anticipates,” “believes,” “will,”“continues,” “estimates,” “intends,” “projects,” “goals,” “targets” andother words of similar meaning. One can also identify them by thefact that they do not relate strictly to historical or current facts. Thesestatements are based on our assumptions and estimates and aresubject to risks and uncertainties. In connection with the “safeharbor” provisions of the Private Securities Litigation Reform Act of1995, the Company is hereby identifying important factors that couldcause actual results and outcomes to differ materially from thosecontained in any forward-looking statement made by or on behalf ofthe Company; any such statement is qualified by reference to thefollowing cautionary statements.
Each of the Company’s segments is subject to intense competition,changes in consumer preferences and demand for its products, theeffects of changing prices for its raw materials and local economicand market conditions. Their results are dependent upon theircontinued ability to promote brand equity successfully, to anticipateand respond to new consumer trends, to develop new products andmarkets, to broaden brand portfolios, to compete effectively withlower priced products in a consolidating environment at the retailand manufacturing levels and to improve productivity. TheCompany’s results are also dependent on its ability to consummate
and successfully integrate acquisitions and to realize the costsavings and improved asset utilization contemplated by itsrestructuring program. In addition, the Company is subject to theeffects of foreign economies, currency movements, fluctuations inlevels of customer inventories and credit and other business risksrelated to its customers operating in a challenging economic andcompetitive environment. The Company’s results are affected by itsaccess to credit markets, borrowing costs and credit ratings, whichmay in turn be influenced by the credit ratings of Altria Group, Inc.The Company’s benefit expense is subject to the investmentperformance of pension plan assets, interest rates and costincreases for medical benefits offered to employees and retirees.The food industry continues to be subject to recalls if productsbecome adulterated or misbranded, liability if product consumptioncauses injury, ingredient disclosure and labeling laws and regulationsand the possibility that consumers could lose confidence in thesafety and quality of certain food products. The food industry is alsosubject to consumer concerns regarding genetically modifiedorganisms and the health implications of obesity and trans-fattyacids. Developments in any of these areas, which are more fullydescribed elsewhere in this document and which descriptions areincorporated into this section by reference, could cause theCompany’s results to differ materially from results that have been ormay be projected by or on behalf of the Company. The Companycautions that the foregoing list of important factors is not exclusive.Any forward-looking statements are made as of the date of thedocument in which they appear. The Company does not undertaketo update any forward-looking statement that may be made fromtime to time by or on behalf of the Company.

39
Kraft Foods Inc. Selected Financial Data — Five-Year Review
(in millions of dollars, except per share data)
2003 2002 2001 2000 1999
Summary of Operations:Net revenues $31,010 $29,723 $29,234 $22,922 $23,430Cost of sales 18,828 17,720 17,566 13,959 14,615Operating income 6,011 6,114 4,884 4,012 3,579Interest and other debt expense, net 665 847 1,437 597 539Earnings before income taxes and minority interest 5,346 5,267 3,447 3,415 3,040Pre-tax profit margin 17.2% 17.7% 11.8% 14.9% 13.0%Provision for income taxes 1,866 1,869 1,565 1,414 1,287
Net earnings 3,476 3,394 1,882 2,001 1,753Basic EPS 2.01 1.96 1.17 1.38 1.20Diluted EPS 2.01 1.96 1.17 1.38 1.20Dividends declared per share 0.66 0.56 0.26 — —Weighted average shares (millions)—Basic 1,727 1,734 1,610 1,455 1,455Weighted average shares (millions)—Diluted 1,728 1,736 1,610 1,455 1,455
Capital expenditures 1,085 1,184 1,101 906 860Depreciation 804 709 680 499 491Property, plant and equipment, net 10,155 9,559 9,109 9,405 6,526Inventories 3,343 3,382 3,026 3,041 2,563Total assets 59,285 57,100 55,798 52,071 30,336Long-term debt 11,591 10,416 8,134 2,695 433Notes payable to Altria Group, Inc. and affiliates — 2,560 5,000 21,407 6,602Total debt 13,462 14,443 16,007 25,826 7,828
Total deferred income taxes 5,175 4,917 4,565 942 789Shareholders’ equity 28,530 25,832 23,478 14,048 13,461Common dividends declared as a % of Basic EPS 32.8% 28.6% 22.2% — —Common dividends declared as a % of Diluted EPS 32.8% 28.6% 22.2% — —Book value per common share outstanding 16.57 14.92 13.53 9.65 9.25Market price per Class A common share—high/low 39.40-26.35 43.95-32.50 35.57-29.50 — —
Closing price of Class A common share at year end 32.22 38.93 34.03 — —Price/earnings ratio at year end—Basic 16 20 29 — —Price/earnings ratio at year end—Diluted 16 20 29 — —Number of common shares outstanding at
year end (millions) 1,722 1,731 1,735 1,455 1,455Number of employees 106,000 109,000 114,000 117,000 71,000
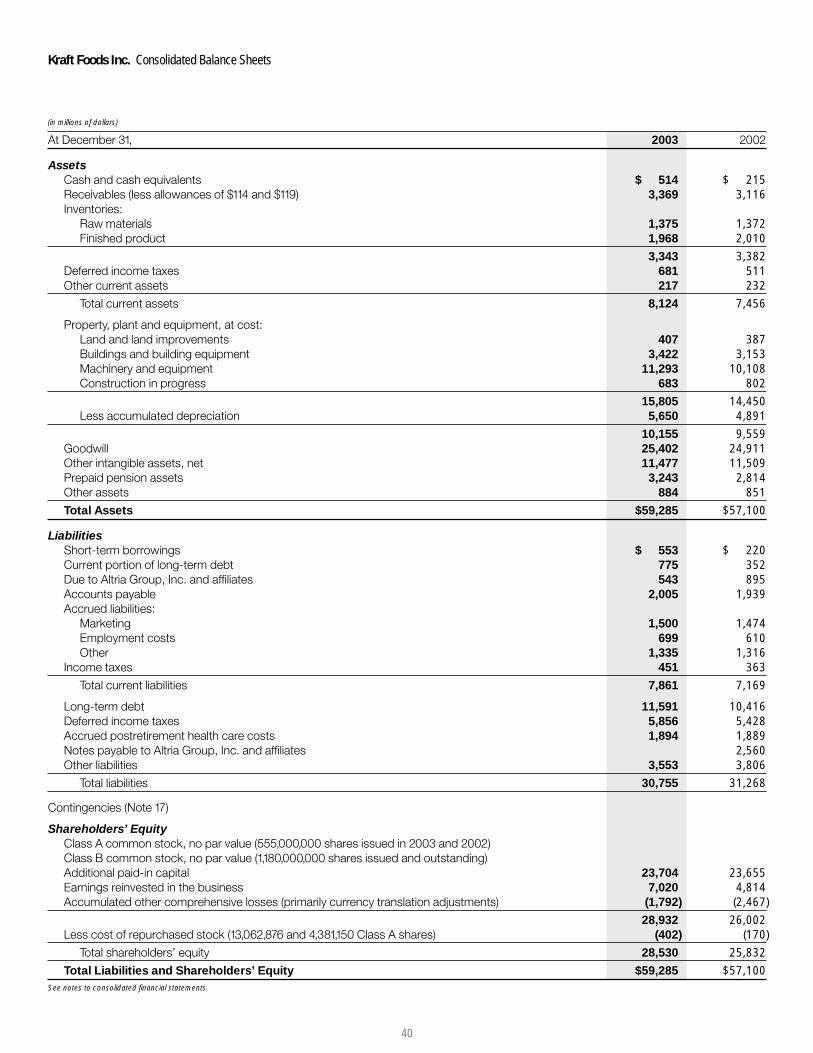
40
Kraft Foods Inc. Consolidated Balance Sheets
(in millions of dollars)
At December 31, 2003 2002
AssetsCash and cash equivalents $ 514 $ 215Receivables (less allowances of $114 and $119) 3,369 3,116Inventories:
Raw materials 1,375 1,372Finished product 1,968 2,010
3,343 3,382Deferred income taxes 681 511Other current assets 217 232
Total current assets 8,124 7,456
Property, plant and equipment, at cost:Land and land improvements 407 387Buildings and building equipment 3,422 3,153Machinery and equipment 11,293 10,108Construction in progress 683 802
15,805 14,450Less accumulated depreciation 5,650 4,891
10,155 9,559Goodwill 25,402 24,911Other intangible assets, net 11,477 11,509Prepaid pension assets 3,243 2,814Other assets 884 851
Total Assets $59,285 $57,100
LiabilitiesShort-term borrowings $ 553 $ 220Current portion of long-term debt 775 352Due to Altria Group, Inc. and affiliates 543 895Accounts payable 2,005 1,939Accrued liabilities:
Marketing 1,500 1,474Employment costs 699 610Other 1,335 1,316
Income taxes 451 363
Total current liabilities 7,861 7,169
Long-term debt 11,591 10,416Deferred income taxes 5,856 5,428Accrued postretirement health care costs 1,894 1,889Notes payable to Altria Group, Inc. and affiliates 2,560Other liabilities 3,553 3,806
Total liabilities 30,755 31,268
Contingencies (Note 17)
Shareholders’ EquityClass A common stock, no par value (555,000,000 shares issued in 2003 and 2002)Class B common stock, no par value (1,180,000,000 shares issued and outstanding)Additional paid-in capital 23,704 23,655Earnings reinvested in the business 7,020 4,814Accumulated other comprehensive losses (primarily currency translation adjustments) (1,792) (2,467)
28,932 26,002Less cost of repurchased stock (13,062,876 and 4,381,150 Class A shares) (402) (170)
Total shareholders’ equity 28,530 25,832
Total Liabilities and Shareholders’ Equity $59,285 $57,100See notes to consolidated financial statements.
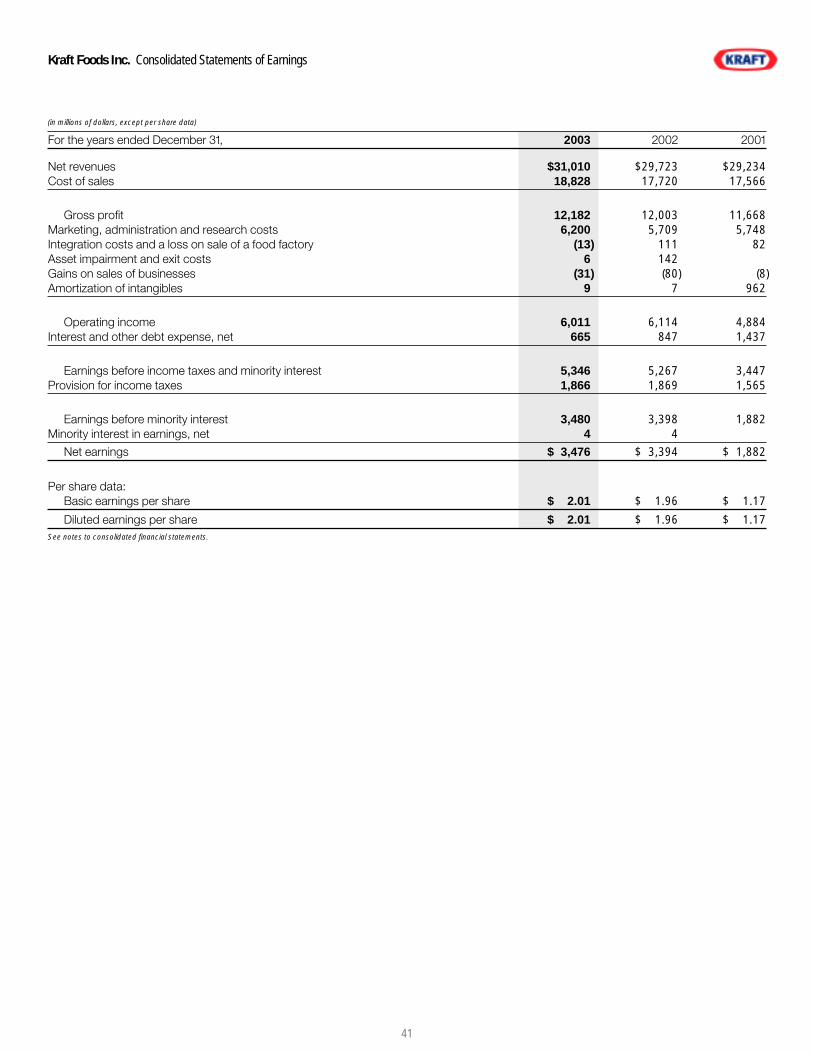
41
Kraft Foods Inc. Consolidated Statements of Earnings
(in millions of dollars, except per share data)
For the years ended December 31, 2003 2002 2001
Net revenues $31,010 $29,723 $29,234Cost of sales 18,828 17,720 17,566
Gross profit 12,182 12,003 11,668Marketing, administration and research costs 6,200 5,709 5,748Integration costs and a loss on sale of a food factory (13) 111 82Asset impairment and exit costs 6 142Gains on sales of businesses (31) (80) (8)Amortization of intangibles 9 7 962
Operating income 6,011 6,114 4,884Interest and other debt expense, net 665 847 1,437
Earnings before income taxes and minority interest 5,346 5,267 3,447Provision for income taxes 1,866 1,869 1,565
Earnings before minority interest 3,480 3,398 1,882Minority interest in earnings, net 4 4
Net earnings $ 3,476 $ 3,394 $ 1,882
Per share data:Basic earnings per share $ 2.01 $ 1.96 $ 1.17
Diluted earnings per share $ 2.01 $ 1.96 $ 1.17See notes to consolidated financial statements.
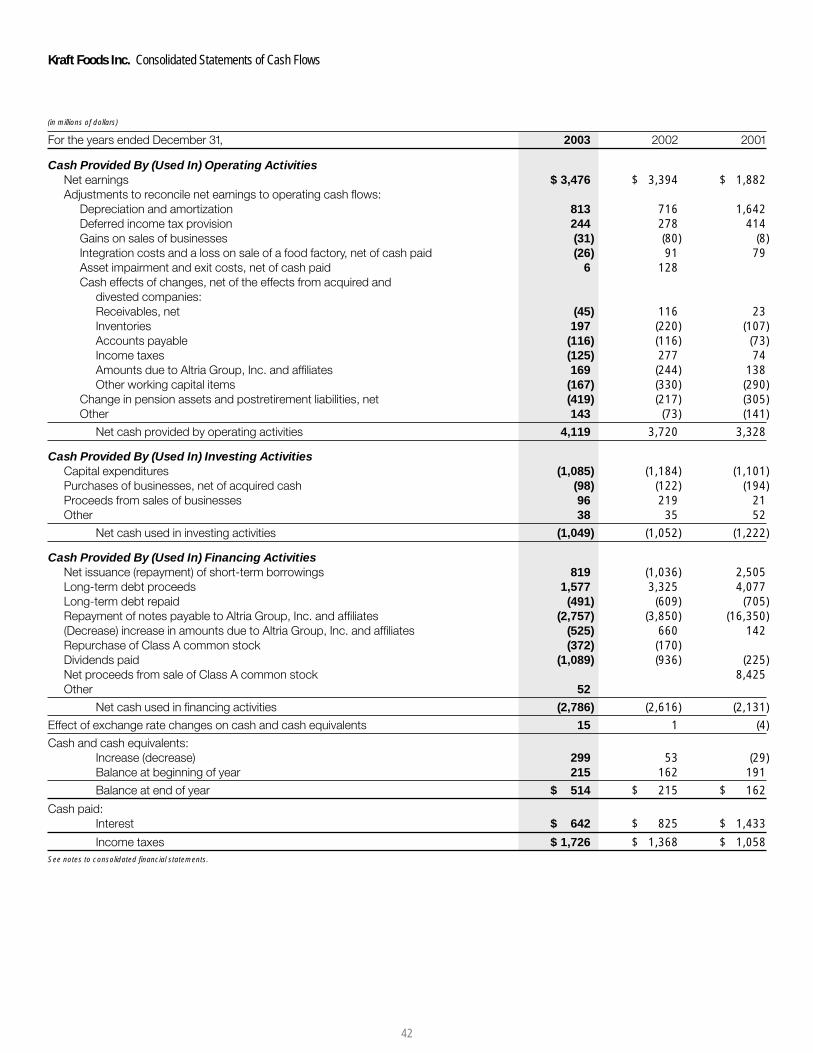
42
Kraft Foods Inc. Consolidated Statements of Cash Flows
(in millions of dollars)
For the years ended December 31, 2003 2002 2001
Cash Provided By (Used In) Operating ActivitiesNet earnings $ 3,476 $ 3,394 $ 1,882Adjustments to reconcile net earnings to operating cash flows:
Depreciation and amortization 813 716 1,642Deferred income tax provision 244 278 414Gains on sales of businesses (31) (80) (8)Integration costs and a loss on sale of a food factory, net of cash paid (26) 91 79Asset impairment and exit costs, net of cash paid 6 128Cash effects of changes, net of the effects from acquired and
divested companies:Receivables, net (45) 116 23Inventories 197 (220) (107)Accounts payable (116) (116) (73)Income taxes (125) 277 74Amounts due to Altria Group, Inc. and affiliates 169 (244) 138Other working capital items (167) (330) (290)
Change in pension assets and postretirement liabilities, net (419) (217) (305)Other 143 (73) (141)
Net cash provided by operating activities 4,119 3,720 3,328
Cash Provided By (Used In) Investing ActivitiesCapital expenditures (1,085) (1,184) (1,101)Purchases of businesses, net of acquired cash (98) (122) (194)Proceeds from sales of businesses 96 219 21Other 38 35 52
Net cash used in investing activities (1,049) (1,052) (1,222)
Cash Provided By (Used In) Financing ActivitiesNet issuance (repayment) of short-term borrowings 819 (1,036) 2,505Long-term debt proceeds 1,577 3,325 4,077Long-term debt repaid (491) (609) (705)Repayment of notes payable to Altria Group, Inc. and affiliates (2,757) (3,850) (16,350)(Decrease) increase in amounts due to Altria Group, Inc. and affiliates (525) 660 142Repurchase of Class A common stock (372) (170)Dividends paid (1,089) (936) (225)Net proceeds from sale of Class A common stock 8,425Other 52
Net cash used in financing activities (2,786) (2,616) (2,131)
Effect of exchange rate changes on cash and cash equivalents 15 1 (4)
Cash and cash equivalents:Increase (decrease) 299 53 (29)Balance at beginning of year 215 162 191
Balance at end of year $ 514 $ 215 $ 162
Cash paid:Interest $ 642 $ 825 $ 1,433
Income taxes $ 1,726 $ 1,368 $ 1,058See notes to consolidated financial statements.

43
Kraft Foods Inc. Consolidated Statements of Shareholders’ Equity
(in millions of dollars, except per share data)
Accumulated OtherComprehensive Earnings (Losses)
Class A Earningsand B Additional Reinvested Currency Cost of Total
Common Paid-in in the Translation Repurchased Shareholders’Stock Capital Business Adjustments Other Total Stock Equity
Balances, January 1, 2001 $ — $15,230 $ 992 $(2,138) $ (36) $(2,174) $ — $14,048
Comprehensive earnings:Net earnings 1,882 1,882Other comprehensive losses,
net of income taxes:Currency translation
adjustments (298) (298) (298)Additional minimum
pension liability (78) (78) (78)Change in fair value of
derivatives accounted for as hedges (18) (18) (18)
Total other comprehensive losses (394)Total comprehensive earnings 1,488Sale of Class A common stock
to public 8,425 8,425Cash dividends declared
($0.26 per share) (483) (483)Balances, December 31, 2001 — 23,655 2,391 (2,436) (132) (2,568) — 23,478
Comprehensive earnings:Net earnings 3,394 3,394Other comprehensive earnings
(losses), net of income taxes:Currency translation
adjustments 187 187 187Additional minimum
pension liability (117) (117) (117)Change in fair value of
derivatives accounted for as hedges 31 31 31
Total other comprehensive earnings 101Total comprehensive earnings 3,495Cash dividends declared
($0.56 per share) (971) (971)Class A common stock
repurchased (170) (170)Balances, December 31, 2002 — 23,655 4,814 (2,249) (218) (2,467) (170) 25,832
Comprehensive earnings:Net earnings 3,476 3,476Other comprehensive earnings
(losses), net of income taxes:Currency translation
adjustments 755 755 755Additional minimum
pension liability (68) (68) (68)Change in fair value of
derivatives accounted for as hedges (12) (12) (12)
Total other comprehensive earnings 675Total comprehensive earnings 4,151Exercise of stock options and
issuance of other stock awards 49 (129) 148 68Cash dividends declared
($0.66 per share) (1,141) (1,141)Class A common stock
repurchased (380) (380)Balances, December 31, 2003 $ — $23,704 $ 7,020 $(1,494) $(298) $(1,792) $(402) $28,530
See notes to consolidated financial statements.
43
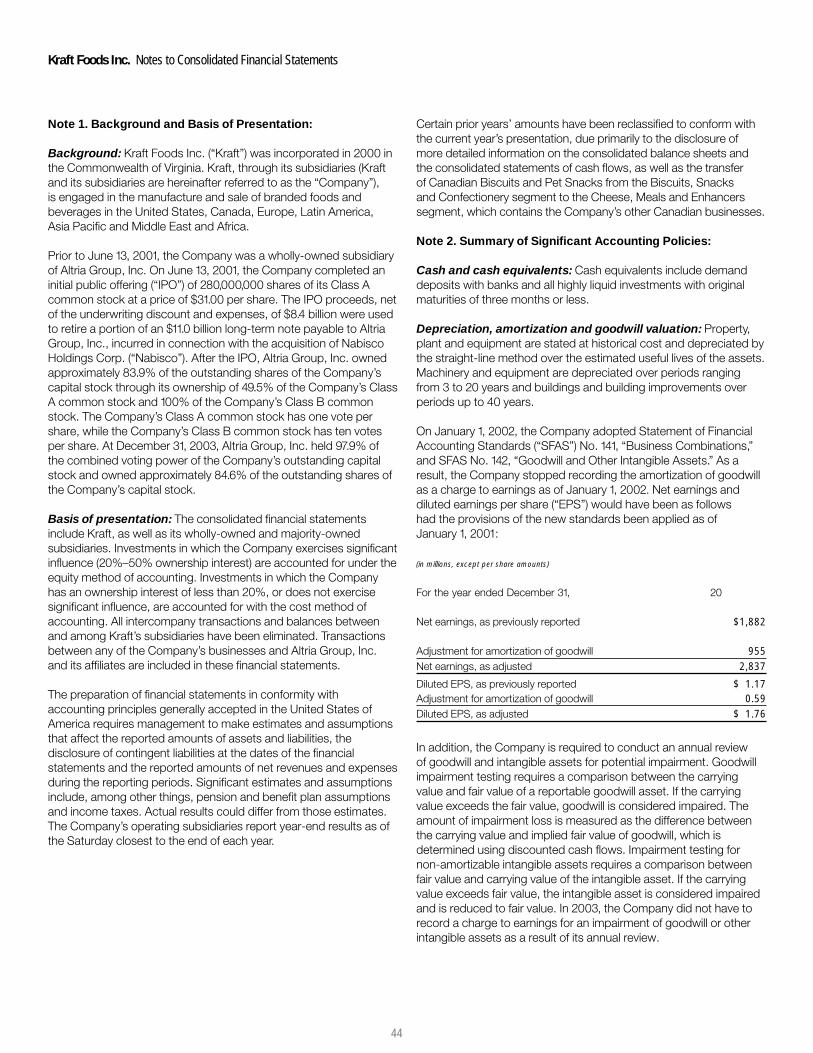
44
Kraft Foods Inc. Notes to Consolidated Financial Statements
Note 1. Background and Basis of Presentation:
Background: Kraft Foods Inc. (“Kraft”) was incorporated in 2000 inthe Commonwealth of Virginia. Kraft, through its subsidiaries (Kraftand its subsidiaries are hereinafter referred to as the “Company”),is engaged in the manufacture and sale of branded foods andbeverages in the United States, Canada, Europe, Latin America,Asia Pacific and Middle East and Africa.
Prior to June 13, 2001, the Company was a wholly-owned subsidiaryof Altria Group, Inc. On June 13, 2001, the Company completed aninitial public offering (“IPO”) of 280,000,000 shares of its Class Acommon stock at a price of $31.00 per share. The IPO proceeds, netof the underwriting discount and expenses, of $8.4 billion were usedto retire a portion of an $11.0 billion long-term note payable to AltriaGroup, Inc., incurred in connection with the acquisition of NabiscoHoldings Corp. (“Nabisco”). After the IPO, Altria Group, Inc. ownedapproximately 83.9% of the outstanding shares of the Company’scapital stock through its ownership of 49.5% of the Company’s ClassA common stock and 100% of the Company’s Class B commonstock. The Company’s Class A common stock has one vote pershare, while the Company’s Class B common stock has ten votesper share. At December 31, 2003, Altria Group, Inc. held 97.9% ofthe combined voting power of the Company’s outstanding capitalstock and owned approximately 84.6% of the outstanding shares ofthe Company’s capital stock.
Basis of presentation: The consolidated financial statementsinclude Kraft, as well as its wholly-owned and majority-ownedsubsidiaries. Investments in which the Company exercises significantinfluence (20%–50% ownership interest) are accounted for under theequity method of accounting. Investments in which the Companyhas an ownership interest of less than 20%, or does not exercisesignificant influence, are accounted for with the cost method ofaccounting. All intercompany transactions and balances betweenand among Kraft’s subsidiaries have been eliminated. Transactionsbetween any of the Company’s businesses and Altria Group, Inc.and its affiliates are included in these financial statements.
The preparation of financial statements in conformity withaccounting principles generally accepted in the United States ofAmerica requires management to make estimates and assumptionsthat affect the reported amounts of assets and liabilities, thedisclosure of contingent liabilities at the dates of the financialstatements and the reported amounts of net revenues and expensesduring the reporting periods. Significant estimates and assumptionsinclude, among other things, pension and benefit plan assumptionsand income taxes. Actual results could differ from those estimates.The Company’s operating subsidiaries report year-end results as ofthe Saturday closest to the end of each year.
Certain prior years’ amounts have been reclassified to conform withthe current year’s presentation, due primarily to the disclosure ofmore detailed information on the consolidated balance sheets andthe consolidated statements of cash flows, as well as the transferof Canadian Biscuits and Pet Snacks from the Biscuits, Snacksand Confectionery segment to the Cheese, Meals and Enhancerssegment, which contains the Company’s other Canadian businesses.
Note 2. Summary of Significant Accounting Policies:
Cash and cash equivalents: Cash equivalents include demanddeposits with banks and all highly liquid investments with originalmaturities of three months or less.
Depreciation, amortization and goodwill valuation: Property,plant and equipment are stated at historical cost and depreciated bythe straight-line method over the estimated useful lives of the assets.Machinery and equipment are depreciated over periods rangingfrom 3 to 20 years and buildings and building improvements overperiods up to 40 years.
On January 1, 2002, the Company adopted Statement of FinancialAccounting Standards (“SFAS”) No. 141, “Business Combinations,”and SFAS No. 142, “Goodwill and Other Intangible Assets.” As aresult, the Company stopped recording the amortization of goodwillas a charge to earnings as of January 1, 2002. Net earnings anddiluted earnings per share (“EPS”) would have been as followshad the provisions of the new standards been applied as ofJanuary 1, 2001:
(in millions, except per share amounts)
For the year ended December 31, 20
Net earnings, as previously reported $1,882
Adjustment for amortization of goodwill 955Net earnings, as adjusted 2,837
Diluted EPS, as previously reported $ 1.17Adjustment for amortization of goodwill 0.59Diluted EPS, as adjusted $ 1.76
In addition, the Company is required to conduct an annual reviewof goodwill and intangible assets for potential impairment. Goodwillimpairment testing requires a comparison between the carryingvalue and fair value of a reportable goodwill asset. If the carryingvalue exceeds the fair value, goodwill is considered impaired. Theamount of impairment loss is measured as the difference betweenthe carrying value and implied fair value of goodwill, which isdetermined using discounted cash flows. Impairment testing fornon-amortizable intangible assets requires a comparison betweenfair value and carrying value of the intangible asset. If the carryingvalue exceeds fair value, the intangible asset is considered impairedand is reduced to fair value. In 2003, the Company did not have torecord a charge to earnings for an impairment of goodwill or otherintangible assets as a result of its annual review.

45
At December 31, 2003 and 2002, goodwill by reportable segmentwas as follows:
(in millions)
2003 2002
Cheese, Meals and Enhancers $ 8,834 $ 8,803Biscuits, Snacks and Confectionery 8,963 9,015Beverages, Desserts and Cereals 2,143 2,143Oscar Mayer and Pizza 613 616
Total Kraft Foods North America 20,553 20,577Europe, Middle East and Africa 4,562 4,082Latin America and Asia Pacific 287 252
Total Kraft Foods International 4,849 4,334Total goodwill $25,402 $24,911
Intangible assets at December 31, 2003 and 2002, were as follows:
(in millions)
2003 2002Gross Gross
Carrying Accumulated Carrying AccumulatedAmount Amortization Amount Amortization
Non-amortizable intangible assets $11,432 $11,485
Amortizable intangible assets 84 $39 54 $30
Total intangible assets $11,516 $39 $11,539 $30
Non-amortizable intangible assets are substantially comprised ofbrand names purchased through the Nabisco acquisition.Amortizable intangible assets consist primarily of certain trademarklicenses and non-compete agreements. Pre-tax amortizationexpense for intangible assets was $9 million and $7 million for theyears ended December 31, 2003 and 2002, respectively.Amortization expense for each of the next five years is currentlyestimated to be $10 million or less.
The movement in goodwill and intangible assets from December 31,2002, is as follows:
(in millions)
IntangibleGoodwill Assets
Balance at December 31, 2002 $24,911 $11,539Changes due to:
Acquisitions 49 30Currency 520 (40)Other (78) (13)
Balance at December 31, 2003 $25,402 $11,516
Environmental costs: The Company is subject to laws andregulations relating to the protection of the environment. TheCompany provides for expenses associated with environmentalremediation obligations on an undiscounted basis when suchamounts are probable and can be reasonably estimated.Such accruals are adjusted as new information develops orcircumstances change.
While it is not possible to quantify with certainty the potential impactof actions regarding environmental remediation and complianceefforts that the Company may undertake in the future, in the opinionof management, environmental remediation and compliance costs,before taking into account any recoveries from third parties, will nothave a material adverse effect on the Company’s consolidatedfinancial position, results of operations or cash flows.
Foreign currency translation: The Company translates the resultsof operations of its foreign subsidiaries using average exchangerates during each period, whereas balance sheet accounts aretranslated using exchange rates at the end of each period. Currencytranslation adjustments are recorded as a component ofshareholders’ equity. Transaction gains and losses are recorded inmarketing, administration and research costs on the consolidatedstatements of earnings and were not significant for any of theperiods presented.
Guarantees: Effective January 1, 2003, the Company adoptedFinancial Accounting Standards Board (“FASB”) InterpretationNo. 45, “Guarantor’s Accounting and Disclosure Requirementsfor Guarantees, Including Indirect Guarantees of Indebtednessof Others.” Interpretation No. 45 required the disclosure of certainguarantees existing at December 31, 2002. In addition, InterpretationNo. 45 required the recognition of a liability for the fair value of theobligation of qualifying guarantee activities that are initiated ormodified after December 31, 2002. Accordingly, the Company hasapplied the recognition provisions of Interpretation No. 45 toguarantees initiated after December 31, 2002. Adoption ofInterpretation No. 45 as of January 1, 2003 did not have a materialimpact on the Company’s consolidated financial statements. SeeNote 17. Contingencies for a further discussion of guarantees.
Hedging instruments: Effective January 1, 2001, the Companyadopted SFAS No. 133, “Accounting for Derivative Instruments andHedging Activities,” and its related amendment, SFAS No. 138,“Accounting for Certain Derivative Instruments and Certain HedgingActivities.” These standards require that all derivative financialinstruments be recorded at fair value on the consolidated balancesheets as either assets or liabilities. Changes in the fair value ofderivatives are recorded each period either in accumulated othercomprehensive earnings (losses) or in earnings, depending onwhether a derivative is designated and effective as part of a hedgetransaction and, if it is, the type of hedge transaction. Gains andlosses on derivative instruments reported in accumulated othercomprehensive earnings (losses) are reclassified to the consolidatedstatement of earnings in the periods in which operating results are

46
Kraft Foods Inc. Notes to Consolidated Financial Statements
affected by the hedged item. Cash flow hedging instruments areclassified in the same manner as the affected hedged item in theconsolidated statements of cash flows. As of January 1, 2001, theadoption of these new standards did not have a material effect onnet earnings (less than $1 million) or accumulated other compre-hensive losses (less than $1 million).
Effective July 1, 2003, the Company adopted SFAS No. 149,“Amendment of Statement 133 on Derivative Instruments andHedging Activities.” SFAS No. 149 amends and clarifies financialaccounting and reporting for derivative instruments, includingcertain derivative instruments embedded in other contracts and forhedging activities under SFAS No. 133. The adoption of SFAS No.149 did not have a material impact on the Company’s consolidatedfinancial position, results of operations or cash flows. Collectively,SFAS No. 133, SFAS No. 138 and SFAS No. 149 are referred to as“SFAS No. 133.”
Impairment of long-lived assets: The Company reviews long-lived assets, including amortizable intangible assets, for impairmentwhenever events or changes in business circumstances indicatethat the carrying amount of the assets may not be fully recoverable.The Company performs undiscounted operating cash flow analysesto determine if an impairment exists. If an impairment is determinedto exist, any related impairment loss is calculated based on fairvalue. Impairment losses on assets to be disposed of, if any,are based on the estimated proceeds to be received, less costsof disposal.
Income taxes: The Company accounts for income taxes inaccordance with SFAS No. 109, “Accounting for Income Taxes.”The accounts of the Company are included in the consolidatedfederal income tax return of Altria Group, Inc. Income taxes aregenerally computed on a separate company basis. To the extentthat foreign tax credits, capital losses and other credits generatedby the Company, which cannot currently be utilized on a separatecompany basis, are utilized in Altria Group, Inc.’s consolidatedfederal income tax return, the benefit is recognized in the calculationof the Company’s provision for income taxes. Based on theCompany’s current estimate, this benefit is calculated to beapproximately $100 million, $240 million and $220 million for theyears ended December 31, 2003, 2002 and 2001, respectively.The Company makes payments to, or is reimbursed by, Altria Group,Inc., for the tax effects resulting from its inclusion in Altria Group,Inc.’s consolidated federal income tax return. Significant judgmentis required in determining income tax provisions and in evaluatingtax positions. The Company and its subsidiaries establish additionalprovisions for income taxes when, despite the belief that their taxpositions are fully supportable, there remain certain positions thatare likely to be challenged and that may not be sustained on reviewby tax authorities. The Company and its subsidiaries adjust theseadditional accruals in light of changing facts and circumstances.The consolidated tax provision includes the impact of changesto accruals that are considered appropriate, as well as the relatednet interest.
Inventories: Inventories are stated at the lower of cost or market.The last-in, first-out (“LIFO”) method is used to cost a majority ofdomestic inventories. The cost of other inventories is principallydetermined by the average cost method.
Marketing costs: The Company promotes its products withadvertising, consumer incentives and trade promotions. Advertisingcosts are expensed as incurred. Consumer incentive and tradepromotion activities are recorded as a reduction of revenues basedon amounts estimated as being due to customers and consumersat the end of a period, based principally on historical utilization andredemption rates.
Revenue recognition: The Company recognizes revenues, net ofsales incentives and including shipping and handling charges billedto customers, upon shipment of goods when title and risk of losspass to customers. Shipping and handling costs are classified aspart of cost of sales.
Effective July 1, 2003, the Company adopted Emerging IssuesTask Force (“EITF”) Issue No. 00-21, “Revenue Arrangements withMultiple Deliverables,” which addresses certain aspects of a vendor’saccounting for arrangements under which it will perform multiplerevenue-generating activities. Specifically, EITF Issue No. 00-21addresses how to determine whether an arrangement involvingmultiple deliverables contains more than one unit of accounting.The adoption of EITF Issue No. 00-21 did not have a material impacton the Company’s consolidated financial position, results ofoperations or cash flows.
Software costs: The Company capitalizes certain computersoftware and software development costs incurred in connectionwith developing or obtaining computer software for internal use.Capitalized software costs are included in property, plant andequipment on the consolidated balance sheets and amortized ona straight-line basis over the estimated useful lives of the software,which do not exceed five years.
Stock-based compensation: The Company accounts foremployee stock compensation plans in accordance with the intrinsicvalue-based method permitted by SFAS No. 123, “Accounting forStock-Based Compensation,” which did not result in compensationcost for stock options. The market value of restricted stock atdate of grant is recorded as compensation expense over the periodof restriction.
At December 31, 2003, the Company had stock-based employeecompensation plans, which are described more fully in Note 10.Stock Plans. The Company applies the recognition andmeasurement principles of Accounting Principles Board OpinionNo. 25, “Accounting for Stock Issued to Employees,” and relatedInterpretations in accounting for stock options. No compensationexpense for employee stock options is reflected in net earnings, asall options granted under those plans had an exercise price equalto the market value of the common stock on the date of the grant.

47
Net earnings, as reported, includes pre-tax compensation expenserelated to restricted stock and rights to receive shares of stock of$57 million, $4 million and $39 million for the years ended December31, 2003, 2002 and 2001, respectively. The following table illustratesthe effect on net earnings and EPS if the Company had applied thefair value recognition provisions of SFAS No. 123 to stock-basedemployee compensation for the years ended December 31, 2003,2002, and 2001:
(in millions, except per share data)
2003 2002 2001
Net earnings, as reported $3,476 $3,394 $1,882Deduct:Total stock-based employee
compensation expense determined under fair value method for all stock option awards, net of related tax effects 12 78 97
Pro forma net earnings $3,464 $3,316 $1,785
Earnings per share:Basic—as reported $ 2.01 $ 1.96 $ 1.17
Basic—pro forma $ 2.01 $ 1.91 $ 1.11
Diluted—as reported $ 2.01 $ 1.96 $ 1.17
Diluted—pro forma $ 2.00 $ 1.91 $ 1.11
New accounting pronouncements: Several recent accountingpronouncements not previously discussed became effective during2003. The adoption of these pronouncements did not have amaterial impact on the Company’s consolidated financial position,results of operations or cash flows. The pronouncements wereas follows:
• SFAS No. 150, “Accounting for Certain Financial Instruments withCharacteristics of both Liabilities and Equity”;
• EITF Issue No. 03-3, “Applicability of EITF Abstracts, Topic No.D-79, ‘Accounting for Retroactive Insurance Contracts Purchasedby Entities Other Than Insurance Enterprises,’ to Claims-MadeInsurance Policies”;
• EITF Issue No. 01-8, “Determining Whether an ArrangementContains a Lease”;
• SFAS No. 146, “Accounting for Costs Associated with Exit orDisposal Activities”; and
• FASB Interpretation No. 46, “Consolidation of VariableInterest Entities.”
Note 3. Related Party Transactions:
Altria Group, Inc.’s subsidiary, Altria Corporate Services, Inc.,provides the Company with various services, including planning,legal, treasury, accounting, auditing, insurance, human resources,office of the secretary, corporate affairs, information technology andtax services. Billings for these services, which were based on thecost to Altria Corporate Services, Inc. to provide such services and amanagement fee, were $318 million, $327 million and $339 million for
the years ended December 31, 2003, 2002 and 2001, respectively.These costs were paid to Altria Corporate Services, Inc. monthly.Although the cost of these services cannot be quantified on astand-alone basis, management has assessed that the billingsare reasonable based on the level of support provided by AltriaCorporate Services, Inc., and that they reflect all services provided.The cost and nature of the services are reviewed annually by theCompany’s Audit Committee, which is comprised of independentdirectors. The effects of these transactions are included in operatingcash flows in the Company’s consolidated statements of cash flows.
The Company had long-term notes payable to Altria Group, Inc. andits affiliates as follows:
(in millions)
At December 31, 2003 2002
Notes payable in 2009, interest at 7.0% $ — $1,150Short-term due to Altria Group, Inc. and
affiliates reclassified as long-term 1,410$ — $2,560
During 2003, the Company repaid Altria Group, Inc. the remaining$1,150 million on the 7.0% note as well as the $1,410 million of short-term reclassified to long-term. In addition, at December 31, 2003and 2002, the Company had short-term amounts payable to AltriaGroup, Inc. of $543 million and $895 million, respectively. Interest onthese borrowings is based on the applicable London InterbankOffered Rate.
The fair values of the Company’s short-term amounts due to AltriaGroup, Inc. and affiliates approximate carrying amounts.
Note 4. Divestitures:
During 2003, the Company sold a European rice business and abranded fresh cheese business in Italy. The aggregate proceedsreceived from sales of businesses were $96 million, on which theCompany recorded pre-tax gains of $31 million.
During 2002, the Company sold several small North American foodbusinesses, some of which were previously classified as businessesheld for sale. The net revenues and operating results of thebusinesses held for sale, which were not significant, were excludedfrom the Company’s consolidated statements of earnings, and nogain or loss was recognized on these sales. In addition, theCompany sold its Latin American yeast and industrial bakeryingredients business for approximately $110 million and recorded apre-tax gain of $69 million. The aggregate proceeds received fromsales of businesses were $219 million, on which the Companyrecorded pre-tax gains of $80 million.
During 2001, the Company sold several small food businesses. Theaggregate proceeds received in these transactions were $21 million,on which the Company recorded pre-tax gains of $8 million.
The operating results of the businesses sold were not material to theCompany’s consolidated financial position, results of operations orcash flows in any of the periods presented.

48
Kraft Foods Inc. Notes to Consolidated Financial Statements
Note 5. Acquisitions:
During 2003, the Company acquired a biscuits business in Egyptand trademarks associated with a small U.S.-based natural foodsbusiness. The total cost of these and other smaller acquisitions was$98 million.
During 2002, the Company acquired a snacks business in Turkeyand a biscuits business in Australia. The total cost of these and othersmaller acquisitions was $122 million.
During 2001, the Company purchased coffee businesses inRomania, Morocco and Bulgaria and also acquired confectionerybusinesses in Russia and Poland. The total cost of these and othersmaller acquisitions was $194 million.
The effects of these acquisitions were not material to the Company’sconsolidated financial position, results of operations or cash flows inany of the periods presented.
Note 6. Inventories:
The cost of approximately 39% and 43% of inventories in 2003 and2002, respectively, was determined using the LIFO method. Thestated LIFO amounts of inventories were approximately $155 millionand $215 million higher than the current cost of inventories atDecember 31, 2003 and 2002, respectively.
Note 7. Short-Term Borrowings andBorrowing Arrangements:
At December 31, 2003 and 2002, the Company had short-termborrowings of $2,453 million and $1,621 million, respectively,consisting principally of commercial paper borrowings with anaverage year-end interest rate of 1.4% and 1.3%, respectively. Ofthese amounts, the Company reclassified $1,900 million and$1,401 million, respectively, of the commercial paper borrowings tolong-term debt based upon its intent and ability to refinance theseborrowings on a long-term basis.
The fair values of the Company’s short-term borrowings atDecember 31, 2003 and 2002, based upon current market interestrates, approximate the amounts disclosed above.
Following a $10.1 billion judgment on March 21, 2003 against AltriaGroup, Inc.’s domestic tobacco subsidiary, Philip Morris USA Inc.,the three major credit rating agencies took a series of ratings actionsresulting in the lowering of the Company’s short-term and long-termdebt ratings, despite the fact the Company is neither a party to, norhas exposure to, this litigation. Moody’s lowered the Company’sshort-term debt rating from “P-1” to “P-2” and its long-term debtrating from “A2” to “A3,” with stable outlook. Standard & Poor’slowered the Company’s short-term debt rating from “A-1” to “A-2”and its long-term debt rating from “A–” to “BBB+,” with stableoutlook. Fitch Rating Services lowered the Company’s short-term
debt rating from “F-1” to “F-2” and its long-term debt rating from “A”to “BBB+,” with stable outlook. As a result of the credit ratingagencies’ actions, the Company temporarily lost access to thecommercial paper market, and borrowing costs increased. None ofthe Company’s debt agreements requires accelerated repayment inthe event of a decrease in credit ratings.
The Company maintains revolving credit facilities that havehistorically been used to support the issuance of commercial paper.At December 31, 2003, credit lines for the Company and the relatedactivity were as follows:
(in billions of dollars)
CommercialCredit Amount Paper
Type Lines Drawn Outstanding
364-day (expires July 2004) $2.5 $ — $0.3Multi-year (expires July 2006) 2.0 1.9
$4.5 $ — $2.2
The Company’s revolving credit facilities, which are for its sole use,require the maintenance of a minimum net worth of $18.2 billion. TheCompany met this covenant at December 31, 2003 and expects tocontinue to meet this covenant. The foregoing revolving creditfacilities do not include any other financial tests, any credit ratingtriggers or any provisions that could require the posting of collateral.
In addition to the above, certain international subsidiaries of theCompany maintain uncommitted credit lines to meet the short-termworking capital needs of the international businesses. These creditlines, which amounted to approximately $658 million as ofDecember 31, 2003, are for the sole use of the Company’sinternational businesses. Borrowings on these lines amounted toapproximately $220 million at December 31, 2003 and 2002.
Note 8. Long-Term Debt:
At December 31, 2003 and 2002, the Company’s long-term debtconsisted of the following:
(in millions)
2003 2002
Short-term borrowings, reclassified as long-term debt $1,900 $ 1,401
Notes, 4.00% to 7.55% (average effective rate 5.37%), due through 2035 10,256 9,053
7% Debenture (effective rate 11.32%), $200 million face amount, due 2011 157 153
Foreign currency obligations 16 117Other 37 44
12,366 10,768Less current portion of long-term debt (775) (352)
$11,591 $10,416

49
Aggregate maturities of long-term debt, excluding short-termborrowings reclassified as long-term debt, are as follows:
(in millions)
2004 $ 7752005 7372006 1,2572007 1,3982008 7022009–2013 4,502Thereafter 1,139
Based on market quotes, where available, or interest rates currentlyavailable to the Company for issuance of debt with similar terms andremaining maturities, the aggregate fair value of the Company’slong-term debt, including the current portion of long-term debt, was$12,873 million and $11,544 million at December 31, 2003 and2002, respectively.
Note 9. Capital Stock:
The Company’s articles of incorporation authorize 3.0 billion sharesof Class A common stock, 2.0 billion shares of Class B commonstock and 500 million shares of preferred stock. On December 3,2003, the Company completed a $500 million Class A commonstock repurchase program, acquiring 15,308,458 Class A sharesat an average price of $32.66 per share. On December 8, 2003,the Company commenced repurchasing shares under a new$700 million Class A common stock repurchase program. ThroughDecember 31, 2003, repurchases under the $700 million programwere 1,583,600 shares at a cost of $50 million, or $31.57 per share.
Shares of Class A common stock issued, repurchased andoutstanding were as follows:
Shares SharesShares Issued Repurchased Outstanding
Balance at January 1, 2002 555,000,000 — 555,000,000
Repurchase of shares (4,383,150) (4,383,150)
Exercise of stock options 2,000 2,000
Balance at December 31, 2002 555,000,000 (4,381,150) 550,618,850
Repurchase of shares (12,508,908) (12,508,908)
Exercise of stock options and issuance of other stock awards 3,827,182 3,827,182
Balance at December 31, 2003 555,000,000 (13,062,876) 541,937,124
In addition, 1.18 billion Class B common shares were issued andoutstanding at December 31, 2003 and 2002. Altria Group, Inc.holds 276.6 million Class A common shares and all of the Class Bcommon shares at December 31, 2003. There are no preferredshares issued and outstanding. Class A common shares are entitledto one vote each, while Class B common shares are entitled to tenvotes each. Therefore, Altria Group, Inc. holds 97.9% of thecombined voting power of the Company’s outstanding capitalstock at December 31, 2003. At December 31, 2003, 71,662,879shares of common stock were reserved for stock options and otherstock awards.
Concurrent with the IPO, certain employees of Altria Group, Inc.and its subsidiaries received a one-time grant of options to purchaseshares of the Company’s Class A common stock held by AltriaGroup, Inc. at the IPO price of $31.00 per share. In order tocompletely satisfy this obligation, Altria Group, Inc. purchased1.6 million shares of the Company’s Class A common stock inopen market transactions during 2002.
Note 10. Stock Plans:
The Company’s Board of Directors and shareholders approvedthe 2001 Kraft Performance Incentive Plan (the “Plan”), which wasestablished concurrently with the IPO. Under the Plan, the Companymay grant stock options, stock appreciation rights, restricted stock,reload options and other awards based on the Company’s Class Acommon stock, as well as performance-based annual and long-termincentive awards. A maximum of 75 million shares of the Company’sClass A common stock may be issued under the Plan. TheCompany’s Board of Directors granted options for 21,029,777 sharesof Class A common stock concurrent with the closing date of theIPO (June 13, 2001) at an exercise price equal to the IPO price of$31.00 per share. A portion of the shares granted (18,904,637)became exercisable on January 31, 2003, and will expire ten yearsfrom the date of the grant. The remainder of the shares granted(2,125,140) were scheduled to become exercisable based on totalshareholder return for the Company’s Class A common stock duringthe three years following the date of the grant, or were to becomeexercisable five years from the date of the grant. Based on totalshareholder return, one-third of these shares became exercisablein June 2002 and one-third will become exercisable in June 2006.The remaining one-third could become exercisable in June 2004 orin June 2006, depending on shareholder return. These options willalso expire ten years from the date of the grant. Shares available tobe granted under the Plan at December 31, 2003, were 51,317,940.
The Company’s Board of Directors and shareholders also approvedthe Kraft Director Plan. Under the Kraft Director Plan, awards aregranted only to members of the Board of Directors who are notfull-time employees of the Company or Altria Group, Inc., or theirsubsidiaries. Up to 500,000 shares of Class A common stock maybe awarded under the Kraft Director Plan. Shares available to begranted under the Kraft Director Plan at December 31, 2003,were 470,705.
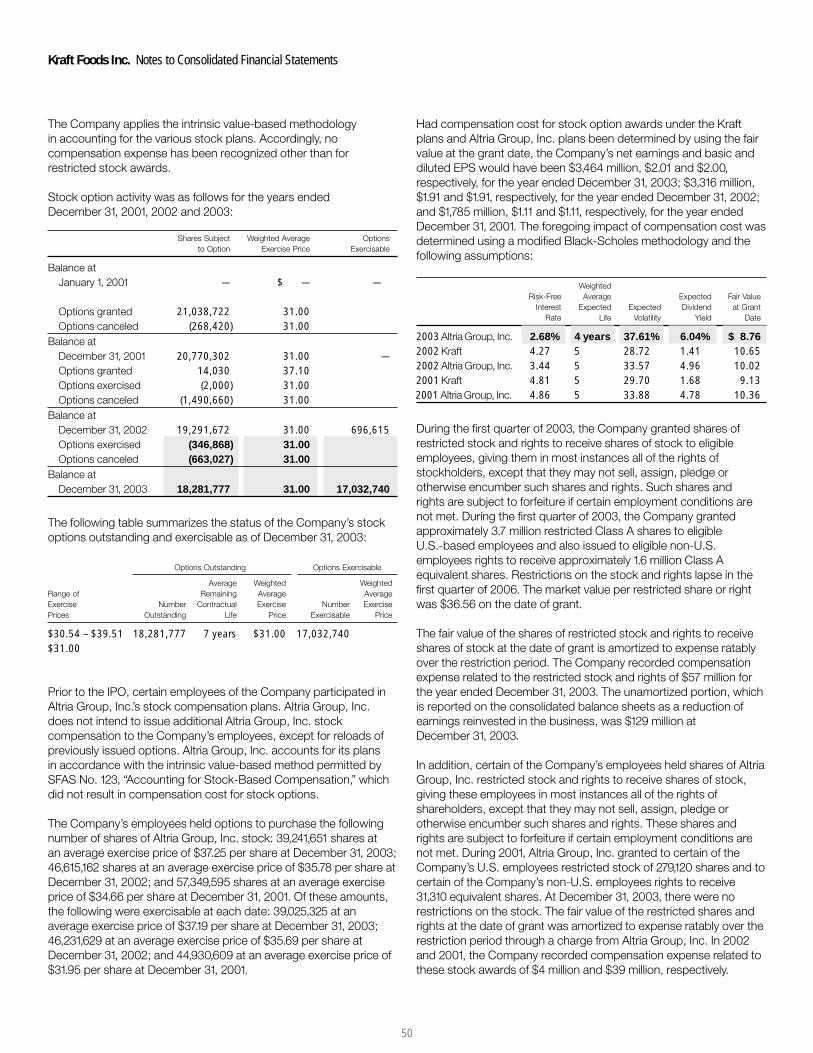
50
Kraft Foods Inc. Notes to Consolidated Financial Statements
The Company applies the intrinsic value-based methodologyin accounting for the various stock plans. Accordingly, nocompensation expense has been recognized other than forrestricted stock awards.
Stock option activity was as follows for the years endedDecember 31, 2001, 2002 and 2003:
Shares Subject Weighted Average Optionsto Option Exercise Price Exercisable
Balance at January 1, 2001 — $ — —
Options granted 21,038,722 31.00Options canceled (268,420) 31.00
Balance at December 31, 2001 20,770,302 31.00 —Options granted 14,030 37.10Options exercised (2,000) 31.00Options canceled (1,490,660) 31.00
Balance at December 31, 2002 19,291,672 31.00 696,615Options exercised (346,868) 31.00Options canceled (663,027) 31.00
Balance at December 31, 2003 18,281,777 31.00 17,032,740
The following table summarizes the status of the Company’s stockoptions outstanding and exercisable as of December 31, 2003:
Options Outstanding Options Exercisable
Average Weighted WeightedRange of Remaining Average AverageExercise Number Contractual Exercise Number ExercisePrices Outstanding Life Price Exercisable Price
$30.54 – $39.51 18,281,777 7 years $31.00 17,032,740$31.00
Prior to the IPO, certain employees of the Company participated inAltria Group, Inc.’s stock compensation plans. Altria Group, Inc.does not intend to issue additional Altria Group, Inc. stockcompensation to the Company’s employees, except for reloads ofpreviously issued options. Altria Group, Inc. accounts for its plansin accordance with the intrinsic value-based method permitted bySFAS No. 123, “Accounting for Stock-Based Compensation,” whichdid not result in compensation cost for stock options.
The Company’s employees held options to purchase the followingnumber of shares of Altria Group, Inc. stock: 39,241,651 shares atan average exercise price of $37.25 per share at December 31, 2003;46,615,162 shares at an average exercise price of $35.78 per share atDecember 31, 2002; and 57,349,595 shares at an average exerciseprice of $34.66 per share at December 31, 2001. Of these amounts,the following were exercisable at each date: 39,025,325 at anaverage exercise price of $37.19 per share at December 31, 2003;46,231,629 at an average exercise price of $35.69 per share atDecember 31, 2002; and 44,930,609 at an average exercise price of$31.95 per share at December 31, 2001.
Had compensation cost for stock option awards under the Kraftplans and Altria Group, Inc. plans been determined by using the fairvalue at the grant date, the Company’s net earnings and basic anddiluted EPS would have been $3,464 million, $2.01 and $2.00,respectively, for the year ended December 31, 2003; $3,316 million,$1.91 and $1.91, respectively, for the year ended December 31, 2002;and $1,785 million, $1.11 and $1.11, respectively, for the year endedDecember 31, 2001. The foregoing impact of compensation cost wasdetermined using a modified Black-Scholes methodology and thefollowing assumptions:
WeightedRisk-Free Average Expected Fair Value
Interest Expected Expected Dividend at Grant Rate Life Volatility Yield Date
2003 Altria Group, Inc. 2.68% 4 years 37.61% 6.04% $ 8.762002 Kraft 4.27 5 28.72 1.41 10.652002 Altria Group, Inc. 3.44 5 33.57 4.96 10.022001 Kraft 4.81 5 29.70 1.68 9.132001 Altria Group, Inc. 4.86 5 33.88 4.78 10.36
During the first quarter of 2003, the Company granted shares ofrestricted stock and rights to receive shares of stock to eligibleemployees, giving them in most instances all of the rights ofstockholders, except that they may not sell, assign, pledge orotherwise encumber such shares and rights. Such shares andrights are subject to forfeiture if certain employment conditions arenot met. During the first quarter of 2003, the Company grantedapproximately 3.7 million restricted Class A shares to eligibleU.S.-based employees and also issued to eligible non-U.S.employees rights to receive approximately 1.6 million Class Aequivalent shares. Restrictions on the stock and rights lapse in thefirst quarter of 2006. The market value per restricted share or rightwas $36.56 on the date of grant.
The fair value of the shares of restricted stock and rights to receiveshares of stock at the date of grant is amortized to expense ratablyover the restriction period. The Company recorded compensationexpense related to the restricted stock and rights of $57 million forthe year ended December 31, 2003. The unamortized portion, whichis reported on the consolidated balance sheets as a reduction ofearnings reinvested in the business, was $129 million atDecember 31, 2003.
In addition, certain of the Company’s employees held shares of AltriaGroup, Inc. restricted stock and rights to receive shares of stock,giving these employees in most instances all of the rights ofshareholders, except that they may not sell, assign, pledge orotherwise encumber such shares and rights. These shares andrights are subject to forfeiture if certain employment conditions arenot met. During 2001, Altria Group, Inc. granted to certain of theCompany’s U.S. employees restricted stock of 279,120 shares and tocertain of the Company’s non-U.S. employees rights to receive31,310 equivalent shares. At December 31, 2003, there were norestrictions on the stock. The fair value of the restricted shares andrights at the date of grant was amortized to expense ratably over therestriction period through a charge from Altria Group, Inc. In 2002and 2001, the Company recorded compensation expense related tothese stock awards of $4 million and $39 million, respectively.
51
Note 11. Earnings Per Share:
Basic and diluted EPS were calculated using the following for theyears ended December 31, 2003, 2002 and 2001:
(in millions)
2003 2002 2001
Net earnings $3,476 $3,394 $1,882
Weighted average shares forbasic EPS 1,727 1,734 1,610
Plus incremental shares fromassumed conversions:
Restricted stock and stock rights 1Stock options 2
Weighted average shares for diluted EPS 1,728 1,736 1,610
For the 2003 computation, 18 million Class A common stock optionswere excluded from the calculation of weighted average shares fordiluted EPS because their effects were antidilutive.
Note 12. Pre-tax Earnings and Provision for Income Taxes:
Pre-tax earnings and provision for income taxes consisted of thefollowing for the years ended December 31, 2003, 2002 and 2001:
(in millions)
2003 2002 2001
Pre-tax earnings:United States $3,713 $3,692 $2,282Outside United States 1,633 1,575 1,165
Total pre-tax earnings $5,346 $5,267 $3,447
Provision for income taxes:United States federal:
Current $1,011 $ 825 $ 594Deferred 153 265 299
1,164 1,090 893State and local 151 138 112Total United States 1,315 1,228 1,005Outside United States:
Current 460 628 445Deferred 91 13 115
Total outside United States 551 641 560Total provision for income taxes $1,866 $1,869 $1,565
At December 31, 2003, applicable United States federal incometaxes and foreign withholding taxes have not been provided onapproximately $3.3 billion of accumulated earnings of foreignsubsidiaries that are expected to be permanently reinvested. It is notpractical to estimate the amount of additional taxes that might bepayable on such undistributed earnings.
The effective income tax rate on pre-tax earnings differed from theU.S. federal statutory rate for the following reasons for the yearsended December 31, 2003, 2002 and 2001:
2003 2002 2001
U.S. federal statutory rate 35.0% 35.0% 35.0%Increase (decrease) resulting from:
State and local income taxes, net of federal tax benefit 1.8 1.7 2.0
Goodwill amortization 9.4Other (including reversal of taxes
no longer required) (1.9) (1.2) (1.0)Effective tax rate 34.9% 35.5% 45.4%
Rate differences from foreign operations, which are included in other,above, reduced the Company’s effective tax rate by 0.8% in 2003and 0.4% in 2001. Rate differences from foreign operations had noimpact in 2002.
The tax effects of temporary differences that gave rise to deferredincome tax assets and liabilities consisted of the following atDecember 31, 2003 and 2002:
(in millions)
2003 2002
Deferred income tax assets:Accrued postretirement and
postemployment benefits $ 809 $ 759Other 392 519Total deferred income tax assets 1,201 1,278
Deferred income tax liabilities:Trade names (3,839) (3,839)Property, plant and equipment (1,636) (1,515)Prepaid pension costs (901) (841)Total deferred income tax liabilities (6,376) (6,195)
Net deferred income tax liabilities $(5,175) $(4,917)
Note 13. Segment Reporting:
The Company manufactures and markets packaged retail foodproducts, consisting principally of beverages, cheese, snacks,convenient meals and various packaged grocery products throughKraft Foods North America, Inc. (“KFNA”) and Kraft FoodsInternational, Inc. (“KFI”). Reportable segments for KFNA areorganized and managed principally by product category. KFNA’ssegments are Cheese, Meals and Enhancers; Biscuits, Snacks andConfectionery; Beverages, Desserts and Cereals; and Oscar Mayerand Pizza. KFNA’s food service business within the United Statesand its businesses in Canada and Mexico are reported through theCheese, Meals and Enhancers segment. KFI’s operations areorganized and managed by geographic location. KFI’s segments areEurope, Middle East and Africa; and Latin America and Asia Pacific.
52
Kraft Foods Inc. Notes to Consolidated Financial Statements
The Company’s management uses operating companies income,which is defined as operating income before general corporateexpenses and amortization of intangibles, to evaluate segmentperformance and allocate resources. Interest and other debtexpense, net, and provision for income taxes are centrally managedand, accordingly, such items are not presented by segment sincethey are not included in the measure of segment profitabilityreviewed by management. The Company’s assets, which areprincipally in the United States and Europe, are managedgeographically. The accounting policies of the segments are thesame as those described in Note 2. Summary of SignificantAccounting Policies.
During the first quarter of 2003, the Company transferredmanagement responsibility of its Canadian Biscuits and Pet Snacksoperations from the Biscuits, Snacks and Confectionery segment tothe Cheese, Meals and Enhancers segment, which contains theCompany’s other Canadian businesses. Accordingly, all prior periodamounts have been reclassified to reflect the transfer. DuringJanuary 2004, the Company announced a new global organizationalstructure, which will result in new segments for financial reportingpurposes. Beginning in 2004, the Company’s new segments will beU.S. Beverages & Grocery; U.S. Snacks; U.S. Cheese, Canada &North America Foodservice; U.S. Convenient Meals; Europe, MiddleEast and Africa; and Latin America and Asia Pacific.
Segment data were as follows:
(in millions)
For the Years Ended December 31, 2003 2002 2001
Net revenues:Cheese, Meals and Enhancers $ 9,439 $ 9,172 $ 9,014Biscuits, Snacks and Confectionery 4,801 4,887 4,789Beverages, Desserts and Cereals 4,567 4,412 4,237Oscar Mayer and Pizza 3,100 3,014 2,930
Total Kraft Foods North America 21,907 21,485 20,970Europe, Middle East and Africa 7,045 6,203 5,936Latin America and Asia Pacific 2,058 2,035 2,328
Total Kraft Foods International 9,103 8,238 8,264Net revenues $31,010 $29,723 $29,234
Earnings before income taxes and minority interest:
Operating companies income:Kraft Foods North America:
Cheese, Meals and Enhancers $2,230 $2,210 $2,132Biscuits, Snacks and Confectionery 887 1,051 933Beverages, Desserts and Cereals 1,247 1,136 1,192Oscar Mayer and Pizza 556 556 539
Kraft Foods International:Europe, Middle East and Africa 1,012 962 861Latin America and Asia Pacific 270 368 378
Amortization of intangibles (9) (7) (962)General corporate expenses (182) (162) (189)
Operating income 6,011 6,114 4,884Interest and other debt expense, net (665) (847) (1,437)
Earnings before income taxes and minority interest $ 5,346 $ 5,267 $ 3,447
The Company’s largest customer, Wal-Mart Stores, Inc. and itsaffiliates, accounted for approximately 12%, 12% and 11% ofconsolidated net revenues for 2003, 2002 and 2001, respectively.These net revenues occurred primarily in the United States and wereacross all segments.
As previously noted, the Company’s international operations aremanaged by geographic location. Within its two geographic regions,KFI’s brand portfolio spans five core consumer sectors. Netrevenues by consumer sector for KFI were as follows:
Consumer Sector
(in millions)
For the Years Ended December 31, 2003 2002 2001
Snacks $3,622 $3,179 $3,077Beverages 3,124 2,832 2,900Cheese 1,302 1,202 1,208Grocery 741 752 826Convenient Meals 314 273 253
Total $9,103 $8,238 $8,264
Items affecting the comparability of the Company’s results wereas follows:
• Integration Costs and a Loss on Sale of a Food Factory—During2003, the Company reversed $13 million related to the previouslyrecorded integration charges. During 2002, the Company recordedpre-tax integration-related charges of $115 million to consolidateproduction lines in North America, close a Kraft facility and for otherconsolidation programs. In addition, during 2002, the Companyreversed $4 million related to the loss on sale of a food factory.During 2001, the Company recorded pre-tax charges of $53 millionfor site reconfigurations and other consolidation programs in theUnited States. In addition, the Company recorded a pre-tax chargeof $29 million to close a North American food factory. These itemswere included in the operating companies income of thefollowing segments:
(in millions)
For the Years Ended December 31, 2003 2002 2001
Cheese, Meals and Enhancers $(10) $ 30 $63Biscuits, Snacks and Confectionery 1 2Beverages, Desserts and Cereals (3) 56 12Oscar Mayer and Pizza 7 5Latin America and Asia Pacific 17
Integration costs and a losson sale of a food factory $(13) $111 $82
• Asset Impairment and Exit Costs—During 2003, the Companyrecorded a pre-tax charge of $6 million for asset impairment and exitcosts related to the closure of a Nordic snacks plant. During 2002,the Company recorded a pre-tax charge of $142 million related toemployee acceptances under a voluntary retirement program.Approximately 700 employees elected to retire or terminateemployment under the program. These charges were included in the
53
operating companies income of the following segments for the yearsended December 31, 2003 and 2002:
(in millions)
2003 2002
Cheese, Meals and Enhancers $ 60Biscuits, Snacks and Confectionery 3Beverages, Desserts and Cereals 47Oscar Mayer and Pizza 25Europe, Middle East and Africa $6 5Latin America and Asia Pacific 2
Asset impairment and exit costs $6 $142
• Gains on Sales of Businesses—During 2003, the Company sold aEuropean rice business and a branded fresh cheese business in Italyfor aggregate pre-tax gains of $31 million. These pre-tax gains wereincluded in the operating companies income of the Europe, MiddleEast and Africa segment. During 2002, the Company sold its LatinAmerican yeast and industrial bakery ingredients business, resultingin a pre-tax gain of $69 million, and several small food businesses,resulting in pre-tax gains of $11 million. These pre-tax gains wereincluded in the operating companies income of the followingsegments: Biscuits, Snacks and Confectionery, $8 million; and LatinAmerica and Asia Pacific, $72 million.
See Notes 4 and 5, respectively, regarding divestituresand acquisitions.
(in millions)
For the Years Ended December 31, 2003 2002 2001
Depreciation expense:Cheese, Meals and Enhancers $ 206 $ 193 $ 180Biscuits, Snacks and Confectionery 150 140 135Beverages, Desserts and Cereals 124 115 113Oscar Mayer and Pizza 62 58 55
Total Kraft Foods North America 542 506 483Europe, Middle East and Africa 223 167 158Latin America and Asia Pacific 39 36 39
Total Kraft Foods International 262 203 197Total depreciation expense $ 804 $ 709 $ 680
Capital expenditures:Cheese, Meals and Enhancers $ 226 $ 268 $ 266Biscuits, Snacks and Confectionery 193 213 162Beverages, Desserts and Cereals 184 194 202Oscar Mayer and Pizza 110 133 131
Total Kraft Foods North America 713 808 761Europe, Middle East and Africa 276 265 231Latin America and Asia Pacific 96 111 109
Total Kraft Foods International 372 376 340Total capital expenditures $1,085 $1,184 $1,101
Geographic data for net revenues, total assets and long-lived assets(which consist of all non-current assets, other than goodwill, otherintangible assets, net, and prepaid pension assets) were as follows:
(in millions)
For the Years Ended December 31, 2003 2002 2001
Net revenues:United States $19,545 $19,395 $19,193Europe 6,752 5,908 5,667Other 4,713 4,420 4,374
Total net revenues $31,010 $29,723 $29,234
Total assets:United States $44,674 $44,406 $44,420Europe 10,114 8,738 7,362Other 4,497 3,956 4,016
Total assets $59,285 $57,100 $55,798
Long-lived assets:United States $ 6,451 $ 6,382 $ 6,360Europe 2,757 2,432 2,132Other 1,831 1,596 1,668
Total long-lived assets $11,039 $10,410 $10,160
Note 14. Benefit Plans:
In December 2003, the FASB issued a revised SFAS No. 132,“Employers’ Disclosures about Pensions and Other PostretirementBenefits.” In 2003, the Company adopted the revised disclosurerequirements of this pronouncement, except for certain disclosuresabout non-U.S. plans and estimated future benefit payments whichare not required until 2004.
The Company sponsors noncontributory defined benefit pensionplans covering substantially all U.S. employees. Pension coveragefor employees of the Company’s non-U.S. subsidiaries is provided,to the extent deemed appropriate, through separate plans, many ofwhich are governed by local statutory requirements. In addition, theCompany’s U.S. and Canadian subsidiaries provide health care andother benefits to substantially all retired employees. Health carebenefits for retirees outside the United States and Canada aregenerally covered through local government plans.
The plan assets and benefit obligations of the Company’s U.S.pension plans are measured at December 31 of each year.
54
Kraft Foods Inc. Notes to Consolidated Financial Statements
Pension Plans
Obligations and Funded Status
The benefit obligations, plan assets and funded status of theCompany’s pension plans at December 31, 2003 and 2002, wereas follows:
(in millions) U.S. Plans Non-U.S. Plans
2003 2002 2003 2002
Benefit obligation at January 1 $5,245 $4,964 $2,317 $2,021Service cost 135 120 58 49Interest cost 338 339 136 120Benefits paid (398) (624) (132) (115)Settlements 29 127Actuarial losses 199 367 124 85Currency 392 144Other (2) (48) 15 13
Benefit obligation at December 31 5,546 5,245 2,910 2,317
Fair value of plan assets at January 1 4,965 6,359 1,337 1,329Actual return on plan assets 1,038 (803) 204 (56)Contributions 219 26 209 81Benefits paid (414) (636) (100) (87)Currency 216 70Actuarial (losses) gains (6) 19
Fair value of plan assets at December 31 5,802 4,965 1,866 1,337
Funded status (plan assets in excess of (less than) benefit obligations)at December 31 256 (280) (1,044) (980)Unrecognized actuarial
losses 2,292 2,558 848 682Unrecognized prior
service cost 23 13 55 50Additional minimum
liability (85) (71) (367) (288)Unrecognized net transition
obligation 7 7Net prepaid pension
asset (liability) recognized $2,486 $2,220 $ (501) $ (529)
The combined U.S. and non-U.S. pension plans resulted in a netprepaid pension asset of $1,985 million and $1,691 million atDecember 31, 2003 and 2002, respectively. These amounts wererecognized in the Company’s consolidated balance sheets atDecember 31, 2003 and 2002, as prepaid pension assets of$3,243 million and $2,814 million, respectively, for those plans inwhich plan assets exceeded their accumulated benefit obligations,and as other liabilities of $1,258 million and $1,123 million, respectively,for plans in which the accumulated benefit obligations exceededtheir plan assets.
For U.S. and non-U.S. pension plans, the change in the additionalminimum liability in 2003 and 2002 was as follows:
(in millions)
U.S. Plans Non-U.S. Plans
2003 2002 2003 2002
Increase in minimum liabilityincluded in other comprehensive earnings(losses), net of tax $(9) $(22) $(59) $(95)
The combined accumulated benefit obligation for the U.S. pensionplans was $4,898 million and $4,562 million at December 31, 2003and 2002, respectively.
At December 31, 2003 and 2002, certain of the Company’s U.S.pension plans were underfunded, with projected benefit obligations,accumulated benefit obligations and the fair value of plan assets of$261 million, $208 million and $14 million, respectively, in 2003, and$269 million, $217 million and $45 million, respectively, in 2002.The majority of these relate to plans for salaried employees thatcannot be funded under IRS regulations. For certain non-U.S.plans, which have accumulated benefit obligations in excess ofplan assets, the projected benefit obligation, accumulated benefitobligation and fair value of plan assets were $1,648 million,$1,532 million and $588 million, respectively, as of December 31,2003, and $1,375 million, $1,250 million and $424 million, respectively,as of December 31, 2002.
The following weighted-average assumptions were used todetermine the Company’s benefit obligations under the plans atDecember 31:
U.S. Plans Non-U.S. Plans
2003 2002 2003 2002
Discount rate 6.25% 6.50% 5.41% 5.56%Rate of compensation increase 4.00 4.00 3.11 3.12
55
Components of Net Periodic Benefit Cost
Net periodic pension (income) cost consisted of the following for theyears ended December 31, 2003, 2002 and 2001:
(in millions) U.S. Plans Non-U.S. Plans
2003 2002 2001 2003 2002 2001
Service cost $ 135 $ 120 $ 107 $ 58 $ 49 $ 45Interest cost 338 339 339 136 120 112Expected return
on plan assets (587) (631) (648) (146) (134) (126)Amortization:
Unrecognized net loss (gain) from experience differences 15 8 (21) 18 5 (1)Prior service cost 2 1 8 8 7 5
Other expense (income) 51 130 (12)Net pension
(income) cost $ (46) $ (33) $(227) $ 74 $ 47 $ 35
Retiring employees elected lump-sum payments, resulting insettlement losses of $51 million and $21 million in 2003 and 2002,respectively, and settlement gains of $12 million in 2001. In addition,during 2002, certain salaried employees in the United States left theCompany under a voluntary early retirement program instituted in2001. This resulted in special termination benefits and curtailmentand settlement losses of $109 million in 2002.
The following weighted-average assumptions were used todetermine the Company’s net pension cost for the year endedDecember 31:
U.S. Plans Non-U.S. Plans
2003 2002 2001 2003 2002 2001
Discount rate 6.50% 7.00% 7.75% 5.56% 5.80% 5.88%Expected rate of
return on plan assets 9.00 9.00 9.00 8.41 8.49 8.51Rate of compensation
increase 4.00 4.50 4.50 3.12 3.36 3.55
The Company’s expected rate of return on plan assets is determinedby the plan assets’ historical long-term investment performance,current asset allocation and estimates of future long-term returnsby asset class.
Kraft and certain of its subsidiaries sponsor employee savings plans,to which the Company contributes. These plans cover certainsalaried, non-union and union employees. The Company’scontributions and costs are determined by the matching ofemployee contributions, as defined by the plans. Amounts chargedto expense for defined contribution plans totaled $84 million,$64 million and $63 million in 2003, 2002 and 2001, respectively.
Plan Assets
The Company’s U.S. pension plan asset allocation at December 31,2003 and 2002, was as follows:
Percentage of Fair Value ofPlan Assets at December 31
U.S. Plans Asset Category 2003 2002
Equity securities 70% 63%Debt securities 26 32Real estate 1 1Other 3 4Total 100% 100%
The Company’s investment strategy is based on an expectation thatequity securities will outperform debt securities over the long term.Accordingly, the composition of the Company’s plan assets isbroadly characterized as a 70%/30% allocation between equity anddebt securities. The strategy utilizes indexed U.S. equity securitiesand actively managed investment grade debt securities (whichconstitute 80% or more of debt securities) with lesser allocationsto high yield and international debt securities.
The Company attempts to mitigate investment risk by rebalancingbetween equity and debt asset classes as the Company’scontributions and monthly benefit payments are made.
The Company presently plans to make contributions, to the extentthat they are tax deductible, in order to maintain plan assets inexcess of the accumulated benefit obligation of its funded U.S.plans. Currently, the Company anticipates making contributions ofapproximately $70 million in 2004, based on current tax law.However, this estimate is subject to change as a result of currenttax proposals before Congress, as well as asset performancesignificantly above or below the assumed long-term rate of returnon pension assets.
Postretirement Benefit Plans
Net postretirement health care costs consisted of the following forthe years ended December 31, 2003, 2002 and 2001:
(in millions)
2003 2002 2001
Service cost $ 41 $ 32 $ 34Interest cost 173 168 168Amortization:
Unrecognized net loss from experience differences 40 21 5
Unrecognized prior service cost (25) (20) (8)Other expense 16Net postretirement health care costs $229 $217 $199
56
Kraft Foods Inc. Notes to Consolidated Financial Statements
During 2002, certain salaried employees in the United States left theCompany under a voluntary early retirement program instituted in2001. This resulted in curtailment losses of $16 million in 2002, whichare included in other expense, above.
In December 2003, the United States enacted into law the MedicarePrescription Drug, Improvement and Modernization Act of 2003(the “Act”). The Act establishes a prescription drug benefit underMedicare, known as “Medicare Part D,” and a federal subsidy tosponsors of retiree health care benefit plans that provide a benefitthat is at least actuarially equivalent to Medicare Part D.
In January 2004, the FASB issued FASB Staff Position No. 106-1,“Accounting and Disclosure Requirements Related to the MedicarePrescription Drug, Improvement and Modernization Act of 2003”(“FSP 106-1”). The Company has elected to defer accounting forthe effects of the Act, as permitted by FSP 106-1. Therefore, inaccordance with FSP 106-1, the Company’s accumulatedpostretirement benefit obligation and net postretirement healthcare costs included in the consolidated financial statements andaccompanying notes do not reflect the effects of the Act on theplans. Specific authoritative guidance on the accounting for thefederal subsidy is pending, and that guidance, when issued, couldrequire the Company to change previously reported information.
The following weighted-average assumptions were used todetermine the Company’s net postretirement cost for the yearsended December 31:
U.S. Plans Canadian Plans
2003 2002 2001 2003 2002 2001
Discount rate 6.50% 7.00% 7.75% 6.75% 6.75% 7.00%Health care cost
trend rate 8.00 6.20 6.80 7.00 8.00 9.00
The Company’s postretirement health care plans are not funded.The changes in the accumulated benefit obligation and net amountaccrued at December 31, 2003 and 2002, were as follows:
(in millions)
2003 2002
Accumulated postretirement benefit obligation at January 1 $ 2,712 $2,436Service cost 41 32Interest cost 173 168Benefits paid (189) (199)Curtailments 21Plan amendments (28) (164)Currency 18Assumption changes 174 193Actuarial losses 54 225
Accumulated postretirement benefit obligation at December 31 2,955 2,712Unrecognized actuarial losses (1,064) (848)Unrecognized prior service cost 202 197
Accrued postretirement health care costs $ 2,093 $2,061
The current portion of the Company’s accrued postretirement healthcare costs of $199 million and $172 million at December 31, 2003 and2002, respectively, are included in other accrued liabilities on theconsolidated balance sheets.
The following weighted-average assumptions were used todetermine the Company’s postretirement benefit obligations atDecember 31:
U.S. Plans Canadian Plans
2003 2002 2003 2002
Discount rate 6.25% 6.50% 6.50% 6.75%Health care cost trend rate
assumed for next year 10.00 8.00 8.00 7.00Ultimate trend rate 5.00 5.00 5.00 4.00Year that the rate reaches
the ultimate trend rate 2006 2006 2010 2006
Assumed health care cost trend rates have a significant effect on theamounts reported for the health care plans. A one-percentage-pointchange in assumed health care cost trend rates would have thefollowing effects as of December 31, 2003:
One-Percentage- One-Percentage-Point Increase Point Decrease
Effect on total of service and interest cost 14.0% (11.2)%
Effect on postretirement benefit obligation 10.2 (8.5)
Postemployment Benefit Plans
Kraft and certain of its affiliates sponsor postemployment benefitplans covering substantially all salaried and certain hourlyemployees. The cost of these plans is charged to expense over theworking lives of the covered employees. Net postemployment costsconsisted of the following for the years ended December 31, 2003,2002 and 2001:
(in millions)
2003 2002 2001
Service cost $10 $19 $20Amortization of unrecognized net gains (5) (7) (8)Other expense 1 23Net postemployment costs $ 6 $35 $12
During 2002, certain salaried employees in the United States left theCompany under voluntary early retirement and integration programs.These programs resulted in incremental postemployment costs of$23 million, which are included in other expense, above.
57
The Company’s postemployment plans are not funded. Thechanges in the benefit obligations of the plans at December 31, 2003and 2002, were as follows:
(in millions)
2003 2002
Accumulated benefit obligation at January 1 $ 295 $ 520Service cost 10 19Benefits paid (106) (141)Actuarial (gains) losses 42 (103)
Accumulated benefit obligation at December 31 241 295Unrecognized experience gains 56 112
Accrued postemployment costs $ 297 $ 407
The accumulated benefit obligation was determined using anassumed ultimate annual turnover rate of 0.3% in 2003 and 2002,assumed compensation cost increases of 4.0% in 2003 and 2002,and assumed benefits as defined in the respective plans.Postemployment costs arising from actions that offer employeesbenefits in excess of those specified in the respective plans arecharged to expense when incurred.
Note 15. Additional Information:
(in millions)
For the Years Ended December 31, 2003 2002 2001
Research and development expense $ 380 $ 360 $ 358
Advertising expense $1,176 $1,145 $1,190
Interest and other debt expense, net:Interest expense, Altria Group, Inc.
and affiliates $ 31 $ 243 $1,103Interest expense, external debt 647 611 349Interest income (13) (7) (15)
$ 665 $ 847 $1,437
Rent expense $ 452 $ 437 $ 372
Minimum rental commitments under non-cancelable operatingleases in effect at December 31, 2003, were as follows:
(in millions)
2004 $ 3072005 2272006 1702007 1342008 113Thereafter 236
$1,187
Note 16. Financial Instruments:
Derivative financial instruments: The Company operatesglobally, with manufacturing and sales facilities in various locationsaround the world, and utilizes certain financial instruments tomanage its foreign currency and commodity exposures, whichprimarily relate to forecasted transactions. Derivative financialinstruments are used by the Company, principally to reduceexposures to market risks resulting from fluctuations in foreignexchange rates and commodity prices by creating offsettingexposures. The Company is not a party to leveraged derivativesand, by policy, does not use financial instruments for speculativepurposes. Financial instruments qualifying for hedge accountingmust maintain a specified level of effectiveness between the hedginginstrument and the item being hedged, both at inception andthroughout the hedged period. The Company formally documentsthe nature of and relationships between the hedging instrumentsand hedged items, as well as its risk-management objectives,strategies for undertaking the various hedge transactions andmethod of assessing hedge effectiveness. Additionally, for hedges offorecasted transactions, the significant characteristics and expectedterms of the forecasted transaction must be specifically identified,and it must be probable that each forecasted transaction will occur.If it was deemed probable that the forecasted transaction will notoccur, the gain or loss would be recognized in earnings currently.
The Company uses forward foreign exchange contracts and foreigncurrency options to mitigate its exposure to changes in foreigncurrency exchange rates from third-party and intercompanyforecasted transactions. Substantially all of the Company’s derivativefinancial instruments are effective as hedges. The fair value of allderivative financial instruments has been calculated based onmarket quotes. The primary currencies to which the Company isexposed, based on the size and location of its businesses, includethe euro, Swiss franc, British pound and Canadian dollar. AtDecember 31, 2003 and 2002, the Company had option and forward foreign exchange contracts with aggregate notionalamounts of $2,486 million and $575 million, respectively, whichare comprised of contracts for the purchase and sale of foreigncurrencies. The effective portion of unrealized gains and lossesassociated with forward contracts is deferred as a componentof accumulated other comprehensive earnings (losses) until theunderlying hedged transactions are reported on the Company’sconsolidated statement of earnings.
58
Kraft Foods Inc. Notes to Consolidated Financial Statements
The Company is exposed to price risk related to forecastedpurchases of certain commodities used as raw materials by theCompany’s businesses. Accordingly, the Company uses commodityforward contracts as cash flow hedges, primarily for coffee, cocoa,milk and cheese. Commodity futures and options are also used tohedge the price of certain commodities, including milk, coffee,cocoa, wheat, corn, sugar and soybean oil. In general, commodityforward contracts qualify for the normal purchase exception underSFAS No. 133 and are, therefore, not subject to the provisions ofSFAS No. 133. At December 31, 2003 and 2002, the Companyhad net long commodity positions of $255 million and $544 million,respectively. Unrealized gains or losses on net commodity positionswere immaterial at December 31, 2003 and 2002. The effectiveportion of unrealized gains and losses on commodity futures andoption contracts is deferred as a component of accumulated othercomprehensive earnings (losses) and is recognized as a componentof cost of sales in the Company’s consolidated statement ofearnings when the related inventory is sold.
Derivative gains or losses reported in accumulated othercomprehensive earnings (losses) are a result of qualifying hedgingactivity. Transfers of these gains or losses from accumulated othercomprehensive earnings (losses) to earnings are offset bycorresponding gains or losses on the underlying hedged items.During the year ended December 31, 2003, ineffectiveness related tocash flow hedges was a gain of $13 million, which was recorded incost of sales on the consolidated statement of earnings.Ineffectiveness related to cash flow hedges during the year endedDecember 31, 2002 was not material. At December 31, 2003,the Company was hedging forecasted transactions for periods notexceeding twelve months and expects substantially all amountsreported in accumulated other comprehensive earnings (losses)to be reclassified to the consolidated statement of earnings withinthe next twelve months.
Hedging activity affected accumulated other comprehensiveearnings (losses), net of income taxes, during the years endedDecember 31, 2003, 2002 and 2001, as follows:
(in millions)
2003 2002 2001
Gain (loss) as of January 1 $ 13 $(18) $ —
Derivative (gains) losses transferred to earnings (17) 21 15
Change in fair value 5 10 (33)Gain (loss) at December 31 $ 1 $ 13 $(18)
Credit exposure and credit risk: The Company is exposedto credit loss in the event of nonperformance by counterparties.However, the Company does not anticipate nonperformance,and such exposure was not material at December 31, 2003.
Fair value: The aggregate fair value, based on market quotes, ofthe Company’s third-party debt at December 31, 2003, was $13,426million as compared with its carrying value of $12,919 million. Theaggregate fair value of the Company’s third-party debt at December31, 2002, was $11,764 million as compared with its carrying value of$10,988 million. Based on interest rates available to the Company forissuances of debt with similar terms and remaining maturities, theaggregate fair value and carrying value of the Company’s long-termnotes payable to Altria Group, Inc. and its affiliates were $2,764million and $2,560 million, respectively, at December 31, 2002.
See Notes 3, 7 and 8 for additional disclosures of fair value for short-term borrowings and long-term debt.
Note 17. Contingencies:
The Company and its subsidiaries are parties to a variety of legalproceedings arising out of the normal course of business, includinga few cases in which substantial amounts of damages are sought.While the results of litigation cannot be predicted with certainty,management believes that the final outcome of these proceedingswill not have a material adverse effect on the Company’sconsolidated financial position or results of operations.
Guarantees: At December 31, 2003, the Company’s third-partyguarantees, which are primarily derived from acquisition anddivestiture activities, approximated $38 million. Substantially all ofthese guarantees expire through 2014, with $13 million expiringduring 2004. The Company is required to perform under theseguarantees in the event that a third party fails to make contractualpayments or achieve performance measures. The Company has aliability of $26 million on its consolidated balance sheet at December31, 2003, relating to these guarantees.

59
During 2003 and 2002, the Company recorded the following pre-taxcharges or (gains):
(in millions) 2003 QuartersFirst Second Third Fourth
Asset impairment andexit costs $ 6
Integration costs $(13)Gains on sales
of businesses (23) (8)$ — $ — $(17)$(21
(in millions) 2002 QuartersFirst Second Third Fourth
Asset impairment andexit costs $142
Integration costs and aloss on sale of a food factory 27 $92 $ (8)
Gains on sales of businesses (3) (77)
$169 $89 $ — $(85)
Note 18. Subsequent Event:
In January 2004, the Company announced a three-year restructuringprogram with the objective to leverage the Company’s global scale,realign and lower the cost structure and optimize capacity utilization.As part of this program, the Company anticipates the exit or closingof up to 20 plants and the elimination of approximately six thousandpositions. Over the next three years, the Company expects to incurup to $1.2 billion in pre-tax charges, reflecting asset disposals,severance and other implementation costs, including an estimatedrange of $750 million to $800 million in 2004. Approximately one-half of the pre-tax charges are expected to require cash payments.
Note 19. Quarterly Financial Data (Unaudited):
(in millions, except per share data) 2003 QuartersFirst Second Third Fourth
Net revenues $7,359 $7,841 $7,480 $8,330
Gross profit $3,010 $3,146 $2,921 $3,105
Net earnings $ 848 $ 949 $ 810 $ 869
Weighted average shares for diluted EPS 1,730 1,728 1,728 1,723
Per share data:Basic EPS $ 0.49 $ 0.55 $ 0.47 $ 0.50
Diluted EPS $ 0.49 $ 0.55 $ 0.47 $ 0.50
Dividends declared $ 0.15 $ 0.15 $ 0.18 $ 0.18
Market price—high $39.40 $33.96 $32.79 $32.50—low $26.35 $27.76 $27.60 $28.50
(in millions, except per share data) 2002 QuartersFirst Second Third Fourth
Net revenues $7,147 $7,513 $7,216 $7,847
Gross profit $2,864 $3,127 $2,971 $3,041
Net earnings $ 693 $ 901 $ 869 $ 931
Weighted average shares for diluted EPS 1,737 1,738 1,737 1,734
Per share data:Basic EPS $ 0.40 $ 0.52 $ 0.50 $ 0.54
Diluted EPS $ 0.40 $ 0.52 $ 0.50 $ 0.54
Dividends declared $ 0.13 $ 0.13 $ 0.15 $ 0.15
Market price—high $39.70 $43.95 $41.70 $41.30—low $32.50 $38.32 $33.87 $36.12
Basic and diluted EPS are computed independently for each of the periods presented. Accordingly, the sum of the quarterly EPS amounts may not agree to the total year.
The principal stock exchange, on which the Company’s Class A common stock is listed, is the New York Stock Exchange. At January 30,2004, there were approximately 2,400 holders of record of the Company’s Class A common stock.
60
Company Report on Financial Statements
The consolidated financial statements and all related financialinformation herein are the responsibility of the Company.The financial statements, which include amounts based onjudgments, have been prepared in accordance with generallyaccepted accounting principles. Other financial information in theannual report is consistent with that in the financial statements.
The Company maintains a system of internal controls that it believesprovides reasonable assurance that transactions are executed inaccordance with management’s authorization and properlyrecorded, that assets are safeguarded, and that accountability forassets is maintained. The system of internal controls is characterizedby a control-oriented environment within the Company, whichincludes written policies and procedures, careful selection andtraining of personnel, and audits by a professional staff of internalauditors.
PricewaterhouseCoopers LLP, independent auditors, have auditedand reported on the Company’s consolidated financial statements.Their audits were performed in accordance with generally acceptedauditing standards.
The Audit Committee of the Board of Directors, composedof four non-employee directors, meets periodically withPricewaterhouseCoopers LLP, the Company’s internal auditorsand management representatives to review internal accountingcontrol, auditing and financial reporting matters. BothPricewaterhouseCoopers LLP and the internal auditors haveunrestricted access to the Audit Committee and may meetwith it without management representatives being present.
Kraft Foods Inc. Report of Independent Auditors
To the Board of Directors and Shareholders of Kraft Foods Inc.:
In our opinion, the accompanying consolidated balance sheetsand the related consolidated statements of earnings, shareholders’equity and cash flows present fairly, in all material respects, theconsolidated financial position of Kraft Foods Inc. and itssubsidiaries (the “Company”) at December 31, 2003 and 2002,and the consolidated results of their operations and their cash flowsfor each of the three years in the period ended December 31, 2003,in conformity with accounting principles generally accepted in theUnited States of America. These financial statements are theresponsibility of the Company’s management; our responsibility isto express an opinion on these financial statements based on ouraudits. We conducted our audits of these statements in accordancewith auditing standards generally accepted in the United States ofAmerica, which require that we plan and perform the audit to obtainreasonable assurance about whether the financial statements arefree of material misstatement. An audit includes examining, on a testbasis, evidence supporting the amounts and disclosures in thefinancial statements, assessing the accounting principles used andsignificant estimates made by management, and evaluating theoverall financial statement presentation. We believe that our auditsprovide a reasonable basis for our opinion.
As discussed in Note 2 to the consolidated financial statements,on January 1, 2002, the Company adopted Statement ofFinancial Accounting Standards No. 142, “Goodwill and OtherIntangible Assets.”
PricewaterhouseCoopers LLP
Chicago, IllinoisJanuary 23, 2004
61
Kraft Foods Inc. Board of Directors and Officers
Board of Directors
Louis C. CamilleriChairman of the Board, Kraft Foods Inc.,and Chairman and Chief Executive Officer,Altria Group, Inc.
Roger K. DeromediChief Executive Officer,Kraft Foods Inc.
Dinyar S. DevitreSenior Vice President andChief Financial Officer,Altria Group, Inc.
W. James Farrell 1,2
Chairman and Chief Executive Officer,Illinois Tool Works Inc.Glenview, IL
Betsy D. HoldenPresident, Global Marketing &Category DevelopmentKraft Foods Inc.
John C. Pope 1,2
Chairman,PFI Group, LLCChicago, IL
Mary L. Schapiro 1,2
Vice Chairman, NASD, Inc. President, Regulatory Policy and OversightWashington, D.C.
Charles R. WallSenior Vice President and General CounselAltria Group, Inc.
Deborah C. Wright 1,2
President and Chief Executive Officer,Carver Bancorp, Inc.New York, NY
Committees
1 Member of Compensation and
Governance Committee
W. James Farrell, Chair
2 Member of Audit Committee
John C. Pope, Chair
Kraft Foods Executive Team
Roger K. DeromediChief Executive Officer
Betsy D. HoldenPresident, Global Marketing &Category Development
David S. JohnsonPresident, North America Commercial
Hugh H. RobertsPresident, International Commercial
James P. DolliveExecutive Vice President & Chief Financial Officer
Terry M. FaulkExecutive Vice President, Global Human Resources
Marc S. FirestoneExecutive Vice President, General Counsel &Corporate Secretary
Alene M. KorbyExecutive Vice President &Chief Information Officer
Michael MuddExecutive Vice President, Global Corporate Affairs
David G. OwensExecutive Vice President, Global Strategy &Business Development
Jean E. SpenceExecutive Vice President, Global Technology & Quality
Franz-Josef VogelsangExecutive Vice President, Global Supply Chain
62
Kraft Foods Inc. Corporate and Shareholder Information
Kraft Foods Inc.Three Lakes DriveNorthfield, IL 60093-2753www.kraft.com
Shareholder Services
Transfer Agent and RegistrarEquiServe Trust Company, N.A., our shareholder services andtransfer agent, will be happy to answer questions about youraccounts, certificates or dividends.
U.S. and Canadian shareholders may call: 1-866-655-7238
From outside the U.S. or Canada, shareholders may call:1-781-575-3500
Postal address:EquiServe Trust Company, N.A.P.O. Box 43069Providence, RI 02940-3069
E-mail address:[email protected]
To eliminate duplicate mailings, please contact EquiServe (if you are a registered shareholder) or your broker (if you hold your stock through a brokerage firm).
Shareholder PublicationsKraft Foods Inc. makes a variety of publications and reportsavailable to its shareholders. These include the Annual Report,proxy statement, news releases and other publications. For copies, please visit our website at: www.kraft.com.
Legal FilingsKraft Foods Inc. also makes a variety of legal filings (10-K, 10-Q)available to its shareholders free of charge and as soonas practicable. For copies, please visit our website atwww.kraft.com and click on SEC filings in the Investors section.
If you do not have Internet access, you can call our Shareholder Publications Center toll-free: 1-800-295-1255.
Stock Exchange ListingKraft Foods Inc. is listed on the New York Stock Exchange (ticker symbol KFT).
2004 Annual MeetingThe Annual Meeting of Shareholders will be held at 9:00 a.m. EDT on Tuesday, April 27, 2004, at Kraft Foods Inc.,Robert M. Schaeberle Technology Center, 188 River Road, East Hanover, NJ 07936. For further information, call toll-free: 1-800-295-1255.
Independent AuditorsPricewaterhouseCoopers LLPOne North Wacker DriveChicago, IL 60606-2807
TrademarksTrademarks and service marks in this report are the registeredproperty of or licensed by the subsidiaries of Kraft Foods Inc. and are italicized or shown in their logo form.
Internet Access Helps Reduce CostsAs a convenience to shareholders and an important cost-reduction measure, you can register to receive futureshareholder materials (i.e., Annual Report and proxy statement) via the Internet. Shareholders also can vote their proxy via theInternet. For complete instructions, visit www.kraft.com.
C Printed in the U.S.A. on Recycled
Paper
© Copyright 2004 Kraft Foods Inc.
Concept and design: Genesis, Inc.


Delivering sustainable growth.
www.kraft.com