Korean Miracle
28
Export Led Industrialisation and Growth – Korea’s Economic Miracle 1962-89 Charles Harvie and Hyun-Hoon Lee WP 03-01 University of Wollongong Economics Working Paper Series 2003 http://www.uow.edu.au/commerce/econ/wplist.html
-
Upload
patishipete -
Category
Documents
-
view
235 -
download
0
Transcript of Korean Miracle

8/6/2019 Korean Miracle
http://slidepdf.com/reader/full/korean-miracle 1/27
Export Led Industrialisation and Growth – Korea’s
Economic Miracle 1962-89
Charles Harvie
and
Hyun-Hoon Lee
WP 03-01
University of WollongongEconomics Working Paper Series
2003http://www.uow.edu.au/commerce/econ/wplist.html

8/6/2019 Korean Miracle
http://slidepdf.com/reader/full/korean-miracle 2/27
EXPORT LED INDUSTRIALISATION AND GROWTH-KOREA’S ECONOMIC MIRACLE 1962-89
by
Charles HarvieDepartment of EconomicsUniversity of Wollongong
WollongongNSW Australia
Tel.: +61 2 42 213702Fax.: +61 2 42 213725
Email: [email protected]
and
Hyun-Hoon LeeDivision of Economics and International Trade
Kangwon National University
Chuncheon, 200-701 South Korea
Tel.: +82 (0)33 250 6186
Fax.: +82 (0)33 257 2271Email: [email protected]
Abstract
The period 1962-89 witnessed a remarkable transformation of the South Korean economy, from
being poverty ridden to the attainment of the status of newly industrialised nation. Thistransformation was achieved through the adoption of an outward oriented industry led strategy,based, particularly during the period of the 1970s, upon the development of large-scale industrial
conglomerates and the attainment of economies of scale and technology to achieve internationalcompetitiveness. By the early 1980s this strategy had resulted in major structural imbalances, a
weakened financial section, heavy concentration in domestic markets, and a represseddevelopment of small and medium enterprises. By the end of the 1980s, despite attempts ateconomic reform during this decade, the structural and financial problems remained which were toprove the country’s undoing during the financial and economic crisis of 1997-98.
This issue of whether Korea’s performance during this period can be described as an economicmiracle is also reviewed. The empirical evidence on this issue is mixed and no conclusive evidence
can be drawn. However, despite this, the achievements of the Korean economy during the periodunder discussion should not be underestimated.

8/6/2019 Korean Miracle
http://slidepdf.com/reader/full/korean-miracle 3/27
1
1. Introduction
Following the devastation of the Korea War (1950-53) South Korea was one of the poorestcountries in the world 1 . During the period 1953 to 1961 the economy experienced a slowrecovery from the war, considerable dependence upon assistance from the US, an economic
policy focused on import substitution, and massive investment in education. While the emphasison import substitution was a mistake, private and public investment in education would laterprovide a well-educated labour force that would form the backbone of the labour intensive
industries developed from the early 1960s. Even in 1960, after the damage inflicted during thewar had been repaired, Korea’s per capita income was still only US$79 in current prices, muchlower than that of most of its neighbouring countries. Few, if any, observers at this time were
optimistic about an improvement in Korea’s poverty stricken economy (see for example Song(1990), p.57 and Tae (1972), pp.40-41).
With the beginning of the First Five-Year Plan (1962-66), however, a remarkable transformationof the economy took place that was to catapult Korea to the status of Newly IndustrialisingCountry (NIC) by 1970 (Song (1990), p.1) 2. Over the longer period 1962-89 per capita income
increased from US$87 to US$5,199, the economy’s GDP expanded from US$2.3 billion toUS$220.7 billion, and exports increased from US$55 million to US$61.4 billion. Thenormalisation of relations with Japan in 1965, fiscal and financial reforms in the mid 1960s aimed
at maintaining stabilisation of the economy, supplying materials for the Vietnam War, the MiddleEast construction boom in the 1970s, low oil prices, a cheap US dollar, and low interest rates inthe late 1980s, all facilitated this rise (Song (1990), p.1). The period of the 1960s and 1970s in
particular were also characterised by a favourable international environment for economicdevelopment. The US led free trade environment of the 1960s and 1970s based on the IMF andthe GATT system gave a boost to Korea’s development policy. Korea continued its rapid growth
during the 1970s despite the two oil crises, and by the late 1980s had joined the highest incomedeveloping countries group. An economic ‘miracle on the River Han’3 appeared to have occurred.
The paper examines the major factors behind this remarkable transformation of the economy,during the period 1962-89, and in doing so proceeds as follows. Section 2 overviewsdevelopments in key macroeconomic variables during the period Section 3 focuses upon the
features of Korea’s rapid growth, its pattern, and sources, business cycles, and related issues.Section 4 conducts an overview of Korea’s economic performance in the context of the ‘Asianeconomic miracle’. Finally, section 5 presents a summary of the major conclusions from this
paper.
1 The war cost the lives of over 1 million people and destroyed about half of the country’s infrastructure. It alsodestroyed traditional authority and class barriers, as well as traditional habits, making it easier to lay thefoundation for a more modern economy (Song (1990), p.3). A legacy of the war was the requirement by the Southto spend some 6 percent of its GNP on defence, to maintain the fifth largest standing army in the world (Lee
(1968)).2 By this year the South had also overtaken the North in terms of per capita income.3 The Han river is the major river running through Seoul, the capital city of South Korea.

8/6/2019 Korean Miracle
http://slidepdf.com/reader/full/korean-miracle 4/27
2
2. Korea’s economic performance 1962-894
2.1 Overview
A remarkable transformation of the economy began with the introduction of the First Five Year
Plan (1962-66) (see Table 1). Over the period 1962-89 the economy achieved: an average annualreal GDP growth rate of 8.5 percent; per capita income increased from US$87 to US$5,199;
GDP in current prices increased from US$2.3 billion to US$220.7 billion; the savings rateincreased from 3.3 percent to 35.4 percent; the investment rate increased from 12.8 percent to35.9 percent; and the rate of unemployment fell from 9.8 percent to 2.6 percent. In terms of
external developments the trade balance was in deficit by US$335 million in 1962 but was insurplus by US$4.6 billion 1989; exports were a negligible US$55 million in 1962 but a sizableUS$61.4 billion in 1989. The country’s foreign debt, however, increased from US$157 million in
1963 to over US$3 billion by 1989. Within a single generation the country was transformed frombeing heavily dependent upon foreign aid in the early 1960s, to becoming self sufficient in terms
of its own funding requirements by the end of 1986. The remainder of this section is devoted toanalysing the development of these key macroeconomic variables.
2.2 Growth pattern and characteristics
During the period 1962-89 Korea’s high growth slumped badly only once – in 1980 – due to thesocio-political unrest following the assassination of President Park Chung Hee in October 1979
and the subsequent re-establishment of military rule in May 1980, compounded by the worstharvest since 1962 and the second global oil price hike. A number of factors accounted for theoverall rapid and sustained growth of the economy: the adoption of a growth strategy focusing
upon exports; the development of growth promoting institutions and public policies; high quality
workers and entrepreneurs; a technological backlog available to Korea as a latecomer; efficientusage of public resources for infrastructure development and education; population control; the
capacity of entrepreneurs and policy makers to adjust rapidly and flexibly to external shocks; andmaintenance of a relatively equitable income distribution.
A number of key characteristics of Korea’s growth can be identified. First, the rapidtransformation to high economic growth was primarily initiated by an expansion of exports (Song(1990), p.58, Lee (1996), p.18, Smith (2000a), p.60), sustained by the growth of export
industries, the provision of investment resources through the government’s active involvement inthe market, and macroeconomic stabilization measures.
4
The year 1989 was a watershed year for Korea for three main reasons. First, per capita GDP attained theUS$5,000 level in 1989 for the first time in history. Second, four consecutive years of current account surplusesended in 1989. Third, the country officially graduated in 1989 from the status of a developing country at GATT.

8/6/2019 Korean Miracle
http://slidepdf.com/reader/full/korean-miracle 5/27
3
Table 1 Major indicators of Korean economic growth 1960-89
GDP per GDP Real GDP CPI Savings Investment Trade Exports Foreign Unemploy.Exchange
capita (US$b) growth (%) ratio ratio balance (US$m) debt rate (%) rate
(US$)* rate (%) (%) (%) (US$ m) (US$m.) (won/US$)
1960 79 2 1.2 na 0.8 10.9 -273 33 - 11.7 65
1961 82 2.1 5.9 na 2.8 13.2 -242 41 - 12.7 130
1962 87 2.3 2.1 na 3.3 12.8 -335 55 - 9.8 130
1963 100 2.7 9.1 na 8.7 18.1 -410 87 157 8.2 130
1964 103 2.9 9.7 na 8.7 14.0 -245 120 177 7.7 256
1965 105 3 5.7 na 7.4 15.0 -241 175 206 7.4 272.1
1966 125 3.6 12.2 12 11.8 21.6 -430 250 392 7.1 271.5
1967 142 4.2 5.9 10.7 11.4 21.9 -574 335 645 6.2 274.6
1968 169 5.2 11.3 11.3 15.1 25.9 -836 486 1199 5.1 281.5
1969 210 6.5 13.8 11.6 18.8 28.8 -992 658 1800 4.8 304.5
1970 248 8 8.8 16.9 16.2 24.6 -992 882 2245 4.5 316.7
1971 286 9.4 8.6 12.2 14.5 25.1 -1044 1133 2922 4.5 373.2
1972 316 10.6 4.9 11.9 15.7 20.9 -574 1676 3589 4.5 398.9
1973 396 13.5 12.3 3.5 21.4 24.7 -566 3284 4260 4 397.5
1974 542 18.8 7.4 24.8 19.3 31.8 -1938 4516 5937 4.1 484
1975 598 21.1 6.5 24.7 16.9 27.5 -1671 5003 8456 4.1 484
1976 806 28.9 11.2 15.4 22.2 25.7 -590 7814 10533 3.9 484
1977 1019 37.1 10 10 25.4 27.7 -477 10046 12648 3.8 4841978 1407 52 9 14.7 27.3 31.9 -1780 12711 14871 3.2 484
1979 1649 61.9 7.1 18.5 26.5 36 -4395 14705 20287 3.8 484
1980 1632 62.2 -2.1 28.7 20.8 32.1 -4384 17214 27170 5.2 659.9
1981 1797 69.6 6.5 21.3 20.5 30.3 -3849 20747 32433 4.5 700.5
1982 1892 74.4 7.2 7.1 20.9 28.6 -2827 20934 37083 4.4 748.8
1983 2062 82.3 10.7 3.4 25.3 29.9 -1849 23272 40378 4.1 795.5
1984 2242 90.6 8.2 2.2 27.9 31.9 -1089 26486 43053 3.8 827.4
1985 2289 93.4 6.5 2.3 28.6 31.1 -19 26442 46729 4 890.2
1986 2611 107.6 11 2.8 32.8 30.2 4299 34128 44500 3.8 861.4
1987 3248 135.2 11 3.1 36.8 37.7 7529 46560 35600 3.1 792.3
1988 4302 180.8 10.5 7.1 38.6 39.1 11283 59973 31500 2.5 684.1
1989 5199 220.7 6.1 5.7 35.4 35.9 4597 61408 2.6 680
* GNP per capita before 1970
Notes: GNP and GNP per capita are in current prices. The rate of inflation is based on the GNP deflator. The rate of
interest rate on time deposits for the period of one or more years.
Sourc Song (1990), pp. 60-61
Bank of Korea (http://www.bok.or.kr)
National Statistical Office (http://www.nso.go.kr)

8/6/2019 Korean Miracle
http://slidepdf.com/reader/full/korean-miracle 6/27
4
Where investment could not be provided by the private sector alone, particularly during the earlystages of economic development, the government used its own investment resources for the
construction of key industries and for the formation of social overhead capital. Many exportindustries, and indeed the economy as a whole during the early stages of its development, wassubject to extensive involvement by the government, and the country’s initial export expansion
was effectively ‘forced’ by the actions of the government (Song (1990), p.58). The basicphilosophy of the Park Chung Hee government was “exports first”, or “nation building throughexport promotion”. Attaining ambitious government set export targets, and then exceeding these
targets, was regarded as the height of achievement for businessmen and public officials in chargeof export promotion. Larger Korean firms were assigned annual export targets by officials in theMinistry of Trade and Industry, and were seen by these firms as virtual orders or assigned
missions. If they succeeded in fulfilling their export goals they obtained numerous benefitsreserved for exporters, including preferential credit and loans, administrative support, tax andother benefits. Thus Korean exporters saw the over-fulfillment of their export targets – usually
determined jointly with the government – as the keystone of their business strategy. By the 1970s,however, increased focus was given to the development of import substituting strategic heavy andchemical industries (HCIs), as well as maintaining the export growth of light manufactured
industries and the development of new heavy goods exports. The 1980s saw a refocusing upontrade liberalization including an opening up of domestic markets and a reduction in exportsubsidies, arising from pressure from trading partners.
Second, the country experienced high but volatile economic growth. Economic fluctuations in the1950s had not been extreme, in part because year-to-year fluctuations, in the then largelyagricultural economy, reflected only variations in crop yields due to such things as the weather.
Such fluctuations were not extreme because of a stable climate and extensive irrigation. With thedecrease in the relative weight of agriculture, and the rise in the proportion of the manufacturing
and services industries, in GDP, the nature of the fluctuations changed and tended to becomelarger and more unpredictable. From the 1960s, because of the growth first development policy,the economy experienced more year-to-year fluctuations. Since the scale of the Korean economywas relatively small well into the 1970s, the growth rate was also susceptible to large fluctuations
caused by construction phases in large investment projects. The economy’s outward orientationalso exposed it to fluctuations from oil price hikes and other external influences. The inexperienceof policy makers, especially during the 1960s, also contributed to economic fluctuations.
Third, many Korean industries were initially developed on the basis of the export first principle.This strategy resulted in Korean firms marketing their products in overseas markets rather than in
domestic markets, as in the case of the colour TV industry. As the domestic sale of colour TVswas not allowed until 1980, colour TV manufacturing firms had to sell their products in overseasmarkets. Other examples included industries producing high value items such as phonographs,
portable telephones, and mink coats. Korea’s export first principle of industrial expansion was indirect contrast with the Japanese pattern of industrial growth, which was based on the domesticmarket first principle. Because of the forced nature of the growth of many industries in Korea, the
share of manufacturing in GDP was larger than the average or normal level in other countries.Also, the shift in the production structure from agriculture to manufacturing in Korea was fasterthan the pattern typically observed in other developing or developed countries. In the 1970s
greater focus was placed upon the development of strategic HCIs, which further contributed tothe rapid growth of the country’s industrial conglomerates. Increased structural imbalance in the
economy by the 1980s between sectors and size of enterprises contributed to greater emphasis onthe need to reduce market concentration, increase competition and encourage the growth of small

8/6/2019 Korean Miracle
http://slidepdf.com/reader/full/korean-miracle 7/27
5
and medium enterprises.
Fourth, as the expansion of industrial capacity tended to be excessive, the amount of domesticinvestment generally exceeded the amount of domestic savings (see Table 1). In addition, much of this domestic saving was diverted into real estate as a hedge against high inflation. Hence, the
level of available domestic saving in Korea was lower than that required to meet the productiveinvestment needs of the country. This gap had to be filled through foreign borrowing, and this,along with the need to import oil and many other industrial raw materials, explains why Korea’s
foreign debt continued to rise until 1985 (see Table 1). The amount of foreign capital inflow intoKorea was higher than that for other countries at a similar stage of economic development (seeTable 2). Also, the debt to equity ratio of large Korean firms, forced to over-expand their
production and export capacity, tended to be higher than that of other Asian newly industrialisedcountries (NICs). Korean growth was, therefore, characterised by domestic investment exceedingdomestic savings, a high debt-equity ratio for most firms, and a large foreign debt.
Fifth, since for much of the period under discussion the priority of policy was the expansion of exports, and HCI industries, investment in social overhead capital received low priority and
usually lagged far behind investment in directly productive activities. This was exacerbated byinsufficient investment resources and relatively high defence expenditures5. Korean industries,therefore, grew in the face of shortages and bottlenecks with respect to infrastructure resources.
The Korean economy’s growth, therefore, occurred due to investments in directly productiveactivities rather than in social overhead facilities. It was not until the second half of the 1980s thatKorea’s social capital expenditure was expanded sharply as a result of the preparation for the
1988 Olympic Games.
Sixth, the expansion of industrial capacity in Korea was achieved through an expansion of existing
firms rather than through the creation of new firms. This pattern persisted for over two decadesand resulted in the growth of a small number of very large firms and business conglomerates(chaebols), causing a large gap between large and small firms. The market concentration ratio in
Korea was much higher than in either of its regional neighbours, Japan or Taiwan. In Japangrowth was based on a significant number of very large firms as well as a large number of smallfirms, while in Taiwan emphasis was placed on the development of small firms. Hence the Korean
economy may be called a large firm economy, in contrast to the small firm economy of Taiwan orthe bi-polar economy of Japan. As discussed below the government attempted to restrain marketconcentration during the period of the 1980s in order to reverse the structural imbalance between
large and small enterprises.
Seventh, Korean growth was accompanied by trade and balance of payments deficits until 1985
(see Tables 1 and 2). This was caused, to some extent, by Korea’s resource poverty, butprincipally due to the policy of allowing exporting companies to import raw materials, parts, andmachinery required for the production of export goods on a large scale. This has been called a
negative import substitution policy because exporting firms tried to import as much as possible.From 1986, however, the trade and international balance of payments turned positive and Koreachanged from a young debtor nation to a mature debtor nation.
Eighth, during its period of rapid economic development Korea experienced sharply fluctuatingwholesale and consumer prices (see Table 1). Indeed from the early 1960s until 1981 Korea had
5 Since no peace treaty was signed after the war the South remained technically at war with the North.

8/6/2019 Korean Miracle
http://slidepdf.com/reader/full/korean-miracle 8/27
6
the highest inflation rate among the Asian NICs. This was especially true when the economy washit by: oil price hikes; poor harvests; changes in government; and high levels of investment and
capacity building. This high inflation was mainly due to an excessive expansion of demandassociated with a rapid expansion of industrial capacity and the abnormal, compulsory, expansionof exports. The aggressive export promotion and growth policy necessitated that the economy
had to consistently perform far beyond normal capacity, resulting in the forced expansion of investment and output. This was particularly prevalent during the HCI drive of the 1970s. Overlyambitious investment plans caused the inflationary financing of investment. Excessive investment
demand was, therefore, one of the links between the forced export growth strategy and the highinflation that persisted until 1982.
The adverse consequences arising from this inflation were considerable. First, the high inflationimpacted upon income distribution by redistributing wealth from creditors to debtors. Second, thehigh inflation rate often outstripped the government set bank interest rate, resulting in negative
real rates. This encouraged many Koreans, individuals and businesses, to divert their savings fromfinancial institutions to real estate, and significantly contributed to the reason why domesticsavings were insufficient to meet domestic investment requirements during the period of rapid
growth6. Third, high inflation contributed to an expansion of the unorganised credit market, or‘curb market’, which in turn came to have a major role in mobilising and allocating investmentfunds.
Price stability was finally achieved in Korea from 1982. Inflation was reduced from well over 20percent per year during 1980-81 to 7 percent in 1982, remained at under 3.5 percent between
1983-87, before increasing to around 6-7 percent by 1988-89. The control of inflation after 1982was due to both domestic and foreign factors. First, import costs fell due to the three lows,namely low energy and raw materials prices, a depreciation of the US dollar, and low interest
rates. Second, the government shifted the direction of development from growth to stability.Finally, labour productivity growth began to outstrip the growth of wages.
6 Despite this the domestic savings ratio, although starting from a low base of 3.3 percent in 1962, grew rapidly to15.7 percent in 1972, to 20.9 percent in 1982, and to 35.4 percent in 1989 (see Table 1).
8/6/2019 Korean Miracle
http://slidepdf.com/reader/full/korean-miracle 9/27
7
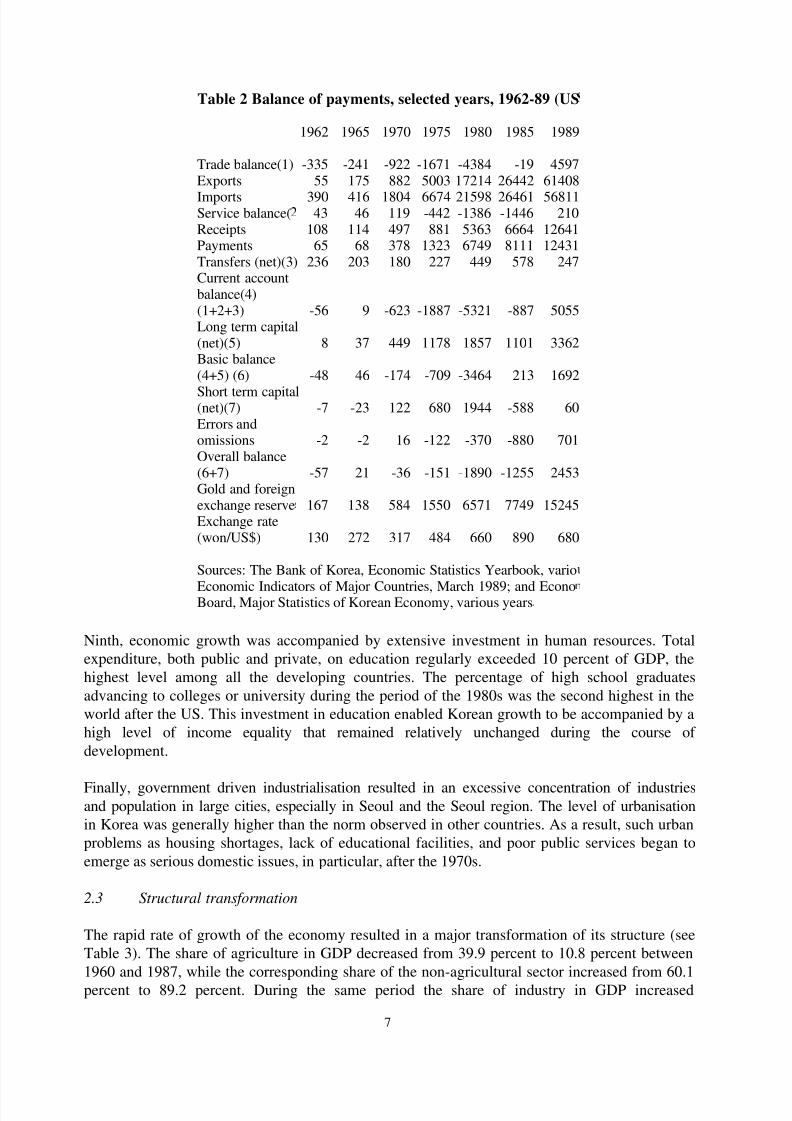
Table 2 Balance of payments, selected years, 1962-89 (US
1962 1965 1970 1975 1980 1985 1989
Trade balance(1) -335 -241 -922 -1671 -4384 -19 4597Exports 55 175 882 5003 17214 26442 61408
Imports 390 416 1804 6674 21598 26461 56811Service balance( 43 46 119 -442 -1386 -1446 210Receipts 108 114 497 881 5363 6664 12641Payments 65 68 378 1323 6749 8111 12431Transfers (net)(3) 236 203 180 227 449 578 247Current accountbalance(4)(1+2+3) -56 9 -623 -1887 -5321 -887 5055Long term capital(net)(5) 8 37 449 1178 1857 1101 3362Basic balance(4+5) (6) -48 46 -174 -709 -3464 213 1692Short term capital(net)(7) -7 -23 122 680 1944 -588 60Errors andomissions -2 -2 16 -122 -370 -880 701Overall balance(6+7) -57 21 -36 -151 -1890 -1255 2453Gold and foreignexchange reserve 167 138 584 1550 6571 7749 15245Exchange rate(won/US$) 130 272 317 484 660 890 680
Sources: The Bank of Korea, Economic Statistics Yearbook, varioEconomic Indicators of Major Countries, March 1989; and EconoBoard, Major Statistics of Korean Economy, various years
Ninth, economic growth was accompanied by extensive investment in human resources. Totalexpenditure, both public and private, on education regularly exceeded 10 percent of GDP, thehighest level among all the developing countries. The percentage of high school graduates
advancing to colleges or university during the period of the 1980s was the second highest in theworld after the US. This investment in education enabled Korean growth to be accompanied by ahigh level of income equality that remained relatively unchanged during the course of
development.
Finally, government driven industrialisation resulted in an excessive concentration of industries
and population in large cities, especially in Seoul and the Seoul region. The level of urbanisationin Korea was generally higher than the norm observed in other countries. As a result, such urbanproblems as housing shortages, lack of educational facilities, and poor public services began to
emerge as serious domestic issues, in particular, after the 1970s.
2.3 Structural transformation
The rapid rate of growth of the economy resulted in a major transformation of its structure (seeTable 3). The share of agriculture in GDP decreased from 39.9 percent to 10.8 percent between
1960 and 1987, while the corresponding share of the non-agricultural sector increased from 60.1percent to 89.2 percent. During the same period the share of industry in GDP increased

8/6/2019 Korean Miracle
http://slidepdf.com/reader/full/korean-miracle 10/27
8
significantly from 18.6 to 43.2 percent. The structure of industrial output reflected two factors.First, the country’s poor resource endowment, with the mining sector, for example, contributing
at its peak only 2.3 percent of GDP in 1960. Second, the significance of manufacturing sectorgrowth over the period 1960-87 arising from the export oriented growth strategy. Thecontribution of the manufacturing sector to GDP was only 12.1 percent in 1960 rising to 31.6
percent by 1987, with this latter figure being much higher than the average 23 percent observablein advanced economies. The growth of the manufacturing sector, and its contribution to GDP, isthe most noticeable feature over this period.
3 Korea’s growth and trade promotion strategy
The major driving force behind the take off of economic growth was the adoption of an outwardlooking industrialization strategy based on export promotion from the mid 1960s. The context for
this strategy, its stages and the evolving policy environment are now discussed.
3.1 Korea’s development legacy
Korea’s period of rapid economic growth, with its associated structure and distortions, wasprofoundly shaped by a number of social and historical developments (see, for example, Song(1990) and Amsden (1989)). These are: the country’s Confucian emphasis on education and
discipline; the legacy from the period of Japanese colonial rule (1910-1945); and the division of the country into North and South following the truce of July 1953. The latter two are now brieflydiscussed.
Japan formally colonised Korea from 1910-45, but even before this time it had already introduced
a series of measures into traditional Korea that initiated the transformation of the country botheconomically and socially (see Amsden (1989)). During the period of colonization of the Koreaneconomy the beneficiaries of its economic expansion was chiefly Japan and Japanese settlers inKorea. Although the growth rate of the Korean economy during the whole colonial period was
nearly 4 percent per annum, in absolute terms the well being of ordinary Koreans worsened.Gross Domestic Product per capita increased remarkably, but Gross National product per capitafor Koreans actually decreased. With liberation from the Japanese in 1945 the Koreans were,
therefore, left in dire poverty.

8/6/2019 Korean Miracle
http://slidepdf.com/reader/full/korean-miracle 11/27
9
Table 3 The Changing Structure of Production, 1960-87
(percentage distribution of GDP in current prices)
Sector 1960 1965 1970 1975 1980 1987
1. Agriculture 39.9 41 31.1 27.8 14.6 10.8
2. Industry 18.6 24.1 28.4 33.1 41.4 43.2
Mining 2.3 2 1.3 1.5 1.4 0.7
Manufacturing 12.1 17.3 19.1 25.3 29.6 31.6
Construction 3.5 3.6 6.4 4.9 8.2 8.1
Utilities 0.7 1.2 1.6 1.4 2.1 2.8
3. Services 41.5 34.9 40.5 39.1 44 46
Total (GDP) 100 100 100 100 100 100
Note: Sector classification is based on the World Bank method
suggested in World Bank, World Development Report, 1987, 1988
Sources: The Bank of Korea, Economic Statistics Yearbook, 1978,
1989 and New National Accounts, 1986.
The deterioration of the Korean people’s economic welfare during the colonial period can betraced to a number of factors (see Song (1990)). First, Korea was regarded by the Japanese as asource of cheap rice. Japanese landowners in Korea during the 1912-31 period shipped about half
the country’s total rice production to feed Japan’s growing industrial workforce (Choi (1984)).Since a large fraction of Korea’s agricultural output was shipped to Japan, real per capitaconsumption by Koreans actually fell during the last decade of the colonial period. Second, thecountry’s other resources, such as timber, fishing and mining were exploited for the benefit of the
Japanese economy and not the Korean economy. Third, Korea was used to settle Japan’s surpluspopulation, and given the best jobs in Korea. The number of Japanese in Korea increased from170,000 to 770,000 between 1910 and 1945. Fourth, the Japanese used cheap workers from
Korea for the development of Japanese mining and manufacturing industries. Skilled workers
were also transferred to work in Japan. Fifth, Japan used Korea as a base for military training, andforcibly drafted young Koreans into the Japanese army. Sixth, Koreans were generally restricted
to no more than a primary education. Seventh, Koreans were discriminated against and used inlower organizational positions and consequently had few opportunities to accumulate experienceas leaders, managers, or negotiators. Hence Korea had a severe lack of competent politicians,
bureaucrats, scholars, entrepreneurs and technocrats. Finally, the period of colonialism resulted inKoreans being largely isolated from experience in the international arena.
For all the negative features of Japanese colonialism there were some positive impacts as well,such as education, infrastructure (finance, transportation and commerce), and managementexperience in modern organizations (Amsden (1989), p.32, Mason et al. (1980)). Japan also
dismantled one thousand year old dynastic institutions that had held back the advancement of thecountry. Koreans learned the Japanese way of doing business and managing the economy, and

8/6/2019 Korean Miracle
http://slidepdf.com/reader/full/korean-miracle 12/27
10
remain the Asians who understand Japan best. Because of the colonial experience Koreans werein a position to make selective use of various Japanese institutions. Not surprisingly, Korea’s
experience of rapid development is often compared with that of Japan’s.
Another historical legacy was the division of the country after the Korean War in 1953. Despite
the devastation of the physical infrastructure in both the North and the South, the North was in abetter position to rehabilitate its economy. It had the best mines and most advanced heavyindustries. The South’s legacy was less auspicious, being primarily agricultural, having been
developed by the Japanese as a supplier of cheap foodstuffs for Japan’s industrial workforce. Thecountry’s capital city, Seoul, had been severely damaged during the period of the war7, with over80 percent of industrial and infrastructure facilities and over half its dwellings destroyed. In
addition, after the war, the South experienced a flood of refugees from the North, resulting in itbeing left with two thirds of the entire Korean population. As stated by Song (1990), p.42 ‘TheSouth began its national reconstruction with too many people on too little land’. In addition, the
maintenance of its borders required considerable military expenditure.
During the rule of President Rhee Syngman, 1948-60, economic recovery of the war-ravaged
economy was slow and there was no well-articulated economic growth or trade strategy. Thecountry was heavily dependent upon foreign aid from its allies, most notably the US. Industrialgrowth centred on policies relating to import substitution and was based on an overvalued
exchange rate and reliance on massive foreign assistance8, and there was massive investment oneducation. As most industries in Korea were consumer goods industries such as food and textiles,import substitution took place mainly in those industries. Access to foreign exchange, the securing
from the government of subsidies of various types, and quantitative restrictions on imports, werethe key determinants of business success. Access to government controlled foreign exchange,bank credit, and foreign assistance increasingly involved corruption and favouritism. Businessmen
who became wealthy under these circumstances were widely suspected of corrupt dealings. WhenRhee was ousted in April 1960, public sentiment demanded that such wealth be confiscated andthe malefactors punished. Parliamentary government was established and Chang Myon became
the Prime Minister, but his tenure was short.
3.2 Establishing a growth and economic development strategy 1962-719
In a military coup on 16 May 1961, General Park Chung Hee ascended to power. At this time theKorean economy remained in dire straits. Most Koreans were poverty stricken, and per capita
income was a mere US$82 in current prices. South Korea lagged behind North Korea both in
terms of per capita income and industrial capacity. Rapid economic development becameimperative, as was the need to identify an appropriate development strategy. The key issues were
as follows. First, Korea had virtually completed import substitution in non-durable consumergoods and in the intermediate goods used in their manufacture. A growth strategy concentratingon import substitution in machinery, consumer durables and their intermediate products did not
present a feasible option due to the smallness of the domestic market and large capitalrequirements. Second, Korea’s natural resource endowment was so poor that a developmentstrategy based on domestic resource utilisation was inconceivable. Third, US assistance, which
financed most of the post war Korean reconstruction, peaked in 1957, and was gradually butcontinually declining in the early 1960s. Faced with this reduction in foreign aid, Korean policy
7
The city changed hands four times during the period of the war.8 During the period from 1945-60, Korea received a total of US$3 billion in foreign aid (Tae (1972), p.12).9 This period covers the First (1962-66) and Second (1967-71) Five Year Plans.
8/6/2019 Korean Miracle
http://slidepdf.com/reader/full/korean-miracle 13/27
11
makers had to consider how best to expand domestic saving and generate an alternative source of foreign exchange to finance projects and meet balance of payments requirements. Fourth, the
availability of an abundant, cohesive, and well motivated labour force with a high educationallevel10, and relatively low wages, provided the country with an initial comparative advantage inexporting light manufactured labour intensive consumer goods whose capital, and technology,
requirement was minimal. This was ideal given the country’s shortage of capital. Lastly, there wasthe determination of the military leadership to attain a high rate of growth, and a virtual lack of constraints on its ability to make decisions and to carry them out.
For these reasons the government envisaged that the way forward for the nation was:industrialisation through externally oriented development 11 ; developing light industry and
infrastructure; and expanding domestic savings and foreign capital accumulation. Consequently,Korea switched to an externally oriented development strategy from around 1962-63 (Ranis(1971, 1989)). This also involved relaxing import restrictions. If the government protected the
consumer goods industries on the grounds that these light industries had to expand their exportsand increase import substitution, private enterprises might have found it more profitable to supplydomestic markets rather than foreign markets. Through the policy of relaxing import restrictions
the government reduced the possibility of making a high profit in domestic markets. This policyattracted businesses to pay more attention to exportability, and at the same time producedcompetitive pressure for improved management.
The urgent need to catch up with, and out-perform, the North and to escape from poverty,necessitated the maximum possible growth, or growth at any cost, and became the basic cause of
the forced expansion of exports and investment throughout the Park era. The government was ina position to deal as it wished with those businessmen who were suspected of corruption duringthe Rhee period. President Park soon reached an understanding with the business community, the
essence of which was that: the government would exempt them from legal punishment; they inturn would pay off their obligations; and they would devote themselves fully to nation buildingthrough industrialisation. Park was, therefore, able to enlist the support of businessmen for the
industrialisation through export growth strategy, and exert considerable control over them duringthe rapid expansion of trade and industrial growth from 1961 until his death in 1979. Withhindsight such an influence enabled the government to bring about rapid economic development in
the country, even thought the domestic market system was still at a very low level of developmentand sophistication. It also established a close relationship between government, the bankingsystem and the large corporations that still endures.
Export targets were agreed upon between the government and individual firms, and were taken bybusinessmen as equivalent to compulsory orders. Firms that failed to achieve their export targets,
without a plausible excuse, ran the risk of heavy administrative sanctions. Since the measure of success for firms was their export capability, firms tended to increase production and export
10 In the 1960s the illiteracy rate was already well below 10 percent. The strong desire for education provided ahigh quality labour force and modern management ability as the stages of industrialisation unfolded (see forexample Tae (1972) p. 56).11 As pointed out to the authors an alternative explanation for the adoption of the export promotion strategy shouldalso be acknowledged. This argues that the adoption of such a strategy was not entirely the decision of the Koreangovernment, but, rather, with the US cutting back on its aid program it enlisted the assistance of international
institutions to identify alternative means for Korea to finance its development and this was the export growthstrategy.

8/6/2019 Korean Miracle
http://slidepdf.com/reader/full/korean-miracle 14/27
12
capacity as much as possible. This ‘forced’ expansion of output and exports resulted in a high andrising debt-equity ratio12, as well as distortions in firm internal decision-making. Emphasis was
placed upon the growth of large firms who were seen as being in a better position than small firmsto expand export capacity and acquire and utilise technology, and the government also favoured asmall number of large firms over a large number of small firms because this meant a narrower span
of administrative control. Another reason why large firms were in a better position than smallfirms in expanding export capacity was that government owned banks were directed to givepreference to large firms in the allocation of bank credit. From the early days of Korean economic
development when firms were largely financed by bank loans under government influence, arelationship based system developed among firms, their banks and the government, throughownership, family ties and political deal making (Dobson (1998)).
On a number of fronts the development strategy proved to be highly successful. Economic growthwhich had been between 4 and 5 percent prior to 1962, doubled to an average annual growth rate
of 8.8 percent during 1962 to 1971 (Lee (1996), p.19). Per capita income increased from US$82in 1961 to US$286 in 1971. The industrial structure of the economy changed dramatically, withthe proportion of the economy accounted for by agriculture and fishing, diminishing from 39.1
percent in 1961 to 27.2 percent in 1971. The manufacturing sector contribution increased from 12percent to 20 percent of GDP during the same period. Exports increased rapidly, rising fromUS$41 million in 1961 to US$1,133 in 1971 (an increase of almost 28 times), producing an
annual average growth rate of 39 percent. There was a massive increase in expenditure ondomestic infrastructure, which laid the foundations for future growth. The rise in the nation’sGNP pushed up the domestic savings ratio from 21.6 percent of total investment in 1961 to 60.9
percent in 1971, thereby increasing Korea’s internal investment resources (Lee (1996), p.19). Thedevelopment strategy also led to increases in employment, income and savings, by enabling theeconomy to benefit from economies of scale in production and technology transfer (Smith
(2000b)).
3.3 The heavy and chemical industries (HCI) drive (1972-79)13
Despite the previous impressive outcomes the development strategy changed from the early1970s, arising from a number of adverse side effects from the export driven growth. First, it
contributed to a sectoral imbalance between the light and heavy industry sectors. Second, theexport oriented industrialization program widened the gap between those engaged in exportbusiness and those in domestic business. Finally, by the early 1970s light industry exports began to
weaken, highlighting the need to develop new exportable products. Consequently, in May 1973,
Korea shifted from general export promotion and incentives to the targeting of heavy andchemical industries. This had three major objectives. First, to overcome obstacles to the further
growth of the economy the implementation of import substitution policies focusing upon thedevelopment of heavy and chemical industries was thought desirable. Second, the development of such industries would also provide a source of new export growth industries. Finally, to correct
the imbalance in the manufacturing sector caused by a growth policy that favoured light industry.
Under the HCI drive (1973-9), industry neutral incentives for exports were replaced by industry
specific and, in some cases, firm specific measures (Smith (2000a)). The following HCIs were
12 Between 1963 and 1971, the debt-equity ratio of the manufacturing sector increased more than fourfold from 92
percent to 394 percent, increasing further to 488 percent by the end of the HCI drive in 1980. The ratio fell overthe 1980s and by 1990 was 285 percent (Smith (2000b)).13 The third (1972-76) and fourth (1977-81) economic development plans were launched during this period.

8/6/2019 Korean Miracle
http://slidepdf.com/reader/full/korean-miracle 15/27
13
classified as ‘strategic’ – steel, heavy machinery, automobiles, industrial electronics, shipbuilding,non-ferrous metals and petrochemicals – receiving generous government assistance. The main
tool of promotion was preferential access to bank credit. Over the course of the HCI drive almost60 percent of total bank loans, and more than 75 percent of total manufacturing investment, wentto these sectors, stifling the flow of funds available to light manufacturing industries and small and
medium enterprises (SMEs). Investment, in turn, was funded predominantly by externalborrowings resulting in a rapid rise in foreign debt from 25 percent of GNP in 1970 to 49 percentin 1980. Other HCI incentives included subsidies, tax reductions and exemptions (Rhee (1994)).
Without such government incentives large companies would not have been willing to bear the risk and cost of such extensive investment in these industries.
The HCI drive went too far, however, and clear problems developed. The most obvious of which
being associated with the development of the HCI industries themselves. First, their developmentcontributed to rapid monetary expansion and aggravated the national budget. Second, manyinvestments were made without sufficient analysis of their viability and impact upon the overall
economy, and there were many overlapping investments. Third, the focus on strategic industriesresulted in enormous economic inefficiency. Fourth, the socialization of bankruptcy risk thataccompanied the HCI drive, combined with the low interest rate ceilings, made the cost of debt
financing very cheap for firms in targeted sectors, encouraging firms to take on excessively highlevels of debt and to increase market share rather than profitability and shareholder value (Huhand Kim (1994), p.26). Many HCI enterprises expected the government would bail them out since
they had been established at the government’s behest. The result of these was excess capacity,inefficiency, sectoral imbalance, weakened corporate financial structure, and rising foreign debtLee (1996), p.21). The financial status of corporations became more fragile because external
borrowing was rapidly increasing at a rate much greater than that available through internalfinancing.
While the industrial conglomerates (chaebol) had already played a major role in Korea’s economicdevelopment during the 1960s, their period of most rapid growth was during the HCI drive. Theirrapid growth and diversification during the 1970s radically transformed the industrial structure
and market concentration in Korea. By 1977, 93 percent of all commodities were produced undermonopoly, duopoly or oligopoly conditions in which the top three producers accounted for morethan 60 percent of market share. Between 1972 and 1982, the share of manufacturing output of
the twenty largest groups increased from 7 percent to 29 percent (OECD (1994), p.60). By 1980,the ten largest chaebol accounted for 48 percent of GNP (Kim (1997)). In addition, during thisperiod, technology development began to be recognized as an important development strategy
and only the chaebol had the resources to contribute to this.
The overemphasis on the HCI drive resulted in an overheated economy from 1976 to 1978,
accompanied by a rapid increase in wages that surpassed the growth of labour productivity. Thiswas exacerbated further by the Middle East construction boom in 1976. Korean constructioncompanies amassed huge fortunes in the Middle East that was later invested in domestic land,
sending prices sky high. This sequence of events caused one of the country’s worst bouts of inflation. As inflation continued it weakened export competitiveness, slowed export growth, andled to slow growth in key export industries and the economy as a whole. Export competitiveness
was also being undermined due to an overvalued currency and under investment in thedevelopment of technology and training of skilled manpower by both the government and the
private sector (Koo (1986), p.19).

8/6/2019 Korean Miracle
http://slidepdf.com/reader/full/korean-miracle 16/27
14
In response to this the government announced the Comprehensive Stabilisation Program on 17April 1979 (Smith (2000b), p.93). The program included restrictive fiscal and monetary
management, price stabilisation, and investment adjustments in the HCIs in the short term, andeconomic liberalization in the long term. The exchange rate was substantially devalued in early1980 and adjusted in line with fluctuations in the value of currencies of major trading partners
However, during 1979-80 the program was not implemented in an effective way and economicconditions were further exacerbated due to: the second oil crisis; a bad agricultural harvest, and adomestic political crisis with the assassination of President Park in October 1979. Prime Minister
Choi Kyu-Hwa became acting President of the interim government but was replaced by GeneralChun Doo Hwan under martial law in May 1980. The economic and political crisis during 1980resulted in the first negative rate of economic growth (-2.1 percent) since the emergence of Park’s
regime (1961-79), and consumer price inflation soared to 28.7 percent.
3.4 Economic stabilization and liberalization (1980-87)
By the early 1980s, against a backdrop of political and economic crises, the economy wasexperiencing severe structural difficulties. The massive investment in HCIs and global anddomestic economic downturn combined to leave many of the heavily targeted industries of the
1970s with severe over-capacity problems. In response a critical re-appraisal of the government’srole in the nation’s overall economic development took place, resulting, once again, in a majorpolicy shift. The new authoritarian government of President Chun Doo Hwan14 decided to focus
policy upon economic stabilisation and liberalisation, establishing an unbiased incentive structure,promoting competition within the domestic market and from abroad, and preventing big businessdominance in the market (Rhee (1994)). Korean industrial policy was to be based on the premise
that direct intervention was no longer feasible or desirable in the light of the economy’s changingindustrial structure, and that greater reliance should be placed on private sector decision-making15.
Its focus was now upon trade liberalization, financial liberalization, market opening, promotion of small and medium enterprises, antitrust legislation, greater opening to foreign investment,preferences for specific industries were to be reduced, and structural change toward thedevelopment of more technology based industries (Smith (2000a)).
Stabilisation policy outcomes
By the mid 1980s the economic stabilization measures achieved their desired objectives, asinflation decreased and the economy recovered its competitiveness, productivity and growth.From 1986 to 1989 economic conditions were given a further boost by favourable external
conditions known, locally, as the three lows – low oil price, weak dollar, and low global interestrates. In 1986, for the first time in Korea’s modern history, the nation’s current account shiftedinto the black, where it remained until 1990, the balance of payments was in sizeable surplus,
exports exceeded imports and domestic savings exceeded domestic investment for the first timesince the First Five Year Plan. The economy registered a high annual growth rate of 12 percent.Industrial restructuring also made headway with the share of the manufacturing sector in total
GNP16 rising from 29.7 percent in 1980 to 32.2 percent by 1987. By late 1988, however, apresidential election, the Olympic Games, abnormally high wages and incomes growth, steeply
14 He was inaugurated as President in March 1981.15
This direction was described at the time as the pursuit of a ‘private sector led economy’ as opposed to a‘government led economy’ (Yoo (1990), p.106).16 Using current prices.

8/6/2019 Korean Miracle
http://slidepdf.com/reader/full/korean-miracle 17/27
15
rising land prices, and ongoing structural problems in the economy (Lee (1996), p.26), combinedto severely jolt economic stability. Economic growth slowed to 8 percent in 1989.
Trade liberalisation
Until the 1980s, trade policy formulation contained two features (Smith (2000b), p.94). First,there was only a weak constituency for trade liberalization. Traditionally, it was only used toappease trade partners and ensure that export markets remained open. This resistance also tended
to be strongest when the balance of payments was deteriorating. Second, the process of decision-making over trade reform remained primarily political rather than economic. Consequently,Korea’s trade policy tended to be conducted in an ad hoc manner with no central authority within
the government formulating and articulating government trade policies. Import liberalization wasusually undertaken on a micro basis with each commodity considered in isolation and with littleregard for the macro level optimality governing the inter-sectoral allocation of resources (Young
(1988), p.21). Little public debate about the costs and benefits of a trade policy measure to thenational economy took place. Those sectors bearing the costs of protection were left uninformedand excluded from the decision making process (Young (1986), p.23).
While there was some import liberalization in 1979 the process stalled during 1980 and 1981following balance of payments difficulties. Only after 1983, when the balance of payments began
to improve, did a substantive trade liberalization program begin. The precursor for this was theestablishment of a Tariff Reform Committee in 1983, which formulated a time-phased program of import liberalization measures (Smith (2000b), p.93). Priority was directed to liberalizing over
protected commodities first and items that enjoyed a monopolistic market structure (Young(1986), pp.67-8). As a result of these measures the average nominal tariff rate was lowered from24 percent in 1983 to 19 percent by 1988 and to 11 percent by 1990, and the import liberalization
ratio rose from 80 percent in 1983 to over 95 percent in 1988. Tariff exemptions were alsoabolished for strategic industries in 1984. Many of the trade policy reform measures adoptedduring the 1980s were made largely in response to US pressure. Bilateral disputes centred on
Korean macroeconomic policies, especially regarding the won-dollar exchange rate, and itsgrowing bilateral trade surplus with the US from the mid 1980s.
Industry policy reform and technological upgrading
In the early 1980s the promotion of ‘strategic’ industries with preferential credit and tax treatment
gave way to more indirect and functional support. The number of industries classified as
‘strategic’ decreased, and measures adopted for preferential tax treatment moved from directforms such as tax deductions or tax holidays to indirect forms such as the allowance of tax-free
reserves for expenses in technology development (Rhee (1987), p.31). Preferential interest rateswhich were formerly applicable to strategic industries or exporters were ‘officially abolished inJune 1982. No interest rate subsidy in ‘explicit’ form for any major loans was conducted and the
size of policy loans was reduced. However, given that credit rationing was still the prime form of allocating financial resources, access to bank loans still carried inherent preferential benefits (Nam(1991), p.4).
During this period Korea experienced increased pressure to upgrade and restructure its industryfrom labour and capital intensive to technology intensive. A major obstacle to this was a lack of
technological capability in Korean industry necessary to upgrade to higher value added activity.The closed and concentrated nature of Korean markets meant that Korean enterprises lacked

8/6/2019 Korean Miracle
http://slidepdf.com/reader/full/korean-miracle 18/27
16
incentives to acquire or develop leading–edge technology (Graham (1996)). In contrast to itsinterventionist role in HCI industry development in the 1970s, the Korean government adopted a
more facilitatory role towards technological upgrading during the 1980s. Over time the privatesector gradually assumed a much larger role in the country’s R&D efforts partly in response toincreasing international competition and partly in response to a policy environment increasingly
supportive of private R&D activities. R&D expenditure as a share of GNP rose from 0.74 percentin 1980 to 1.87 percent in 1990. While the private sector accounted for only 26 percent of thenation’s total R&D expenditure in 1975, the figure increased to 75 percent by 1985. This was one
of the highest proportions of private R&D expenditure among the advanced and newlyindustrialising countries (Kim (1997), p.56). Due to their resources the chaebols remained vitallyimportant to the development of Korea’s technology intensive industries, although, as discussed
below, they remained highly leveraged and highly interdependent financially.
In contrast to a number of other countries in the region, Korea made relatively little use of FDI as
a source of technology transfer during the 1960s and 1970s. Instead it tended to rely more heavilyon external borrowing, technology licensing and the importation of capital goods. In fact, importsof capital goods, and the transferral of new foreign technologies embodied in them, far surpassed
other means of technology transfer. The size of FDI and its proportion to total external borrowingwere significantly lower in Korea than in other newly industrializing economies. For example,Korea’s stock of FDI in 1983 was only 23 percent that of Singapore’s, and less than half that of
Taiwan’s and Hong Kong’s, while the proportion of FDI to total external borrowing was only 6.1percent in Korea compared with 91.9 percent in Singapore and 45 percent in Taiwan (Kim(1997), p.42). In 1980, however, Korea liberalized its inward FDI regulations as a means of
upgrading its technology. In July 1984 the government switched from the previous ‘positive list’system to that of a ‘negative list’. The government’s more open policy for FDI was aimed atinducing the transfer of sophisticated new technologies and at promoting market competition for
domestic firms to intensify their innovation activities (Kim (1991), p.226). Of the total US$3.6billion of inward foreign investment into Korea during the period 1962-86, nearly 50 percent took place between 1982-86.
Financial liberalisation
Liberalisation of the financial sector began in the early 1980s, and included: privatization of commercial banks; unrestricted entry of non-bank financial institutions; abolition of the system of preferential interest rates for strategic or export industries; the introduction of new financial
market instruments; modification of interest rate ceilings; relaxation of directed credit; and the
financial sector was gradually opened to foreign investment
17
. While the government permittedbanks greater discretion in setting interest rates and allocating loans, it did not relinquish control
over these. The asset portfolios of commercial banks remained constrained by specific limits onlending to large companies, and subsidized lending from the central bank still distorted creditmarkets. Although the commercial banking sector became largely privately owned after the mid
1980s, the government did not allow it full managerial autonomy (Smith (1998)). Consequently,banks continued to have little discretion or incentive to control lending risk by screening projectsand monitoring corporate performance. A moral hazard problem existed, where banks believed
that their compliance with government lending directives would result in the provision of financialassistance should they get into difficulties18. Insider relationships between banks and borrowers
17
A more comprehensive plan for liberalisation of the financial sector did not occur until the early 1990s under theso-called ‘1993-97 Financial Sector Reform Plan’.
18 Indeed, there were very few instances of banks being allowed to fail.

8/6/2019 Korean Miracle
http://slidepdf.com/reader/full/korean-miracle 19/27
17
still served to channel credit without regard for rates of return and at rates below the cost of funding. Declaring any sizeable industrial enterprise as bankrupt or writing off bad loans on bank
balance sheets required the explicit consent of the government.
The regulated financial sector grew rapidly during the first half of the 1980s: total credit increased
from 68 percent of GNP in 1980 to 94 percent in 1984. The major cause was the rapid expansionof non-bank financial institutions (NBFIs). The government’s aggressive industrial policy in the1970s had tended to retard their development19, however their share in total credit increased from
37 percent in 1980 to 45 percent in 1984. Thus, the less controlled NBFIs contributed much moreto the liberalisation of the financial system than did the still highly controlled banks. Theliberalization of the financial sector resulted in the largest business groups becoming the dominant
owners of commercial banks (nationwide city banks and local banks) and, in particular, of theNBFIs (short term finance companies, securities corporations, insurance companies etc.). Theyalso dominated as borrowers from these institutions. At the end of September 1984, for example,
the thirty largest business groups borrowed about 70 percent of the short-term finance companies’total credit as a result of the decontrols of entry into and ownership participation in the NBFIs.
After 1980 the government attempted to correct the high concentration of commercial bank loansto large companies and their subsidiaries, by ordering the banks to allocate more credit to SMEs.They mandated that 55 percent of any local banks’ total credit and 35 percent of the nationwide
city banks’ total credit should be loans to SMEs. In addition, in 1984, the government froze theshare of the thirty largest conglomerates in total bank loans at the end of 1983 level, and did notallow large firms whose debt-equity ratio exceeded 500 percent further access to bank loans. This
initiative failed, however, as the share of SME borrowing in the net increase of the nationwide citybanks’ total credit decreased from 33.6 percent in 1983 to 27 percent in 1986, failing to reach theobligatory credit ratio of 35 percent. In fact, the concentration of credit allocation increased: the
ten largest business groups in 1984 were the ten largest borrowers of bank loans; the share of thethirty largest business groups in total domestic credit (bank loans and payment guarantees)increased from 43.2 percent as of the end of August 1983 to 48 percent as of the end of March
1984.
This policy failure arose from numerous big businesses20 becoming financially distressed by the
mid 1980s and the government, under duress from these groups, providing them with morefinancial assistance through expanded bank credit. Hence the government continued to bail out anincreasing number of troubled firms by forcing the banks to assume their debt (Park (1994),
p.161). In practice the government averted bankruptcy of large enterprises by directing banks to
provide relief loans or rescheduling debt. Banks saddled with a high proportion of non performingloans continued to depend on the Bank of Korea for low cost funds to support their outstanding
loans, the bulk of which remained policy related (Huh and Kim (1994)). To avert bank insolvency,the Bank of Korea compensated banks for some of their losses through subsidized rediscounts. Atthe end of 1984 the Bank of Korea estimated that commercial bank non-performing loans was
close to 11 percent of their total loans and 2.6 times their net worth. Commercial banks,therefore, continued to serve as the major channel through which policy directed loans weremainly distributed (Park and Kim (1994), p.195), despite government intentions of phasing them
out. During 1985-9 policy directed loans were 35 percent of total bank loans (commercial bank and specialized banks) compared with 41 percent during the height of the HCI drive between
19 As well as equity markets.20 Such as shipping, shipbuilding, and overseas construction.
8/6/2019 Korean Miracle
http://slidepdf.com/reader/full/korean-miracle 20/27
18
1975-9.
Market concentration and competition
The HCI policy resulted in increased growth and concentration of economic power in the hands
of the chaebol. They monopolized bank loans, seriously harmed the development of SMEs thatformed the backbone of the economy, provided a stumbling block to industrial restructuring,guaranteed loans to inefficient subsidiaries, and engaged in unfair trade practices such as
discriminating against companies outside their group. While these enterprises had made animportant contribution to the development of the economy they began to stifle competition,incompatible with the movement toward a more market oriented economy, and imposed a severe
burden on economic growth. Consequently, government policy shifted from the promotion of chaebol in the 1960s and 1970s to one of regulation of their growth in the 1980s. Theintroduction of the Monopoly Regulation and Fair Trade Act of 1980 included: the prohibition of
cartel practices and cross equity investment among affiliated companies; a ceiling on credit to thelarger chaebol; and restrictions on their vertical and horizontal integration by imposing limits onchaebols’ total equity investment in their group firms21. This was supplemented by measures to
restrict big business expansion through mergers and acquisitions. The government also directedthe 30 largest chaebol to restructure their businesses around three or fewer core sectors (Kim(1997), p.34).
Despite government policy pronouncements the chaebol continued their fast growth until the mid1980s. Their economic dominance in the early 1980s can be demonstrated as follows. First, the
share of total manufacturing sales of the 5 largest groups increased from 15.7 percent in 1977 to23 percent in 1985. Second, the combined sales of the 5 largest chaebols as a percentage of GDPincreased from 12.8 percent in 1975 to 52.4 percent in 1984. Third, in 1983 70 percent of Korea’s
exports were generated by the top ten business groups. Fourth, the average annual growth rate of sales and assets of the nine largest business groups were 34.5 percent and 27.8 percentrespectively, during the 1979-85 period, while the average growth rates of real GNP and the GNP
deflator were 5.4 percent and 9.9 percent, respectively, for the same period. Finally, the 30 largestconglomerates controlled 270 firms and contributed about 10 percent of Korea’s GNP in 1985.However, during this same period their financial structure steadily worsened: 83.5 percent of the
ten largest business groups’ asset growth was financed by debt during the 1979-80 period; theiraverage debt-equity ratio increased from 356 percent in 1979 to 464 percent in 1985; the averagedebt-equity ratio of the thirty largest business groups was 498.5 percent in 1983 in spite of the
continuous regulatory credit management policy towards these conglomerates.
The growth of the chaebol’s did begin to slow around the mid 1980s reflecting the shift in
government policy. The ceilings on bank credit to the top 30 conglomerates imposed in 1986 didhave an impact in significantly reducing the chaebols’ share of total bank lending. Bank loans tothe 30 major chaebols as a share of total credit fell from 24.4 percent in 1987 to 18.3 percent by
1989. However, the share of non-bank credit to the 30 largest chaebols increased from 37.9percent to 42.1 percent (Park and Kim (1994)).
As the promotion of chaebol faded attention turned more to the promotion of SME
21 This latter measure, in particular, was intended to prevent chaebols from inflating their group firms’ capital base
and establishing new group firms without actually increasing their overall equity capital base (SaKong (1993),p.63).

8/6/2019 Korean Miracle
http://slidepdf.com/reader/full/korean-miracle 21/27
19
manufacturing business, in the mid term revision of the Fifth Five Year Plan. In the reviseddocument covering 1984-86 a separate section was devoted to the promotion of small
manufacturing industries. The efforts to promote the growth of new businesses resulted in theenactment in 1986 of a special law to support the creation of small firms. Thereafter the numberof manufacturing establishments increased rapidly. Establishments with over 5 employees
increased from 24,957 in 1976 to 44,037 in 1985, according to the census of manufacturing.However, the Establishment Census of the National Bureau of Statistics put the number of manufacturing establishments with more than 5 employees at a much higher figure – 76,042 in
1986. In the latter half of the 1980s the government attempted to provide credit preferences forSMEs. Specific measures to aid SMEs included the requirement that they receive 45 percent of bank lending and barriers preventing the entry of large firms into certain types of business
activities. These measures boosted the SMEs’ share of value added in the manufacturing andmining sector, which averaged only 30 percent during the 1970s, to 46 percent by 1990, whiletheir share of employment increased from 46 percent to 64 percent over the same period (OECD
(1996), p.111).
4. Productivity or factor accumulation growth - was there an economic miracle inKorea?
This section reviews the quantitative evidence on the performance of the Korean economy duringits period of rapid economic growth, as discussed in the previous two sections, with the objectiveof identifying the contribution to this from productivity growth relative to that of capital and
labour accumulation. A summary of the main results from pertinent studies, within the broadercontext of East Asian economic growth, is contained in Table 4.
Table 4. Estimates of Total Factor Productivity growth in East Asia (annual percentagegrowth rates)
Fischer(1993)
World Bank (1993)
Young(1994a)
Young(1994b)
Kim andLau(1994)
Young(1995)
Marti(1996)
Collins andBosworth(1996)
Osaka(1997)
Period of study
1961-1988 1960-1990 1970-1985 1970-1985 1950-1990 1966-1991 1970-1990 1960-1992 1981-1993
SouthKorea
1.7 3.1 1.1 0 1.7 1.4 1.5 2.1
Taiwan 3.8 1.5 0 2.6 2.1 2.0
Hong Kong -2.8 2.5 0 2.3 2.4
Singapore 1.2 0.1 0 0.2 1.4 1.5
Thailand 2.5 1.9 1.6 1.8 0.6
Indonesia 1.2 1.2 -0.5 0.8Philippines -0.4 -0.4 -2.2
Japan 3.5 1.2 2.9 0.9
Malaysia 1.1 1.0 0.4 0.9
Method GrowthAccounting(Solow)
EconometricApproach
EconometricApproach
EconometricApproach
EconometricApproach
EconometricApproach
EconometricApproach
GrowthAccounting(Solow)
EconometricApproach
Source: Adapted from Cook and Uchida (2002)
The World Bank (1993) study provided support for the high productivity growth thesis relating to
the East Asian economies22. High estimates were obtained for productivity growth, and highercontributions of TFP to output growth, in Korea, Taiwan, Thailand, Hong Kong and Japan. The
22 The World Bank results were based upon those obtained by Nehru and Dhareshwar (1993).

8/6/2019 Korean Miracle
http://slidepdf.com/reader/full/korean-miracle 22/27
20
study concluded that this resulted from their superior success in allocating capital to high-yieldinginvestments, to their catching-up technologically to the industrialized economies, and their pursuit
of export oriented growth strategies. The other group consisting of Indonesia, Malaysia andSingapore were found to be investment driven with low productivity growth (Page, 1994). TheWorld Bank claimed that compared with other economies `the East Asian economies stand out
sharply with high absolute levels of total factor productivity' (World Bank (1993), p.55). TheWorld Bank's position on the sources of growth and success of the East Asian economies falls inline with the so-called ‘assimilationists’ school. This school is represented by Romer (1993), Pack
and Page (1994), Hobday (1994) and Nelson and Pack (1996), who ascribe the success of theEast Asian developing economies to their ability to acquire and adapt foreign technology. Theyargue that these countries developed new skills and learned to use efficiently imported technology.
The assimilationists position is reinforced by recent studies that have also found positiveproductivity growth (Marti, 1996; Osaka, 1997, and Sarel (1997)). The study by Osaka (1997),for example, found significant growth in productivity in South Korea over the period 1981-1993.
The contrasting view, epitomized by the ‘Krugman thesis’, questions the existence of the so-calledEast Asian miracle (Krugman (1994)). Krugman argued that capital accumulation rather than
productivity growth was responsible for the rapid economic growth experienced by the EastAsian developing economies. He suggested that the East Asian developing economies achievedrapid growth `in large part through an impressive mobilization of resources. Once one accounts
for the role of rapidly growing inputs in these countries' growth, one finds little left to explain.Asian growth ... seems to be driven by extraordinary growth in inputs like labour and capitalrather than by gains in efficiency' (Krugman (1994), p. 70). Krugman argued that economies that
relied on the accumulation of factors of production as mechanisms for growth would eventuallyexperience a slowdown in their growth performance as diminishing returns to factors of production take their effect. Table 5 indicates the rapid rate of growth of GDP in the East Asian
economies over the period 1965-90 and the rapid rate of growth of capital and labour. From thesample of selected countries, Korea had the highest average annual GDP growth rate as well asone of the highest rates of capital and labour accumulation.
Empirical support for the view that the growth of the East Asian developing economies canlargely be explained by the accumulation of factors of production is provided in the works of
Young (1992, 1994b, 1995), Kim and Lau (1994) and Collins and Bosworth (1996) (see Table 4).They all estimated productivity growth to be low in most East Asian developing economiesexcept for Young's estimate for Hong Kong in the 1994 study and Taiwan in the 1995 study. Kim
and Lau recorded zero growth for Korea, Taiwan, Hong Kong and Singapore. The findings of
these studies that capital accumulation in the East Asian developing economies did not result insignificant increases in technological progress that may constitute a catching-up process, has been
labelled the ‘fundamentalists’ approach (Felipe, 1997).
The current state of the debate over the sources of growth for the East Asian developing
economies, therefore, appears to have reached a stalemate (Cook and Uchida (2002)). Morerecently, the debate has focused upon the way in which productivity is measured. The measuresof productivity growth in the East Asian developing economies, as identified in Table 4, have
relied either on forms of growth accounting or econometric estimation of a production function.Both approaches rely on the existence of a production function for the whole economy and on thevalidity of marginal productivity theory relating to factor pricing. The former have relied on the
use of Tornqvist indices and Solow's growth accounting approach to estimate the rate of productivity growth. In the case of Solow TFP is estimated as a residual by separating out growth

8/6/2019 Korean Miracle
http://slidepdf.com/reader/full/korean-miracle 23/27
21
that can be explained by movements along a production function and shifts in it, reflectingtechnological and organizational change. The latter approaches have attempted to estimate
directly the production function using a variety of functional forms. The limitations of thesetechniques are well known (Nelson, 1981) 23 . Growth accounting is subject to well-knownproblems associated with approximation errors while econometric estimation is subject to
measurement error, specification errors relating to the functional form, and the choice of aparticular time period. In particular, production function-based approaches developed to estimateproductivity growth rely on severely restrictive assumptions relating to their analytic framework
and require the explicit specification of the production function and, as a consequence, are likelyto suffer from significant measurement errors which may explain the conflicting results that havebeen produced in recent years. As a result further work employing a production function-based
approach to estimation is unlikely to yield results that will be helpful in resolving the apparentinconsistencies reported in existing empirical work on East Asia (see Felipe (1997)).
Table 5. Average annual growth of GDP, capital and labour, percent, 1965-1990, East Asia
and selected countries
GDP Capital Labour
East Asia Hong Kong 8.38 5.19 3.07Japan 5.02 8.84 0.99
South Korea 8.95 11.19 2.47Taiwan 8.54 12.10 2.59Thailand 6.68 9.12 2.78Singapore 8.94 11.27 3.21Philippines 3.84 4.00 2.51
Others France 2.91 5.07 0.89
Germany 2.43 5.24 0.39Italy 3.34 4.34 0.47United Kingdom 2.25 3.65 0.50United States 2.68 4.13 1.84
Source: Cook and Uchida (2002)
5. Summary and conclusions
Korea’s economic performance over the period 1962-89 produced a remarkable transformation of
the economy. From being a poverty stricken, inward looking and economically backwardeconomy in 1960, it was transformed into a globally competitive economy with a GDP per capita
65 times, a GDP 110 times, an export level 1860 times higher by 1989, and with a domesticsavings ratio of 35.4 percent in comparison to only 0.8 percent in 1960. The catalyst for thisremarkable transformation was the adoption of an economic growth and industrialisationdevelopment strategy based upon export expansion, focusing upon the growth of large scale
enterprises who could take advantage of economies of scale and technology transfer in order toachieve international competitiveness. The government led growth and development strategyproduced remarkable outcomes during the 1960s and 1970s. However, by the early 1980s it was
becoming apparent the limits of this approach and that greater emphasis needed to be placed upona market oriented strategy. The focus on large and not small enterprises until 1979 resulted in
23 See also Felipe (1999) for an extensive and critical review of these procedures.

8/6/2019 Korean Miracle
http://slidepdf.com/reader/full/korean-miracle 24/27
22
considerable market concentration and control by the industrial conglomerates. By the 1980s,with the advancement of the economy to the level of a developed economy, focus by the
government moved away from coercive and discretionary measures, as under President Park, tothe use of more market and non-discretionary measures. The development of a more competitiveand liberalised economy had become paramount, as well as the need to develop technology
intensive industries, and with more focus upon the development of SMEs. The government’scontrol of credit allocation fuelled rapid industrialization in the 1960s and 1970s, but it alsoinhibited the development of an efficient banking system and fostered economic concentration.
While the chaebol represented an important asset in Korea’s industrialization, the absence of ahealthy SME business sector was one of the weakest links in Korea’s overall industrial structure.
By the mid 1980s Korea had become a trade surplus country and mature debtor nation, it becameself sufficient in terms of its domestic financial requirements, and foreign debt also started todecrease. The future for the Korean economy, at this time, appeared to depend upon how the
country managed its transition to maturity. In this regard, a number of issues appeared to beespecially important: managing trade in the global context; conducting institutional reform;balancing equity and efficiency; how best to conduct the further transition of the economy from
being government led to market oriented; and how to cope with capital market opening.However, as the experience of the 1990s began to unfold it was apparent that many structuralproblems remained. While the intentions of the reforms in the 1980s were good, they were
insufficiently applied and ultimately flawed.
The empirical evidence on the performance of the Korean economy is inconclusive. However, the
predominant position would suggest that during the period of rapid economic growth from 1962to the mid 1980s this was primarily driven by factor accumulation. But there is also evidence tosuggest that during the second half of the 1980s productivity growth exerted an increasingly
important influence (see Cook and Uchida (2002)). Nevertheless the economic performance of the economy during this entire period is a remarkable one and should not be underestimated.
References
Amsden, A.H. (1989), Asia’s next giant: South Korea and late industrialization, OxfordUniversity Press, Oxford, UK.
Choi, H. (1984), The Economic History of Korea, Seoul, Bakyongsa Co.
Collins, S. and Bosworth, B. (1996) Economic growth in East Asia: accumulation versus
assimilation, Brookings Papers in Economic Activity, 2, pp.135-203.
Cook, P. and Uchida, Y. (2002), Productivity growth in East Asia: a reappraisal, Applied
Economics, Vol.34, pp.1195-1208.
Dobson, W. (1998), Business networks in East Asia, in Rong-I Wu and Yun-Peng Chu (eds.)
Business Markets and Government in the Asia Pacific, Routledge, London and New York.
Felipe, J. (1997), Total factor productivity growth in East Asia: a critical survey, Economics and
Development Resource Center (EDRC) Report Series, No. 5, Manila, Asian DevelopmentBank.

8/6/2019 Korean Miracle
http://slidepdf.com/reader/full/korean-miracle 25/27
23
Fischer, S. (1993) The role of macroeconomic factors in growth, Journal of Monetary Economics,
32, pp.485-512.
Graham, E.M. (1996), Competition policies in the dynamic industrialising economies, APEC
Working Paper Series 96-9, Washington, D.C.: Institute for International Economics.
Huh, C. and Kim, S.B. (1994), Financial regulation and banking sector performance: a
comparison of bad loan problems in Japan and Korea, Economic Review, Federal ReserveBank of San Francisco, 2, pp.18-29
Hobday, M. (1994) Export-led technology development in the four dragons: the case of electronics, Development and Change, 25, pp.333-63.
Koo, B.Y. (1986), The role of government in Korea’s industrial development, in K.U. Lee (ed.)Industrial Development Policies and Issues, Seoul: Korea Development Institute.
Kim, L. (1991), Pros and cons of international technology transfer: a developing country’s view,in Tamir Agmon and Mary Ann Von Glinow (eds.) Technology Transfer in InternationalBusiness, Oxford University Press, New York.
Kim, L. (1997), Imitation to Innovation, Harvard, Mass., Harvard Business School Press.
Kim, J. and Lau, L. (1994) The sources of growth of the East Asian newly industrializedcountries, Journal of the Japanese and International Economies, 8, pp.235-71.
Krugman, P. (1994), The myth of Asia's miracle, Foreign Affairs, 73, pp.62-4.
Lee, H.B. (1968). Korea, Time, Change and Administration, East West Centre Press, Honolulu,
USA.
Lee, H.K. (1996), The Korean Economy: perspectives for the twenty first century, State
University of New York Press, New York, USA.
Marti, C. (1996) Is there an East Asian miracle?, Union Bank of Switzerland Economic Research
Working Paper, Zurich, October.
Mason, E.S. et al. (1980), The Economic and Social Modernization of the Republic of Korea,Cambridge, Mass.: Harvard University Press.
Nam, S.W. (1991), The Korean economy at crossroads: recent policy efforts and new challenges,Korea Development Institute Working Paper 9124, Korea Development Institute, Seoul.
Nehru, V. and Dhareshwar, A. (1993), New estimates of total factor productivity growth fordeveloping and industrialized countries, World Bank Policy Research Working Paper,
WPS 1313, Washington, DC, World Bank.
Nelson R (1981), Research on productivity growth and productivity differences: dead ends andnew departure, Journal of Economic Literature, 19, pp.1029-64

8/6/2019 Korean Miracle
http://slidepdf.com/reader/full/korean-miracle 26/27
24
Nelson, R. and Pack, H. (1996), The Asian growth miracle and modern growth theory, mimeo,
Columbia University and University of Pennsylvania.
OECD (1994), OECD Economic Survey – Korea, OECD, Paris.
OECD (1996), OECD Economic Survey – Korea, OECD, Paris.
Osaka, H. (1997), Productivity growth analysis for selected Asian countries, Asia-PacificDevelopment Journal, 4, pp.93-110.
Pack, H. and Page, J. (1994), Accumulation, exports and growth in the high performing Asianeconomies, Carnegie-Rochester Conference Series on Public Policy, No. 40, pp. 199-236.
Page, J. (1994), The East Asian miracle: an introduction, World Development, 22, pp.615-25.
Park, Y.C. (1994), Korea: development and structural change of the financial system, in H.T.
Patrick and Y.C. Park (eds.) The Financial Development of Japan, Korea and Taiwan:growth, repression, and liberalisation, Oxford University Press, Oxford and New York.
Park, Y.C. and Kim, D.W. (1994), Korea: development and structural change of the bankingsytem, in H.T. Patrick and Y.C. Park (eds.) The Financial Development of Japan, Koreaand Taiwan: growth, repression, and liberalisation, Oxford University Press, Oxford and
New York.
Ranis, G. (1971), The role of the industrial sector in Korea’s transition to economic maturity,
paper presented at the ILCORK conference, 22-29 August, Seoul, Korea.
Ranis, G. (1989), The political economy of development policy change: a comparative study of
Taiwan and Korea, Korea Development Institute, Working Paper No. 8916, Seoul, KDI,June.
Rhee, J.C. (1994), The State and Industry in South Korea: the limits of the authoritarian state,Routledge, London and New York.
Romer, P. (1993), Idea gaps and object gaps in economic development, Journal of Monetary
Economics, Vol.32, pp.543-73.
SaKong, I. (1993), Korea in the World Economy, Washington, D.C.: Institute for InternationalEconomics.
Sarel, M. (1997), Growth and Productivity in ASEAN countries, IMF Working Paper, WP/97/97,August, Washington, D.C.
Song, B.N. (1990), The rise of the Korean economy, Oxford University Press, Hong Kong.
Smith, H. (1998), Korea, in R. Garnaut and R. McLeod (eds.) East Asia in Crisis: From being a
miracle to needing one, Routledge, London.

8/6/2019 Korean Miracle
http://slidepdf.com/reader/full/korean-miracle 27/27
Smith, H. (2000a), The state, banking and corporate relationships in Korea and Taiwan, in P.Drysdale (Ed.), ‘Reform and Recovery in East – the role of the state and economic
enterprise’, Chapter 4, pp. 59-98, Routledge, London, UK.
Smith, H. (2000b), Industry policy in Taiwan and Korea in the 1980s, Edward Elgar, Cheltenham,
UK.
Tae, W.S. (1972), Development of the Korean economy - past, present and future, Samwha
Publishing Co., Seoul, Korea.
World Bank (1993), The East Asian Miracle: Economic Growth and Public Policy, Oxford
University Press, London and New York.
Yoo, J. (1990), The industrial policy of the 1970s and the evolution of the manufacturing sector in
Korea, Korea Development Institute Working Paper, No.9017, Seoul: Korea DevelopmentInstitute.
Young, A. (1992), A tale of two cities: factor accumulation and technical change in Hong Kongand Singapore, in O. Blanchard and S. Fischer (eds), NBER Macroeconomics Annual,1992, MIT Press, Cambridge, Mass pp. 13-54.
Young, A. (1994a), Accumulation, exports and growth in the high performing Asian economies: acomment, Carnegie-Rochester Conference Series on Public Policy, No. 40.
Young, A. (1994b), `Lessons from the East Asian NICs: A contrarian view, European EconomicReview, 38, pp.964-73
Young, A. (1995), The tyranny of numbers: confronting the statistical realities of the East Asiangrowth experience, Quarterly Journal of Economics, 110, pp.641-80.
Young, S. (1986), Impediments to trade liberalization, unpublished manuscript.
Young, S. (1988), Trade policy problems in the Republic of Korea and their implications forKorea-US cooperation, Korea Development Institute Working Paper No. 8821, KoreaDevelopment Institute, Seoul.


![[Phind] Miracle](https://static.fdocuments.in/doc/165x107/5472c10eb4af9fa90a8b4fb9/phind-miracle.jpg)