Korea Energy Demand Outlook (Volume 18, No.2) · Published by the Korea Energy Economics ... soared...
18
Volume 18, No. 2 ISSN 2093-7199 KOREA ENERGY ECONOMICS INSTITUTE Summer / 2016 KEEI Korea Energy Demand Outlook KEEI VIEW OF ENERGY DEMAND
-
Upload
dangnguyet -
Category
Documents
-
view
215 -
download
0
Transcript of Korea Energy Demand Outlook (Volume 18, No.2) · Published by the Korea Energy Economics ... soared...

Volume 18, No. 2
ISSN 2093-7199
KOREA ENERGY ECONOMICS INSTITUTE
Summer / 2016
KEEI Korea Energy Demand Outlook
KEEI VIEW OF ENERGY DEMAND

Published by the Korea Energy Economics Institute (KEEI), Energy Demand Outlook takes a closer look at the global energy market and supply and demand trends in domestic energy and examines the outlook for short-term energy demand.
This report outlines the recent changes in the supply and demand of energy and provides important data and policy implications in an effort to contribute to the establishment and adjustment of a series of energy policies by the government.
This report is written by the Energy Demand and Supply Division of the Center for Energy Information and Statistics in cooperation with the Energy Statistics Research Division of KEEI and other related research divisions.
Cherl-Hyun Kim (Electricity) wrote the report with the participation and support of Seungmoon Lee (Oil), Byunguk Kang (Coal and Gas), SungJae Lee (Heat and Renewables), Sungeun Kim, and Bora Nam. Also, the report was reviewed carefully by Soo-il Kim, Gwang-su Park, and Yoon-young Kang.
If you have any further inquiries, please send an email to [email protected] or call +82-52-714-2102.
1. Energy consumption trends
Energy Demand Outlook, Summer Issue, 2016 3
1. Energy consumption trends
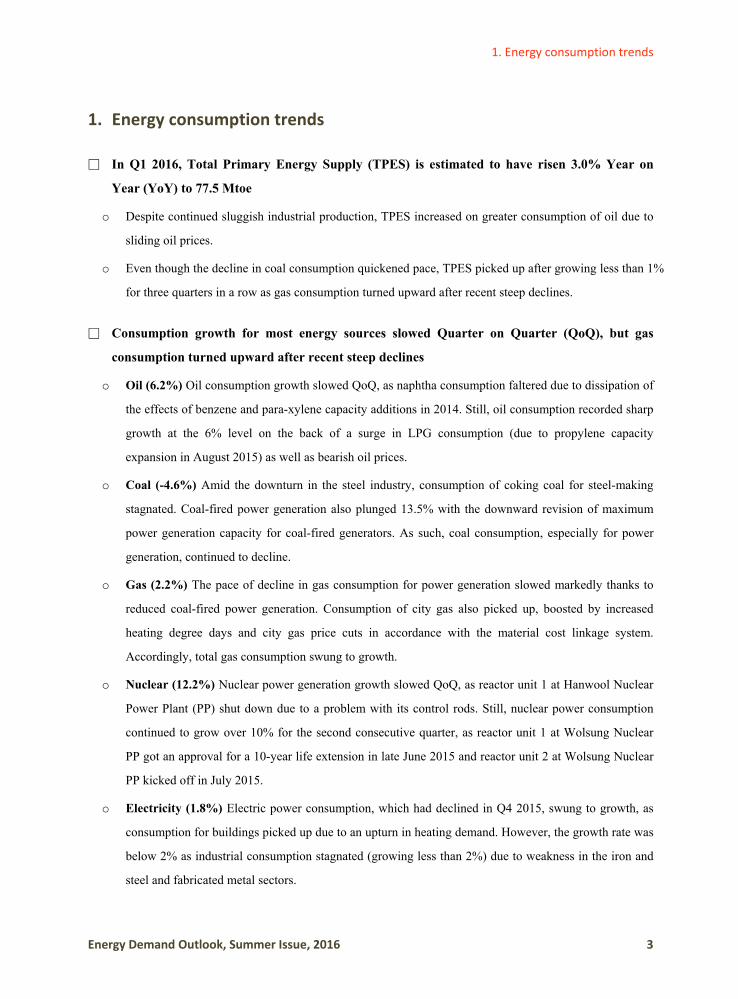
□ In Q1 2016, Total Primary Energy Supply (TPES) is estimated to have risen 3.0% Year on
Year (YoY) to 77.5 Mtoe
o Despite continued sluggish industrial production, TPES increased on greater consumption of oil due to
sliding oil prices.
o Even though the decline in coal consumption quickened pace, TPES picked up after growing less than 1%
for three quarters in a row as gas consumption turned upward after recent steep declines.
□ Consumption growth for most energy sources slowed Quarter on Quarter (QoQ), but gas
consumption turned upward after recent steep declines
o Oil (6.2%) Oil consumption growth slowed QoQ, as naphtha consumption faltered due to dissipation of
the effects of benzene and para-xylene capacity additions in 2014. Still, oil consumption recorded sharp
growth at the 6% level on the back of a surge in LPG consumption (due to propylene capacity
expansion in August 2015) as well as bearish oil prices.
o Coal (-4.6%) Amid the downturn in the steel industry, consumption of coking coal for steel-making
stagnated. Coal-fired power generation also plunged 13.5% with the downward revision of maximum
power generation capacity for coal-fired generators. As such, coal consumption, especially for power
generation, continued to decline.
o Gas (2.2%) The pace of decline in gas consumption for power generation slowed markedly thanks to
reduced coal-fired power generation. Consumption of city gas also picked up, boosted by increased
heating degree days and city gas price cuts in accordance with the material cost linkage system.
Accordingly, total gas consumption swung to growth.
o Nuclear (12.2%) Nuclear power generation growth slowed QoQ, as reactor unit 1 at Hanwool Nuclear
Power Plant (PP) shut down due to a problem with its control rods. Still, nuclear power consumption
continued to grow over 10% for the second consecutive quarter, as reactor unit 1 at Wolsung Nuclear
PP got an approval for a 10-year life extension in late June 2015 and reactor unit 2 at Wolsung Nuclear
PP kicked off in July 2015.
o Electricity (1.8%) Electric power consumption, which had declined in Q4 2015, swung to growth, as
consumption for buildings picked up due to an upturn in heating demand. However, the growth rate was
below 2% as industrial consumption stagnated (growing less than 2%) due to weakness in the iron and
steel and fabricated metal sectors.

KEEI Korea Energy Demand Outlook
4 KOREA ENERGY ECONOMICS INSTITUTE
□ In Q1 2016, Total Final Consumption (TFC) increased 3.3% YoY to 59.8 Mtoe
o Industry (2.7%) The pace of growth in energy consumption for feedstock slowed, especially for
naphtha, but energy consumption for fuel, led by LPG, soared QoQ thanks to the propane
dehydrogenation capacity additions in the petrochemical industry.
o Transport (3.9%) Energy consumption for transportation lost steam on high base effects, but still
maintained strong growth at about 4% on a rapid surge in consumption of most petroleum products
except for LPG amid the oil price slump.
o Buildings (4.4%) Major energy consumption for heating spiked due to a 6.2% rise in heating degree
days, pushing up TFC.
Energy demand outlook
□ In 2016, energy demand is projected to increase more than 1% due to new PPs and low oil
prices
o TPES is expected to rise 1.6% YoY to 289.6 Mtoe, aided by bearish oil prices and new nuclear power
plants, moving up above the 0% growth that has been characteristic of the past four years.
o TFC is also expected to rise 2.3% YoY to 222.6 Mtoe, as the domestic economy is expected to pick up,
driven by domestic demand, and energy prices are expected to remain low.
□ Oil and nuclear power should drive growth in energy demand, while demand for coal and gas
is expected to decline
o In 2016, oil demand is projected to maintain robust growth on continued soft oil prices.
o Coal demand is expected to decrease, despite the planned entry of new coal-fired PPs, as coal demand
for power generation should shrink on lower utilization at power generation facilities.
o Nuclear power generation should grow at a rapid pace, due to an increase in utilization rate of nuclear
PPs, restart of operations at some nuclear PPs, and the entry of new ones.
o Gas demand should continue to decline in 2016 on shrinking demand for power generation, but at a
much slower pace.
o Electric power demand for industries should pick up modestly, boosted by growth in domestic demand,
while demand for buildings should slow down due to the dissipation of high base effects of 2014. As a
result, overall electric power demand should grow at a similar rate as the previous year. However, if the
unusual heat wave persists, electric power demand for buildings may grow faster than expected.

1. Energy consumption trends
Energy Demand Outlook, Summer Issue, 2016 5
Growth in demand for major energy sources
2012 2013 2014 2015p 2016e
TPES 0.7 0.6 0.9 0.8 1.6
Coal - 2.1 1.1 2.9 - 0.1 - 2.9
Oil 3.2 - 0.3 - 0.5 4.2 3.8
Gas 8.1 4.8 - 9.2 - 8.7 - 3.9
Nuclear - 2.8 - 7.7 12.7 5.3 9.3
Electricity 2.5 1.8 0.6 1.3 1.3
□ Growth in industrial energy demand is projected to recover somehow, while the growth in the
transport and buildings sectors should slow
o In 2016, energy demand should swing to growth (about 2%) for industry on the back of better demand
for coking coal in the steel industry coupled with an upturn in LPG demand in the petrochemical
industry.
o For transportation, energy demand growth should slow YoY due to a significantly muted effect from the
oil price plunge, but should still be strong (above 3%) on continued oil price weakness.
o For buildings, despite the increase in gas demand, energy demand growth should slow YoY, especially
for electricity.
Key features & implications
□ In Q1 2016, TPES grew at the sharpest rate since 2011 on increased consumption of oil and
energy for power generation
o For oil, naphtha consumption growth slowed, but amid sliding oil prices, major petroleum products
maintained their rapid consumption growth, acting as a driver of TPES growth since 2015.
o It was due to energy consumption for transformation converting from a decrease to an increase that
TPES growth was able to increase to 3.0% in Q1 2016 from less than 1% for three straight quarters.
o Energy consumption for transformation increased as energy consumption for power generation turned
upward after dropping for two quarters in a row, in spite of a sharper decline in coal consumption, due
to rapid growth in nuclear power generation and oil, as well as a slowed decline in gas-fired power
generation.
o Notably, the decline in coal consumption for power generation was smaller than the decline in coal-
fired power generation, due to inventory depletion in the previous year. This is believed to have resulted
in growth in total energy consumption for power generation.
KEEI Korea Energy Demand Outlook
6 KOREA ENERGY ECONOMICS INSTITUTE
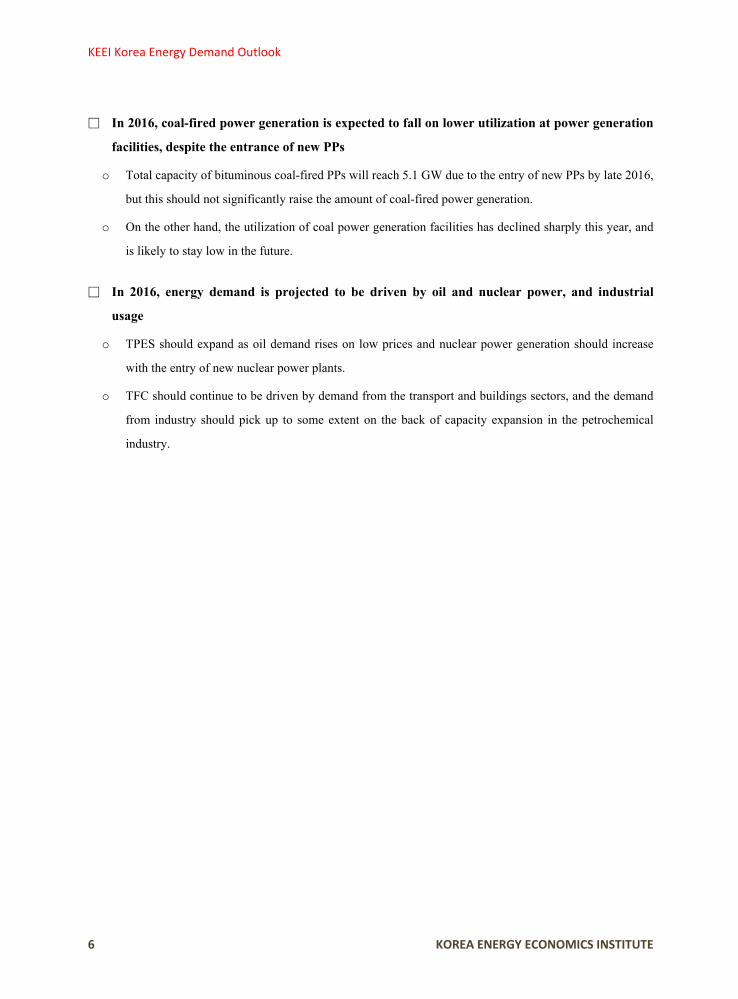
□ In 2016, coal-fired power generation is expected to fall on lower utilization at power generation
facilities, despite the entrance of new PPs
o Total capacity of bituminous coal-fired PPs will reach 5.1 GW due to the entry of new PPs by late 2016,
but this should not significantly raise the amount of coal-fired power generation.
o On the other hand, the utilization of coal power generation facilities has declined sharply this year, and
is likely to stay low in the future.
□ In 2016, energy demand is projected to be driven by oil and nuclear power, and industrial
usage
o TPES should expand as oil demand rises on low prices and nuclear power generation should increase
with the entry of new nuclear power plants.
o TFC should continue to be driven by demand from the transport and buildings sectors, and the demand
from industry should pick up to some extent on the back of capacity expansion in the petrochemical
industry.
2. The Main Indicator and Energy Outlook Result
Energy Demand Outlook, Summer Issue, 2016 7
2. The Main Indicator and Energy Outlook Result
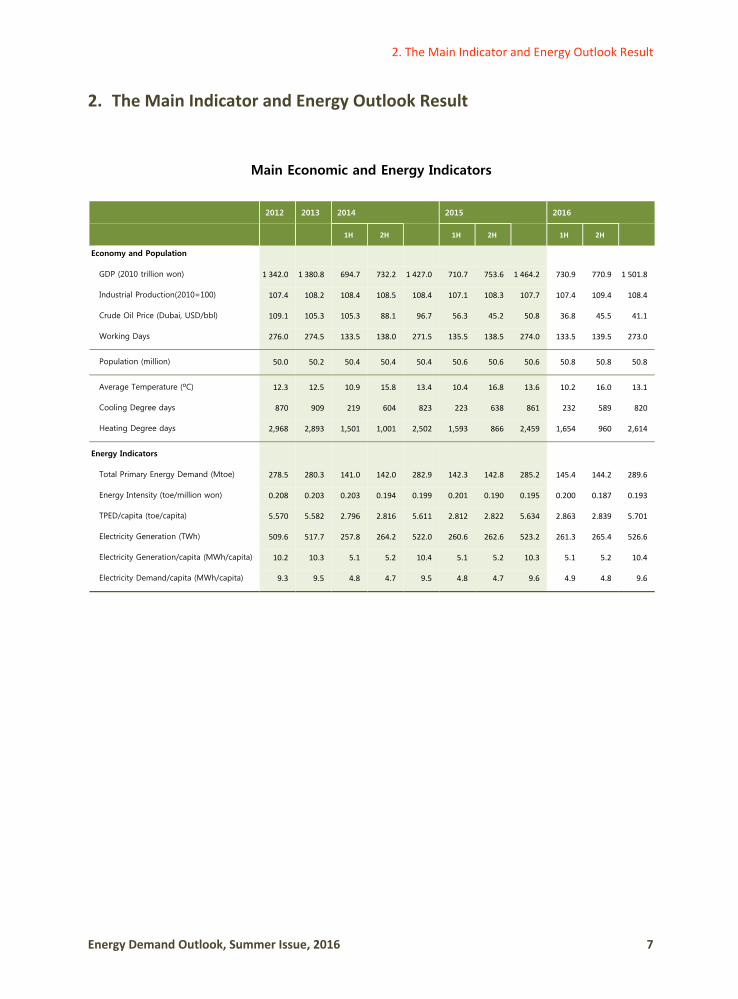
Main Economic and Energy Indicators
2012 2013 2014 2015 2016
1H 2H 1H 2H 1H 2H
Economy and Population
GDP (2010 trillion won) 1 342.0 1 380.8 694.7 732.2 1 427.0 710.7 753.6 1 464.2 730.9 770.9 1 501.8
Industrial Production(2010=100) 107.4 108.2 108.4 108.5 108.4 107.1 108.3 107.7 107.4 109.4 108.4
Crude Oil Price (Dubai, USD/bbl) 109.1 105.3 105.3 88.1 96.7 56.3 45.2 50.8 36.8 45.5 41.1
Working Days 276.0 274.5 133.5 138.0 271.5 135.5 138.5 274.0 133.5 139.5 273.0
Population (million) 50.0 50.2 50.4 50.4 50.4 50.6 50.6 50.6 50.8 50.8 50.8
Average Temperature (ºC) 12.3 12.5 10.9 15.8 13.4 10.4 16.8 13.6 10.2 16.0 13.1
Cooling Degree days 870 909 219 604 823 223 638 861 232 589 820
Heating Degree days 2,968 2,893 1,501 1,001 2,502 1,593 866 2,459 1,654 960 2,614
Energy Indicators
Total Primary Energy Demand (Mtoe) 278.5 280.3 141.0 142.0 282.9 142.3 142.8 285.2 145.4 144.2 289.6
Energy Intensity (toe/million won) 0.208 0.203 0.203 0.194 0.199 0.201 0.190 0.195 0.200 0.187 0.193
TPED/capita (toe/capita) 5.570 5.582 2.796 2.816 5.611 2.812 2.822 5.634 2.863 2.839 5.701
Electricity Generation (TWh) 509.6 517.7 257.8 264.2 522.0 260.6 262.6 523.2 261.3 265.4 526.6
Electricity Generation/capita (MWh/capita) 10.2 10.3 5.1 5.2 10.4 5.1 5.2 10.3 5.1 5.2 10.4
Electricity Demand/capita (MWh/capita) 9.3 9.5 4.8 4.7 9.5 4.8 4.7 9.6 4.9 4.8 9.6
KEEI Korea Energy Demand Outlook
8 KOREA ENERGY ECONOMICS INSTITUTE
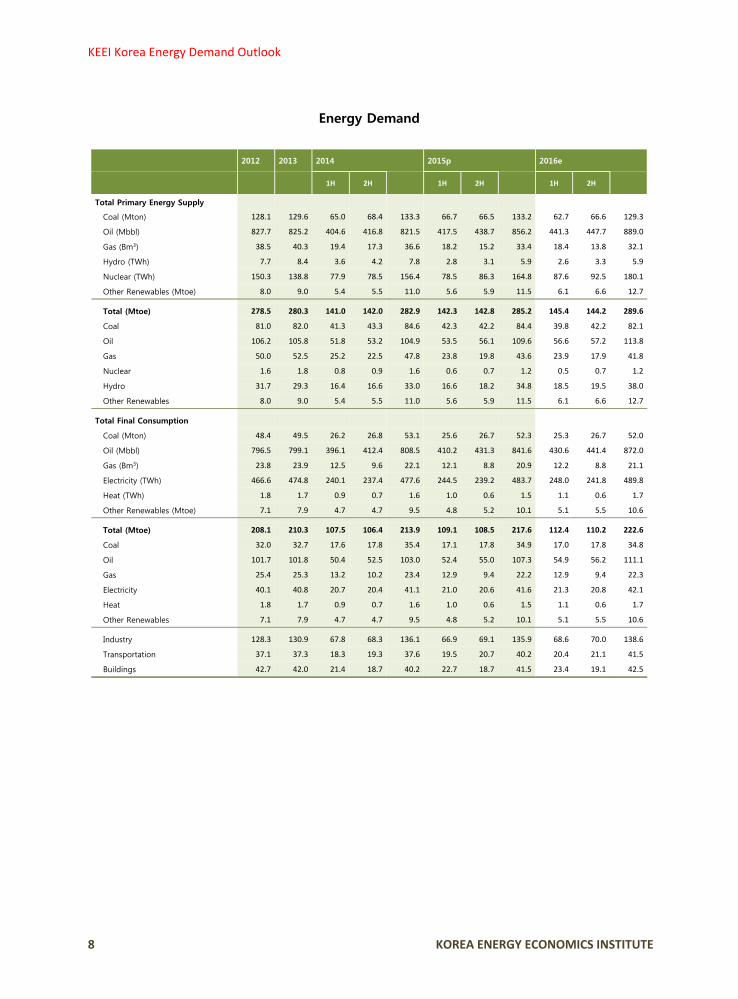
Energy Demand
2012 2013 2014 2015p 2016e
1H 2H 1H 2H 1H 2H
Total Primary Energy Supply
Coal (Mton) 128.1 129.6 65.0 68.4 133.3 66.7 66.5 133.2 62.7 66.6 129.3
Oil (Mbbl) 827.7 825.2 404.6 416.8 821.5 417.5 438.7 856.2 441.3 447.7 889.0
Gas (Bm3) 38.5 40.3 19.4 17.3 36.6 18.2 15.2 33.4 18.4 13.8 32.1
Hydro (TWh) 7.7 8.4 3.6 4.2 7.8 2.8 3.1 5.9 2.6 3.3 5.9
Nuclear (TWh) 150.3 138.8 77.9 78.5 156.4 78.5 86.3 164.8 87.6 92.5 180.1
Other Renewables (Mtoe) 8.0 9.0 5.4 5.5 11.0 5.6 5.9 11.5 6.1 6.6 12.7
Total (Mtoe) 278.5 280.3 141.0 142.0 282.9 142.3 142.8 285.2 145.4 144.2 289.6
Coal 81.0 82.0 41.3 43.3 84.6 42.3 42.2 84.4 39.8 42.2 82.1
Oil 106.2 105.8 51.8 53.2 104.9 53.5 56.1 109.6 56.6 57.2 113.8
Gas 50.0 52.5 25.2 22.5 47.8 23.8 19.8 43.6 23.9 17.9 41.8
Nuclear 1.6 1.8 0.8 0.9 1.6 0.6 0.7 1.2 0.5 0.7 1.2
Hydro 31.7 29.3 16.4 16.6 33.0 16.6 18.2 34.8 18.5 19.5 38.0
Other Renewables 8.0 9.0 5.4 5.5 11.0 5.6 5.9 11.5 6.1 6.6 12.7
Total Final Consumption
Coal (Mton) 48.4 49.5 26.2 26.8 53.1 25.6 26.7 52.3 25.3 26.7 52.0
Oil (Mbbl) 796.5 799.1 396.1 412.4 808.5 410.2 431.3 841.6 430.6 441.4 872.0
Gas (Bm3) 23.8 23.9 12.5 9.6 22.1 12.1 8.8 20.9 12.2 8.8 21.1
Electricity (TWh) 466.6 474.8 240.1 237.4 477.6 244.5 239.2 483.7 248.0 241.8 489.8
Heat (TWh) 1.8 1.7 0.9 0.7 1.6 1.0 0.6 1.5 1.1 0.6 1.7
Other Renewables (Mtoe) 7.1 7.9 4.7 4.7 9.5 4.8 5.2 10.1 5.1 5.5 10.6
Total (Mtoe) 208.1 210.3 107.5 106.4 213.9 109.1 108.5 217.6 112.4 110.2 222.6
Coal 32.0 32.7 17.6 17.8 35.4 17.1 17.8 34.9 17.0 17.8 34.8
Oil 101.7 101.8 50.4 52.5 103.0 52.4 55.0 107.3 54.9 56.2 111.1
Gas 25.4 25.3 13.2 10.2 23.4 12.9 9.4 22.2 12.9 9.4 22.3
Electricity 40.1 40.8 20.7 20.4 41.1 21.0 20.6 41.6 21.3 20.8 42.1
Heat 1.8 1.7 0.9 0.7 1.6 1.0 0.6 1.5 1.1 0.6 1.7
Other Renewables 7.1 7.9 4.7 4.7 9.5 4.8 5.2 10.1 5.1 5.5 10.6
Industry 128.3 130.9 67.8 68.3 136.1 66.9 69.1 135.9 68.6 70.0 138.6
Transportation 37.1 37.3 18.3 19.3 37.6 19.5 20.7 40.2 20.4 21.1 41.5
Buildings 42.7 42.0 21.4 18.7 40.2 22.7 18.7 41.5 23.4 19.1 42.5

2. The Main Indicator and Energy Outlook Result
Energy Demand Outlook, Summer Issue, 2016 9
Energy Demand
(YoY, %)
2012 2013 2014 2015p 2016e
1H 2H 1H 2H 1H 2H
Total Primary Energy Supply
Coal (Mton) - 2.1 1.1 1.5 4.3 2.9 2.6 - 2.7 - 0.1 - 6.0 0.2 - 2.9
Oil (Mbbl) 3.3 - 0.3 - 0.2 - 0.7 - 0.5 3.2 5.2 16.8 5.7 2.1 3.8
Gas (Bm3) 8.1 4.8 - 9.8 - 8.4 - 9.2 - 5.8 - 12.0 - 33.0 0.7 - 9.3 - 3.9
Hydro (TWh) - 2.3 9.7 - 8.3 - 5.6 - 6.8 - 22.3 - 26.6 - 98.3 - 8.4 7.1 - 0.3
Nuclear (TWh) - 2.8 - 7.7 14.3 11.2 12.7 0.7 9.9 21.5 11.6 7.2 9.3
Other Renewables (Mtoe) 21.4 11.8 21.8 22.1 21.9 3.8 7.0 21.5 8.6 12.0 10.3
Total (Mtoe) 0.7 0.6 0.6 1.2 0.9 1.0 0.6 3.1 2.2 1.0 1.6
Coal - 3.2 1.2 2.0 4.5 3.2 2.3 - 2.6 - 0.6 - 5.8 0.2 - 2.8
Oil 1.0 - 0.3 - 0.4 - 1.2 - 0.8 3.3 5.4 17.4 5.8 2.0 3.8
Gas 8.4 5.0 - 9.6 - 8.4 - 9.0 - 5.8 - 12.0 - 33.0 0.5 - 9.6 - 4.1
Nuclear - 4.1 9.7 - 8.3 - 5.6 - 6.8 - 22.3 - 26.6 - 98.3 - 8.4 7.1 - 0.3
Hydro - 4.7 - 7.7 14.3 11.2 12.7 0.7 9.9 21.5 11.6 7.2 9.3
Other Renewables 21.4 11.8 21.8 22.1 21.9 3.8 7.0 21.5 8.6 12.0 10.3
Total Final Consumption
Coal (Mton) - 3.0 2.3 9.4 4.9 7.1 - 2.5 - 0.2 - 5.3 - 1.0 - 0.2 - 0.6
Oil (Mbbl) 2.3 0.3 1.0 1.3 1.2 3.6 4.6 16.3 5.0 2.3 3.6
Gas (Bm3) 9.7 0.5 - 10.3 - 3.7 - 7.5 - 3.1 - 8.5 - 21.7 1.1 0.4 0.8
Electricity (TWh) 2.5 1.8 0.5 0.6 0.6 1.8 0.7 5.1 1.5 1.1 1.3
Heat (TWh) 2.9 - 3.2 - 14.0 3.2 - 7.6 6.1 - 13.9 - 1.6 8.7 7.1 8.2
Other Renewables (Mtoe) 22.1 10.7 20.3 19.9 20.1 2.4 10.1 25.0 6.4 4.4 5.3
Total (Mtoe) 1.1 1.0 1.3 2.1 1.7 1.5 2.0 7.0 3.0 1.6 2.3
Coal - 4.7 2.4 10.5 6.0 8.2 - 2.8 - 0.1 - 5.7 - 0.7 - 0.1 - 0.4
Oil - 0.3 0.1 1.0 1.3 1.1 3.8 4.7 16.9 4.9 2.3 3.6
Gas 7.5 - 0.4 - 10.5 - 3.8 - 7.7 - 2.5 - 8.3 - 19.9 0.7 - 0.1 0.4
Electricity 2.5 1.8 0.5 0.6 0.6 1.8 0.7 5.1 1.5 1.1 1.3
Heat 2.9 - 3.2 - 14.0 3.2 - 7.6 6.1 - 13.9 - 1.6 8.7 7.1 8.2
Other Renewables 22.1 10.7 20.3 19.9 20.1 2.4 10.1 25.0 6.4 4.4 5.3
Industry 1.1 2.0 5.2 2.7 4.0 - 1.4 1.1 - 0.5 2.6 1.4 2.0
Transportation 0.7 0.5 0.2 1.4 0.8 6.8 7.0 27.8 4.3 2.1 3.2
Buildings 1.3 - 1.4 - 8.7 0.8 - 4.5 6.2 0.0 13.9 2.9 1.9 2.5

KEEI Korea Energy Demand Outlook
10 KOREA ENERGY ECONOMICS INSTITUTE
Energy Demand by Sector
(Mtoe)
2012 2013 2014 2015p 2016e
1H 2H 1H 2H 1H 2H
Industry 128.3 130.9 67.8 68.3 136.1 66.9 69.1 135.9 68.6 70.0 138.6
Coal 31.1 31.8 17.3 17.3 34.7 16.8 17.4 34.2 16.8 17.4 34.2
Oil 59.7 60.1 30.2 31.0 61.2 30.3 31.9 62.2 31.9 32.7 64.6
Gas 10.2 10.4 4.9 4.5 9.4 4.2 4.0 8.3 4.1 3.9 8.0
Electricity 21.4 22.1 11.4 11.4 22.8 11.5 11.4 22.8 11.6 11.5 23.0
Heat - - - - - - - - - - -
Other Renewables 5.8 6.5 4.0 4.0 8.1 4.0 4.4 8.4 4.3 4.5 8.8
Transportation 37.1 37.3 18.3 19.3 37.6 19.5 20.7 40.2 20.4 21.1 41.5
Coal - - - - - - - - - - -
Oil 35.3 35.5 17.4 18.4 35.8 18.6 19.7 38.4 19.5 20.1 39.6
Gas 1.2 1.3 0.6 0.7 1.3 0.6 0.7 1.3 0.6 0.7 1.3
Electricity 0.2 0.2 0.1 0.1 0.2 0.1 0.1 0.2 0.1 0.1 0.2
Heat - - - - - - - - - - -
Other Renewables 0.4 0.4 0.2 0.2 0.4 0.2 0.2 0.4 0.2 0.2 0.4
Buildings* 42.7 42.0 21.4 18.7 40.2 22.7 18.7 41.5 23.4 19.1 42.5
Coal 0.8 0.9 0.3 0.5 0.7 0.3 0.4 0.7 0.2 0.4 0.6
Oil 6.6 6.2 2.9 3.1 6.0 3.4 3.3 6.8 3.6 3.4 7.0
Gas 14.0 13.7 7.7 5.0 12.7 8.0 4.7 12.7 8.2 4.8 13.0
Electricity 18.5 18.6 9.2 8.9 18.1 9.5 9.1 18.6 9.7 9.2 18.8
Heat 1.8 1.7 0.9 0.7 1.6 1.0 0.6 1.5 1.1 0.6 1.7
Other Renewables 1.0 1.0 0.5 0.5 1.0 0.6 0.7 1.3 0.6 0.8 1.4
Transformation 137.4 137.8 68.2 66.8 135.1 68.0 64.8 132.8 68.4 64.7 133.1
Coal 49.0 49.2 23.7 25.5 49.2 25.2 24.4 49.5 22.9 24.4 47.3
Oil 4.5 4.0 1.3 0.7 2.0 1.1 1.1 2.2 1.6 1.0 2.6
Gas 49.7 52.4 25.3 22.5 47.7 23.7 19.8 43.5 23.9 17.9 41.8
Nuclear 31.7 29.3 16.4 16.6 33.0 16.6 18.2 34.8 18.5 19.5 38.0
Hydro 1.6 1.8 0.8 0.9 1.6 0.6 0.7 1.2 0.5 0.7 1.2
Renewables 0.9 1.1 0.7 0.8 1.5 0.8 0.7 1.5 1.0 1.2 2.1
* include residential, commercial, public∙etc. usage

2. The Main Indicator and Energy Outlook Result
Energy Demand Outlook, Summer Issue, 2016 11
Coal
(Mton)
2012 2013 2014 2015p 2016e
1H 2H 1H 2H 1H 2H
Coal 128.1 129.6 65.0 68.4 133.3 66.7 66.5 133.2 62.7 66.6 129.3
Transformation 79.7 80.0 38.7 41.5 80.3 41.1 39.8 80.9 37.3 39.9 77.3
Power Generation 79.7 80.0 38.7 41.5 80.3 41.1 39.8 80.9 37.3 39.9 77.3
Heat - - - - - - - - - - -
Gas Manufacture - - - - - - - - - - -
Total Final Consumption 48.4 49.5 26.2 26.8 53.1 25.6 26.7 52.3 25.3 26.7 52.0
Industry 46.6 47.6 25.7 25.7 51.4 25.0 25.8 50.9 24.9 25.9 50.7
Transportation - - - - - - - - - - -
Buildings 1.8 1.9 0.6 1.1 1.6 0.5 0.9 1.5 0.5 0.8 1.3
Consumption by products
Anthracite 10.5 10.7 4.7 5.5 10.2 5.0 5.6 10.7 4.6 5.4 10.0
Bituminous
117.7
118.8 60.3 62.8 123.1 61.6 60.9
122.5 58.1 61.2 119.3
Iron making 31.5 32.1 18.8 18.8 37.6 18.0 18.7 36.8 18.2 18.8 36.9
Cement 4.6 4.6 2.5 2.4 4.9 2.3 2.4 4.7 2.3 2.4 4.7
Power Generation 79.1 79.7 37.8 40.4 78.2 40.0 38.7 78.7 36.4 39.0 75.4

KEEI Korea Energy Demand Outlook
12 KOREA ENERGY ECONOMICS INSTITUTE
Oil
(Mbbl)
2012 2013 2014 2015p 2016e
1H 2H 1H 2H 1H 2H
Oil 827.7 825.2 404.6 416.8 821.5 417.5 438.7 856.2 441.3 447.7 889.0
Transformation 31.2 26.1 8.6 4.4 13.0 7.3 7.3 14.6 10.7 6.4 17.0
Power Generation 22.4 23.0 7.5 3.5 11.0 6.3 6.6 12.8 9.7 5.5 15.2
Heat 1.3 1.3 0.6 0.4 1.0 0.6 0.2 0.8 0.4 0.3 0.8
Gas Manufacture 7.5 1.9 0.5 0.4 0.9 0.5 0.6 1.0 0.5 0.5 1.0
Total Final Consumption 796.5 799.1 396.1 412.4 808.5 410.2 431.3 841.6 430.6 441.4 872.0
Industry
478.0
482.0
242.4
249.5
491.8
243.8
257.2
501.0
257.2
264.2
521.4
Transportation
266.0
267.4
130.7
138.1
268.8
139.4
147.6
287.1
145.0
150.5
295.5Buildings 52.6 49.7 23.0 24.9 47.9 27.0 26.5 53.5 28.4 26.7 55.1
Consumption by products
Gasoline 71.8 73.4 35.5 38.0 73.5 37.1 39.5 76.6 38.0 40.0 78.0
Diesel (including Transformation) 136.7 143.0 70.5 74.3 144.8 76.0 80.4 156.4 80.6 81.8 162.4
Kerosene (including Transformation) 22.0 18.8 7.1 8.4 15.4 8.2 8.0 16.2 10.2 8.3 18.4
B-C (including Transformation) 54.5 46.4 18.9 14.4 33.3 19.3 19.0 38.3 23.6 18.8 42.4
Jet Oil 30.2 30.3 15.7 16.3 32.0 17.1 17.3 34.4 18.1 18.0 36.1
LPG (including Transformation) 95.5 93.1 44.0 45.6 89.6 41.5 48.4 89.9 48.2 50.9 99.1
Naphtha 384.6 384.2 194.7 201.7 396.3 203.1 207.7 410.8 205.7 211.1 416.8
Other Non-Energy 32.4 36.0 18.3 18.2 36.6 15.4 18.3 33.7 16.9 18.8 35.7

2. The Main Indicator and Energy Outlook Result
Energy Demand Outlook, Summer Issue, 2016 13
Gas
2012 2013 2014 2015p 2016e
1H 2H 1H 2H 1H 2H
Gas (Mton) 38.5 40.3 19.4 17.3 36.6 18.2 15.2 33.4 18.4 13.8 32.1
Transformation 37.9 40.0 19.2 17.1 36.4 18.1 15.0 33.1 18.2 13.6 31.8
Power Generation 16.1 17.6 7.8 8.1 15.9 7.0 6.4 13.4 6.8 5.1 11.9
Heat 2.0 2.6 1.5 0.7 2.2 1.4 1.3 2.7 1.6 0.9 2.6
Gas Manufacture 19.8 19.8 10.0 8.3 18.3 9.7 7.3 17.0 9.8 7.5 17.4
Industry 0.6 0.4 0.1 0.2 0.3 0.2 0.2 0.3 0.2 0.2 0.3
City Gas (Bm3) 23.8 23.9 12.5 9.6 22.1 12.1 8.8 20.9 12.2 8.8 21.1
Industry* 9.1 9.5 4.6 4.1 8.7 3.8 3.7 7.5 3.7 3.6 7.3
Transportation 1.2 1.2 0.6 0.6 1.3 0.6 0.6 1.2 0.6 0.6 1.2
Buildings 13.4 13.1 7.3 4.8 12.2 7.7 4.5 12.2 7.9 4.6 12.5
* exclude industrial LNG usage
KEEI Korea Energy Demand Outlook
14 KOREA ENERGY ECONOMICS INSTITUTE
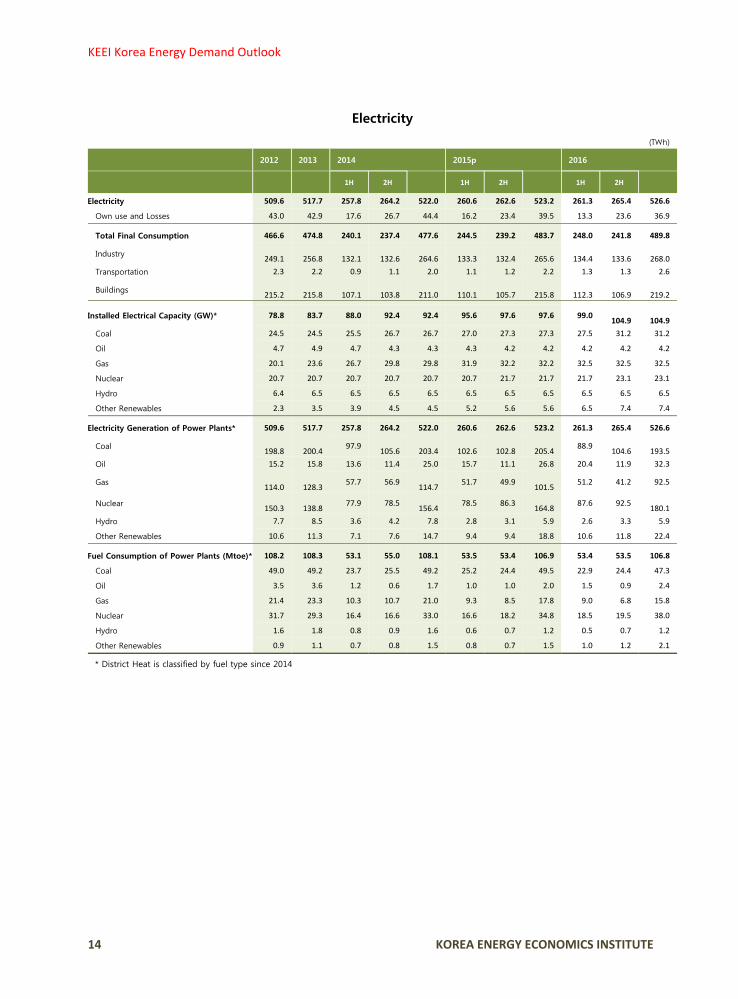
Electricity
(TWh)
2012 2013 2014 2015p 2016
1H 2H 1H 2H 1H 2H
Electricity 509.6 517.7 257.8 264.2 522.0 260.6 262.6 523.2 261.3 265.4 526.6
Own use and Losses 43.0 42.9 17.6 26.7 44.4 16.2 23.4 39.5 13.3 23.6 36.9
Total Final Consumption 466.6 474.8 240.1 237.4 477.6 244.5 239.2 483.7 248.0 241.8 489.8
Industry
249.1
256.8
132.1
132.6
264.6
133.3
132.4
265.6
134.4
133.6
268.0Transportation 2.3 2.2 0.9 1.1 2.0 1.1 1.2 2.2 1.3 1.3 2.6
Buildings
215.2
215.8
107.1
103.8
211.0
110.1
105.7
215.8
112.3
106.9
219.2
Installed Electrical Capacity (GW)* 78.8 83.7 88.0 92.4 92.4 95.6 97.6 97.6 99.0 104.9
104.9
Coal 24.5 24.5 25.5 26.7 26.7 27.0 27.3 27.3 27.5 31.2 31.2
Oil 4.7 4.9 4.7 4.3 4.3 4.3 4.2 4.2 4.2 4.2 4.2
Gas 20.1 23.6 26.7 29.8 29.8 31.9 32.2 32.2 32.5 32.5 32.5
Nuclear 20.7 20.7 20.7 20.7 20.7 20.7 21.7 21.7 21.7 23.1 23.1
Hydro 6.4 6.5 6.5 6.5 6.5 6.5 6.5 6.5 6.5 6.5 6.5
Other Renewables 2.3 3.5 3.9 4.5 4.5 5.2 5.6 5.6 6.5 7.4 7.4
Electricity Generation of Power Plants* 509.6 517.7 257.8 264.2 522.0 260.6 262.6 523.2 261.3 265.4 526.6
Coal
198.8
200.4 97.9 105.6
203.4
102.6
102.8
205.4 88.9
104.6
193.5Oil 15.2 15.8 13.6 11.4 25.0 15.7 11.1 26.8 20.4 11.9 32.3
Gas
114.0
128.3 57.7 56.9 114.7 51.7 49.9
101.5 51.2 41.2 92.5
Nuclear
150.3
138.8 77.9 78.5 156.4 78.5 86.3
164.8 87.6 92.5 180.1
Hydro 7.7 8.5 3.6 4.2 7.8 2.8 3.1 5.9 2.6 3.3 5.9
Other Renewables 10.6 11.3 7.1 7.6 14.7 9.4 9.4 18.8 10.6 11.8 22.4
Fuel Consumption of Power Plants (Mtoe)* 108.2 108.3 53.1 55.0 108.1 53.5 53.4 106.9 53.4 53.5 106.8
Coal 49.0 49.2 23.7 25.5 49.2 25.2 24.4 49.5 22.9 24.4 47.3
Oil 3.5 3.6 1.2 0.6 1.7 1.0 1.0 2.0 1.5 0.9 2.4
Gas 21.4 23.3 10.3 10.7 21.0 9.3 8.5 17.8 9.0 6.8 15.8
Nuclear 31.7 29.3 16.4 16.6 33.0 16.6 18.2 34.8 18.5 19.5 38.0
Hydro 1.6 1.8 0.8 0.9 1.6 0.6 0.7 1.2 0.5 0.7 1.2
Other Renewables 0.9 1.1 0.7 0.8 1.5 0.8 0.7 1.5 1.0 1.2 2.1
* District Heat is classified by fuel type since 2014
2. The Main Indicator and Energy Outlook Result
Energy Demand Outlook, Summer Issue, 2016 15
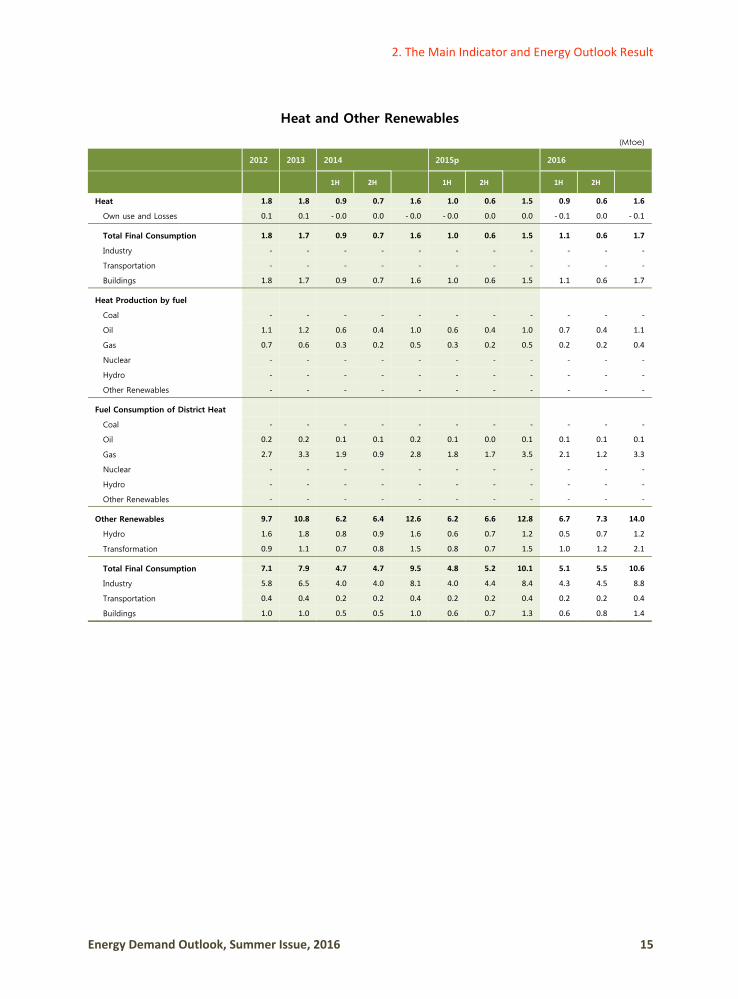
Heat and Other Renewables
(Mtoe)
2012 2013 2014 2015p 2016
1H 2H 1H 2H 1H 2H
Heat 1.8 1.8 0.9 0.7 1.6 1.0 0.6 1.5 0.9 0.6 1.6
Own use and Losses 0.1 0.1 - 0.0 0.0 - 0.0 - 0.0 0.0 0.0 - 0.1 0.0 - 0.1
Total Final Consumption 1.8 1.7 0.9 0.7 1.6 1.0 0.6 1.5 1.1 0.6 1.7
Industry - - - - - - - - - - -
Transportation - - - - - - - - - - -
Buildings 1.8 1.7 0.9 0.7 1.6 1.0 0.6 1.5 1.1 0.6 1.7
Heat Production by fuel
Coal - - - - - - - - - - -
Oil 1.1 1.2 0.6 0.4 1.0 0.6 0.4 1.0 0.7 0.4 1.1
Gas 0.7 0.6 0.3 0.2 0.5 0.3 0.2 0.5 0.2 0.2 0.4
Nuclear - - - - - - - - - - -
Hydro - - - - - - - - - - -
Other Renewables - - - - - - - - - - -
Fuel Consumption of District Heat
Coal - - - - - - - - - - -
Oil 0.2 0.2 0.1 0.1 0.2 0.1 0.0 0.1 0.1 0.1 0.1
Gas 2.7 3.3 1.9 0.9 2.8 1.8 1.7 3.5 2.1 1.2 3.3
Nuclear - - - - - - - - - - -
Hydro - - - - - - - - - - -
Other Renewables - - - - - - - - - - -
Other Renewables 9.7 10.8 6.2 6.4 12.6 6.2 6.6 12.8 6.7 7.3 14.0
Hydro 1.6 1.8 0.8 0.9 1.6 0.6 0.7 1.2 0.5 0.7 1.2
Transformation 0.9 1.1 0.7 0.8 1.5 0.8 0.7 1.5 1.0 1.2 2.1
Total Final Consumption 7.1 7.9 4.7 4.7 9.5 4.8 5.2 10.1 5.1 5.5 10.6
Industry 5.8 6.5 4.0 4.0 8.1 4.0 4.4 8.4 4.3 4.5 8.8
Transportation 0.4 0.4 0.2 0.2 0.4 0.2 0.2 0.4 0.2 0.2 0.4
Buildings 1.0 1.0 0.5 0.5 1.0 0.6 0.7 1.3 0.6 0.8 1.4


KEEI Korea Energy Demand Outlook (Volume 18 No. 2)
Printed in Summer 2016
Issued in Summer 2016
CEO of publisher: Park Joo-heon
Publisher: Korea Energy Economics Institute
405-11, Jongga-ro, Jung-gu, Ulsan, Korea, 44543
Phone: (052)714-2270, Fax: (052)714-2025
Registration: No. 8 on December 7, 1992
Printed by: Bumshinsa (052)245-8737
ⓒ Korea Energy Economic Institute 2016

KEEI Korea Energy Demand Outlook
ISSN 2093-71999 772093 719008
6 2
Korea Energy Demand Outlook
405-11, Jongga-ro, Jung-gu, Ulsan, Korea, 44543
Phone: (052)714-2270
Fax: (052)714-2025
E-mail : [email protected]
Hompage : http://www.keei.re.kr


![OECD · 2021. 1. 31. · Title [KEEI]11월인포그래픽(18호)_전체 Created Date: 11/24/2020 10:02:06 AM](https://static.fdocuments.in/doc/165x107/60d1f6b328419418e7548e51/2021-1-31-title-keei11ee18-created-date-11242020.jpg)