Kiwibank 2013 Annual results · Healthy balance sheet position Lending growth continues despite a...
17
Kiwibank 2013 Annual Results Investor Relations Presentation
Transcript of Kiwibank 2013 Annual results · Healthy balance sheet position Lending growth continues despite a...

Kiwibank
2013 Annual Results
Investor Relations Presentation

Headline Results
Increased net interest income and controlled expenses helped lift
after-tax profit 23%
Release of bad debt provisioning from $91m to $72m highlights
stronger credit position
Dollars in millions 2013 2012 % growth
Net interest income 276 257
Other income 170 162
Total operating
revenue 446 419 6%
Total expenses (311) (308) 1%
Profit before tax 135
111 22%
Income tax expense (38) (32)
Profit after tax 97 79 23%
2
Healthy balance sheet position
Lending growth continues despite a static home loan rate market
Customer deposits still strong and provide 84% of all bank funding
3
Dollars in millions
30 June
2013
30 June
2012 % growth
Assets
Loans and advances 13,202 12,445 6%
Wholesale & other assets 2,007 2,300
Total assets 15,209 14,745 3%
Financed by:
Liabilities
Customer deposits 12,120 11,565 5%
Securities issued & other liabilities 2,231 2,433
Total Liabilities 14,351 13,998 3%
Shareholder's equity 858 747 15%
Total liabilities and shareholder's equity 15,209 14,745

Segment Update
Personal Markets
Continued growth in balance sheet since June 2012:
Lending increased 9% from $9.8bn to $10.7bn
Customer deposits increased 4.8% from $11.6bn to $12.1bn
Customer growth continued and now approximately 850,000
Christchurch market share now estimated to exceed 12% with new lending
exceeding pre-quake growth rates
Comparatively low exposure to high LVR loans
Overall main bank market share now at 10.3% (up from 9.5% last year)
4

Segment Update
Business Markets
Continued focus on credit quality and building a specialist SME business
Our customer satisfaction and likelihood to recommend are number 1 in the
SME market
As a result we have grown our customer base by over 8% in the last year in
a market that is predominantly flat.
Our current and future focus is to enable our customers to spend more time
on their business by simplifying their banking experience
5

Segment Update Wealth
A successful first full year of operations for GMI under Kiwibank, increasing FUM
by 18% and performing ahead of expectations
Successful distribution of Gareth Morgan KiwiSaver (GMK) through the
Kiwibank/NZ Post network resulting in a 17% increase in GMK members
Built out the Investment Strategy Team with key appointments
Increased Kiwibank/NZ Post network sales from 3,500 in 2012 to over 13,000 in
2013
Insurance
Kiwi Insurance Limited continues the transition to full in-house manufacturing
capability for Life Insurance
Kiwi Insurance received a Financial Strength Rating of A- (Excellent) from
AM Best in September last year
Launched the innovative “Life & Living” product in October last year
Received a full licence from the Reserve Bank under the Insurance (Prudential
Supervision) Act 2010 this year
Continuing to facilitate house insurance in Christchurch
6

Mortgage lending metrics
Kiwibank ranks favourably compared with other major banks in
exposure to low loan-to-value ratio mortgages
New RBNZ lending rules apply from 1 October 2013 require banks to
restrict new lending on loans with LVRs greater than 80% to 10%
Although the full implications of this new limit are yet to be assessed,
as an initial response Kiwibank will prioritise first home buyers.
Welcome Home loans, bridging and simple refinancing fall outside the
10% limit
7
Loan-to-value ratios
at 30 June 2013 Kiwibank Westpac BNZ ASB ANZ
LVR 0-80% 84% 77% 85% 79% 77%
LVR >80-90% 13% 15% 8% 13% 15%
LVR 90%+ 3% 8% 7% 8% 8%
Source: 30 June 2013 Disclosure Statements
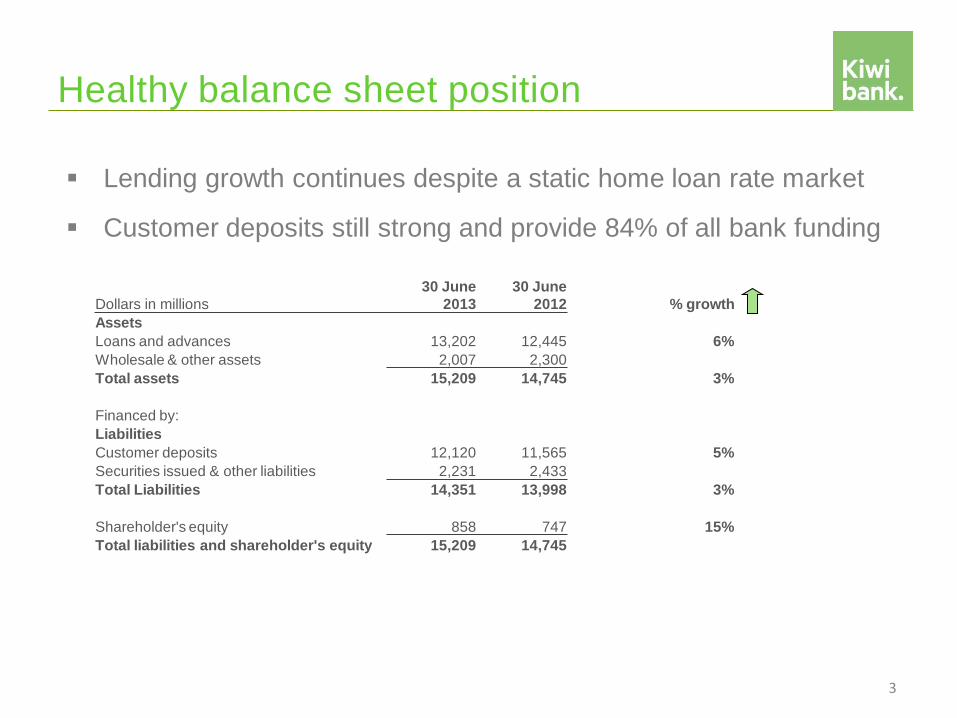
Credit quality – impairments & provisioning
A key focus from management and
RBNZ is the total credit provisioning
relative to gross loans and advances
Kiwibank remains favourably placed
against other banks for total
impairments against gross loans &
advances with impaired assets of
$54m (down from $84m)
8
Impairments
30 June
2013
30 June
2012
Kiwibank 0.43% 0.67%
ASB 0.52% 0.47%
BNZ 0.72% 0.86%
Westpac 1.04% 1.61%
ANZ/National 1.14% 1.65%
Provisioning
30 June
2013
30 June
2012
Kiwibank 0.57% 0.73%
ASB 0.37% 0.41%
BNZ 0.73% 0.86%
Westpac 0.92% 1.08%
ANZ/National 0.99% 1.26%
Source: 30 June 2013 Disclosure Statements

Capital Adequacy
Following the implementation of the more conservative Basel III regulations
on 1 January 2013, Kiwibank’s capital ratios remain strong and in excess of
RBNZ required minima. Common Equity Tier 1 Ratio at 30 June 2013 was
8.4%, 3.9% above the required RBNZ minima
Total capital increased by 20% to $942m, resulting in a total capital ratio
under Basel III of 12.6%
Kiwibank raised $150m of term subordinated debt in December 2012, the first
issue of Tier 2 qualifying securities in New Zealand under the Reserve Bank’s
new Basel III rules, of which $108m can be recognised as Tier 2 capital
Successful first issuance into the Swiss market off Kiwibank’s covered bond
programme (CHF150m)
Kiwi Income Securities (non-controlling preference shares) of $150m are not
compliant under Basel III and the capital contribution will decrease from
January 2014 by 20%. First call date is May 2015
Capital from self generation, market issuance and NZ Post will support the
capital demands of the bank in the short to medium term
9
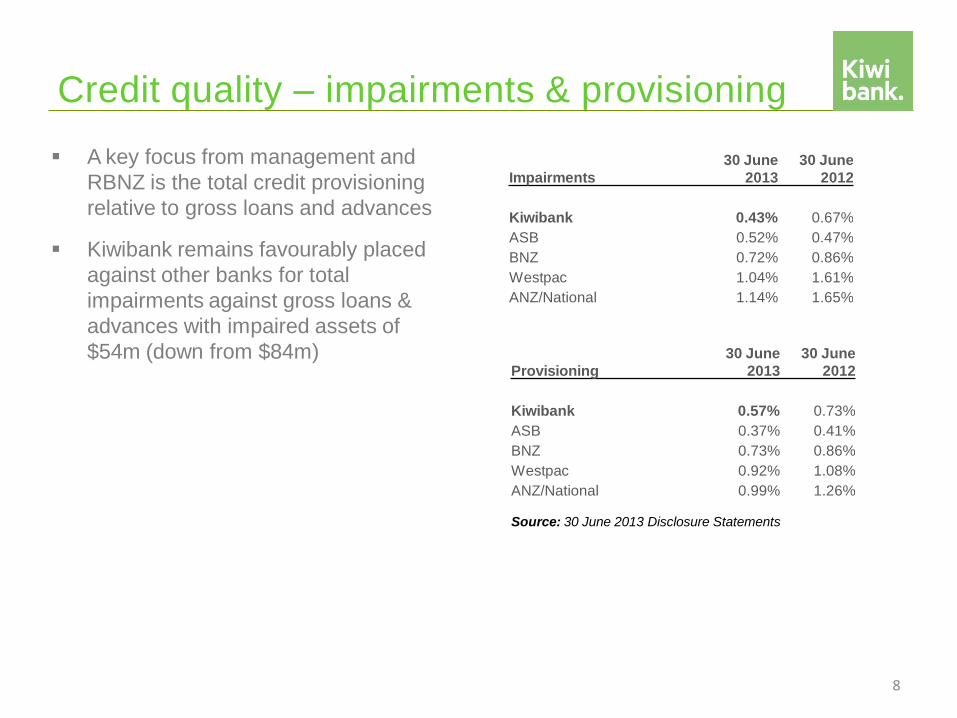
Debt funding programmes
Programmes Market Term Size At 30 June 2013
Registered Certificates of
Deposit
RCDs
NZ Short Unlimited NZ$252m
Medium Term Notes
NZ MTN
NZ Long Unlimited NZ$238m
Residential Mortgage Backed
Securities
RMBS
NZ Short NZ$600m -
Euro-Commercial Paper
ECP
Offshore Short US$2,000m NZ$387m
Australian Medium Term Notes
Kangaroo
Australia Long A$1,500m NZ$425m
Covered Bond NZ/Offshore Long NZ$3b NZ$201m
(CHF 150m)
Subordinated Bond NZ Long Unlimited NZ$210m
10
The future
Roll out of new branch layouts for NZ Post and Kiwibank following North
Shore (Auckland) and Kapiti pilots
On-going focus on helping customers switch to Kiwibank
Increasing market share in the small and medium enterprise market
Explore growth opportunities in the insurance business
Consolidate market position as a bank of national and strategic importance
Capture the growth of Kiwisaver membership across the industry
Continued support of the Kiwibank New Zealander of the Year and local
heroes awards
11

12
Appendices
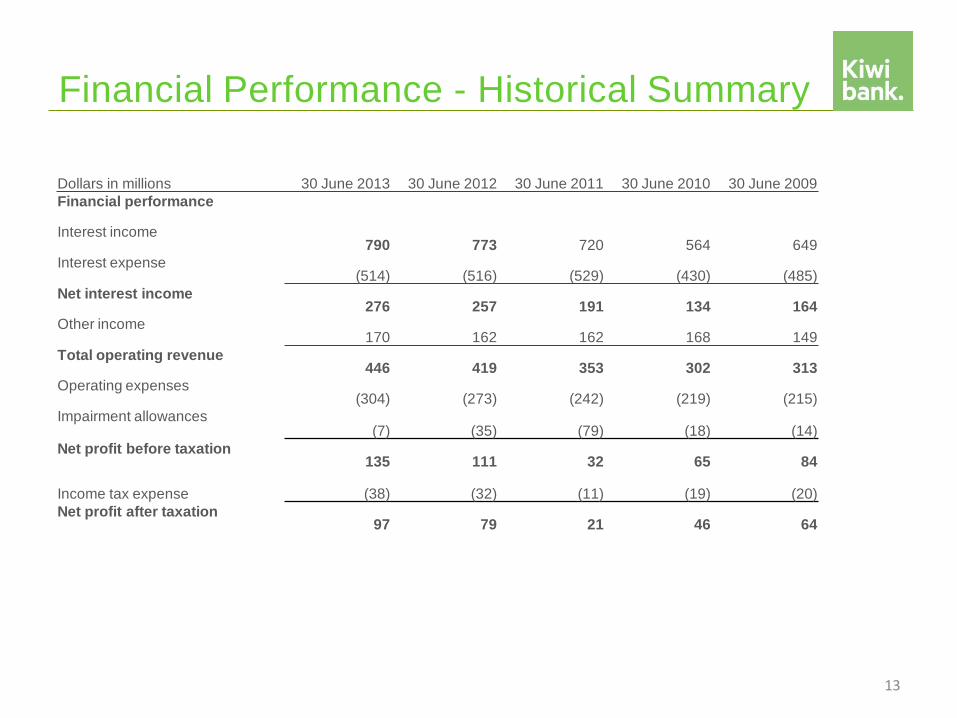
Financial Performance - Historical Summary
13
Dollars in millions 30 June 2013 30 June 2012 30 June 2011 30 June 2010 30 June 2009
Financial performance
Interest income 790 773 720 564 649
Interest expense (514) (516) (529) (430) (485)
Net interest income 276 257 191 134 164
Other income 170 162 162 168 149
Total operating revenue 446 419 353 302 313
Operating expenses (304) (273) (242) (219) (215)
Impairment allowances (7) (35) (79) (18) (14)
Net profit before taxation 135 111 32 65 84
Income tax expense (38) (32) (11) (19) (20)
Net profit after taxation 97 79 21 46 64

Key ratios
Ratios in percentage terms 30 June 2013 30 June 2012
Profitability measures
Net interest income/average interest bearing assets 1.81% 1.8%
Net profit after tax/average shareholder's funds 12.1% 11.7%
Efficiency measures
Operating expenses/total income 68.1% 65.1%
Operating expenses/average total assets 2.0% 1.9%
Capital ratios
Total capital ratio 12.6% 11.3%
14
Awards and achievements
Global Finance Best Bank in NZ 2013
Sunday Star Times Bank of Year Award
Canstar Best Value Everyday banking Award
Highest level of customer satisfaction (Roy Morgan)
Most trusted bank brand (Reader’s Digest)
15

Key contacts
16
Head of Funding Geoff Martin DDI: +64 4 439 6932
Mobile: +64 27 3266 405 [email protected]
Investor Relations Kevin Hastings DDI: +64 4496 4923
Mobile: +64 27 706 6485 [email protected]
Kiwibank Investor Centre www.kiwibank.co.nz/about-us/investor-centre
Disclaimer
This document is provided for general information purposes only and does not constitute or relate to a
recommendation, communication or an offer by Kiwibank Limited or any of its directors, officers,
employees or agents to invest in any securities in New Zealand or elsewhere. No part of this
document shall form the basis of or may be relied upon in connection with any investment in
securities. Persons who read any of the information in this document should not use it to acquire or
sell, or attempt to acquire or sell, for themselves or for a third party, either directly or indirectly, any
securities. Neither Kiwibank (except as required by law), nor any of its directors, officers, employees or
agents accepts any liability whatsoever for any loss arising from this document or its contents. The
information in this document is given in good faith and has been obtained from sources believed to be
reliable and accurate at the date of preparation, but its accuracy, correctness and completeness
cannot be guaranteed and has not been independently verified or audited. The information contains
data regarding past performance, such past performance is not indicative of future performance, which
may be materially different. No person may reproduce this document in whole or in part.
17