CHAPTER IV DEPOSIT MOBILIZATION AND LENDING...
84
96 CHAPTER IV DEPOSIT MOBILIZATION AND LENDING OPERATIONS OF COMMERCIAL AND CO-OPERATIVE BANKS - AN ANALYSIS Contents Page 96-179 1. Performance Analysis of Commercial Banks -South Zone 2. Performance Analysis of Co-Operative Banks -South Zone 3. Performance Analysis of Commercial Banks -Central Zone 4. Performance Analysis of Co-Operative Banks -Central Zone 5. Performance Analysis of Commercial Banks -North Zone 6. Performance Analysis of Co-Operative Banks -North Zone 7. Performance Analysis of Commercial Banks – State Level 8. Performance Analysis of Co-Operative Banks –State Level
Transcript of CHAPTER IV DEPOSIT MOBILIZATION AND LENDING...

96
CHAPTER IV
DEPOSIT MOBILIZATION AND LENDING OPERATIONS OF COMMERCIAL AND CO-OPERATIVE BANKS - AN ANALYSIS
Contents Page 96-179
1. Performance Analysis of Commercial Banks -South Zone
2. Performance Analysis of Co-Operative Banks -South Zone
3. Performance Analysis of Commercial Banks -Central Zone
4. Performance Analysis of Co-Operative Banks -Central Zone
5. Performance Analysis of Commercial Banks -North Zone
6. Performance Analysis of Co-Operative Banks -North Zone
7. Performance Analysis of Commercial Banks – State Level
8. Performance Analysis of Co-Operative Banks –State Level

97
CHAPTER IV
DEPOSIT MOBILIZATION AND LENDING OPERATIONS OF
COMMERCIAL AND CO-OPERATIVE BANKS - AN ANALYSIS For the purpose of analyzing the deposits and lending operations of
commercial and co –operative banks, data has been first classified and arranged
into three zones –south zone, central zone and north zone. The Total Deposits of
commercial banks are classified into Term Deposits, Savings Bank Deposits,
Current Deposits and NRE Deposits, whereas the Total Deposits of co-operative
bank are classified into Term deposits, Savings Bank Deposits and Current
Deposits, since co-operative banks are not permitted to accept NRE Deposits.
Likewise the Total Advances of both commercial banks and co-operative banks are
classified into Demand Loans, Cash Credits, Overdrafts and Term Loans.
The Performance efficiency with regard to the following important
parameters is analyzed - Total Advances to Total Deposits, Credit Deposit Ratio,
Total NPA to Total Advances, Total NPA to Gross Total NPA, Total Deposits to
Gross Total Deposits, NRE Deposits to Total Deposits, NRE Deposits to Gross
Total NRE Deposits Total Advances to Gross Total Advances, Profit / Loss, and
Profit / Loss to Gross Profit / Loss.
The following is an analysis of the performance efficiency of both
commercial and co-operative banks in the State. First, the table showing total
figures of commercial banks in the south zone is given and then its analysis. Then
the table showing total figures of co-operative banks in the south zone and its
analysis is given and this procedure is followed for both the central zone and north
zone. Finally the State- wise analysis is given: -
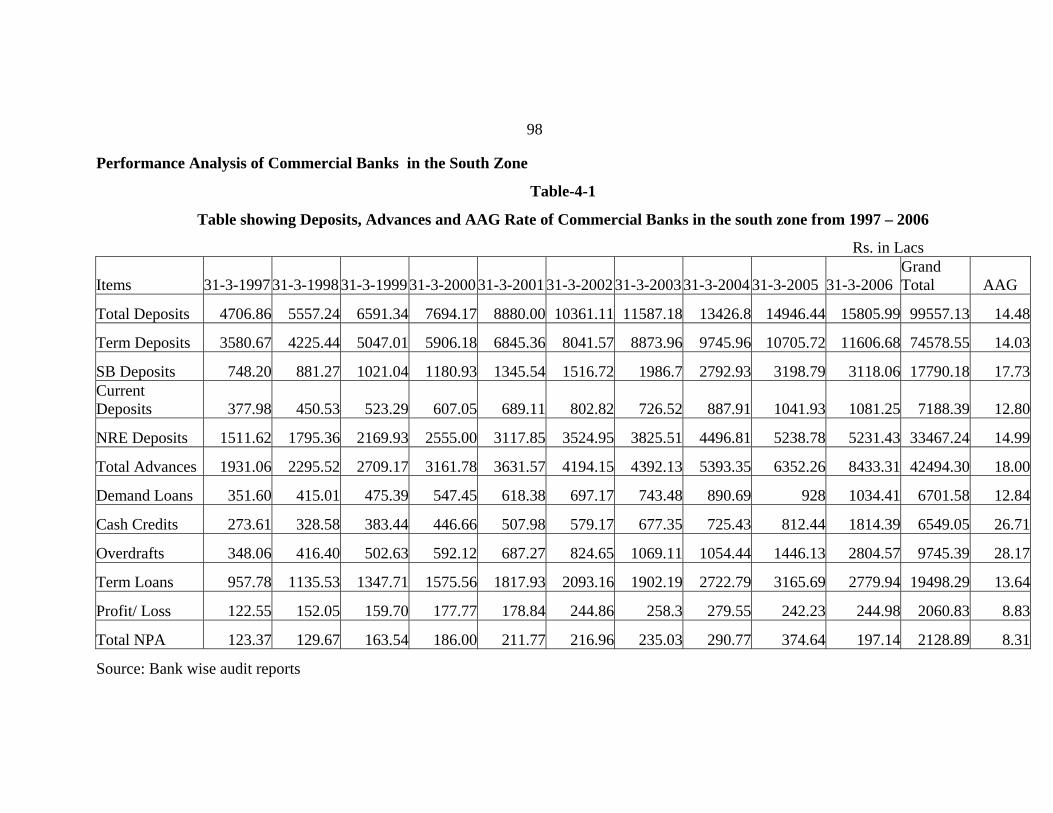
Performance Analysis of Commercial Banks in the South Zone
Table-4-1
Table showing Deposits, Advances and AAG Rate of Commercial Banks in the south zone from 1997 – 2006
Rs. in Lacs
Items 31-3-1997 31-3-1998 31-3-199931-3-200031-3-2001 31-3-2002 31-3-200331-3-2004 31-3-2005 31-3-2006Grand Total AAG
Total Deposits 4706.86 5557.24 6591.34 7694.17 8880.00 10361.11 11587.18 13426.8 14946.44 15805.99 99557.13 14.48
Term Deposits 3580.67 4225.44 5047.01 5906.18 6845.36 8041.57 8873.96 9745.96 10705.72 11606.68 74578.55 14.03
SB Deposits 748.20 881.27 1021.04 1180.93 1345.54 1516.72 1986.7 2792.93 3198.79 3118.06 17790.18 17.73Current Deposits 377.98 450.53 523.29 607.05 689.11 802.82 726.52 887.91 1041.93 1081.25 7188.39 12.80
NRE Deposits 1511.62 1795.36 2169.93 2555.00 3117.85 3524.95 3825.51 4496.81 5238.78 5231.43 33467.24 14.99
Total Advances 1931.06 2295.52 2709.17 3161.78 3631.57 4194.15 4392.13 5393.35 6352.26 8433.31 42494.30 18.00
Demand Loans 351.60 415.01 475.39 547.45 618.38 697.17 743.48 890.69 928 1034.41 6701.58 12.84
Cash Credits 273.61 328.58 383.44 446.66 507.98 579.17 677.35 725.43 812.44 1814.39 6549.05 26.71
Overdrafts 348.06 416.40 502.63 592.12 687.27 824.65 1069.11 1054.44 1446.13 2804.57 9745.39 28.17
Term Loans 957.78 1135.53 1347.71 1575.56 1817.93 2093.16 1902.19 2722.79 3165.69 2779.94 19498.29 13.64
Profit/ Loss 122.55 152.05 159.70 177.77 178.84 244.86 258.3 279.55 242.23 244.98 2060.83 8.83
Total NPA 123.37 129.67 163.54 186.00 211.77 216.96 235.03 290.77 374.64 197.14 2128.89 8.31
Source: Bank wise audit reports
98

99
Table 4-2
Table showing Total Advances to Total Deposits from 1997 – 2006
Rs. In Lacs
Years Total Deposits Total Advances CD Ratio in Percentage
31-3-1997 4706.86 1931.06 41.0331-3-1998 5557.24 2295.52 40.6631-3-1999 6591.34 2709.17 41.1031-3-2000 7694.17 3161.78 41.0931-3-2001 8880.00 3631.57 40.9031-3-2002 10361.11 4194.15 40.4831-3-2003 11587.18 4392.13 37.9131-3-2004 13426.8 5393.35 40.1731-3-2005 14946.44 6352.26 42.5031-3-2006 15805.99 8433.31 53.36AAG 14.48% 18.00% 0.00
Source: Bank wise audit reports
The above table is depicted in the following diagram -
Figure 4-1
Chart showing Total Advances to Total Deposits from 1997 – 2006
0.00
2000.00
4000.00
6000.00
8000.00
10000.00
12000.00
14000.00
16000.00
Rs. in Lacs
31-3-1997
31-3-1998
31-3-1999
31-3-2000
31-3-2001
31-3-2002
31-3-2003
31-3-2004
31-3-2005
31-3-2006
DepositsAdvances
Figure 4-1clearly shows the relationship between total advances to total deposits from 1997-2006 in the south zone. Both deposits and advances showed an upward trend during the period under study. Whereas deposits recorded an AAG of 14.8 % only, that of advances was 18%.

100
Table 4-3
Table showing CD Ratio from 1997 - 2006
Years CD Ratio in Percentage
31-3-1997 41.0331-3-1998 40.6631-3-1999 41.1031-3-2000 41.0931-3-2001 40.9031-3-2002 40.4831-3-2003 37.9131-3-2004 40.1731-3-2005 42.5031-3-2006 53.36
Source: Bank wise audit reports
The above table is depicted in the following diagram -
Figure 4-2
Chart showing CD Ratio from 1997 - 2006
0
10
20
30
40
50
60
31-3-1997
31-3-1998
31-3-1999
31-3-2000
31-3-2001
31-3-2002
31-3-2003
31-3-2004
31-3-2005
31-3-2006
CD Ratio inPercentage
Figure 4-2 clearly shows the trend of CD ratio from 1997-2006. As can be clearly seen from the chart the CD ratio remained more or less stagnant from 1997 to 2005, and thereafter a sudden increase from 42.50% to 53.36% in 2006 is visible.

101
Table 4-4
Table showing Percentage of Total NPA to Total Advances from 1997 - 2006 Rs. In Lacs
Years Total Advances Total NPA % of NPA to Total Advances
31-3-1997 1931.06 123.37 6.3931-3-1998 2295.52 129.67 5.6531-3-1999 2709.17 163.54 6.0431-3-2000 3161.78 186.00 5.8831-3-2001 3631.57 211.77 5.8331-3-2002 4194.15 216.96 5.1731-3-2003 4392.13 235.03 5.3531-3-2004 5393.35 290.77 5.3931-3-2005 6352.26 374.64 5.0931-3-2006 8433.31 197.14 2.34AAG 18.00% 8.31% 0.00
Source: Bank wise audit reports
The above table is depicted in the following diagram -
Figure 4-3
Chart showing Total NPA to Total Advances from 1997 – 2006
0.00
1000.00
2000.00
3000.00
4000.00
5000.00
6000.00
7000.00
8000.00
9000.00
Rs. In Lacs
31-3-1997
31-3-1998
31-3-1999
31-3-2000
31-3-2001
31-3-2002
31-3-2003
31-3-2004
31-3-2005
31-3-2006
Total AdvancesTotal NPA
Figure 4-3 clearly shows the relationship between total advances and total NPA from 1997-2006. Whereas advances recorded an AAG of 18%, that of NPA showed a downward growth rate in relation to advances from 6.39% in 1997 to 2.34% in 2006.

102
Table 4-5 Table showing Percentage of NPA to Gross Total NPA from 1997 – 2006
Years Total NPA Rs. In Lacs
% of NPA to Gross Total NPA
31-3-1997 123.37 5.8031-3-1998 129.67 6.0931-3-1999 163.54 7.6831-3-2000 186.00 8.7431-3-2001 211.77 9.9531-3-2002 216.96 10.1931-3-2003 235.03 11.0431-3-2004 290.77 13.6631-3-2005 374.64 17.6031-3-2006 197.14 9.26Grand Total 2128.89 100.00
Source: Bank wise audit reports
The above table is depicted in the following diagram -
Figure 4-4
Chart showing Percentage of NPA to Gross Total NPA from 1997 – 2006
31-3-199731-3-199831-3-199931-3-200031-3-200131-3-200231-3-200331-3-200431-3-200531-3-2006
19975.80
19997.69
19986.08
20069.26
200517.60
200413.66
200311.04
200210.19
20019.95
20008.74
Figure 4-4 clearly shows the percentage of NPA to gross total NPA from
1997-2006. Whereas the contribution of NPA to Gross NPA was only 5.80% in 1997, it was 17.6 0% in 2005 and 9.26% in 2006.

103
Analysis of Deposits For the sake of analyzing deposits, the numerous deposits schemes followed by
banks have been grouped into the following four categories –
Term Deposits Savings Bank Deposits
Deposits
Current Deposits NRE Deposits
104
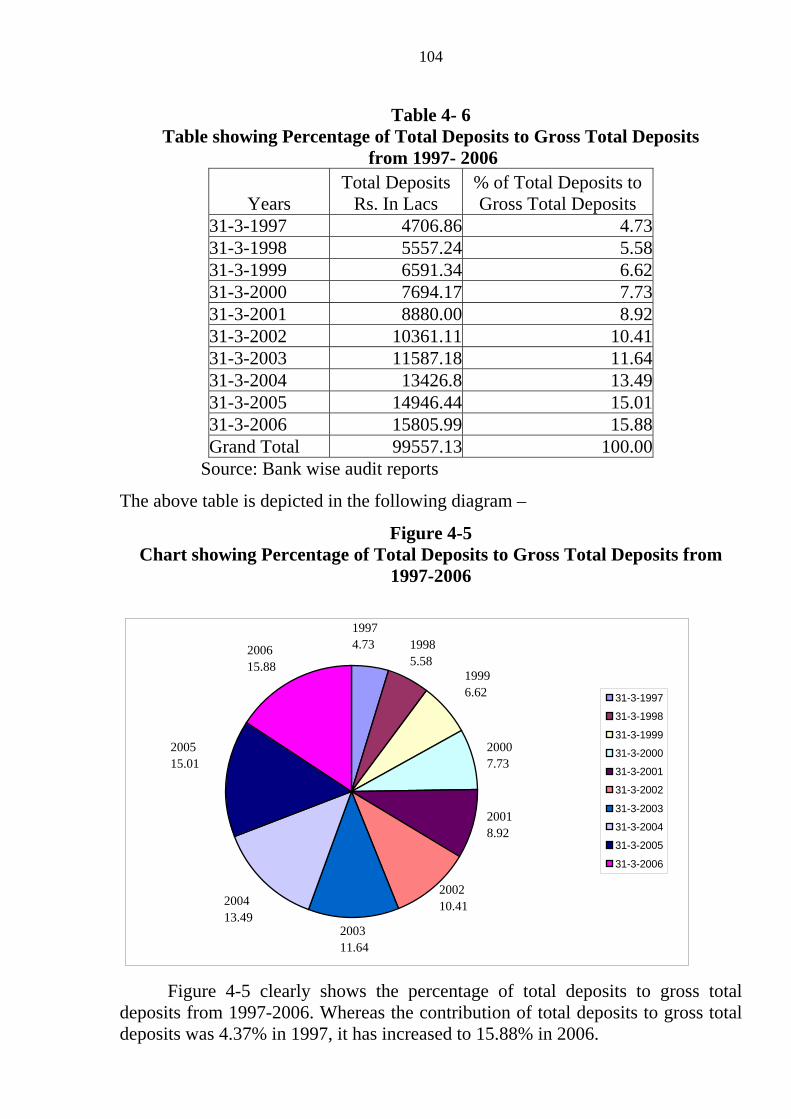
Table 4- 6
Table showing Percentage of Total Deposits to Gross Total Deposits from 1997- 2006
Years Total Deposits
Rs. In Lacs % of Total Deposits to Gross Total Deposits
31-3-1997 4706.86 4.73 31-3-1998 5557.24 5.58 31-3-1999 6591.34 6.62 31-3-2000 7694.17 7.73 31-3-2001 8880.00 8.92 31-3-2002 10361.11 10.41 31-3-2003 11587.18 11.64 31-3-2004 13426.8 13.49 31-3-2005 14946.44 15.01 31-3-2006 15805.99 15.88 Grand Total 99557.13 100.00
Source: Bank wise audit reports
The above table is depicted in the following diagram –
Figure 4-5 Chart showing Percentage of Total Deposits to Gross Total Deposits from
1997-2006
31-3-1997
31-3-1998
31-3-1999
31-3-2000
31-3-2001
31-3-2002
31-3-2003
31-3-2004
31-3-2005
31-3-2006
19974.73
200515.01
19996.62
19985.58
200615.88
200413.49
200311.64
200210.41
20018.92
20007.73
Figure 4-5 clearly shows the percentage of total deposits to gross total deposits from 1997-2006. Whereas the contribution of total deposits to gross total deposits was 4.37% in 1997, it has increased to 15.88% in 2006.

105
Table 4- 7
Table showing Percentage of NRE Deposits to Total Deposits from 1997 – 2006
Rs. In Lacs
Years Total Deposits NRE Deposits
%of NRE Deposits to Total
Deposits 31-3-1997 4706.86 1511.62 32.1231-3-1998 5557.24 1795.36 32.3131-3-1999 6591.34 2169.93 32.9231-3-2000 7694.17 2555.00 33.2131-3-2001 8880.00 3117.85 35.1131-3-2002 10361.11 3524.95 34.0231-3-2003 11587.18 3825.51 33.0231-3-2004 13426.8 4496.81 33.4931-3-2005 14946.44 5238.78 35.0531-3-2006 15805.99 5231.43 33.10AAG 14.48% 14.99% 0.00Source: Bank wise audit reports
The above table is depicted in the following diagram –
Figure 4-6
Chart showing NRE Deposits to Total Deposits from 1997 - 2006
0.00
2000.00
4000.00
6000.00
8000.00
10000.00
12000.00
14000.00
16000.00
Rs. In Lacs
31-3-1997
31-3-1998
31-3-1999
31-3-2000
31-3-2001
31-3-2002
31-3-2003
31-3-2004
31-3-2005
31-3-2006
Total DepositsNRE Deposits
Figure 4-6 clearly shows the relationship between NRE deposits to total deposits from 1997-2006. Both NRE deposits and total deposits showed an upward trend. Whereas NRE deposits recorded an AAG rate of 14.99%, that of total deposits was 14.48%.

106
Table 4- 8 Table showing Percentage of NRE Deposits to Gross Total NRE Deposits
from 1997-2006
Years NRE Deposits
Rs. In Lacs
% of NRE Deposits to Gross Total NRE
Deposits 31-3-1997 1511.62 4.5231-3-1998 1795.36 5.3631-3-1999 2169.93 6.4831-3-2000 2555.00 7.6331-3-2001 3117.85 9.3231-3-2002 3524.95 10.5331-3-2003 3825.51 11.4331-3-2004 4496.81 13.4431-3-2005 5238.78 15.6531-3-2006 5231.43 15.63Grand Total 33467.24 100.00
Source: Bank wise audit reports
The above table is depicted in the following diagram – Figure 4-7
Chart showing Percentage of NRE Deposits to Gross Total NRE Deposits from 1997-2006
31-3-199731-3-199831-3-199931-3-200031-3-200131-3-200231-3-200331-3-200431-3-200531-3-2006
20007.63
19996.48
19985.36
19974.52
20019.32
200210.53
200311.43
200413.44
200515.65
200615.63
Figure 4-7 clearly shows the percentage of NRE deposits to gross total NRE deposits from 1997-2006. Whereas the contribution of NRE deposits was 4.52% in 1997, it has increased to 15.63% in 2006.

107
Analysis of advances
For the sake of analyzing advances, the numerous advances schemes
followed by banks have been grouped into the following four categories –
Advances
Demand Loans Overdrafts
Term Loans Cash Credits

108
Table 4- 9 Table showing Percentage of Total Advances to Gross Total Advances from
1997- 2006
Years Total Advances
Rs. In Lacs % of Total Advances to Gross Total Advances
31-3-1997 1931.06 4.5431-3-1998 2295.52 5.4031-3-1999 2709.17 6.3831-3-2000 3161.78 7.4431-3-2001 3631.57 8.5531-3-2002 4194.15 9.8731-3-2003 4392.13 10.3431-3-2004 5393.35 12.6931-3-2005 6352.26 14.9531-3-2006 8433.31 19.85Grand Total 42494.30 100.00
Source: Bank wise audit reports
The above table is depicted in the following diagram – Figure 4-8
Chart showing Percentage of Total Advances to Gross Total Advances from 1997- 2006
31-3-1997
31-3-1998
31-3-1999
31-3-2000
31-3-2001
31-3-2002
31-3-2003
31-3-2004
31-3-2005
31-3-2006
19974.54 1998
5.40 19996.38
20007.44
20029.87
200310 3
2004 12.6
2005 14.9
2006 19.8
20018.55
Figure 4-8 clearly shows the percentage of total advances to gross total
advances from 1997-2006. Whereas the contribution of total advances to Gross total advances was 4.54% in 1997, it has increased to 19.85% in 2006.

109
Table 4- 10
Table showing Profit/Loss from 1997 – 2006
Years Profit/Loss Rs. In Lacs
31-3-1997 122.5531-3-1998 152.0531-3-1999 159.7031-3-2000 177.7731-3-2001 178.8431-3-2002 244.8631-3-2003 258.331-3-2004 242.2331-3-2005 279.5531-3-2006 244.98AAG 8.83%
Source: Bank wise audit reports
The above table is depicted in the following diagram –
Figure 4-9
Chart showing Profit/Loss from 1997 – 2006
0.00
50.00
100.00
150.00
200.00
250.00
300.00
31-3-1997
31-3-1998
31-3-1999
31-3-2000
31-3-2001
31-3-2002
31-3-2003
31-3-2004
31-3-2005
31-3-2006
Rs.
in L
acs
Profit/Loss
Figure 4-9 clearly shows the trend of profits/loss from 1997-2006. During the period
under study profit/loss has recorded an AAG rate of 8.83%. It has increased from
Rs.122.55 lacs in 1997 to Rs.244.98 lacs in 2006.

110
Table 4 - 11
Table showing Percentage of Profit/Loss to Gross Total Profit/Loss from 1997 - 2006
Years Profit/Loss Rs. In Lacs
% of Profit/Loss to Gross Profit/Loss
31-3-1997 122.55 5.95 31-3-1998 152.05 7.38 31-3-1999 159.70 7.75 31-3-2000 177.77 8.63 31-3-2001 178.84 8.68 31-3-2002 244.86 11.88 31-3-2003 258.3 12.53 31-3-2004 242.23 11.75 31-3-2005 279.55 13.56 31-3-2006 244.98 11.89 Grand Total 2060.83 100.00
Source: Bank wise audit reports
The above table is depicted in the following diagram –
Figure 4-10 Chart showing Percentage of Profit/Loss to Gross Total Profit/Loss
from 1997 – 2006
31-3-1997
31-3-1998
31-3-1999
31-3-2000
31-3-2001
31-3-2002
31-3-2003
31-3-2004
31-3-2005
31-3-2006
19975.95 1998
7.38
19997.75
200513.56
200411.75
200312.53
200211.88
20018.68
20008.63
200611.89
Figure 4-10 clearly shows the percentage of profit/loss to gross total profit/loss
from 1997-2006. Where as the contribution of profit/loss was 5.95% in 1997, it has
increased to 11.89% in 2006.

111
Performance Analysis of Co-operative Banks in the South Zone
Table 4-12
Table showing Deposits, Advances and AAG rate of District Co-operative Banks in the south zone from 1997 – 2006
Rs. In Lacs
Items 31-3-1997 31-3-199831-3-199931-3-200031-3-200131-3-2002 31-3-200331-3-200431-3-200531-3-2006Grand TotalAAG
Total Deposits 4880.86 5247.53 5379.91 5564.59 5691.18 6570.38 7083.24 7341.64 7536.34 9187.13 64482.80 7.47
Term Deposits 3548.06 3789.74 3876.33 4035.89 4128.91 4763.63 5279.14 5368.70 5432.29 6660.73 46883.42 7.47
SB Deposits 1064.71 1163.29 1199.65 1214.92 1241.22 1434.34 1423.83 1562.48 1764.90 2164.80 14234.15 8.44
Current Deposits 268.09 294.50 303.92 313.78 321.04 372.41 380.27 410.46 339.15 361.60 3365.23 3.77
Total Advances 3848.51 4182.47 4340.99 4492.67 4588.87 5327.21 6032.61 6656.33 6846.95 7635.51 53952.11 8.02
Demand Loans 713.50 778.04 798.77 828.35 851.35 401.76 436.16 444.97 443.43 416.00 6112.32 -3.40
Cash Credits 347.47 374.10 388.41 401.13 401.05 1053.55 1154.06 1201.80 1202.46 1194.40 7718.4421.17
Overdrafts 576.75 647.45 661.85 659.40 673.00 778.85 884.14 962.30 849.43 824.75 7517.92 4.40
Term Loans 2210.79 2382.89 2491.97 2603.79 2663.46 3093.05 3558.25 4047.26 4351.63 5200.36 32603.4510.12
Profit/ Loss 46.83 50.13 53.30 58.88 53.82 54.68 59.11 123.62 148.50 44.41 693.28 9.35
Total NPA 338.45 344.56 350.76 342.99 339.05 372.76 392.07 419.73 428.38 387.07 3715.82 1.65
Source : Bank wise audit reports

112
Table 4-13 Table showing Total Advances to Total Deposits from 1997 – 2006
Rs. In Lacs
Years Total Deposits Total AdvancesCD Ratio in Percentage
31-3-1997 4880.86 3848.51 78.85 31-3-1998 5247.53 4182.47 79.70 31-3-1999 5379.91 4340.99 80.69 31-3-2000 5564.59 4492.67 80.74 31-3-2001 5691.18 4588.87 80.63 31-3-2002 6570.38 5327.21 81.08 31-3-2003 7083.24 6032.61 85.17 31-3-2004 7341.64 6656.33 90.67 31-3-2005 7536.34 6846.95 90.85 31-3-2006 7731.04 7037.57 91.03 AAG 7.47% 8.02% 0.00 Source: Bank wise audit reports
The above table is depicted in the following diagram –
Figure 4-11
Chart showing Total Advances to Total Deposits from 1997 - 2006
0.00
1000.00
2000.00
3000.00
4000.00
5000.00
6000.00
7000.00
8000.00
31-3-1997
31-3-1998
31-3-1999
31-3-2000
31-3-2001
31-3-2002
31-3-2003
31-3-2004
31-3-2005
31-3-2006
Total Deposits
Total Advances
Figure 4-11 clearly shows the relationship between total deposits and total
advances from 1997-2006. Both deposits and advances showed an upward trend during the period under study. Where as deposits recorded an AAG of 7.47% that of advances was 8.02%.

113
Table 4-14
Table showing CD Ratio from 1997 – 2006
Years CD Ratio in Percentage
31-3-1997 78.8431-3-1998 79.7031-3-1999 80.6831-3-2000 80.7331-3-2001 80.6331-3-2002 81.0731-3-2003 85.1631-3-2004 90.6631-3-2005 90.8531-3-2006 91.03Source: Bank wise audit reports
The above table is depicted in the following diagram –
Figure 4-12
Chart showing CD Ratio from 1997 – 2006
72
74
76
78
80
82
84
86
88
90
92
31-3-1997
31-3-1998
31-3-1999
31-3-2000
31-3-2001
31-3-2002
31-3-2003
31-3-2004
31-3-2005
31-3-2006
CD Ratio inPercentage
Figure 4-12 clearly shows the trend of CD ratio from 1997-2006. As can be clearly seen from the chart the CD ratio remained more or less steady from 1997 to 2002, there after a sudden increase from 81.07% to 91.03% in 2006 is visible.

114
Table 4-15
Table showing Percentage of Total NPA to Total Advances from 1997 - 2006 Rs. In Lacs
Year Total Advances Total NPA % of NPA to Total Advances
31-3-1997 3848.51 338.45 8.7931-3-1998 4182.47 344.56 8.2431-3-1999 4340.99 350.76 8.0831-3-2000 4492.67 342.99 7.6331-3-2001 4588.87 339.05 7.3931-3-2002 5327.21 372.76 7.0031-3-2003 6032.61 392.07 6.5031-3-2004 6656.33 419.73 6.3131-3-2005 6846.95 428.38 6.2631-3-2006 7635.51 387.07 5.07AAG 8.02% 1.65% 0.00Source: Bank wise audit reports
The above table is depicted in the following diagram -
Figure 4-13
Chart showing Total NPA to Total Advances from 1997 - 2006
0.00
1000.00
2000.00
3000.00
4000.00
5000.00
6000.00
7000.00
8000.00
Rs. in Lacs
31-3-1997
31-3-1998
31-3-1999
31-3-2000
31-3-2001
31-3-2002
31-3-2003
31-3-2004
31-3-2005
31-3-2006
Total AdvancesTotal NPA
Figure 4-13 clearly shows the relationship between total advances and
total NPA from 1997-2006. Whereas advances recorded an AAG of 18 %, that of NPA showed a downward growth rate in relation to advances from 8.79% in 1997 to 5.07% in 2006.

115
Table 4-16 Table showing Percentage of Total NPA to Gross Total NPA
from 1997 – 2006
Year Total NPA Rs. In Lacs
% of Total NPA to Gross Total NPA
31-3-1997 338.45 9.1131-3-1998 344.56 9.2731-3-1999 350.76 9.4431-3-2000 342.99 9.2331-3-2001 339.05 9.1231-3-2002 372.76 10.0331-3-2003 392.07 10.5531-3-2004 419.73 11.3031-3-2005 428.38 11.5331-3-2006 387.07 10.42Grand Total 3715.82 100.00
Source: Bank wise audit reports
The above table is depicted in the following diagram –
Figure 4-14 Chart showing Percentage of Total NPA to Gross Total NPA
from 1997 - 2006
31-3-199731-3-199831-3-199931-3-200031-3-200131-3-200231-3-200331-3-200431-3-200531-3-2006
19979.11
20009.23
19999.44
19989.27
200610.42
200511.53
200411.30
200310.55
200210.03
20019.12
Figure 4-14 clearly shows the percentage of NPA to gross total NPA from
1997-2006. Whereas the contribution of NPA to Gross NPA was only 9.11% in 1997, it was 17.6 0% in 2005 and 10.42% in 2006.

116
Table 4-17 Table showing Percentage of Total Deposits to Gross Total Deposits
from 1997 - 2006
Year Total Deposits
Rs. In Lacs
% of Total Deposits to Gross
Total Deposits 31-3-1997 4880.86 7.57 31-3-1998 5247.53 8.14 31-3-1999 5379.91 8.34 31-3-2000 5564.59 8.63 31-3-2001 5691.18 8.83 31-3-2002 6570.38 10.19 31-3-2003 7083.24 10.98 31-3-2004 7341.64 11.39 31-3-2005 7536.34 11.69 31-3-2006 9187.13 14.25 Grand Total 64482.80 100.00
Source: Bank wise audit reports The above table is depicted in the following diagram -
Figure 4-15 Chart showing Percentage of Total Deposits to Gross Total Deposits
from 1997 - 2006
31-3-199731-3-199831-3-199931-3-200031-3-200131-3-200231-3-200331-3-200431-3-200531-3-2006
19977.57
20008.63
19998.34
19988.14
200614.25
200511.69
200411.39
200310.98 2002
10.19
20018.83
Figure 4-15 clearly shows the percentage of total deposits to gross total deposits from 1997-2006. Whereas the contribution of total deposits to Gross total deposits was 7.57% in 1997, it has increased to 14.25% in 2006.

117
Analysis of Advances Table 4-18
Table showing Percentage of Total Advances to Gross Total Advances from 1997 - 2006
Year Total Advances
Rs. In Lacs
% of Total Advances to Gross Total
Advances 31-3-1997 3848.51 7.1331-3-1998 4182.47 7.7531-3-1999 4340.99 8.0531-3-2000 4492.67 8.3331-3-2001 4588.87 8.5131-3-2002 5327.21 9.8731-3-2003 6032.61 11.1831-3-2004 6656.33 12.3431-3-2005 6846.95 12.6931-3-2006 7635.51 14.15Grand Total 53952.11 100.00
Source: Bank wise audit reports The above table is depicted in the following diagram -
Figure 4-16 Chart showing Percentage of Total Advances to Gross Total Advances
from 1997 – 2006
31-3-199731-3-199831-3-199931-3-200031-3-200131-3-200231-3-200331-3-200431-3-200531-3-2006
19977.13
20008.33
19998.05
19987.75
200614.15
200512.69
200412.34
200311.18
20029.87
20018.51
Figure 4-16 clearly shows the percentage of total advances to gross total advances from 1997-2006. Whereas the contribution of total advances to Gross total advances was 7.13% in 1997, it has increased to 12.69% in 2006.

118
Table 4-19
Table showing Profit/Loss from 1997 - 2006
Year Profit/Loss Rs. In Lacs
31-3-1997 46.8331-3-1998 50.1331-3-1999 53.3031-3-2000 58.8831-3-2001 53.8231-3-2002 54.6831-3-2003 59.1131-3-2004 123.6231-3-2005 148.5031-3-2006 44.41AAG 9.35%
Source: Bank wise audit reports The above table is depicted in the following diagram -
Figure 4-17 Chart showing Profit/Loss from 1997 – 2006
Profit/Loss
0.00
20.00
40.00
60.00
80.00
100.00
120.00
140.00
160.00
31-3-1997
31-3-1998
31-3-1999
31-3-2000
31-3-2001
31-3-2002
31-3-2003
31-3-2004
31-3-2005
31-3-2006
Rs.
in L
acs
Profit/Loss
Figure 4-17 clearly shows the trend of profits/loss from 1997-2006. During the period under study profit/loss has recorded an AAG rate of 9.35%. It was Rs.46.83 lacs in 1997 and Rs.44.41 lacs in 2006.

119
Table 4-20 Table showing Percentage of Profit/Loss to Gross Total Profit/Loss
from 1997 - 2006
Year Profit/Loss Rs. In Lacs
% of Profit/Loss to Gross Total
Profit/Loss 31-3-1997 46.83 6.7531-3-1998 50.13 7.2331-3-1999 53.30 7.6931-3-2000 58.88 8.4931-3-2001 53.82 7.7631-3-2002 54.68 7.8931-3-2003 59.11 8.5331-3-2004 123.62 17.8331-3-2005 148.50 21.4231-3-2006 44.41 6.41Grand Total 693.28 100.00
Source: Bank wise audit reports The above table is depicted in the following diagram -
Figure 4-18 Chart showing Percentage of Profit/Loss to Gross Total Profit/Loss
from 1997 - 2006
31-3-199731-3-199831-3-199931-3-200031-3-200131-3-200231-3-200331-3-200431-3-200531-3-2006
19976.75
19997.69
19987.23
20008.49
200521.42
200417.83
20038.53
20027.89
20017.76
20066.41
Figure 4-18 clearly shows the percentage of profit/loss to gross total profit/loss from 1997-2006. Whereas the contribution of profit/loss was 6.75% in 1997, it has decreased to 6.41% in 2006.

Performance Analysis of Commercial Banks in the Central Zone
Table 4-21
Table showing Deposits, Advances and AAG rate of Commercial Banks in the central zone from 1997 – 2006
Rs in Lacks
Items 31-3-1997 31-3-1998 31-3-1999 31-3-2000 31-3-2001 31-3-2002 31-3-2003 31-3-2004 31-3-2005 31-3-2006 Grand Total AAG
Total Deposits 4552.96 5113.84 5909.99 6524.91 7193.29 7823.48 8584.57 9038.08 9777.96 10252.37 74771.45 9.48
Term Deposits 3364.98 3787.03 4398.43 4856.99 5355.78 5829.86 6419.71 6704.35 7027.71 7163.66 54908.50 8.84
SB Deposits 808.10 906.15 1042.85 1150.44 1266.29 1364.51 1594.28 1707.83 1941.93 2164.97 13947.35 11.61Current Deposits 379.88 420.67 468.72 517.47 571.23 629.11 570.58 625.90 808.32 923.74 5915.62 10.77
NRE Deposits 1431.18 1589.18 1803.15 1979.44 2172.88 2376.80 2493.61 2625.63 2803.73 3131.27 22406.88 9.12
Total Advances 2111.30 2375.09 2735.66 3029.73 3346.53 3662.44 3509.47 4663.30 5737.18 6442.15 37612.84 13.59
Demand Loans 385.11 437.16 515.20 570.42 629.47 685.62 572.72 659.62 785.39 948.03 6188.74 11.09
Cash Credits 375.58 423.27 487.71 539.93 594.18 648.46 620.99 669.03 857.94 940.27 6157.36 11.02
Overdrafts 396.26 448.35 521.57 580.71 646.68 711.49 729.09 816.23 816.25 917.76 6584.39 9.90
Term Loans 954.36 1066.31 1211.16 1338.66 1476.20 1616.87 1586.67 2518.42 3277.60 3636.09 18682.34 17.06
Profit/ Loss 144.43 143.53 145.88 178.85 179.06 196.10 244.99 251.58 262.62 247.79 1994.83 6.62
Total NPA 94.12 111.21 122.30 129.58 134.15 132.40 117.08 131.64 120.10 133.97 1226.55 4.44
Source: Bank-wise audit reports
120

121
Table 4-22
Table showing Total Advances to Total Deposits from 1997 - 2006
Rs. In Lacs Years Total Deposits Total Advances
CD Ratio in Percentage
31-3-1997 4552.96 2111.30 46.3731-3-1998 5113.84 2375.09 46.4431-3-1999 5909.99 2735.66 46.2931-3-2000 6524.91 3029.73 46.4331-3-2001 7193.29 3346.53 46.5231-3-2002 7823.48 3662.44 46.8131-3-2003 8584.57 3509.47 40.8831-3-2004 9038.08 4663.30 51.6031-3-2005 9777.96 5737.18 58.6731-3-2006 10252.37 6442.15 62.84AAG 9.48% 13.59% 0.00
Source: Bank-wise audit reports The above table is depicted in the following diagram -
Figure 4-19 Chart showing Total Advances to Total Deposits
from 1997 – 2006
0.00
2000.00
4000.00
6000.00
8000.00
10000.00
12000.00
Rs. in Lacs
31-3-1997
31-3-1998
31-3-1999
31-3-2000
31-3-2001
31-3-2002
31-3-2003
31-3-2004
31-3-2005
31-3-2006
Total DepositsTotal Advances
Figure 4-19 clearly shows the relationship between total deposits and total advances from 1997-2006. Both deposits and advances showed an upward trend during the period under study. Whereas deposits recorded an AAG of 9.48%, that of advances was 13.59%.

122
Table 4-23 Table showing CD Ratio from 1997-2006
Years CD Ratio in Percentage
31-3-1997 46.3731-3-1998 46.4431-3-1999 46.2931-3-2000 46.4331-3-2001 46.5231-3-2002 46.8131-3-2003 40.8831-3-2004 51.6031-3-2005 58.6731-3-2006 62.84
Source: Bank-wise audit reports The above table is depicted in the following diagram –
Figure 4-20 Chart showing CD Ratio from 1997-2006
0
10
20
30
40
50
60
70
31-3-1997
31-3-1998
31-3-1999
31-3-2000
31-3-2001
31-3-2002
31-3-2003
31-3-2004
31-3-2005
31-3-2006
CD Ratio inPercentage
Figure 4-20 clearly shows the trend of CD ratio from 1997-2006. As can be clearly seen from the chart the CD ratio remained more or less steady from 1997 to 2002, in 2003 it showed a downward growth rate and there after a sudden increase from 40.88% in2003 to 62.84% in 2006.

123
Table 4-24
Table showing Total NPA to Total Advances from 1997 - 2006
Rs. In Lacs
Years Total Advances Total NPA % of Total Advances
31-3-1997 2111.30 94.12 4.4631-3-1998 2375.09 111.21 4.6831-3-1999 2735.66 122.30 4.4731-3-2000 3029.73 129.58 4.2831-3-2001 3346.53 134.15 4.0131-3-2002 3662.44 132.40 3.6231-3-2003 3509.47 117.08 3.3431-3-2004 4663.30 131.64 2.8231-3-2005 5737.18 120.10 2.0931-3-2006 6442.15 133.97 2.08AAG 13.59% 4.44% 0.00
Source: Bank-wise audit reports The above table is depicted in the following diagram –
Figure 4-21 Chart showing Total NPA Total Advances
from 1997 – 2006
0.00
1000.00
2000.00
3000.00
4000.00
5000.00
6000.00
7000.00
Rs. in Lacs
31-3-1997
31-3-1998
31-3-1999
31-3-2000
31-3-2001
31-3-2002
31-3-2003
31-3-2004
31-3-2005
31-3-2006
Total AdvancesTotal NPA
Figure 4-21 clearly shows the relationship between total advances and total NPA from 1997-2006. Whereas advances recorded an AAG of 13.59%, that of NPA showed a downward growth rate in relation to advances from 4.46% in 1997 to 2.08% in 2006.

124
Table 4-25 Table showing Percentage of Total NPA to Gross Total NPA
from 1997 – 2006
Years Total NPA Rs. In Lacs
% of Total NPA to Gross Total NPA
31-3-1997 94.12 7.67 31-3-1998 111.21 9.07 31-3-1999 122.30 9.97 31-3-2000 129.58 10.56 31-3-2001 134.15 10.94 31-3-2002 132.40 10.79 31-3-2003 117.08 9.55 31-3-2004 131.64 10.73 31-3-2005 120.10 9.79 31-3-2006 133.97 10.92 Grand Total 1226.55 100.00
Source: Bank-wise audit reports The above table is depicted in the following diagram –
Figure 4-22 Chart showing Percentage of Total NPA to Gross Total NPA
from 1997 - 2006
31-3-1997
31-3-1998
31-3-1999
31-3-2000
31-3-2001
31-3-2002
31-3-2003
31-3-2004
31-3-2005
31-3-2006
19977.67
20039.55
19999.97
19989.07
200210.79
200110.94
200010.56
200610.92
20059.79
200410.73
Figure 4-22 clearly shows the percentage of NPA to gross total NPA from 1997-2006. Whereas the contribution of NPA to Gross NPA was only 7.67% in 1997, it was 10.92% in 2006.
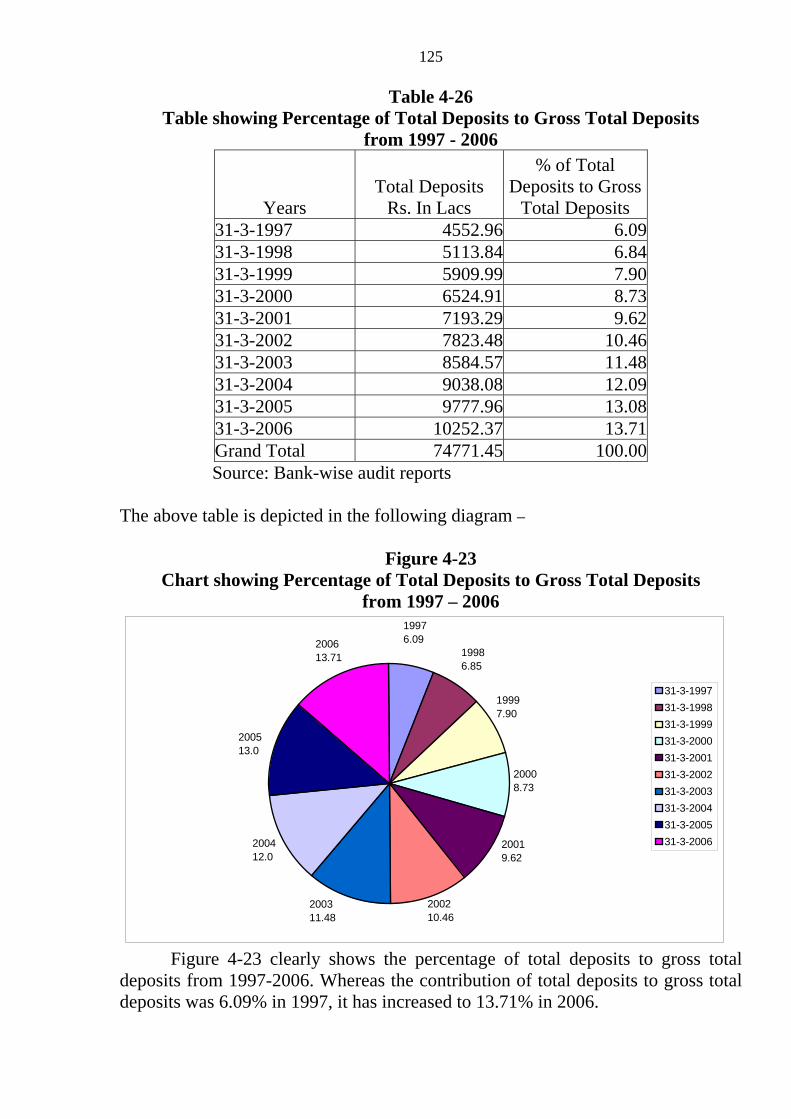
125
Table 4-26 Table showing Percentage of Total Deposits to Gross Total Deposits
from 1997 - 2006
Years Total Deposits
Rs. In Lacs
% of Total Deposits to Gross
Total Deposits 31-3-1997 4552.96 6.09 31-3-1998 5113.84 6.84 31-3-1999 5909.99 7.90 31-3-2000 6524.91 8.73 31-3-2001 7193.29 9.62 31-3-2002 7823.48 10.46 31-3-2003 8584.57 11.48 31-3-2004 9038.08 12.09 31-3-2005 9777.96 13.08 31-3-2006 10252.37 13.71 Grand Total 74771.45 100.00
Source: Bank-wise audit reports The above table is depicted in the following diagram –
Figure 4-23 Chart showing Percentage of Total Deposits to Gross Total Deposits
from 1997 – 2006
31-3-199731-3-199831-3-199931-3-200031-3-200131-3-200231-3-200331-3-200431-3-200531-3-2006
19976.09
20008.73
19997.90
19986.85
200613.71
200513.0
200412.0
200311.48
200210.46
20019.62
Figure 4-23 clearly shows the percentage of total deposits to gross total deposits from 1997-2006. Whereas the contribution of total deposits to gross total deposits was 6.09% in 1997, it has increased to 13.71% in 2006.

126
Table 4-27 Table showing Percentage of NRE Deposits to Total Deposits
from 1997 – 2006 Rs. In Lacs
Years Total Deposits NRE Deposits % of NRE Deposits
to Total Deposits 31-3-1997 4552.96 1431.18 31.4331-3-1998 5113.84 1589.18 31.0831-3-1999 5909.99 1803.15 30.5131-3-2000 6524.91 1979.44 30.3431-3-2001 7193.29 2172.88 30.2131-3-2002 7823.48 2376.80 30.3831-3-2003 8584.57 2493.61 29.0531-3-2004 9038.08 2625.63 29.0531-3-2005 9777.96 2803.73 28.6731-3-2006 10252.37 3131.27 30.54AAG 9.48% 9.12% 0.00
Source: Bank-wise audit reports The above table is depicted in the following diagram –
Figure 4-24 Chart showing Percentage of NRE Deposits to Total Deposits
from 1997 – 2006
0.00
2000.00
4000.00
6000.00
8000.00
10000.00
12000.00
Rs. in Lacs
31-3-1997
31-3-1998
31-3-1999
31-3-2000
31-3-2001
31-3-2002
31-3-2003
31-3-2004
31-3-2005
31-3-2006
Total DepositsNRE Deposits
Figure 4-24 clearly shows the relationship between NRE deposits to total deposits from 1997-2006. Both NRE deposits and total deposits showed an upward trend. Whereas NRE deposits recorded an AAG rate of 9.12%, that of total deposits was 9.48%.

127
Table 4-28 Table showing Percentage of NRE Deposits to Gross Total NRE Deposits from
1997 - 2006
Years NRE Deposits
Rs. In Lacs
% of NRE Deposits to Gross Total NRE
Deposit 31-3-1997 1431.18 6.3931-3-1998 1589.18 7.0931-3-1999 1803.15 8.0531-3-2000 1979.44 8.8331-3-2001 2172.88 9.7031-3-2002 2376.80 10.6131-3-2003 2493.61 11.1331-3-2004 2625.63 11.7231-3-2005 2803.73 12.5131-3-2006 3131.27 13.97Grand Total 22406.88 100.00
Source: Bank-wise audit reports The above table is depicted in the following diagram –
Figure 4-25
Chart showing Percentage of NRE Deposits to Gross Total NRE Deposits from 1997 - 2006
31-3-199731-3-199831-3-199931-3-200031-3-200131-3-200231-3-200331-3-200431-3-200531-3-2006
19976.39
20008.83
19998.05
19987.09
200613.97
200512.51
200411.72
200311.13
200210.61
20019.70
Figure 4-25 clearly shows the percentage of NRE deposits to gross total NRE deposits from 1997-2006. Whereas the contribution of NRE deposits was 6.39% in 1997, it has increased to 13.97% in 2006.

128
Analysis of Advances Table 4-29
Table showing Percentage of Total Advances to Gross Total Advances from 1997 - 2006
Years Total Advances
Rs. In Lacs % of Total Advances to Gross Total Advances
31-3-1997 2111.30 5.6131-3-1998 2375.09 6.3131-3-1999 2735.66 7.2731-3-2000 3029.73 8.0631-3-2001 3346.53 8.9031-3-2002 3662.44 9.7431-3-2003 3509.47 9.3331-3-2004 4663.30 12.4031-3-2005 5737.18 15.2531-3-2006 6442.15 17.13Grand Total 37612.84 100.00
Source: Bank-wise audit reports The above table is depicted in the following diagram –
Figure 4-26 Chart showing Percentage of Total Advances to Gross Total Advances
from 1997 – 2006
31-3-1997
31-3-1998
31-3-1999
31-3-2000
31-3-2001
31-3-2002
31-3-2003
31-3-2004
31-3-2005
31-3-2006
19975.61
20008.08
19997.27
19986.31
200617.13
200515.25
200412.40
20039.33
20029.74
20018.90
Figure 4-26 clearly shows the percentage of total advances to gross total advances from 1997-2006. Whereas the contribution of total advances to Gross total advances was 5.61% in 1997, it has increased to 17.13% in 2006.

129
Table 4-30
Table showing Profit/Loss from 1997 – 2006
Years Profit/Loss Rs. In Lacs
31-3-1997 144.4331-3-1998 143.5331-3-1999 145.8831-3-2000 178.8531-3-2001 179.0631-3-2002 196.1031-3-2003 244.9931-3-2004 251.5831-3-2005 262.6231-3-2006 247.79AAG 6.62%
Source: Bank-wise audit reports The above table is depicted in the following diagram –
Figure 4-27
Chart showing Profit/Loss from 1997 – 2006
Profit/Loss
0.00
50.00
100.00
150.00
200.00
250.00
300.00
31-3-1997
31-3-1998
31-3-1999
31-3-2000
31-3-2001
31-3-2002
31-3-2003
31-3-2004
31-3-2005
31-3-2006
Rs.
in L
acs
Profit/Loss
Figure 4-27 clearly shows the trend of profits/loss from 1997-2006. During the period under study profit/loss has recorded an AAG rate of 6.62%. It has increased from Rs.144.43 lacs in 1997 to Rs.247.79 lacs in 2006.

130
Table 4-31 Table showing Percentage of Profit/Loss to Gross Total Profit/Loss
from 1997 – 2006
Years Profit/Loss Rs. In Lacs
% of Profit/Loss to Gross Total Profit/Loss
31-3-1997 144.43 7.24 31-3-1998 143.53 7.20 31-3-1999 145.88 7.31 31-3-2000 178.85 8.97 31-3-2001 179.06 8.98 31-3-2002 196.10 9.83 31-3-2003 244.99 12.28 31-3-2004 251.58 12.61 31-3-2005 262.62 13.17 31-3-2006 247.79 12.42 Grand Total 1994.83 100.00
Source: Bank-wise audit reports The above table is depicted in the following diagram –
Figure 4-28 Chart showing Profit/Loss to Gross Total Profit/Loss from 1997 – 2006
31-3-199731-3-199831-3-199931-3-200031-3-200131-3-200231-3-200331-3-200431-3-200531-3-2006
19977.24
20008.97
19997.31
19987.20
200513.17
200412.61
200312.28
20029.83
20018.98
200612.42
Figure 4-23 clearly shows the percentage of profit/loss to gross total profit/loss from 1997-2006. Whereas the contribution of profit/loss was 7.24% in 1997, it has increased to 12.42% in 2006.

131
Performance Analysis of Co-operative Banks in the Central Zone
Table 4-32
Table showing Deposits, Advances and AAG rate of District Co-operative Banks in the Central Zone from 1997 – 2006
RS. In lacks
Items 31-3-1997 31-3-1998 31-3-1999 31-3-2000 31-3-2001 31-3-2002 31-3-2003 31-3-2004 31-3-2005 31-3-2006 Grand Total AAG
Total Deposits 4936.78 5543.00 6231.54 6782.03 7339.70 8082.64 8679.73 11357.60 12679.23 14569.16 86201.41 12.96
Term Deposits 3875.38 4350.56 4895.19 5328.83 5774.19 6362.04 6749.36 7729.39 8331.29 10558.14 63954.36 11.92
SB Deposits 617.60 695.46 777.95 847.84 909.68 994.38 1109.23 1523.75 1956.09 2053.54 11485.52 14.70Current Deposits 443.79 496.96 558.40 605.37 655.82 726.22 821.14 2104.46 2391.85 1957.48 10761.50 24.07
Total Advances 1802.06 2024.42 2281.63 2488.40 2701.44 2972.18 3131.77 5263.98 6235.52 6029.84 34931.23 15.70
Demand Loans 312.02 351.22 395.43 432.07 467.59 338.36 371.17 414.01 474.27 570.08 4126.22 7.89
Cash Credits 364.16 408.04 460.38 500.69 545.34 777.58 821.13 1645.50 1486.19 1045.54 8054.55 16.87
Overdrafts 217.58 244.09 275.33 299.83 326.13 360.03 399.17 952.44 1027.85 773.16 4875.61 20.63
Term Loans 908.30 1021.08 1150.49 1255.82 1362.39 1496.21 1540.30 2252.03 3247.21 3298.69 17532.51 16.39
Profit/ Loss -8.59 30.52 76.27 83.73 77.81 117.41 124.72 210.65 221.49 274.07 1208.08 -16.42
Total NPA 216.40 227.24 242.18 281.15 283.35 321.88 381.47 381.67 548.45 559.89 3443.68 11.82Source : Bank wise audit reports
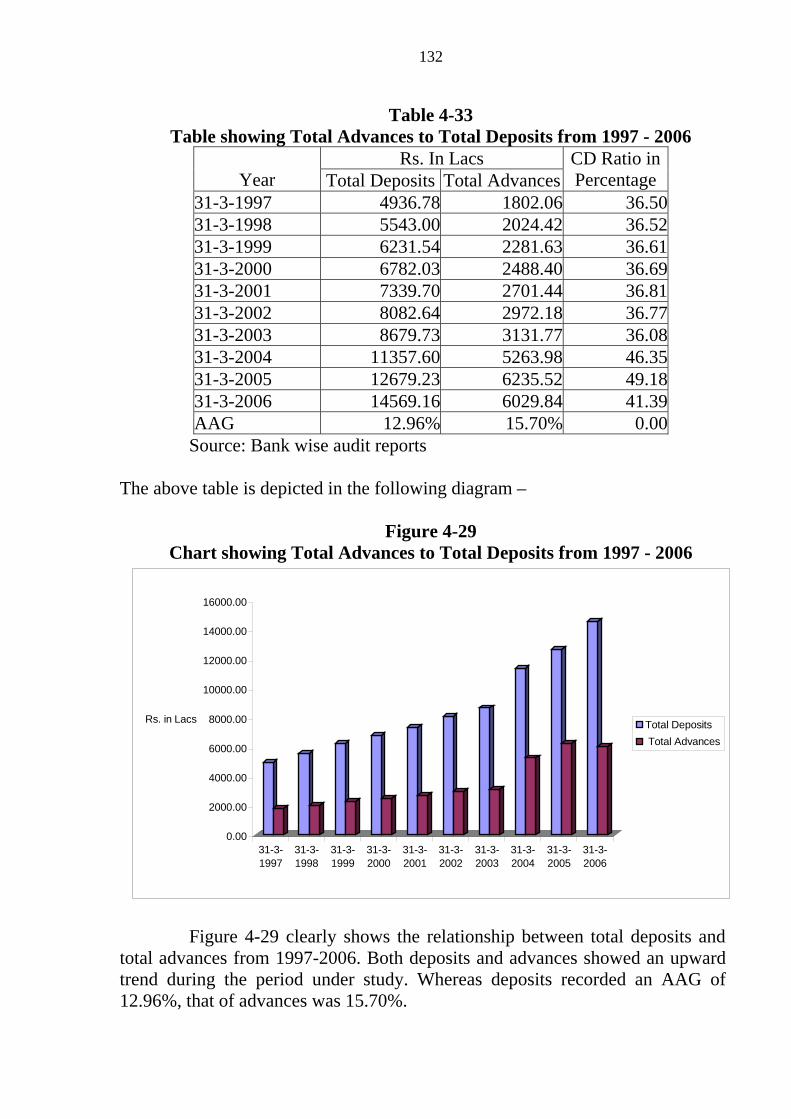
132
Table 4-33
Table showing Total Advances to Total Deposits from 1997 - 2006 Rs. In Lacs
Year Total Deposits Total Advances CD Ratio in Percentage
31-3-1997 4936.78 1802.06 36.5031-3-1998 5543.00 2024.42 36.5231-3-1999 6231.54 2281.63 36.6131-3-2000 6782.03 2488.40 36.6931-3-2001 7339.70 2701.44 36.8131-3-2002 8082.64 2972.18 36.7731-3-2003 8679.73 3131.77 36.0831-3-2004 11357.60 5263.98 46.3531-3-2005 12679.23 6235.52 49.1831-3-2006 14569.16 6029.84 41.39AAG 12.96% 15.70% 0.00
Source: Bank wise audit reports The above table is depicted in the following diagram –
Figure 4-29 Chart showing Total Advances to Total Deposits from 1997 - 2006
0.00
2000.00
4000.00
6000.00
8000.00
10000.00
12000.00
14000.00
16000.00
Rs. in Lacs
31-3-1997
31-3-1998
31-3-1999
31-3-2000
31-3-2001
31-3-2002
31-3-2003
31-3-2004
31-3-2005
31-3-2006
Total Deposits Total Advances
Figure 4-29 clearly shows the relationship between total deposits and total advances from 1997-2006. Both deposits and advances showed an upward trend during the period under study. Whereas deposits recorded an AAG of 12.96%, that of advances was 15.70%.

133
Table 4-34 Table showing CD Ratio from 1997-2006
Year CD Ratio in Percentage
31-3-1997 36.5031-3-1998 36.5231-3-1999 36.6131-3-2000 36.6931-3-2001 36.8131-3-2002 36.7731-3-2003 36.0831-3-2004 46.3531-3-2005 49.1831-3-2006 41.39
Source: Bank wise audit reports The above table is depicted in the following diagram –
Figure 4-30 Chart showing CD Ratio from 1997 - 2006
0
10
20
30
40
50
60
31-3-1997
31-3-1998
31-3-1999
31-3-2000
31-3-2001
31-3-2002
31-3-2003
31-3-2004
31-3-2005
31-3-2006
CD Ratio inPercentage
Figure 4-30 clearly shows the trend of CD ratio from 1997-2006. As can be clearly seen from the chart the CD ratio remained more or less steady from 1997 to 2003, and there after a sudden increase from 36.08% in2003 to 49.18% in 2005 and again dropped to 41.39% in 2006.

134
Table 4-35 Table showing Total NPA to Total Advances from 1997 – 2006
Rs. In Lacs
Year Total Advances Total NPA % of Total NPA to
Total Advances 31-3-1997 1802.06 216.40 12.0131-3-1998 2024.42 227.24 11.2231-3-1999 2281.63 242.18 10.6131-3-2000 2488.40 281.15 11.3031-3-2001 2701.44 283.35 10.4931-3-2002 2972.18 321.88 10.8331-3-2003 3131.77 381.47 12.1831-3-2004 5263.98 381.67 7.2531-3-2005 6235.52 548.45 8.8031-3-2006 6029.84 559.89 9.29AAG 15.70% 11.82% 0.00
Source: Bank wise audit reports The above table is depicted in the following diagram -
Figure 4-31 Chart showing Total NPA to Total Advances from 1997 - 2006
0.00
1000.00
2000.00
3000.00
4000.00
5000.00
6000.00
7000.00
Rs. in Lacs
31-3-1997
31-3-1998
31-3-1999
31-3-2000
31-3-2001
31-3-2002
31-3-2003
31-3-2004
31-3-2005
31-3-2006
Total AdvancesTotal NPA
Figure 4-31 clearly shows the relationship between total advances and total NPA from 1997-2006. Whereas advances recorded an AAG rate of 15.70%, that of NPA showed a downward growth rate in relation to advances from 12.01% in 1997 to 9.29% in 2006.

135
Table 4-36 Table showing Percentage of Total NPA to Gross Total NPA
from 1997 – 2006
Year Total NPA Rs. In Lacs
% of Total NPA to Gross Total NPA
31-3-1997 216.40 6.28 31-3-1998 227.24 6.60 31-3-1999 242.18 7.03 31-3-2000 281.15 8.16 31-3-2001 283.35 8.23 31-3-2002 321.88 9.35 31-3-2003 381.47 11.08 31-3-2004 381.67 11.08 31-3-2005 548.45 15.93 31-3-2006 559.89 16.26 Grand Total 3443.68 100.00
Source: Bank wise audit reports The above table is depicted in the following diagram -
Figure 4-32
Chart showing Percentage of Total NPA to Gross Total NPA from 1997 – 2006
31-3-199731-3-199831-3-199931-3-200031-3-200131-3-200231-3-200331-3-200431-3-200531-3-2006
19976 28
20008.16
19997.03
19986.602006
16.26
200515.93
200411.08
200311.08
20029.35
20018.23
Figure 4-32 clearly shows the percentage of NPA to gross total NPA from 1997-2006. Whereas the contribution of NPA to Gross NPA was only 6.28% in 1997, it has increased to 16.26% in 2006.

136
Table 4-37 Table showing Percentage of Total Deposits to Gross Total Deposits
from 1997 – 2006
Year Total Deposits
Rs. In Lacs % of Total Deposits to Gross Total Deposits
31-3-1997 4936.78 5.73 31-3-1998 5543.00 6.43 31-3-1999 6231.54 7.23 31-3-2000 6782.03 7.87 31-3-2001 7339.70 8.51 31-3-2002 8082.64 9.38 31-3-2003 8679.73 10.07 31-3-2004 11357.60 13.18 31-3-2005 12679.23 14.71 31-3-2006 14569.16 16.90 Grand Total 86201.41 100.00
Source: Bank wise audit reports The above table is depicted in the following diagram -
Figure 4-33 Chart showing Percentage of Total Deposits to Gross Total Deposits
from 1997 - 2006
31-3-199731-3-199831-3-199931-3-200031-3-200131-3-200231-3-200331-3-200431-3-200531-3-2006
19975.73
20007.87
19997.23
19986.43
20018.51
20029.38
200310.07
200413.18
200514.71
200616.90
Figure 4-33 clearly shows the percentage of total deposits to gross total deposits from 1997-2006. Whereas the contribution of total deposits to gross total deposits was 5.73% in 1997, it has increased to 16.9% in 2006.

137
Analysis of Advances Table 4-38
Table showing Percentage of Total Advances to Gross Total Advances from 1997 – 2006
Year Total Advances
Rs. In Lacs % of Total Advances to Gross Total Advances
31-3-1997 1802.06 5.16 31-3-1998 2024.42 5.80 31-3-1999 2281.63 6.53 31-3-2000 2488.40 7.12 31-3-2001 2701.44 7.73 31-3-2002 2972.18 8.51 31-3-2003 3131.77 8.97 31-3-2004 5263.98 15.07 31-3-2005 6235.52 17.85 31-3-2006 6029.84 17.26 Grand Total 34931.23 100.00
Source: Bank wise audit reports The above table is depicted in the following diagram -
Figure 4-34 Chart showing Percentage of Total Advances to Gross Total Advances
from 1997 - 2006
31-3-1997
31-3-1998
31-3-1999
31-3-2000
31-3-2001
31-3-2002
31-3-2003
31-3-2004
31-3-2005
31-3-2006
19975.16
19996.53
19985.80
20007.12
200617.26
200517.85
200415.07 2003
8.97
20028.51
20017.73
Figure 4-34 clearly shows the percentage of total advances to gross total advances from 1997-2006. Whereas the contribution of total advances to Gross total advances was 5.16% in 1997, it has increased to 17.26% in 2006.

138
Table 4-39
Table showing Profit/Loss from 1997 – 2006
Year Profit/Loss Rs. In Lacs
31-3-1997 -8.5931-3-1998 30.5231-3-1999 76.2731-3-2000 83.7331-3-2001 77.8131-3-2002 117.4131-3-2003 124.7231-3-2004 210.6531-3-2005 221.4931-3-2006 274.07AAG -16.42%
Source: Bank wise audit reports
The above table is depicted in the following diagram -
Figure 4-35
Chart showing Profit/Loss from 1997 – 2006
Profit/Loss
-50.00
0.00
50.00
100.00
150.00
200.00
250.00
300.00
31-3-1997
31-3-1998
31-3-1999
31-3-2000
31-3-2001
31-3-2002
31-3-2003
31-3-2004
31-3-2005
31-3-2006
Rs.
in L
acs
Profit/Loss
Figure 4-87 clearly shows the trend of profits/loss from 1997-2006. During the period under study from a loss of Rs.8.9 in Lacs in 1997,profit has increased to Rs.274.07 lacs in 2006.

139
Table 4-40 Table showing Percentage of Profit/Loss to Gross Total Profit/Loss
from 1997 - 2006
Year Profit/Loss Rs. In Lacs
% of Profit/Loss to Gross Total Profit/Loss
31-3-1997 -8.59 -0.7131-3-1998 30.52 2.5331-3-1999 76.27 6.3131-3-2000 83.73 6.9331-3-2001 77.81 6.4431-3-2002 117.41 9.7231-3-2003 124.72 10.3231-3-2004 210.65 17.4431-3-2005 221.49 18.3331-3-2006 274.07 22.69Grand Total 1208.08 100.00 Source: Bank wise audit reports
The above table is depicted in the following diagram - Figure 4-36
Chart showing Percentage of Profit/Loss to Gross Total Profit/Loss from 1997 – 2006
31-3-199731-3-199831-3-199931-3-200031-3-200131-3-200231-3-200331-3-200431-3-200531-3-2006
1997-0.71
200622.69
19996.31
19982.51
200518.33
200417.44
200310.32
20029.72
20016.44
20006.93
Figure 4-36 clearly shows the percentage of profit/loss to gross total profit/loss from 1997-2006. Whereas the contribution of profit/loss was -0.71% in 1997, it has increased to 22.69% in 2006.

140
Performance Analysis of Commercial Banks in the North Zone
Table-4-41
Table showing Deposits, Advances and AAG rate of Commercial Banks in the North Zone from 1997 – 2006
Rs in Lacks
Items 31-3-1997 31-3-1998 31-3-1999 31-3-2000 31-3-2001 31-3-2002 31-3-2003 31-3-2004 31-3-2005 31-3-2006 Grand Total AAG
Total Deposits 4601.04 5121.18 5524.53 5861.96 6910.16 7749.83 8004.13 8328.21 9378.19 9700.48 71179.71 8.74
Term Deposits 2223.12 2454.64 2668.58 2789.61 3314.21 3744.16 3853.25 4217.18 4822.79 4976.21 35063.76 9.48
SB Deposits 1743.12 1945.08 2095.12 2236.14 2627.52 2941.66 3058.76 3434.02 3868.27 3941.30 27890.99 9.59
Current Deposits 634.80 721.47 760.82 836.21 968.43 1064.01 1092.12 677.01 687.13 782.97 8224.97 3.86
NRE Deposits 865.81 975.63 1039.41 1132.07 1319.43 1468.46 1765.24 1996.37 2158.13 2115.29 14835.85 10.60
Total Advances 2854.14 3272.89 3429.01 3851.27 4416.04 4832.63 4923.21 5138.24 6042.83 6190.48 44950.74 9.13
Demand Loans 510.10 569.09 629.44 678.46 780.62 869.33 934.85 930.66 1064.66 1158.03 8125.24 9.63
Cash Credits 892.29 1056.47 1049.83 1247.19 1412.03 1514.63 1609.24 1793.73 1922.91 2001.29 14499.61 9.56
Overdrafts 256.72 290.24 310.94 339.99 392.35 432.44 514.23 524.85 609.87 627.21 4298.85 10.57
Term Loans 1195.02 1357.09 1438.80 1585.64 1831.04 2016.23 1864.89 1889.00 2445.39 2403.95 18027.03 8.55
Profit/ Loss 80.66 86.57 90.06 96.05 108.49 120.48 135.84 154.05 167.71 175.53 1215.45 9.08
Total NPA 218.29 232.32 244.81 270.48 305.92 290.68 296.64 353.42 381.86 299.22 2893.64 4.22
Source: Bank wise audit reports

141
Table 4-42 Table showing Total Advances to Total Deposits from 1997 – 2006
Rs. In Lacs
Years Total Deposits Total AdvancesCD Ratio in Percentage
31-3-1997 4601.04 2854.14 62.0331-3-1998 5121.18 3272.89 63.9131-3-1999 5524.53 3429.01 62.0731-3-2000 5861.96 3851.27 65.7031-3-2001 6910.16 4416.04 63.9131-3-2002 7749.83 4832.63 62.3631-3-2003 8004.13 4923.21 61.5131-3-2004 8328.21 5138.24 61.7031-3-2005 9378.19 6042.83 64.4331-3-2006 9700.48 6190.48 63.82AAG 8.74% 9.13% 0.00Source: Bank-wise audit reports
The above table is depicted in the following diagram -
Figure 4-37 Chart showing Total Advances to Total Deposits from 1997 – 2006
0.00
1000.00
2000.00
3000.00
4000.00
5000.00
6000.00
7000.00
8000.00
9000.00
10000.00
Rs. in Lacs
31-3-1997
31-3-1998
31-3-1999
31-3-2000
31-3-2001
31-3-2002
31-3-2003
31-3-2004
31-3-2005
31-3-2006
Total DepositsTotal Advances
Figure 4-37 clearly shows the relationship between total deposits and total advances from 1997-2006. Both deposits and advances showed an upward trend during the period under study. Whereas deposits recorded an AAG of 8.74% that of advances was 9.13%.

142
Table 4-43 Table showing CD Ratio from 1997 – 2006
Years CD Ratio in Percentage
31-3-1997 62.0331-3-1998 63.9131-3-1999 62.0731-3-2000 65.7031-3-2001 63.9131-3-2002 62.3631-3-2003 61.5131-3-2004 61.7031-3-2005 64.4331-3-2006 63.82
Source: Bank-wise audit reports
The above table is depicted in the following diagram – Figure 4-38
Chart showing CD Ratio from 1997 – 2006
59
60
61
62
63
64
65
66
67
31-3-1997
31-3-1998
31-3-1999
31-3-2000
31-3-2001
31-3-2002
31-3-2003
31-3-2004
31-3-2005
31-3-2006
CD Ratio inPercentage
Figure 4-38 clearly shows the trend of CD ratio from 1997-2006. As can be clearly seen from the chart the CD ratio showed up and downs throughout the period under study and it touched the maximum in 2000 with 65.70% and the minimum in2003 with 61.51%.

143
Table 4-44
Table showing Total NPA to Total Advances from 1997 – 2006 Rs. In Lacs
Years Total Advances Total NPA % of Total NPA to
Total Advances 31-3-1997 2854.14 218.29 7.6531-3-1998 3272.89 232.32 7.1031-3-1999 3429.01 244.81 7.1431-3-2000 3851.27 270.48 7.0231-3-2001 4416.04 305.92 6.9331-3-2002 4832.63 290.68 6.0131-3-2003 4923.21 296.64 6.0331-3-2004 5138.24 353.42 6.8831-3-2005 6042.83 381.86 6.3231-3-2006 6190.48 299.22 4.83AAG 9.13% 4.22% 0.00
Source: Bank-wise audit reports The above table is depicted in the following diagram –
Figure 4-39 Chart showing Total NPA to Total Advances from 1997 – 2006
0.00
1000.00
2000.00
3000.00
4000.00
5000.00
6000.00
7000.00
Rs. in Lacs
31-3-1997
31-3-1998
31-3-1999
31-3-2000
31-3-2001
31-3-2002
31-3-2003
31-3-2004
31-3-2005
31-3-2006
Total AdvancesTotal NPA
Figure 4-39 clearly shows the relationship between total advances and total NPA from 1997-2006. Whereas advances recorded an AAG of 9.13%, that of NPA showed a downward growth rate in relation to advances from 7.65% in 1997 to 4.83% in 2006.

144
Table 4-45
Table showing Percentage of Total NPA to Gross Total NPA from 1997 – 2006
Years Total NPA Rs. In Lacs
% of Total NPA to Gross Total NPA
31-3-1997 218.29 7.54 31-3-1998 232.32 8.03 31-3-1999 244.81 8.46 31-3-2000 270.48 9.35 31-3-2001 305.92 10.57 31-3-2002 290.68 10.05 31-3-2003 296.64 10.25 31-3-2004 353.42 12.21 31-3-2005 381.86 13.20 31-3-2006 299.22 10.34 Grand Total 2893.64 100.00
Source: Bank-wise audit reports
The above table is depicted in the following diagram – Figure 4-40
Chart showing Percentage of Total NPA to Gross Total NPA from 1997 – 2006
31-3-1997
31-3-1998
31-3-1999
31-3-2000
31-3-2001
31-3-2002
31-3-2003
31-3-2004
31-3-2005
31-3-2006
19977.54
20009.35
19998.46
19988.03
200610.34
200513.20
200412.21
200310.25 2002
10.05
200110.57
Figure 4-40 clearly shows the percentage of NPA to gross total NPA from 1997-2006. Whereas the contribution of NPA to Gross NPA was only 7.54% in 1997, it has increased to 10.34% in 2006.

145
Analysis of Deposits
Table 4- 46 Table showing Percentage of Total Deposits to Gross Total Deposits
from 1997- 2006
Years Total Deposits
Rs. In Lacs % to Total Deposits to Gross Total Deposits
31-3-1997 4601.04 6.4631-3-1998 5121.18 7.1931-3-1999 5524.53 7.7631-3-2000 5861.96 8.2431-3-2001 6910.16 9.7131-3-2002 7749.83 10.8931-3-2003 8004.13 11.2431-3-2004 8328.21 11.7031-3-2005 9378.19 13.1831-3-2006 9700.48 13.63Grand Total 71179.71 100.00
Source: Bank wise audit reports
The above table is depicted in the following diagram -
Figure 4-41 Chart showing Percentage of Total Deposits to Gross Total Deposits
from 1997- 2006
31-3-199731-3-199831-3-199931-3-200031-3-200131-3-200231-3-200331-3-200431-3-200531-3-2006
19976.46
20008.24
19997.76
19987.17
200613.63
200513.18
200411.70
200311.24
200210.89
20019.71
Figure 4-41 clearly shows the percentage of total deposits to gross total deposits from 1997-2006. Whereas the contribution of total deposits to gross total deposits was 6.46% in 1997, it has increased to 13.63% in 2006.

146
Table 4-47 Table showing NRE Deposits to Total Deposits from 1997 - 2006
Rs. In Lacs Years Total Deposits NRE Deposits
% of NRE Deposits to Total Deposits
31-3-1997 4601.04 865.81 18.8231-3-1998 5121.18 975.63 19.0531-3-1999 5524.53 1039.41 18.8131-3-2000 5861.96 1132.07 19.3131-3-2001 6910.16 1319.43 19.0931-3-2002 7749.83 1468.46 18.9531-3-2003 8004.13 1765.24 22.0531-3-2004 8328.21 1996.37 23.9731-3-2005 9378.19 2158.13 23.0131-3-2006 9700.48 2115.29 21.81AAG 8.74% 10.60% 0.00
Source: Bank-wise audit reports
The above table is depicted in the following diagram - Figure 4-42
Chart showing NRE Deposits to Total Deposits from 1997 - 2006
0.00
1000.00
2000.00
3000.00
4000.00
5000.00
6000.00
7000.00
8000.00
9000.00
10000.00
Rs. in Lacs
31-3-1997
31-3-1998
31-3-1999
31-3-2000
31-3-2001
31-3-2002
31-3-2003
31-3-2004
31-3-2005
31-3-2006
Total DepositsNRE Deposits
Figure 4-42 clearly shows the relationship between NRE deposits to total deposits from 1997-2006. Both NRE deposits and total deposits showed an upward trend. Whereas NRE deposits recorded an AAG rate of 10.60%, that of total deposits was 8.74%.

147
Table 4-48
Table showing Percentage of NRE Deposits to Gross Total NRE Deposits from 1997 – 2006
Years NRE Deposits
Rs. In Lacs
% of NRE Deposits to Gross Total NRE
Deposits 31-3-1997 865.81 5.84 31-3-1998 975.63 6.58 31-3-1999 1039.41 7.01 31-3-2000 1132.07 7.63 31-3-2001 1319.43 8.89 31-3-2002 1468.46 9.90 31-3-2003 1765.24 11.90 31-3-2004 1996.37 13.46 31-3-2005 2158.13 14.55 31-3-2006 2115.29 14.26 Grand Total 14835.85 100.00
Source: Bank-wise audit reports The above table is depicted in the following diagram –
Figure 4-43 Chart showing Percentage of NRE Deposits to Gross Total NRE Deposits
from 1997 - 2006
31-3-199731-3-199831-3-199931-3-200031-3-200131-3-200231-3-200331-3-200431-3-200531-3-2006
19975.84
19997.01
19986.58
200614.26
200514.55
200413.46
200311.90
20029.90
20018.89
20007.63
Figure 4-43 clearly shows the percentage of NRE deposits to gross total NRE deposits from 1997-2006. Whereas the contribution of NRE deposits was 5.84% in 1997, it has increased to 14.26% in 2006.

148
Table 4-49 Table showing Percentage of Total Advances to Gross Total Advances
from 1997 – 2006
Years Total Advances
Rs. In Lacs % of Total Advances to Gross Total Advances
31-3-1997 2854.14 6.3531-3-1998 3272.89 7.2831-3-1999 3429.01 7.6331-3-2000 3851.27 8.5731-3-2001 4416.04 9.8231-3-2002 4832.63 10.7531-3-2003 4923.21 10.9531-3-2004 5138.24 11.4331-3-2005 6042.83 13.4431-3-2006 6190.48 13.77Grand Total 44950.74 100.00
Source: Bank-wise audit reports The above table is depicted in the following diagram –
Figure 4-44 Chart showing Percentage of Total Advances to Gross Total Advances
from 1997 - 2006
31-3-1997
31-3-1998
31-3-1999
31-3-2000
31-3-2001
31-3-2002
31-3-2003
31-3-2004
31-3-2005
31-3-2006
19976.35
19997.63
19987.28
200613.77
200513.44
200411.43
200310.95
200210.75
20019.82
20008.57
Figure 4-44 clearly shows the percentage of total advances to gross total advances from 1997-2006. Whereas the contribution of total advances to gross total advances was 6.35% in 1997, it has increased to 13.77% in 2006.

149
Table 4-50
Table showing Profit/Loss from 1997 – 2006
Years Profit/Loss Rs. In Lacs
31-3-1997 80.6631-3-1998 86.5731-3-1999 90.0631-3-2000 96.0531-3-2001 108.4931-3-2002 120.4831-3-2003 135.8431-3-2004 154.0531-3-2005 167.7131-3-2006 175.53AAG 9.08%
Source: Bank-wise audit reports The above table is depicted in the following diagram –
Figure 4-45
Chart showing Profit/Loss from 1997 - 2006
0.00
20.00
40.00
60.00
80.00
100.00
120.00
140.00
160.00
180.00
200.00
31-3-1997
31-3-1998
31-3-1999
31-3-2000
31-3-2001
31-3-2002
31-3-2003
31-3-2004
31-3-2005
31-3-2006
Rs.
in L
acs
Profit/Loss
Figure 4-45 clearly shows the trend of profits/loss from 1997-2006. During the period under study profit/loss has recorded an AAG rate of 9.08%. It has increased from Rs.80.66 lacs in 1997 to Rs.175.53 lacs in 2006.

150
Table 4-51 Table showing Percentage of Profit/Loss to Gross Total Profit/Loss
from 1997 - 2006
Years Profit/Loss Rs. In Lacs
% of Profit/Loss to Gross Total Profit/Loss
31-3-1997 80.66 6.6431-3-1998 86.57 7.1231-3-1999 90.06 7.4131-3-2000 96.05 7.9031-3-2001 108.49 8.9331-3-2002 120.48 9.9131-3-2003 135.84 11.1831-3-2004 154.05 12.6731-3-2005 167.71 13.8031-3-2006 175.53 14.44Grand Total 1215.45 100.00
Source: Bank-wise audit reports The above table is depicted in the following diagram –
Figure 4-46 Chart showing Percentage of Profit/Loss to Gross Total Profit/Loss
from 1997 - 2006
31-3-1997
31-3-1998
31-3-1999
31-3-2000
31-3-2001
31-3-2002
31-3-2003
31-3-2004
31-3-2005
31-3-2006
19976.64
20007.90
19997.41
19987.12
200614.44
200513.80
200412.67
200311.18
20029.91
20018.93
Figure 4-46 clearly shows the percentage of profit/loss to gross total profit/loss from 1997-2006. Whereas the contribution of profit/loss was 6.64% in 1997, it has increased to 14.44% in 2006.

Performance Analysis of Co-operative Banks in the North Zone Table 4 -52
Table showing Deposits, Advances and AAG rate of District Co-operative Banks in the North Zone from 1997 – 2006 Rs. In Lacs
Items 31-3-1997 31-3-1998 31-3-1999 31-3-2000 31-3-2001 31-3-2002 31-3-2003 31-3-2004 31-3-2005 31-3-2006Grand Total AAG
Total Deposits 1841.57 2145.60 2432.76 2511.48 2596.26 2917.56 3256.66 3885.35 4695.82 6005.38 32288.43 14.28
Term Deposits 1085.79 1260.70 1433.23 1481.01 1532.28 1720.69 1907.09 2013.69 2891.86 3918.00 19244.35 16.04
SB Deposits 653.57 764.81 864.06 889.76 918.00 1033.16 1141.71 1502.63 1504.28 1622.17 10894.16 10.97
Current Deposits 102.21 120.11 135.45 140.70 145.97 163.71 207.86 369.03 299.68 465.21 2149.93 21.22
Total Advances 1767.07 2046.14 2377.85 2452.11 2549.50 2867.59 3175.45 3572.47 5189.30 6904.44 32901.92 17.01
Demand Loans 476.23 552.71 661.97 667.52 693.62 756.19 1067.19 971.12 1145.71 1398.76 8391.01 13.53
Cash Credits 315.86 375.65 418.18 432.80 447.44 530.91 713.02 1184.72 2197.68 3274.45 9890.71 32.30
Overdrafts 7.55 8.60 9.76 10.14 10.52 11.69 15.47 20.68 25.65 43.70 163.75 22.95
Term Loans 967.44 1109.17 1287.95 1341.66 1397.92 1568.80 1379.77 1395.95 1820.26 2187.53 14456.45 10.12
Profit/Loss 72.45 80.02 80.73 76.88 72.47 67.90 56.21 222.24 271.88 340.28 1341.06 35.58
Total NPA 139.96 160.06 172.32 180.31 183.08 194.36 207.35 225.41 314.63 405.05 2182.53 13.12
Source : Bank wise audit reports
151

152
Table 4-53
Table showing Total Advances to Total Deposits from 1997 - 2006
Rs. In Lacs Years Total Deposits Total Advances
CD Ratio in Percentage
31-3-1997 1841.57 1767.07 95.9531-3-1998 2145.60 2046.14 95.3631-3-1999 2432.76 2377.85 97.7431-3-2000 2511.48 2452.11 97.6431-3-2001 2596.26 2549.50 98.2031-3-2002 2917.56 2867.59 98.2931-3-2003 3256.66 3175.45 97.5131-3-2004 3885.35 3572.47 91.9531-3-2005 4695.82 5189.30 110.5131-3-2006 6005.38 6904.44 114.97AAG 14.28% 17.01% 0.00
Source: Bank-wise audit reports The above table is depicted in the following diagram –
Figure 4-47 Chart showing Total Advances to Total Deposits from 1997 – 2006
0.00
1000.00
2000.00
3000.00
4000.00
5000.00
6000.00
7000.00
Rs. in Lacs
31-3-1997
31-3-1998
31-3-1999
31-3-2000
31-3-2001
31-3-2002
31-3-2003
31-3-2004
31-3-2005
31-3-2006
Total DepositsTotal Advances
Figure 4-47 clearly shows the relationship between total deposits and total advances from 1997-2006. Both deposits and advances showed an upward trend during the period under study. Whereas deposits recorded an AAG of 14.28%, that of advances was 17.01%.

153
Table 4-54 Table showing CD Ratio from 1997 – 2006
Years CD Ratio in Percentage
31-3-1997 95.9531-3-1998 95.3631-3-1999 97.7431-3-2000 97.6431-3-2001 98.2031-3-2002 98.2931-3-2003 97.5131-3-2004 91.9531-3-2005 110.5131-3-2006 114.97
Source: Bank-wise audit reports The above table is depicted in the following diagram –
Figure 4 -48 Chart showing CD Ratio from 1997 – 2006
0
20
40
60
80
100
120
140
31-3-1997
31-3-1998
31-3-1999
31-3-2000
31-3-2001
31-3-2002
31-3-2003
31-3-2004
31-3-2005
31-3-2006
CD Ratio inPercentage
Figure 4-48 clearly shows the trend of CD ratio from 1997-2006. As can be clearly seen from the chart the CD ratio remained more or less steady from 1997 to 2003, and in 2004 it showed a slight downward trend and there after a sudden increase and overtook the deposits and touched 110.51% in 2005 and 114.97% in 2006 in2003 to 49.18% in 2005 and again dropped to 41.39% in 2006.

154
Table 4-55 Table showing Total NPA to Total Advances from 1997 – 2006
Rs. In Lacs
Years Total Advances Total NPA % of Total NPA
to Total Advances31-3-1997 1767.07 139.96 7.9231-3-1998 2046.14 160.06 7.8231-3-1999 2377.85 172.32 7.2531-3-2000 2452.11 180.31 7.3531-3-2001 2549.50 183.08 7.1831-3-2002 2867.59 194.36 6.7831-3-2003 3175.45 207.35 6.5331-3-2004 3572.47 225.41 6.3131-3-2005 5189.30 314.63 6.0631-3-2006 6904.44 405.05 5.87AAG 17.01% 13.12% 0.00
Source: Bank-wise audit reports The above table is depicted in the following diagram –
Figure 4-49 Chart showing Table showing Total NPA to Total Advances from 1997 - 2006
0.00
1000.00
2000.00
3000.00
4000.00
5000.00
6000.00
7000.00
Rs. in Lacs
31-3-1997
31-3-1998
31-3-1999
31-3-2000
31-3-2001
31-3-2002
31-3-2003
31-3-2004
31-3-2005
31-3-2006
Total AdvancesTotal NPA
Figure 4-49 clearly shows the relationship between total advances and total NPA from 1997-2006. Whereas advances recorded an AAG of 17.01%, that of NPA showed a downward growth rate in relation to advances from 7.92% in 1997 to 5.87% in 2006.

155
Table 4-56 Table showing Percentage of Total NPA to Gross Total NPA
from 1997 – 2006
Years Total NPA Rs. In Lacs
% of Total NPA to Gross Total NPA
31-3-1997 139.96 6.41 31-3-1998 160.06 7.33 31-3-1999 172.32 7.90 31-3-2000 180.31 8.26 31-3-2001 183.08 8.39 31-3-2002 194.36 8.91 31-3-2003 207.35 9.50 31-3-2004 225.41 10.33 31-3-2005 314.63 14.42 31-3-2006 405.05 18.56 Grand Total 2182.53 100.00
Source: Bank-wise audit reports The above table is depicted in the following diagram –
Figure 4-50 Chart showing Percentage of Total NPA to Gross Total NPA
from 1997 - 2006
31-3-199731-3-199831-3-199931-3-200031-3-200131-3-200231-3-200331-3-200431-3-200531-3-2006
19976.41
20008.26
19997.90
19987.33
200618.56
200514.42
200410.33
20039.50
20028.91
20018.39
Figure 4-50 clearly shows the percentage of NPA to gross total NPA from 1997-2006. Whereas the contribution of NPA to Gross NPA was only 6.41% in 1997, it has increased to 18.56% in 2006.

156
Analysis of Deposits. Table 4-57
Table showing Percentage of Total Deposits to Gross Total Deposits from 1997-2006
Years Total Deposits
Rs. In Lacs % of Total Deposits to Gross Total Deposits
31-3-1997 1841.57 5.70 31-3-1998 2145.60 6.65 31-3-1999 2432.76 7.53 31-3-2000 2511.48 7.78 31-3-2001 2596.26 8.04 31-3-2002 2917.56 9.04 31-3-2003 3256.66 10.09 31-3-2004 3885.35 12.03 31-3-2005 4695.82 14.54 31-3-2006 6005.38 18.60 Grand Total 32288.43 100.00
Source: Bank-wise audit reports
The above table is depicted in the following diagram – Figure 4-51
Chart showing Percentage of Total Deposits to Gross Total Deposits from 1997-2006
31-3-199731-3-199831-3-199931-3-200031-3-200131-3-200231-3-200331-3-200431-3-200531-3-2006
19975.70
20007.78
19997.53
19986.65
200618.60
200514.54
200412.03
200310.09
20029.04
20018.04
Figure 4-51 clearly shows the percentage of total deposits to gross total deposits from 1997-2006. Whereas the contribution of total deposits to gross total deposits
was 5.70% in 1997, it has increased to 18.60% in 2006.

157
Table 4-58 Table showing Percentage of Advances to Gross Total Advances
from 1997-2006
Years Total Advances
Rs. In Lacs % of Advances to
Gross Total Advances 31-3-1997 1767.07 5.3731-3-1998 2046.14 6.2231-3-1999 2377.85 7.2331-3-2000 2452.11 7.4531-3-2001 2549.50 7.7531-3-2002 2867.59 8.7231-3-2003 3175.45 9.6531-3-2004 3572.47 10.8631-3-2005 5189.30 15.7731-3-2006 6904.44 20.98Grand Total 32901.92 100.00
Source: Bank-wise audit reports The above table is depicted in the following diagram –
Figure 4-52 Chart showing Percentage of Advances to Gross Total Advances
from 1997-2006
31-3-199731-3-199831-3-199931-3-200031-3-200131-3-200231-3-200331-3-200431-3-200531-3-2006
19975.37
200620.98
19997.23
19986.22
200515.77
200410.86 2003
9.65
20028.72
20017.75
20007.45
Figure 4-122 clearly shows the percentage of total advances to gross total advances from 1997-2006. Whereas the contribution of total advances to Gross total advances was 5.37% in 1997, it has increased to 20.98% in 2006.

158
Table 4-59
Table showing Profit/Loss from 1997-2006
Years Profit/Loss Rs. In Lacs
31-3-1997 72.4531-3-1998 80.0231-3-1999 80.7331-3-2000 76.8831-3-2001 72.4731-3-2002 67.9031-3-2003 56.2131-3-2004 222.2431-3-2005 271.8831-3-2006 340.28AAG 35.58%
Source: Bank-wise audit reports The above table is depicted in the following diagram –
Figure 4-53
Chart showing Profit/Loss from 1997-2006
0.00
50.00
100.00
150.00
200.00
250.00
300.00
350.00
400.00
31-3-1997
31-3-1998
31-3-1999
31-3-2000
31-3-2001
31-3-2002
31-3-2003
31-3-2004
31-3-2005
31-3-2006
Rs.
in L
acs
Profit/Loss
Figure 4-53 clearly shows the trend of profits/loss from 1997-2006. During the period under study profit/loss has recorded an AAG rate of 35.58%. It was Rs.72.45 lacs in 1997 and Rs.340.28 lacs in 2006.

159
Table 4-60 Table showing Percentage of Profit/Loss to Gross Total Profit/Loss
from 1997-2006
Years Profit/Loss Rs. In Lacs
% of Profit/Loss to Gross Total Profit/Loss
31-3-1997 72.45 5.40 31-3-1998 80.02 5.97 31-3-1999 80.73 6.02 31-3-2000 76.88 5.73 31-3-2001 72.47 5.40 31-3-2002 67.90 5.06 31-3-2003 56.21 4.19 31-3-2004 222.24 16.57 31-3-2005 271.88 20.27 31-3-2006 340.28 25.37 Grand Total 1341.06 100.00
Source: Bank-wise audit reports The above table is depicted in the following diagram –
Figure 4-54 Chart showing Percentage of Profit/Loss to Gross Total Profit/Loss
from 1997-2006
31-3-199731-3-199831-3-199931-3-200031-3-200131-3-200231-3-200331-3-200431-3-200531-3-2006
19975.40
200520.27
19996.02
19985.97
200416.57
20034.19
20025.06
20015.40
20005.73
200625.37
Figure 4-54 clearly shows the percentage of profit/loss to gross total profit/loss from 1997-2006. Whereas the contribution of profit/loss was 5.40% in 1997, it has decreased to 25.37% in 2006.

160
Performance Analysis of Commercial Banks at the State Level
Table-4-61
Table showing Deposits, Advances and AAG rate of Commercial Banks at State Level from 1997 – 2006
Rs. in Lacs
Items 31-3-1997 31-3-1998 31-3-1999 31-3-2000 31-3-2001 31-3-2002 31-3-2003 31-3-2004 31-3-2005 31-3-2006 Grand Total AAG
Total Deposits 13860.86 15792.28 18025.86 20081.02 22983.46 25934.42 28175.88 30793.09 34102.59 35758.84 245508.30 11.15
Term Deposits 9168.78 10467.11 12114.03 13552.78 15515.35 17615.59 19146.92 20667.49 22556.22 23746.55 164550.81 11.20
SB Deposits 3299.42 3732.49 4159.01 4567.50 5239.35 5822.89 6639.74 7934.78 9008.99 9224.33 59628.52 12.19
Current Deposits 1392.66 1592.67 1752.82 1960.74 2228.77 2495.94 2389.22 2190.82 2537.38 2787.96 21328.97 8.34
NRE Deposits 3808.62 4360.17 5012.49 5666.52 6610.16 7370.21 8084.36 9118.81 10200.64 10477.99 70709.97 11.97
Total Advances 6896.49 7943.50 8873.83 10042.78 11394.14 12689.22 12824.81 15194.89 18132.27 21065.94 125057.88 13.33
Demand Loans 1246.82 1421.25 1620.03 1796.32 2028.47 2252.12 2251.05 2480.97 2778.05 3140.47 21015.56 10.89
Cash Credits 1541.48 1808.32 1920.98 2233.77 2514.19 2742.26 2907.58 3188.19 3593.29 4755.95 27206.02 13.58
Overdrafts 1001.04 1154.99 1335.14 1512.82 1726.31 1968.58 2312.43 2395.52 2872.25 4349.54 20628.62 18.31
Term Loans 3107.16 3558.93 3997.67 4499.86 5125.17 5726.26 5353.75 7130.21 8888.68 8819.98 56207.66 12.85
Profit/ Loss 347.64 382.15 395.64 452.67 466.39 561.44 639.13 685.18 672.56 668.30 5271.11 7.76
Total NPA 435.78 473.20 530.65 586.06 651.84 640.04 648.75 775.83 876.60 630.33 6249.08 5.16 Source : Bank wise audit reports

161
Table 4-62 Table showing Total Advances to Total Deposits from 1997 – 2006
Years Total Deposits Total AdvancesCD Ratio in Percentage
31-3-1997 13860.86 6896.49 49.7631-3-1998 15792.28 7943.50 50.3031-3-1999 18025.86 8873.83 49.2331-3-2000 20081.02 10042.78 50.0131-3-2001 22983.46 11394.14 49.5831-3-2002 25934.42 12689.22 48.9331-3-2003 28175.88 12824.81 45.5231-3-2004 30793.09 15194.89 49.3531-3-2005 34102.59 18132.27 53.1731-3-2006 35758.84 21065.94 58.91AAG 11.15% 13.33% 0.00
Source: Bank-wise audit reports The above table is depicted in the following diagram -
Figure 4-55 Chart showing Total Advances to Total Deposits from 1997 – 2006
0.00
5000.00
10000.00
15000.00
20000.00
25000.00
30000.00
35000.00
40000.00
Rs. in Lacs
31-3-1997
31-3-1998
31-3-1999
31-3-2000
31-3-2001
31-3-2002
31-3-2003
31-3-2004
31-3-2005
31-3-2006
Total DepositsTotal Advances
Figure 4-55 clearly shows the relationship between total deposits and total advances from 1997-2006.Both deposits and advances showed an upward trend during the period under study. Whereas deposits recorded an AAG of 11.15%, that of advances was 13.33%.

162
Table 4-63 Table showing CD Ratio from 1997-2006
Years CD Ratio in Percentage
31-3-1997 49.7631-3-1998 50.3031-3-1999 49.2331-3-2000 50.0131-3-2001 49.5831-3-2002 48.9331-3-2003 45.5231-3-2004 49.3531-3-2005 53.1731-3-2006 58.91
Figure 4-56 Chart showing CD Ratio from 1997-2006
0
10
20
30
40
50
60
70
31-3-1997
31-3-1998
31-3-1999
31-3-2000
31-3-2001
31-3-2002
31-3-2003
31-3-2004
31-3-2005
31-3-2006
CD RatioinPercentage
Figure 4-56 clearly shows the trend of CD ratio from 1997-2006. As can be clearly seen from the chart the CD ratio remained more or less steady from 1997 to 2003, and there after a steady increase from 49.35%in 2004 to 58.91% in 2006 is visible.

163
Table 4-64 Table showing Total NPA to Total Advances from 1997 - 2006
Years Total Advances Total NPA % of Total NPA to
Total Advances31-3-1997 6896.49 435.78 6.3231-3-1998 7943.50 473.20 5.9631-3-1999 8873.83 530.65 5.9831-3-2000 10042.78 586.06 5.8431-3-2001 11394.14 651.84 5.7231-3-2002 12689.22 640.04 5.0431-3-2003 12824.81 648.75 5.0631-3-2004 15194.89 775.83 5.1131-3-2005 18132.27 876.60 4.8331-3-2006 21065.94 630.33 2.99AAG 13.33% 5.16% 0.00
Source: Bank-wise audit reports
The above table is depicted in the following diagram -
Figure 4-57 Chart showing Total NPA to Total Advances from 1997 – 2006
0.00
5000.00
10000.00
15000.00
20000.00
25000.00
Rs. in Lacs
31-3-1997
31-3-1998
31-3-1999
31-3-2000
31-3-2001
31-3-2002
31-3-2003
31-3-2004
31-3-2005
31-3-2006
Total AdvancesTotal NPA
Figure 4-57 clearly shows the relationship between total advances and total NPA from 1997-2006. Whereas advances recorded an AAG of 13.33%, that of NPA showed a downward growth rate in relation to advances from 6.32% in 1997 to 2.99% in 2006.

164
Table 4-65 Table showing Percentage of Total NPA to Gross Total NPA
from 1997 - 2006
Years Total NPA % of Total NPA to Gross Total NPA
31-3-1997 435.78 6.97 31-3-1998 473.20 7.57 31-3-1999 530.65 8.49 31-3-2000 586.06 9.38 31-3-2001 651.84 10.43 31-3-2002 640.04 10.24 31-3-2003 648.75 10.38 31-3-2004 775.83 12.42 31-3-2005 876.60 14.03 31-3-2006 630.33 10.09 Grand Total 6249.08 100.00
Source: Bank-wise audit reports
The above table is depicted in the following diagram - Figure 4-58
Chart showing Percentage of Total NPA to Gross Total NPA from 1997 – 2006
31-3-1997
31-3-1998
31-3-1999
31-3-2000
31-3-2001
31-3-2002
31-3-2003
31-3-2004
31-3-2005
31-3-2006
19976.97
19998.49
19987.57
200610.09
200514.03
200412.42
200310.38 2002
10.24
200110.43
20009.38
Figure 4-58 clearly shows the percentage of NPA to gross total NPA from 1997-2006. Whereas the contribution of NPA to Gross NPA was only 6.97% in 1997 it has increased to 10.09% in 2006.

165
Table 4-66 Table showing Percentage of Total Deposits to Gross Total Deposits
from 1997 – 2006
Years Total Deposits % of Total Deposits to Gross Total Deposits
31-3-1997 13860.86 5.6531-3-1998 15792.28 6.4331-3-1999 18025.86 7.3431-3-2000 20081.02 8.1831-3-2001 22983.46 9.3631-3-2002 25934.42 10.5631-3-2003 28175.88 11.4831-3-2004 30793.09 12.5431-3-2005 34102.59 13.8931-3-2006 35758.84 14.57Grand Total 245508.30 100.00
Source: Bank-wise audit reports
The above table is depicted in the following diagram - Figure 4-59
Chart showing Percentage of Total Deposits to Gross Total Deposits from 1997 – 2006
31-3-1997
31-3-1998
31-3-1999
31-3-2000
31-3-2001
31-3-2002
31-3-2003
31-3-2004
31-3-2005
31-3-2006
19975.65
19997.34
19986.43
200614.57
200513.89
200412.54
200311.48
200210.56
20019.36
20008.18
Figure 4-59 clearly shows the percentage of total deposits to gross total deposits from 1997-2006. Whereas the contribution of total deposits to gross total deposits was 5.65% in 1997, it has increased to 14.57% in 2006.

166
Table 4-67
Table showing NRE Deposits to Total Deposits from 1997 – 2006
Years Total Deposits NRE Deposits % of NRE Deposits
to Total Deposits 31-3-1997 13860.86 3808.62 27.4831-3-1998 15792.28 4360.17 27.6131-3-1999 18025.86 5012.49 27.8131-3-2000 20081.02 5666.52 28.2231-3-2001 22983.46 6610.16 28.7631-3-2002 25934.42 7370.21 28.4231-3-2003 28175.88 8084.36 28.6931-3-2004 30793.09 9118.81 29.6131-3-2005 34102.59 10200.64 29.9131-3-2006 35758.84 10477.99 29.30AAG 11.15% 11.97% 0.00
Source: Bank-wise audit reports The above table is depicted in the following diagram -
Figure 4-60
Chart showing NRE Deposits to Total Deposits from 1997 – 2006
0.00
5000.00
10000.00
15000.00
20000.00
25000.00
30000.00
35000.00
40000.00
Rs. in Lacs
31-3-1997
31-3-1998
31-3-1999
31-3-2000
31-3-2001
31-3-2002
31-3-2003
31-3-2004
31-3-2005
31-3-2006
Total DepositsNRE Deposits
Figure 4-60 clearly shows the relationship between NRE deposits to total deposits from 1997-2006. Both NRE deposits and total deposits showed an upward trend. Whereas NRE deposits recorded an AAG rate of 11.97% that of total deposits was 11.15%.

167
Table 4-68 Table showing Percentage of NRE Deposits to Gross Total NRE Deposits from
1997 – 2006
Years NRE Deposits % of NRE Deposits to
Gross Total NRE Deposits31-3-1997 3808.62 5.3931-3-1998 4360.17 6.1731-3-1999 5012.49 7.0931-3-2000 5666.52 8.0131-3-2001 6610.16 9.3531-3-2002 7370.21 10.4231-3-2003 8084.36 11.4331-3-2004 9118.81 12.9031-3-2005 10200.64 14.4331-3-2006 10477.99 14.82Grand Total 70709.97 100.00
Source: Bank-wise audit reports The above table is depicted in the following diagram -
Figure 4-61 Chart showing Percentage of NRE Deposits to Gross Total NRE Deposits
from 1997 – 2006
31-3-199731-3-199831-3-199931-3-200031-3-200131-3-200231-3-200331-3-200431-3-200531-3-2006
19975.392006
14.82
19997.09
19986.17
200514.43
200412.90
200311.43
200210.42
20019.35
20008.01
Figure 4-61 clearly shows the percentage of NRE deposits to gross total NRE deposits from 1997-2006. Whereas the contribution of NRE deposits was 5.39% in 1997, it has increased to 14.82% in 2006.

168
Table 4-69 Table showing Percentage of Total Advances to Gross Total Advances
from 1997 – 2006
Years Total Advances % of Total Advances to Gross Total Advances
31-3-1997 6896.49 5.5131-3-1998 7943.50 6.3531-3-1999 8873.83 7.1031-3-2000 10042.78 8.0331-3-2001 11394.14 9.1131-3-2002 12689.22 10.1531-3-2003 12824.81 10.2631-3-2004 15194.89 12.1531-3-2005 18132.27 14.5031-3-2006 21065.94 16.84Grand Total 125057.88 100.00
Source: Bank-wise audit reports The above table is depicted in the following diagram -
Figure 4-62 Chart showing Percentage of Total Advances to Gross Total Advances
from 1997 – 2006
31-3-1997
31-3-1998
31-3-1999
31-3-2000
31-3-2001
31-3-2002
31-3-2003
31-3-2004
31-3-2005
31-3-2006
19975.51
19997.10
19986.35
200616.84
200514.50
200412.15
200310.26
200210.15
20019.11
20008.03
Figure 4-62 clearly shows the percentage of total advances to gross total advances from 1997-2006. Whereas the contribution of total advances to Gross total advances was 5.51% in 1997, it has increased to 16.84% in 2006.

169
Table 4-70 Table showing Profit/Loss from 1997-2006
Years Profit/Loss
31-3-1997 347.6431-3-1998 382.1531-3-1999 395.6431-3-2000 452.6731-3-2001 466.3931-3-2002 561.4431-3-2003 639.1331-3-2004 685.1831-3-2005 672.5631-3-2006 668.30AAG 7.76%
Source: Bank-wise audit reports
The above table is depicted in the following diagram -
Figure 4-63 Chart showing Profit/Loss from 1997-2006
0.00
100.00
200.00
300.00
400.00
500.00
600.00
700.00
800.00
31-3-1997
31-3-1998
31-3-1999
31-3-2000
31-3-2001
31-3-2002
31-3-2003
31-3-2004
31-3-2005
31-3-2006
Rs.
in L
acs
Profit/Loss
Figure 4-63 clearly shows the trend of profits/loss from 1997-2006. During the period under study profit/loss has recorded an AAG rate of 7.76%. It has increased from Rs.347.64 lacs in 1997 to Rs.668.30 lacs in 2006.

170
Table 4-71 Table showing Percentage of Profit/Loss to Gross Total Profit/Loss
from 1997-2006
Years Profit/Loss % of Profit/Loss to Gross Total Profit/Loss
31-3-1997 347.64 6.6031-3-1998 382.15 7.2531-3-1999 395.64 7.5131-3-2000 452.67 8.5931-3-2001 466.39 8.8531-3-2002 561.44 10.6531-3-2003 639.13 12.1331-3-2004 685.18 13.0031-3-2005 672.56 12.7631-3-2006 668.30 12.68Grand Total 5271.11 100.00
Source: Bank-wise audit reports
The above table is depicted in the following diagram - Figure 4-64
Chart showing Percentage of Profit/Loss to Gross Total Profit/Loss from 1997-2006
31-3-199731-3-199831-3-199931-3-200031-3-200131-3-200231-3-200331-3-200431-3-200531-3-2006
19997.51
19976.60
19987.25
200312.13
200210.65
20018.85
20008.59
200413.00
200512.76
200612.68
Figure 4-64 clearly shows the percentage of profit/loss to gross total profit/loss from 1997-2006. Whereas the contribution of profit/loss was 6.60% in 1997, it has increased to 12.68% in 2006.

171
Performance Analysis of Co-operative Banks at the State Level Table 4 –72
Table showing Deposits, Advances and AAG rate of District Co-operative Banks at State Level from 1997 – 2006 Rs. In Lacs
Items 31-3-1997 31-3-199831-3-199931-3-200031-3-200131-3-200231-3-200331-3-200431-3-200531-3-2006Grand Total AAG
Total Deposits 11659.21 12936.13 14044.21 14858.10 15627.14 17570.58 19019.63 22584.59 24911.39 29761.67 182972.64 11.08
Term Deposits 8509.22 9401.00 10204.75 10845.73 11435.39 12846.36 13935.59 15111.78 16655.44 21136.87 130082.12 10.79
SB Deposits 2335.89 2623.56 2841.67 2952.51 3068.91 3461.88 3674.77 4588.86 5225.27 5840.51 36613.83 10.88Current Deposits 814.10 911.57 997.78 1059.85 1122.83 1262.34 1409.27 2883.95 3030.68 2784.29 16276.66 17.70Total Advances 7417.64 8253.06 9000.47 9433.18 9839.81 11166.98 12339.83 15492.78 18271.77 20569.79 121785.31 12.17
Demand Loans 1501.75 1681.98 1856.16 1927.93 2012.56 1496.31 1874.52 1830.10 2063.41 2384.84 18629.56 6.24
Cash Credits 1027.49 1157.79 1266.97 1334.62 1393.83 2362.04 2688.21 4032.02 4886.33 5856.76 26006.07 22.91
Overdrafts 801.88 900.13 946.94 969.37 1009.65 1150.57 1298.78 1935.42 1902.93 1641.61 12557.29 9.38
Term Loans 4086.52 4513.15 4930.41 5201.26 5423.77 6158.06 6478.32 7695.24 9419.10 10686.58 64592.41 11.43
Profit/ Loss 110.69 160.67 210.30 219.49 204.10 239.99 240.04 556.51 641.87 658.76 3242.42 26.76
Total NPA 694.81 731.86 765.26 804.45 805.48 889.00 980.89 1026.81 1291.46 1352.01 9342.03 7.89Source : Bank wise audit reports
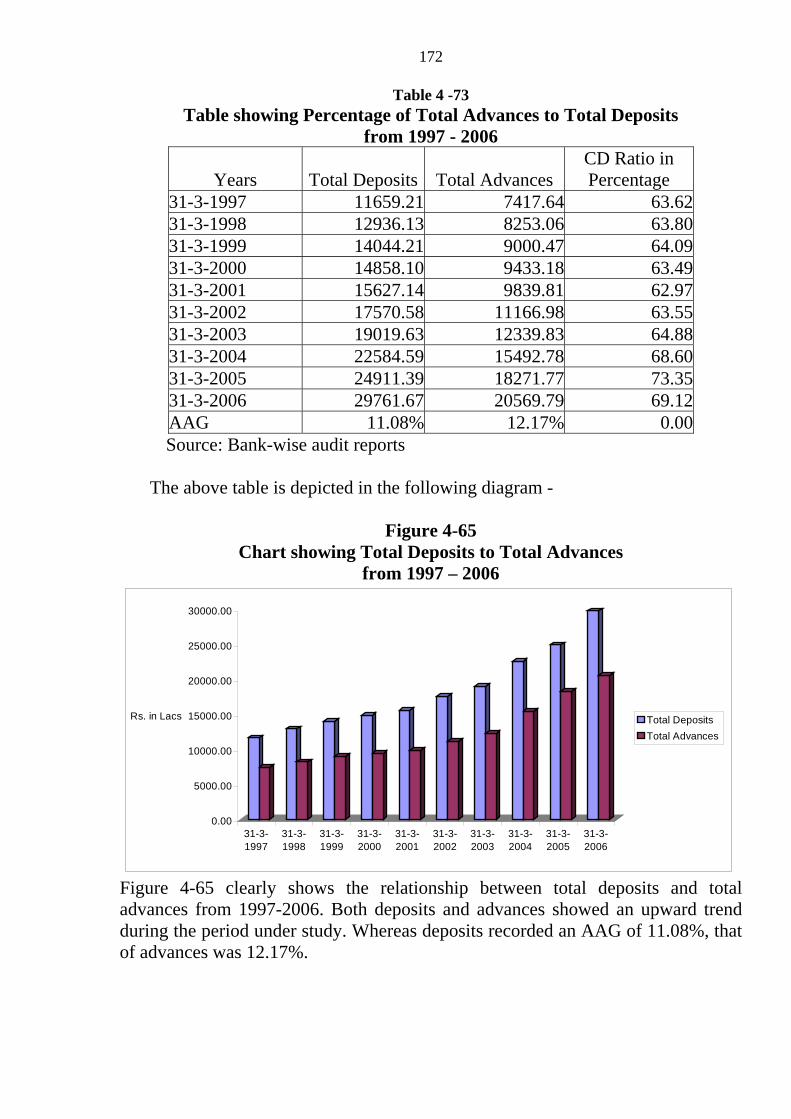
172
Table 4 -73 Table showing Percentage of Total Advances to Total Deposits
from 1997 - 2006
Years Total Deposits Total Advances CD Ratio in Percentage
31-3-1997 11659.21 7417.64 63.6231-3-1998 12936.13 8253.06 63.8031-3-1999 14044.21 9000.47 64.0931-3-2000 14858.10 9433.18 63.4931-3-2001 15627.14 9839.81 62.9731-3-2002 17570.58 11166.98 63.5531-3-2003 19019.63 12339.83 64.8831-3-2004 22584.59 15492.78 68.6031-3-2005 24911.39 18271.77 73.3531-3-2006 29761.67 20569.79 69.12AAG 11.08% 12.17% 0.00
Source: Bank-wise audit reports
The above table is depicted in the following diagram -
Figure 4-65 Chart showing Total Deposits to Total Advances
from 1997 – 2006
0.00
5000.00
10000.00
15000.00
20000.00
25000.00
30000.00
Rs. in Lacs
31-3-1997
31-3-1998
31-3-1999
31-3-2000
31-3-2001
31-3-2002
31-3-2003
31-3-2004
31-3-2005
31-3-2006
Total DepositsTotal Advances
Figure 4-65 clearly shows the relationship between total deposits and total advances from 1997-2006. Both deposits and advances showed an upward trend during the period under study. Whereas deposits recorded an AAG of 11.08%, that of advances was 12.17%.
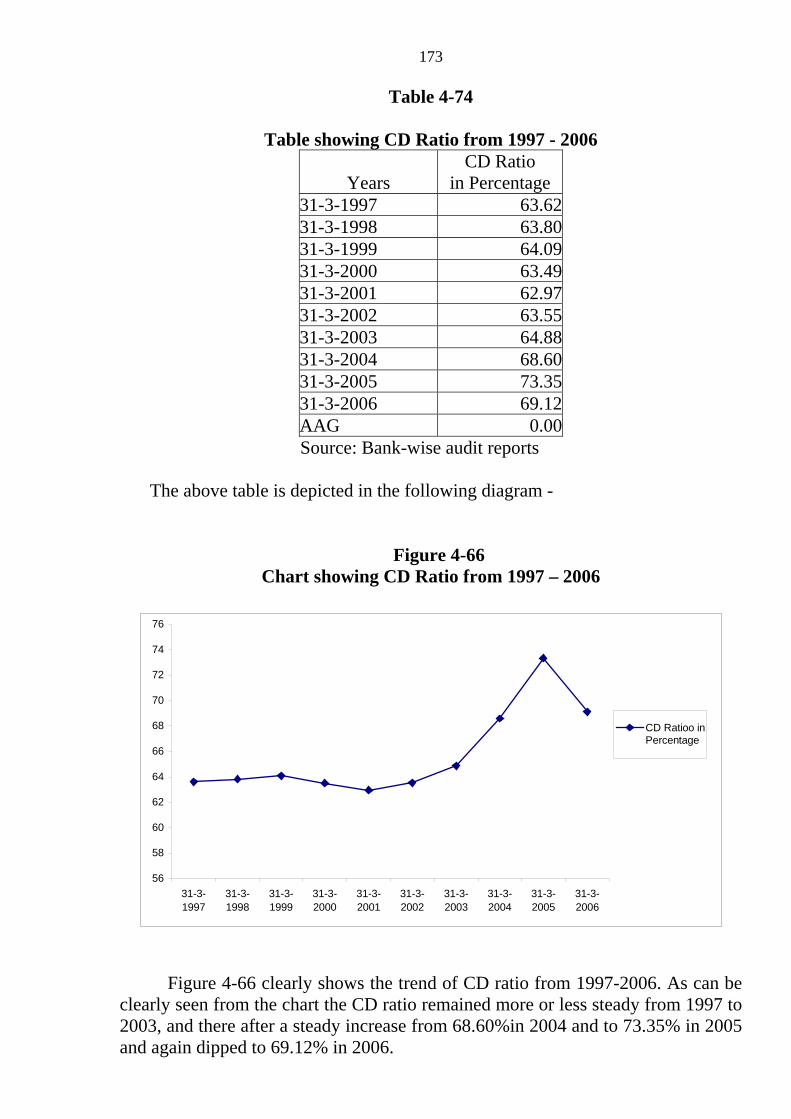
173
Table 4-74
Table showing CD Ratio from 1997 - 2006
Years CD Ratio
in Percentage 31-3-1997 63.6231-3-1998 63.8031-3-1999 64.0931-3-2000 63.4931-3-2001 62.9731-3-2002 63.5531-3-2003 64.8831-3-2004 68.6031-3-2005 73.3531-3-2006 69.12AAG 0.00
Source: Bank-wise audit reports
The above table is depicted in the following diagram - Figure 4-66
Chart showing CD Ratio from 1997 – 2006
56
58
60
62
64
66
68
70
72
74
76
31-3-1997
31-3-1998
31-3-1999
31-3-2000
31-3-2001
31-3-2002
31-3-2003
31-3-2004
31-3-2005
31-3-2006
CD Ratioo inPercentage
Figure 4-66 clearly shows the trend of CD ratio from 1997-2006. As can be clearly seen from the chart the CD ratio remained more or less steady from 1997 to 2003, and there after a steady increase from 68.60%in 2004 and to 73.35% in 2005 and again dipped to 69.12% in 2006.

174
Table 4-75
Table showing Percentage of Total NPA to Total Advances from 1997 - 2006
Years Total Advances Total NPA % of Total NPA to
Total Advances 31-3-1997 7417.64 694.81 9.3731-3-1998 8253.06 731.86 8.8731-3-1999 9000.47 765.26 8.5031-3-2000 9433.18 804.45 8.5331-3-2001 9839.81 805.48 8.1931-3-2002 11166.98 889.00 7.9631-3-2003 12339.83 980.89 7.9531-3-2004 15492.78 1026.81 6.6331-3-2005 18271.77 1291.46 7.0731-3-2006 20569.79 1352.01 6.57AAG 12.17% 7.89% 0.00
Source: Bank-wise audit reports
The above table is depicted in the following diagram - Figure 4-67
Chart showing of Total NPA to Total Advances from 1997 – 2006
0.00
5000.00
10000.00
15000.00
20000.00
25000.00
Rs. in Lacs
31-3-1997
31-3-1998
31-3-1999
31-3-2000
31-3-2001
31-3-2002
31-3-2003
31-3-2004
31-3-2005
31-3-2006
Total AdvancesTotal NPA
Figure 4-67 clearly shows the relationship between total advances and total NPA from 1997-2006. Whereas advances recorded an AAG of 12.17%, that of NPA showed a downward growth rate in relation to advances from 9.37% in 1997 to 6.57% in 2006.

175
Table 4-76 Table showing Percentage of Total NPA to Gross Total NPA from 1997 - 2006
Years Total NPA % of Total NPA to Gross Total NPA
31-3-1997 694.81 7.4431-3-1998 731.86 7.8331-3-1999 765.26 8.1931-3-2000 804.45 8.6131-3-2001 805.48 8.6231-3-2002 889.00 9.5231-3-2003 980.89 10.5031-3-2004 1026.81 10.9931-3-2005 1291.46 13.8231-3-2006 1352.01 14.47Grand Total 9342.03 100.00
Source: Bank-wise audit reports The above table is depicted in the following diagram -
Figure 4-68 Chart showing Percentage of Total NPA to Gross Total NPA
from 1997 - 2006
31-3-1997
31-3-1998
31-3-1999
31-3-2000
31-3-2001
31-3-2002
31-3-2003
31-3-2004
31-3-2005
31-3-2006
19977.44
19998.19
19987.83
200614.47
200513.82
200410.99
200310.50
20029.52
20018.62
20008.61
Figure 4-68 clearly shows the percentage of NPA to gross total NPA from 1997-2006. Whereas the contribution of NPA to Gross NPA was only 7.44% in 1997 it has increased to 14.47% in 2006.

176
Table 4-77 Table showing Percentage of Total Deposits to Gross Total Deposits
from 1997 - 2006
Years Total Deposits % of Total Deposits to Gross Total Deposits
31-3-1997 11659.21 6.3731-3-1998 12936.13 7.0731-3-1999 14044.21 7.6831-3-2000 14858.10 8.1231-3-2001 15627.14 8.5431-3-2002 17570.58 9.6031-3-2003 19019.63 10.3931-3-2004 22584.59 12.3431-3-2005 24911.39 13.6131-3-2006 29761.67 16.27Grand Total 182972.64 100.00
Source: Bank-wise audit reports
The above table is depicted in the following diagram - Figure 4-69
Chart showing Percentage of Total Deposits to Gross Total Deposits from 1997 – 2006
31-3-199731-3-199831-3-199931-3-200031-3-200131-3-200231-3-200331-3-200431-3-200531-3-2006
19976.37
200616.27
19997.68
19987.07
200513.61
200412.34
200310.39
20029.60
20018.54
20008.12
Figure 4-69 clearly shows the percentage of total deposits to gross total deposits from 1997-2006. Whereas the contribution of total deposits to gross total deposits was 6.37% in 1997, it has increased to 16.27% in 2006.
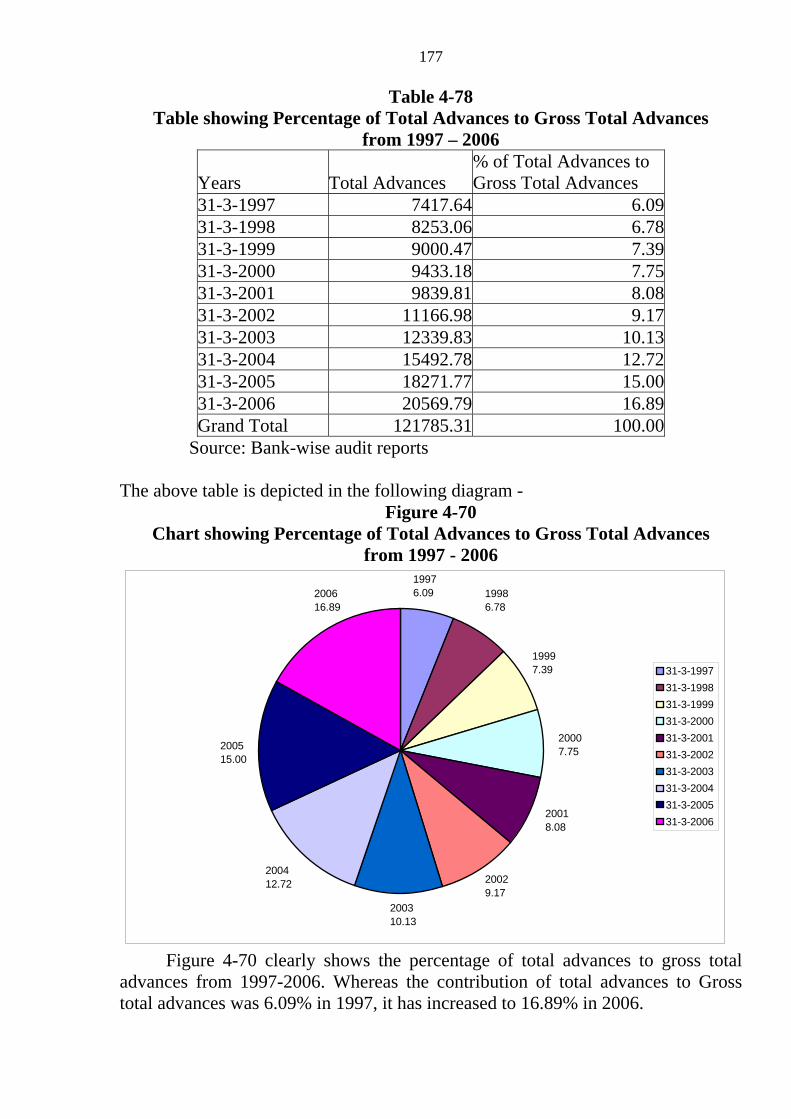
177
Table 4-78 Table showing Percentage of Total Advances to Gross Total Advances
from 1997 – 2006
Years Total Advances % of Total Advances to Gross Total Advances
31-3-1997 7417.64 6.0931-3-1998 8253.06 6.7831-3-1999 9000.47 7.3931-3-2000 9433.18 7.7531-3-2001 9839.81 8.0831-3-2002 11166.98 9.1731-3-2003 12339.83 10.1331-3-2004 15492.78 12.7231-3-2005 18271.77 15.0031-3-2006 20569.79 16.89Grand Total 121785.31 100.00
Source: Bank-wise audit reports The above table is depicted in the following diagram -
Figure 4-70 Chart showing Percentage of Total Advances to Gross Total Advances
from 1997 - 2006
31-3-199731-3-199831-3-199931-3-200031-3-200131-3-200231-3-200331-3-200431-3-200531-3-2006
19976.09
19997.39
19986.78
200616.89
200515.00
200412.72
200310.13
20029.17
20018.08
20007.75
Figure 4-70 clearly shows the percentage of total advances to gross total advances from 1997-2006. Whereas the contribution of total advances to Gross total advances was 6.09% in 1997, it has increased to 16.89% in 2006.
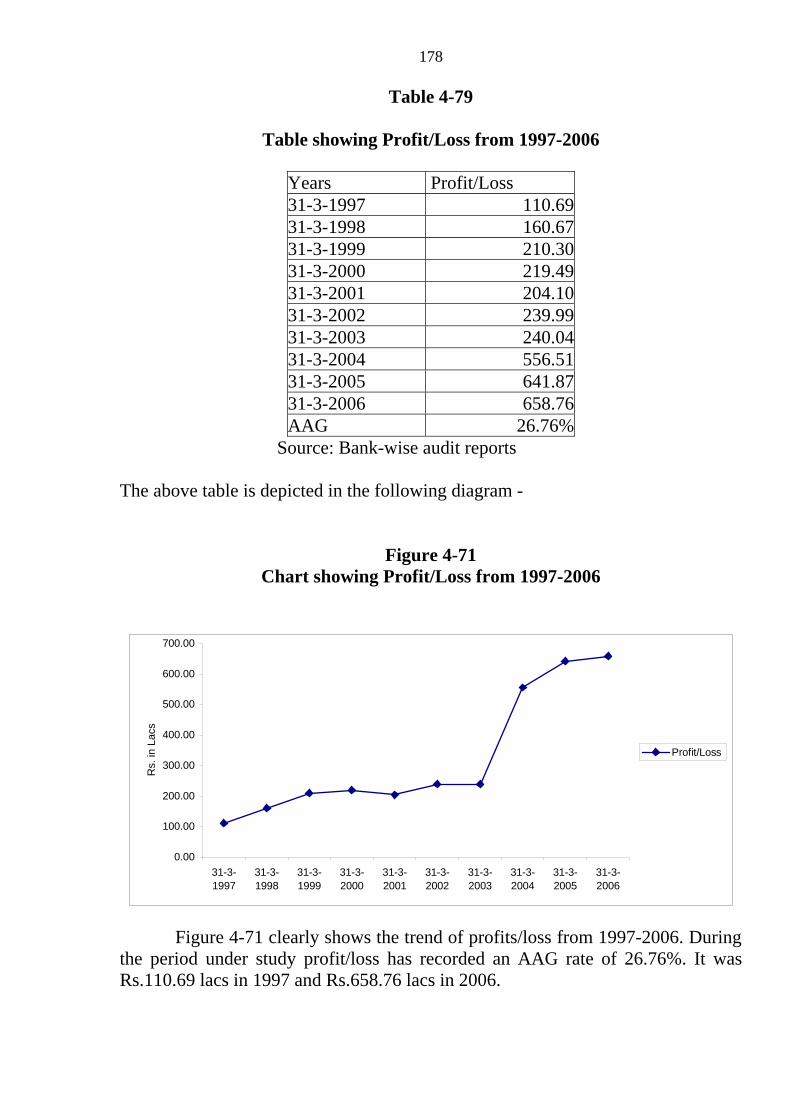
178
Table 4-79
Table showing Profit/Loss from 1997-2006
Years Profit/Loss 31-3-1997 110.6931-3-1998 160.6731-3-1999 210.3031-3-2000 219.4931-3-2001 204.1031-3-2002 239.9931-3-2003 240.0431-3-2004 556.5131-3-2005 641.8731-3-2006 658.76AAG 26.76%
Source: Bank-wise audit reports The above table is depicted in the following diagram -
Figure 4-71 Chart showing Profit/Loss from 1997-2006
0.00
100.00
200.00
300.00
400.00
500.00
600.00
700.00
31-3-1997
31-3-1998
31-3-1999
31-3-2000
31-3-2001
31-3-2002
31-3-2003
31-3-2004
31-3-2005
31-3-2006
Rs.
in L
acs
Profit/Loss
Figure 4-71 clearly shows the trend of profits/loss from 1997-2006. During the period under study profit/loss has recorded an AAG rate of 26.76%. It was Rs.110.69 lacs in 1997 and Rs.658.76 lacs in 2006.

179
Table 4-80 Table showing Percentage of Profit/Loss to Gross Total Profit/Loss
from 1997-2006
Years Profit/Loss % of Profit/Loss to Gross Total Profit/Loss
31-3-1997 110.69 3.4131-3-1998 160.67 4.9631-3-1999 210.30 6.4931-3-2000 219.49 6.7731-3-2001 204.10 6.2931-3-2002 239.99 7.4031-3-2003 240.04 7.4031-3-2004 556.51 17.1631-3-2005 641.87 19.8031-3-2006 658.76 20.32Grand Total 3242.42 100.00
Source: Bank-wise audit reports The above table is depicted in the following diagram -
Figure 4-72 Chart showing Percentage of Profit/Loss to Gross Total Profit/Loss
from 1997-2006
31-3-199731-3-199831-3-199931-3-200031-3-200131-3-200231-3-200331-3-200431-3-200531-3-2006
19973.41
19996.49
19984.96
200417.16
200519.80
200620.32
20037.40
20027.40
20016.29
20006.77
Figure 4-72 clearly shows the percentage of profit/loss to gross total profit/loss from 1997-2006. Whereas the contribution of profit/loss was 3.41% in 1997, it has decreased to 20.32% in 2006.