Kinetika Kimia (Chemical Kinetics) -...
101
Kinetika Kimia (Chemical Kinetics) Jaslin Ikhsan, Ph.D. Kimia FMIPA UNY
Transcript of Kinetika Kimia (Chemical Kinetics) -...

Kinetika Kimia(Chemical Kinetics)
Jaslin Ikhsan, Ph.D.
Kimia FMIPA UNY

Course Summary.• Dependence of rate on concentration.• Experimental methods in reaction
kinetics.• Kinetics of multistep reactions.• Dependence of rate on temperature.

Recommended reading.1. P.W. Atkins, Kimia Fisika (terjemahan), jilid 2, edisi keempat,
2. P.W. Atkins, Physical Chemistry, 5th ed., Oxford:
3. Gordon M. Barrow, Physical Chemistry
4. Arthur M. Lesk, Introduction to Physical Chemistry
Oxford University Press, 1994
Jakarta: Erlangga, 1999.
For E
valuation Only.
Copyright (c) by F
oxit Softw
are Com
pany, 2004E
dited by Foxit P
DF
Editor

Chemical Kinetics.
Lecture 1.Review of Basic concepts.

Reaction Rate: The Central Focus of Chemical Kinetics

Chemical reaction kinetics.reactants products
• Chemical reactions involve the forming and breaking of chemical bonds.
• Reactant molecules (H2, I2) approach one another and collide and interact with appropriate energy and orientation. Bonds are stretched, broken and formed and finally product molecules (HI) move away from one another.
• How can we describe the rate at which such a chemical transformation takes place?
)(2)()( 22 gHIgIgH →+
• Thermodynamics tells us allabout the energetic feasibilityof a reaction : we measure theGibbs energy ∆G for the chemical Reaction.• Thermodynamics does not tell ushow quickly the reaction willproceed : it does not providekinetic information.

Basic ideas in reaction kinetics.• Chemical reaction kinetics deals with the rate of velocity of chemical
reactions.
• We wish to quantify– The velocity at which reactants are transformed to products– The detailed molecular pathway by which a reaction proceeds (the reaction
mechanism).
• These objectives are accomplished using experimental measurements.
• Chemical reactions are said to be activated processes : energy (usually thermal (heat) energy) must be introduced into the system so that chemical transformation can occur. Hence chemical reactions occur more rapidly when the temperature of the system is increased.
• In simple terms an activation energy barrier must be overcome before reactants can be transformed into products.

Reaction Rate.• What do we mean by the term
reaction rate?– The term rate implies that something
changes with respect to something else.
• How may reaction rates be determined ?
– The reaction rate is quantified in terms of the change in concentration of a reactant or product species with respect to time.
– This requires an experimental measurement of the manner in which the concentration changes with time of reaction. We can monitor either the concentration change directly, or monitor changes in some physical quantity which is directly proportional to the concentration.
• The reactant concentration decreases with increasing time, and the product concentration increases with increasing time.
• The rate of a chemical reaction depends on the concentration of each of the participating reactant species.
• The manner in which the rate changes in magnitude with changes in the magnitude of each of the participating reactants is termed the reaction order.
[ ] [ ]dtPd
dtRdR =−=Σ
Productconcentration
Reactant concentration
Net reaction rateUnits : mol dm-3 s-1
[R]t
[P]t
time

Rate, rate equation and reaction order : formaldefinitions.
• The reaction rate (reaction velocity) R is quantified in terms ofchanges in concentration [J] of reactant or product species J with respect to changes in time. The magnitude of the reaction rate changes as the reaction proceeds.
[ ] [ ]dtJd
tJR
Jt
JJ υυ
1lim10
=∆
∆=
→∆ [ ] [ ] [ ]dt
OHddtOd
dtHdR
gOHgOgH
222
222
21
21
)(2)()(2
=−=−=
→+
• Note : Units of rate :- concentration/time , hence RJ has units mol dm-3s-1 .υJ denotes the stoichiometric coefficient of species J. If J is a reactant υJis negative and it will be positive if J is a product species.
• Rate of reaction is often found to be proportional to the molarconcentration of the reactants raised to a simple power (whichneed not be integral). This relationship is called the rate equation.The manner in which the reaction rate changes in magnitude with changes in the magnitude of the concentration of each participating reactant species is called the reaction order.

Problem Example:
The rate formation of NO in the reaction: 2NOBr(g) ----> 2NO(g) + Br2(g)
was reported as 1.6 x 10⁻⁴ mol/(L s).What is the rate of reaction and the rate of consumptionof NOBr ?


Products→+ kyBxA
[ ] [ ] [ ] [ ]βα BAkdtBd
ydtAd
xR =−=−=
11
rate constant k
stoichiometriccoefficients
empirical rateequation (obtainedfrom experiment)
α, β = reactionorders for thereactants (gotexperimentally)Rate equation can not in
general be inferred fromthe stoichiometric equationfor the reaction.
Log [A]
Slope = α
Log R Log R
Log [B]
Slope = β


ClBrIXHXXH
,,222
=→+Different rate equations
imply different mechanisms.
[ ] [ ][ ]
[ ] [ ][ ][ ][ ]
[ ] [ ][ ] 2/122
22
2
2/122
22
22
22
2
1
2
2
ClHkdtHCldR
HClClHBrHBrkBrHk
dtHBrdR
HBrBrH
IHkdtHIdR
HIIH
==
→+
′+
==
→+
==
→+• The rate law provides an important guideto reaction mechanism, since any proposedmechanism must be consistent with theobserved rate law.• A complex rate equation will imply a complexmultistep reaction mechanism.• Once we know the rate law and the rateconstant for a reaction, we can predict therate of the reaction for any given compositionof the reaction mixture.• We can also use a rate law to predict the concentrations of reactants and products atany time after the start of the reaction.

Zero order kinetics. The reaction proceeds at the same rate Rregardless of concentration.
[ ]0AR ∝RRate equation :units of rate constant k :mol dm-3 s-1
0when0 ==
=−=
taa
kdtdaR
][A
integrateusing initialcondition
02/10
2/1
02/1
2
2when
ak
a
aat
∝=
==
ττ
τhalf life :
0)( aktta +−= a
t
slope = -k
0adiagnosticplot
2/1τ
0ak
slope21
=

products→kAFirst order kinetics. First order differentialrate equation.
[ ]dtAdrate t−=
Initialconcentration a0
kadtda
=−
Initial condition
00 aat ==
Solve differentialequation
Separationof variables
[ ]ktaeata kt −== − exp)( 00For a first order reaction the relationship:
[ ][ ] tt
tt
AkrateArate
=∝
)()( is valid generally for any time t.
k is the first orderrate constant, units: s-1
Reactant concentrationas function of time.

2/12
2/1
02/1
==
==
u
aat
θθ
τ
kk693.02ln
2/1 ==τ
Half life τ1/2First order kinetics.
1−→ sk
[ ]
[ ]
kta
tau
ktaeata kt
=
−==
−== −
θ
θexp)(exp)(
0
00 Mean lifetime of reactant molecule
( )k
dteaa
dttaa
kt 1110 0
00
0
=== ∫∫∞ −∞
τ

1=u
5.0=u
25.0=u
125.0=u
0aau =
2/02/1 aat == τ
2/1τ
kk693.02ln
2/1 ==τ
First order kinetics: half life.
In each successive periodof duration τ1/2 the concentrationof a reactant in a first order reactiondecays to half its value at the startof that period. After n such periods,the concentration is (1/2)n of itsinitial value.
half life independent of initial reactant concentration0a

1st order kinetics 2nd order kinetics
θθ −
−
=
=
eu
eata kt
)(
)( 0
)(θu
θθ
+=
+=
11)(
1)(
0
0
u
tkaata
)(θu
kt=θ tka0=θ

dm3mol-1s-1Second order kinetics: equalreactant concentrations. PA k→2
0
2
0 aat
kadtda
==
=−
separate variablesintegrate
0
11a
kta
+=
a1
slope = k
t
20
2/1aat == τhalf life
( )tka
ata0
0
1+=
2/1τ
↑↓
∝
=
02/1
02/1
02/1
1
1
aas
a
ka
τ
τ
τ
rate varies assquare of reactantconcentration
0a

1st and 2nd order kinetics : Summary .Reaction Differential
rate equationConcentrationvariation with
time
DiagnosticEquation
HalfLife
Products
1→kAak
dtda
1=− [ ]tkata
10 exp)(
−=
01 ln)(ln atkta +−=1
2/12ln
k=τ
Products2 2→kA 2
2akdtda
=−
taka
ta
02
0
1
)(
+
=0
21
)(1
atk
ta+=
022/1
1ak
=τ
Slope = - k1
Slope = k2
1st order
2nd order
DiagnosticPlots .
ln a(t) 1/a(t)τ1/2
a0t t

n th order kinetics: equal reactantconcentrations. PnA k→
1
1−naseparate variables
integrate
00 aat
kadtda n
==
=−( ) 1
01
111−− +−= nn a
ktna
( )knslope 1−=1≠n
n = 0, 2,3,….. rate constant kobtained from slope t
Half life
( ) 10
1
2/1 112
−
−
−−
= n
n
kanτ
↑↑<
↑↓>
∝ −
02/1
02/1
102/1
1
1
aasn
aasn
a n
τ
τ
τ
( ) ( ) 0
1
2/1 ln11
12lnln ankn
n
−−
−−
=−
τ2/1lnτ
( )1−−= nslope
reaction order n determinedfrom slope
0ln a

Summary of kinetic results. PnA k→2
0
02/1
0
aat
aat
==
==
τ
Rate equation
ReactionOrder dt
daR −=Integratedexpression
Units of k Half lifeτ1/2
0 k ( ) 0aktta +−= mol dm-3s-1
ka2
0
1 ka( ) ktta
a=
0ln s-1
k2ln
2 2ka ( ) 0
11a
ktta
+= dm3mol-1s-1
0
1ka
3 3ka ( ) 20
2121
akt
ta+= dm6mol-2s-1
202
3ka
n nka ( ) 10
1
111−− +−= nn a
ktna
−
− −
−
10
1 121
1n
n
kan

Problem Examples:
1. A first order reaction is 40% complete at the end of 1 h. What is the value of the rate constant? In how long willl the reaction be 80 % complete ?
3. Derive the rate equation for reaction whose orders are: (a). one-half, (b). three and a-half, (c). 4, and (d). n !
2. The half-life of the radioactive disintegration of radium is 1590 years. Calculate the decay constant. In how many years will three-quarters of the radium have undergone decay ?

Chemical Kinetics
Lecture 2.Kinetics of more complex
reactions.
Jaslin Ikhsan, Ph.D.Kimia FMIPA
Universitas Negeri Jogjakarta

Tujuan Perkuliahan:1. Menurunkan Rate Law dari Kinetika Reaksi yang lebih Kompleks,2. Menjelaskan Consecutive Reactions: a. Rate Determining Steps, b. Steady State Approximation.
Reference:1. P.W. Atkins, Physical Chemistry, 5th ed,
Oxford: 19942. Ira N. Levine, Physical Chemistry

PBA k→+Second order kinetics:Unequal reactant concentrations.
rate equation
kabdtdp
dtdb
dtdaR ==−=−=
initial conditions
00000 babbaat ≠===
dm3mol-1s-1
integrate usingpartial fractions slope = k( )baF ,
( ) ktaabb
abbaF =
−
=0
0
00
ln1,t

Consecutive Reactions . PXA kk →→ 21
•Mother / daughter radioactivedecay. Mass balance requirement:
142
131
214214218
106105 −−−− ×=×=
→→
skskBiPbPo
xaap −−= 0
The solutions to the coupledequations are :3 coupled LDE’s define system :
[ ]
[ ] [ ]{ }
[ ] [ ] [ ]{ }tktkkk
aktkaatp
tktkkk
aktx
tkata
2112
01100
2112
01
10
expexpexp)(
expexp)(
exp)(
−−−−
−−−=
−−−−
=
−=
xkdtdp
xkakdtdx
akdtda
2
21
1
=
−=
−=
We get different kinetic behaviour dependingon the ratio of the rate constants k1 and k2

Consecutive reaction : Case I.Intermediate formation fast, intermediate decomposition slow.
12
1
2 1
kkkk
<<
<<=κCase I .TS II
TS I
PXA kk →→ 21
∆GI‡ ∆GII
‡
ener
gyI : fast II : slow
rds
∆GI‡ << ∆GII
‡A
XP
reaction co-ordinateStep II is rate determiningsince it has the highestactivation energy barrier. The reactant species A will be
more reactive than the intermediate X.

0
0
0
apw
axv
aau
=
=
=
Initial reactant A morereactive than intermediate X .
τ = k1t
0 2 4 6 8 10
Nor
mal
ised
con
cent
ratio
n
0.0
0.2
0.4
0.6
0.8
1.0
1.2
u = a/a0
v = x/a0
w = p/a0
κ = k2/ k
1 = 0.1
Reactant AProduct P
Intermediate X
PXA kk →→ 21 12
1
2 1
kkkk
<<
<<=κ
Concentration of intermediatesignificant over time course ofreaction.
Case I .

Consecutive reactions Case II:Intermediate formation slow, intermediate decomposition fast.
1
2
kk
=κ
PXA kk →→ 21
key parameterCase II .Case II .12
1
2 1
kkkk
>>
>>=κ
Intermediate X fairly reactive.[X] will be small at all times.
ener
gy
TS I
AX
P
TS II
reaction co-ordinate
∆GI‡
∆GII‡
PXA kk →→ 21
I : slow rds II : fast
∆GI‡ >> ∆GII
‡
Step I rate determiningsince it has the highestactivation energy barrier.

PXA kk →→ 21
τ = k1t
0 2 4 6 8 10no
rmal
ised
con
cent
ratio
n0.0
0.2
0.4
0.6
0.8
1.0
1.2
u=a/a0
v=x/a0
w=p/a0
κ = k2/k1 = 10Reactant A
Product P
Intermediate X
τ = k1t
0.0 0.2 0.4 0.6 0.8 1.0
norm
alis
ed c
once
ntra
tion
0.0
0.2
0.4
0.6
0.8
1.0
1.2
u=a/a0
v=x/a0
w=p/a0
A P
X
Intermediate concentrationis approximately constantafter initial induction period.
12
1
2 1
kkkk
>>
>>=κCase II .Case II .
Intermediate Xis fairly reactive.Concentration ofintermediate Xwill be small atall times.

Rate Determining Step21 kk >>
PXA kk →→ 21
Fast Slow
• Reactant A decays rapidly, concentration of intermediate species Xis high for much of the reaction and product P concentration risesgradually since X--> P transformation is slow .
12 kk >>
PXA kk →→ 21
Slow Fast
Rate Determining Step
• Reactant A decays slowly, concentration of intermediate species Xwill be low for the duration of the reaction and to a good approximationthe net rate of change of intermediate concentration with time is zero. Hence the intermediate will be formed as quickly as it is removed.This is the quasi steady state approximation (QSSA).

Parallel reaction mechanism.
YAXA
k
k
→
→2
1
• We consider the kinetic analysis of a concurrent or parallel reaction scheme which is often met in real situations. • A single reactant species can form twodistinct products.We assume that each reaction exhibits 1st orderkinetics.
k1, k2 = 1st order rate constants
We can also obtain expressionsfor the product concentrationsx(t) and y(t).
( )[ ]
( )[ ]
( )[ ]{ }tkkkk
aktx
dttkkaktx
tkkakakdtdx
t
2121
01
0 2101
21011
exp1)(
exp)(
exp
+−−+
=
+−=
+−==
∫• Initial condition : t= 0, a = a0 ; x = 0, y = 0 .• Rate equation:
( ) akakkakakdtdaR Σ=+=+=−= 2121
[ ] ( )[ ]tkkatkata 2100 expexp)( +−=−= Σ
( )[ ]
( )[ ]
( )[ ]{ }tkkkk
akty
dttkkakty
tkkakakdtdy
t
2121
02
0 2102
21022
exp1)(
exp)(
exp
+−−+
=
+−=
+−==
∫
212/1
2ln2lnkkk +
==Σ
τ• Half life:
2
1
)()(
kk
tytxLim
t=
∞→
Final product analysisyields rate constant ratio.
• All of this is just an extension of simple1st order kinetics.

Parallel Mechanism: k1 >> k2
τ = k1t0 1 2 3 4 5 6
norm
alis
ed c
once
ntra
tion
0.0
0.2
0.4
0.6
0.8
1.0
u(τ)v(τ)w(τ)
κ = k2//k1
a(t)x(t)
y(t)
1.0=κ( ) 9079.0=∞v
( ) 0908.0=∞w
( )( ) 9989.9
0908.09079.0
=≅∞∞
wv( )
)(10
1.0
2
1
1
2
∞∞
==
==
wv
kk
kkκ Computation
Theory

Parallel Mechanism: k2 >> k1
τ = k1t
0 1 2 3 4 5 6
norm
alis
ed c
once
ntra
tion
0.0
0.2
0.4
0.6
0.8
1.0
u(τ)v(τ)w(τ)
a(t)
x(t)
y(t)10=κ
0909.0)( ≅∞v
9091.0)( ≅∞w
( ))(
1.0
10
2
1
1
2
∞∞
==
==
wv
kk
kkκ
( )( ) 0999.0
9091.00909.0
=≅∞∞
wv
Computation
Theory

Reaching Equilibrium on the Macroscopic and Molecular Level
N2O4NO2
N2O4 (g) 2 NO2 (g)
colourless brown
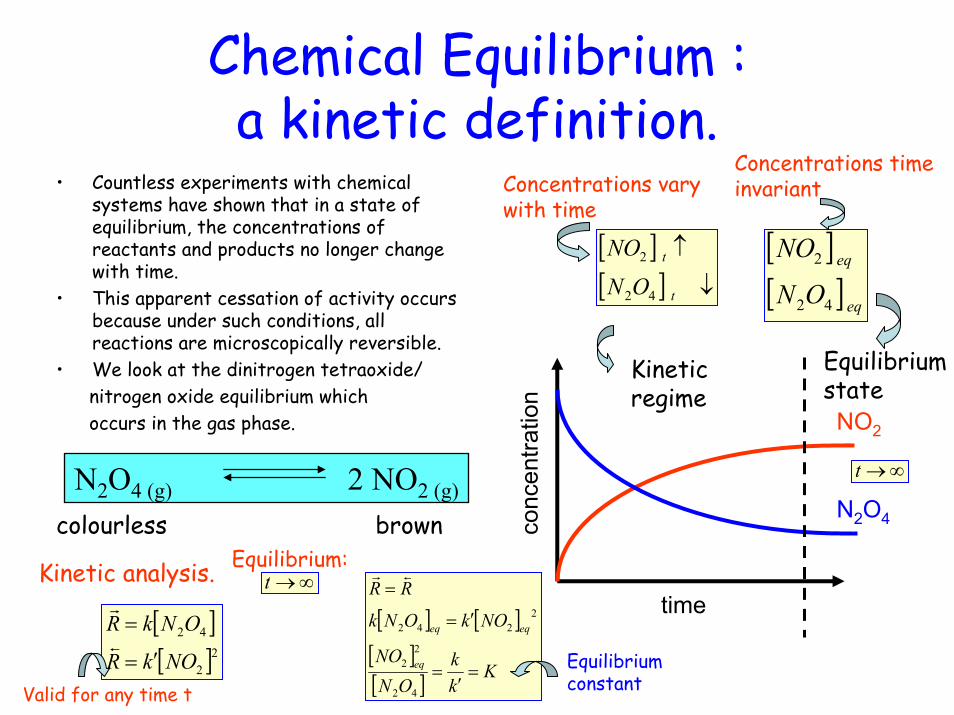
Chemical Equilibrium :a kinetic definition.
• Countless experiments with chemical systems have shown that in a state of equilibrium, the concentrations of reactants and products no longer change with time.
• This apparent cessation of activity occurs because under such conditions, all reactions are microscopically reversible.
• We look at the dinitrogen tetraoxide/nitrogen oxide equilibrium whichoccurs in the gas phase.
[ ][ ] ↓
↑
t
t
ON
NO
42
2
Equilibriumstate
Kineticregime
NO2
N2O4conc
entra
tion
N2O4 (g) 2 NO2 (g)
colourless brown
[ ][ ] eq
eq
ON
NO
42
2
Concentrations varywith time
Concentrations timeinvariant
Kinetic analysis.
[ ][ ]2
2
42
NOkR
ONkR
′=
=s
r
Equilibrium:
[ ] [ ][ ][ ] K
kk
ONNO
NOkONk
RR
eq
eqeq
=′
=
′=
=
42
22
2242
sr∞→t
∞→t
time
EquilibriumconstantValid for any time t

A Bk
k'First order reversible reactions : understanding the approach to chemical equilibrium.
Rate equation
bkkadtda ′+−= 010
1===
=+vu
vuτ
Rate equation in normalised formInitial condition
00 0 === baatθτ +
=+1
1uddu
Mass balance conditionSolution produces the concentration expressions
0abat =+∀ ( ) [ ]{ }
( ) [ ]{ }τθ
θτ
τθθ
τ
−−+
=
−++
=
exp11
exp11
1
v
u
Introduce normalised variables.
( )kktkk
abv
aau
′=′+=== θτ
00 ( ) ( )( )
[ ][ ]
−+−−
==τθ
τθτττ
exp1exp1
uvQ
Reaction quotient Q

First order reversible reactions: approach to equilibrium.
τ = (k+k')t
0 2 4 6 8
conc
entra
tion
0.0
0.2
0.4
0.6
0.8
1.0
u (τ)v (τ)
Equilibrium
Kineticregime
Reactant A
Product B
( )( )( )∞∞
=
∞→=
uvQK τ

τ = (k+k')t
0 2 4 6 8
Q(τ
)
0
2
4
6
8
10
12
10=θEquilibriumQ = K = θ
Understanding the difference between reaction quotient Q and Equilibrium constant K.
Approach toEquilibriumQ < θ
( )( )∞∞
=uvK( ) ( )
( )[ ][ ]
−+−−
==τθ
τθτττ
exp1exp1
uvQ
kkKQt′
==→∞→ θ

C
H
H
C
H
X
C
H
H
C
H
X n
Chemical Kinetics.
Lecture 3/4.Application of the Steady State Approximation: Macromolecules
and Enzymes.

• Detailed mathematical analysis of complex reaction mechanisms is difficult.Some useful methods for solving sets of coupled linear differential rate equations include matrix methods and Laplace Transforms.
• In many cases utilisation of the quasi steady state approximationleads to a considerable simplification in the kinetic analysis.
Quasi-Steady State Approximation.QSSA
PXA kk →→ 21
Consecutive reactions k1 = 0.1 k2 .
τ = k1t0.0 0.5 1.0
Nor
mal
ised
con
cent
ratio
n0.0
0.5
1.0
u(τ)
v(τ)
w(τ)
intermediate X
inductionperiod
A P
concentrationapprox. constant
The QSSA assumes that after an initial induction period (during which the concentration x of intermediates X risefrom zero), and during the major part
of the reaction, the rate of change of concentrations of all reaction intermediates are negligibly small.
Mathematically , QSSA implies
removalXformationX
removalXformationX
RR
RRdtdx
=
≅−= 0

Consecutive reaction mechanisms.
A X Pk1
k-1
k2 Step I is reversible, step II isIrreversible.
Coupled LDE’s can be solved via LaplaceTransform or other methods.
( )
vddw
vuddv
vuddu
φτ
φκτ
κτ
=
+−=
+−=Rate equations
( ) ( ) [ ] ( ) [ ]{ }
( ) [ ] [ ]{ }
( ) [ ] [ ]{ }τβαταβαβ
τ
τβτααβ
τ
τββφκτααφκαβ
τ
−−−−
−=
−−−−
=
−−+−−−+−
=
expexp11
expexp1
expexp1
w
v
u
tkkk
kk
wvuwvu
apw
axv
aau
11
2
1
1
000
0101
===
=====++∀
===
− τφκ
ττ
Note that α and β are composite quantities containingthe individual rate constants.
φκβαφαβ
++=+=
1Definition of normalised variablesand initial condition.

QSSA assumes that
0≅τd
dv
( )
φκ
φκ
+≅
=+−
ssss
ssss
uv
vu 0
+
−≅
+−=
τφκ
φ
φκφ
τ
expss
ssss
u
ud
du
φκ
τφκ
φ
+
+
−≅
exp
ssv
+
−−=
+
−+
≅
+
−+
=≅
∫
τφκ
φ
ττφκ
φφκ
φ
τφκ
φφκ
φφτ
τ
exp1
exp
exp
0
dw
vd
dw
ss
ssss
Using the QSSA we can develop moresimple rate equations which may beintegrated to produce approximateexpressions for the pertinent concentrationprofiles as a function of time.The QSSA will only hold provided that:
• the concentration of intermediate is smalland effectively constant,
and so :
• the net rate of change in intermediateconcentration wrt time can be set equal tozero.

log τ
0.01 0.1 1 10 100
norm
alis
ed c
once
ntra
tion
0.0
0.2
0.4
0.6
0.8
1.0
1.2
u(τ)v(τ)w(τ)
log τ
0.01 0.1 1 10 100
norm
alis
ed c
once
ntra
tion
0.0
0.2
0.4
0.6
0.8
1.0
1.2
uss(τ)
vss(τ)wss(τ)
A
X
P
A
X
P
A X Pk1
k-1
k2
Concentration versus log time curvesfor reactant A, intermediate X andproduct P when full set of coupledrate equations are solved withoutany approximation.k-1 >> k1, k2>>k1 and k-1 = k2 = 50.The concentration of intermediate X isvery small and approximately constantthroughout the time course of theexperiment.
Concentration versus log time curvesfor reactant A, intermediate X, andproduct P when the rate equationsare solved using the QSSA.Values used for the rate constantsare the same as those used above.QSSA reproduces the concentrationprofiles well and is valid.
QSSA will hold when concentrationof intermediate is small and constant.Hence the rate constants for gettingrid of the intermediate (k-1 and k2)must be much larger than that forintermediate generation (k1).

log τ
0.01 0.1 1 10 100
norm
alis
ed c
once
ntra
tion
0.0
0.2
0.4
0.6
0.8
1.0
1.2u(τ)v(τ)w(τ)
log τ
0.01 0.1 1 10 100
norm
alis
ed c
once
ntra
tion
0.0
0.2
0.4
0.6
0.8
1.0
1.2
uss(τ)
vss(τ)wss(τ)
A
P
X
A
P
X
A X Pk1
k-1
k2
Concentration versus log time curvesfor reactant A, intermediate X andproduct P when full set of coupledrate equations are solved withoutany approximation.k-1 << k1, k2,,k1 and k-1 = k2 = 0.1The concentration of intermediate ishigh and it is present throughout muchof the duration of the experiment.
Concentration versus log time curvesfor reactant A, intermediate X andproduct P when the Coupled rate equations are solved usingthe quasi steady state approximation.The same values for the rate constantswere adopted as above.The QSSA is not good in predictinghow the intermediate concentrationvaries with time, and so it does notapply under the condition where theconcentration of intermediate will behigh and the intermediate is long lived.

Macromolecule Formation : Polymerization.
Polymerization of vinyl halidesoccurs via a chain growth additionpolymerization mechanism.C
H
H
C
H
X
C
H
H
C
H
X n
3 step process :• initiation• propagation• termination
monomervinyl halideX = Cl, vinyl chloride
polymerpoly(vinyl chloride)
Polymer = large molar mass molecule(Macromolecule).
Chain initiation : highly reactive transient molecules or active centers (suchas free radicals formed.Chain propagation : addition of monomer molecules to active chain endaccompanied by regeneration of terminal active site.Chain termination : reaction in which active chain centers are destroyed.
We focus on radical addition polymerization . Kinetics of polymerization quantified via QSSA .

Free Radical Addition Polymerization.
Initiation. reactive freeradicals generated
ki = initiation rateconstantkp = propagationrate constantkT = kTC + kTD= termination rateconstant
⋅→+⋅⋅→
1
2MMR
RI ikinitiatorspecies active monomer
not kineticallysignificant
⋅→+⋅
⋅→+⋅
++
+
21
1
jk
j
jk
j
MMM
MMMp
p
Termination
mnk
mn
mnk
mn
PPMM
PMMTD
TC
+→⋅+⋅
→⋅+⋅ +termination via combination
termination via disproportionation
macroradical monomer
Propagation .assume that kp is independentof chain length

Free Radical Addition Polymerization.Analysis of the steady state kinetics.
Propagating macroradicalconcentration will be smallsince they are very reactiveso QSSA can be applied.polymerization rate = rate of chain propagation
0≅dtdx
removalxformationx
removalxformationx
rr
rrdtdx
=
≅−= 0
macroradicalconcentrationmxkr
dtdmR PPP ==−=
monomer concentrationbimolecular propagationrate constant
initiation rate ri
Ti rr =
22 xkr TT =
ri can be left unspecifieddepends on initiationmechanism
mkrk
mxkrR
T
iP
PPP2/1
2
=
==
termination rate rT
2 macroradicalsdisappear for eachincidence of termination
22 xkr Ti =
T
i
krx
2=

Application of QSSA. Kinetics of enzyme reactions.
Enzymes are very specific biological catalysts.A catalyst is a substance that increases the rate of a reaction without itself being consumed by the process.
• A catalyst lowers the Gibbs energy of activation ∆G ‡ by providing a differentmechanistic pathway by which the reaction may proceed. This alternative mechanisticpath enhances the rate of both the forward and reverse directions of the reaction.• The catalyst forms an intermediate with the reactants in the initial step of the reaction( a binding reaction), and is released during the product forming step.• Regardless of the mechanism and reaction energetics a catalyst does not effect ∆H or∆G of the reactants and products. Hence catalysts increase the rate of approach to equilibrium, but cannot alter the value of the thermodynamic equilibrium constant.
∆H
EA loweredA reactant molecule acted uponby an enzyme is termed a substrate.The region of the enzyme where thesubstrate reacts is called the activesite. Enzyme specificity depends onthe geometry of the active site and thespatial constraints imposed on this regionby the overall structure of the enzymemolecule.
catalyst absent
ener
gy ∆EA
catalyst presentreactants
products
thermodynamicsunchanged
reaction coordinate

O
CH2OHH
OHOHH
H
OH
HH
+ ATPO
CH2OPO32-
H
OHOHH
OH
OH
H
HH
+ ADP + H+
hexokinasehexokinase
glucose
hexokinase
glucose
Space filling models ofthe two conformations ofthe enzyme hexokinase.(a) the active site is notoccupied. There is a cleft in the protein structure that allowsthe substrate molecule glucoseto access the active site.(b) the active site is occupied. The protein has closed aroundthe substrate.
glucose glucose 6- phosphate
Enzyme lock/key mechanism :natural molecular recognition.

binding pocket
substrate
Chymotrypsin :A digestiveenzyme .
active site
Naturalmolecularrecognition inaction.

Mechanism of enzyme action.

Classification of enzymes.

Michaelis-Menten kinetics.S + E ES E + P
KM kc
u=c/KM
0 10 20 30 40 50
Ψ=R
Σ/k ce
Σ
0.0
0.2
0.4
0.6
0.8
1.0
1.2
uu
keR
cKcekR
c
M
c
+==Ψ
+=
Σ
Σ
ΣΣ
1
ceKkR
uKc
u
M
c
M
ΣΣ ≅
≅Ψ<<<<1
1st order kinetics
ΣΣ ≅>>>>≅Ψ
ekRKc
u
c
M
11
zero orderkinetics
KM = Michaelis constant (mol dm-3)kc = catalytic rate constant (s-1)c = substrate concentration (mol dm-3)eΣ = total enzyme concentration (mol dm-3).
Ψ
u
Ψ
This is an example of a complexrate equation, where the reactionrate varies with reactant concentrationin a non linear way.
Michaelis-Menten rateequation.
ES complex decompositionto form products
substratebinding enzyme/substrate
complex
u

Experimental rate equation : Rsb
asdtds
+=−=Σ
substrateconcentration
a, b = constants Proposed mechanism shouldproduce this rate law.Mechanism :
E + S ES EP E + P
enzymesubstrate
productenzyme/substratecomplex
enzyme/productcomplex Rate equations
We analyse a simpler scheme which includes all the essentials.
( )
pekxkdtdp
peksekxkkdtdx
xksekdtds
22
2112
11
−
−−
−
−=
−−+=−
−=−p = [P]s = [S]
E + S ES E + Pk1
k-1
k2
k-2
e = [E]free x = [ES]

What forms does the enzyme take?• free enzyme E• bound enzyme ES
exe +=Σ
Usually eΣ << s . Subsequent to mixing one has aninitial period during which x = [ES] builds up. We then assume that the equilibrium concentration of ESis rapidly attained and reaches a constant low valueduring the course of the reaction.This requirement satisfies the QSSA.
total initialenzyme concentration QSSA
{ } 0212211 ≅−−+++= Σ−Σ−− peksekxpkkkskdtdx
SS
( )2121
21
kkpkskepkskxSS +++
+=
−−
Σ− { }2121
2121
kkpkskepkkskk
dtdsR
+++−
=−=−−
Σ−−Σ
Let’s assume that measurement of the reaction rate occurs during a time period when only a small percentage (1-3%) of substrate is transformed to product.
0
0ss
p≅≅
initial substrateconcentration

This has the same formas the empirical rateequation observedexperimentally.
01
21
02
0121
0210,
sk
kksek
skkksekkRR
++
=++
≅≅−
Σ
−
ΣΣΣ
initial rateMichaelisconstant
Fundamental kineticparameters : KM andkC .
mol dm-3
0
00, sK
sekRM
C
+= Σ
Σ
2
1
21
kkk
kkK
C
M
=
+= −
catalytic rateconstant
KM : enzyme/substratebindingkC : decomposition ofenzyme/substrate complex.
Michaelis-Menten (MM)equation for steadystate enzyme kinetics.s-1
How can we evaluate KM and kC?
• Non linear least squares fitting to MM equation.• Suitable linearization of MM equation.
ΣΣΣ
+=eksek
KR CC
M 111
00,
SLB
0,
1
ΣRΣ
=ek
KSC
MLB
0
1s
Σ
=ek
IC
LB1ILB
Lineweaver-BurkPlot.
Lineweaver-BurkPlot.

CC
M
kskK
k11
0
+=Σ
unsaturatedenzyme kinetics
saturatedenzymekinetics
0
00, sK
sekekdtdpR
M
C
+=== Σ
ΣΣΣ0
0
sKskk
M
C
+=Σ
composite rateconstant
We consider two limiting behaviours.• s0 << KM unsaturated enzyme kinetics ; not all active sites bound with substrate• s0 >> KM saturated enzyme kinetics ; all active sites bound with substrate.
Case USCase US
0
0
0
0
1
1
1
sKkk
skK
k
kskKKs
M
C
C
M
CC
M
M
≅
≅
>>
<<
Σ
Σ
( )θ+
=+
=+
==
−
−
− 1121
1
2
211
21
21 kK
kk
kkkkk
kkKkk
M
CU
1
2
1
11
−
−
=
=
kkkkK
θ
equilibrium constantfor ES formation We consider two
sub cases dependingon the value of θ .

1112
121
1
21
kKkkkkKk
kk
U ==
≅
=≅+
−−
−
θθ When k2 >>k-1 , ES complexdecomposition to formproducts is faster than ESdecomposition back toreactants. The rds willinvolve the rate of ombinationof E and S to form the EScomplex. The ES complex will be short lived since itdoes not accumulate to formproducts.
θ >> 1 scenario.
E + S
ES
E + P
k-1
k1
RDSk2
RDS
k-1 k2
k1
θ << 1 scenario. ESHave a fast pre-equilibriumfollowed by a slow rate determiningdecomposition of the ES complexto form products.
E + SE + P
21
11kKkU ≅
≅+θ

Saturated enzyme kinetics : all active sites in enzyme bound with substrate.Have slow rate determining breakdown ofES complex to form products.
Case S
2
0
0
0
11
1
1
kkkkk
kskKKs
Ks
C
C
CC
M
M
M
=≅
≅
<<
>>
>>
Σ
Σ
The detailed form of KM and kC in terms of fundamental rate constants will depend on the nature of the mechanism.
E + S ES EP E + Pk1
k-1
k2
k-2
k3
k-3
CC
M
kskK
Re 11
00,
+=Σ
ΣLB inverse plot will always pertain.
Pre equilibrium
321211
111kKKkKkk
K
C
M ++=Case S Pre equilibrium
Case US
3232
1111kKkkkC
++=Slow ratedeterminingEP complexdecomposition.
ES complex formation rds
Slow ratedeterminingES->EPtransformation

adsorbedproducts
gas phaseproducts
ener
gy
gas phasepathway
EG
gas phasereactants
adsorbedreactants
EA
ED
ES
Ej = activationenergy for step j.
G : gas phase reactionA : adsorptionS : surface reactionD : desorption
surfacecatalysedpathway Reaction intermediates stabilized via bonding
to catalytic surface sites.


The Metal-Catalyzed Hydrogenation of Ethylene H2C CH2 (g) + H2(g) H3C CH3 (g)
•adsH
reaction betweenadsorbed species
adsCHCH 32 −•
•adsH
•adsH
adsHC 42
dissociativeadsorption
surface migration

Adsorption. Term used to describe the process whereby a molecule (theadsorbate) forms a bond to a solid surface (an adsorbent).
number of sites occupied by adsorbate
Σ
=NNSθFractional surface coverage θ
total number of adsorption sitesWhen θ = 1, NS = NΣ and anadsorbed monolayer is formed.The fractional coverage θ depends on pressure of adsorbing gas phase species.This θ = θ (p) relationship is called an adsorptionisotherm.
A (g)
Aads
dynamicequilibrium
surface
Langmuir Adsorption Isotherm.Langmuir Adsorption Isotherm.Simple approach to quantitatively describe an adsorptionprocess at the gas/solid interface.
Assumptions :• solid surface is homogeneous and contains a number of equivalent sites, eachof which is occupied by a single adsorbate molecule• a dynamic equilibrium exists between gas phase reactant and adsorbed species• no interactions between adsorbed species• adsorbed species localised, ∆ Hads is independent of coverage θ

associative adsorptionadsorption rate constant
A (g) + S Aads
kA
kD
A2 (g) + S 2 AadskA
kD
desorption rate constantK measures affinityof a particularmolecule for anadsorption site.D
A
kkK =
dissociative adsorptionsurface adsorption site
( ) θθ DA kpk =−1At equilibrium : RA = RDRate of adsorption :
Langmuir adsorptionisotherm :associative adsorption.
( )θ−= 1pkR AA
fractional coverageof vacant sites
pressure KpKp+
=1
θ
Rate of desorption :
θDD kR = fractional surface coverage Kp111
+=θ
θ1
1
slope = 1/K
p1

A similar analysis can be done for dissociative adsorption.
( )2
21
θ
θ
DD
AA
kR
pkR
=
−=
At equilibrium :
( ) 221 θθ DA
DA
kpk
RR
=−
=
Desorptionrate
Adsorptionrate
Adsorption isothermfor dissociativeadsorption.
( )
KpKp
Kppkk
D
A
+=
==−
1
1 2
2
θ
θθ
Kp111
+=θ
p1K
S 1=
θ1

P/atm0.0 0.5 1.0 1.5 2.0
Sur
face
cov
erag
e θ
0.0
0.2
0.4
0.6
0.8
1.0
K = 10K = 1K = 0.1
11
1
→≅+
>>
θKpKp
Kphigh plimit :monolayerformed
KpKp
Kp
≅≅+
<<
θ11
1
KpKp+
=1
θ
Langmuir Adsorption Isotherm.
K large
K smallLow p limit :Henry Law

Kinetics of surface reactions.
Assume that gaseous reactant decomposes when it is adsorbed.
θkR =Surface coverage of adsorbed gasReaction
rateSurface coveragerelated to gaspressure p viaLangmuir adsorptionisotherm
KpKp+
=1
θ
KpkKpR+
=1
We can consider two limits.Low pressures.High pressures.
Rate dependslinearly on gasPressure pFirst order kinetics.Adsorption processis rate determiningwhen p is low. Decomposition is fast.
1<<Kp
kKpR ≅
Rate independent ofGas pressure pZero order kinetics.
1>>Kp
kR ≅ Adsorption rate verylarge when p is high.Decomposition step rds.

A(g)
Adsorption of a gas on a solid isan exothermic process : ∆ Hads isnegative.Both adsorption and desorptionprocesses follow the Arrheniusequation.
−=
−=
RTEAk
RTEAk
DDD
AAA
exp
exp
adsorption pre-exponential factor
activation energy foradsorption
EA ED
∆Hads
Aads
activation energy fordesorption
DAads
ads
D
A
D
A
EEHRTH
AA
kkK
−=∆
∆−== exptemperature (K)
desorption pre-exponential factor
R = gas constant = 8.314 J mol-1 K-1

How is ∆Hads measured ?
000 ln adsadsads STHKRTG ∆−∆=−=∆
Gibbs energy of adsorption entalphy of adsorption2
0
00
ln
ln
RTH
TK
RS
RTHK
ads
adsads
∆=
∂∂
∆+
∆−=
θ
θθ
θθ
θθ
θθ
∂∂
−=
∂∂
=
∂∂
+
∂∂
−=+
−=
TK
Tp
Tp
TK
pK
Kp
lnln
0lnln1
lnlnln
1
Langmuir adsorption assumed
p0 1 2
θ
0.0
0.5
1.0
−∆
=
∆−=
∂∂
21
0
2
1
2
0
11ln
ln
TTRH
pp
RTH
Tp
ads
ads
θ
θ
T2
T1
p1p2
entropy of adsorption
constant surface coverage
constant surface coverage
p1, p2, T1 and T2 canbe measured so∆Hads can be determined.

Chemical Kinetics.
Lectures 5-6.Microscopic theory of chemical
reaction kinetics.

Temperature effects in chemical kinetics.
• Chemical reactions are activated processes : they require an energy input in order to occur.
• Many chemical reactions are activated via thermal means.• The relationship between rate constant k and temperature T is
given by the empirical Arrhenius equation.• The activation energy EA is determined from experiment, by
measuring the rate constant k at a number of different temperatures. The Arrhenius equationis used to construct an Arrhenius plotof ln k versus 1/T. The activation energyis determined from the slope of this plot.
−=
RTEAk Aexp
Pre-exponentialfactor
( )
=
−=
dTkdRT
TdkdREA
ln/1
ln 2
kln
T1
RESlope A−=

Microscopic theories of chemical reaction kinetics.
• A basic aim is to calculate the rate constant for a chemical reaction from first principles using fundamental physics.
• Any microscopic level theory of chemical reaction kinetics must result in the derivation of an expression for the rate constant that is consistent with the empirical Arrhenius equation.
• A microscopic model should furthermore provide a reasonable interpretation of the pre-exponential factor A and the activation energy EAin the Arrhenius equation.
• We will examine two microscopic models for chemical reactions :– The collision theory.– The activated complex theory.
• The main emphasis will be on gas phase bimolecular reactions since reactions in the gas phase are the most simple reaction types.

References for Microscopic Theory of Reaction Rates.
• Collision Theory.– Atkins, de Paula, Physical Chemistry 7th
edition, Chapter 27, Section. 27.1, pp.944-951.
• Activated Complex Theory.– Atkins, de Paula, Physical Chemistry 7th
edition, Chapter 27, Section.27.4-27.5, pp. 956-961.

Collision theory of bimolecular gas phase reactions.
• We focus attention on gas phase reactions and assume that chemical reactivity is due to collisions between molecules.
• The theoretical approach is based on the kinetic theory of gases.• Molecules are assumed to be hard structureless spheres. Hence themodel neglects the discrete chemical structure of an individualmolecule. This assumption is unrealistic.
• We also assume that no interaction between molecules until contact.• Molecular spheres maintain size and shape on collision. Hence thecentres cannot come closer than a distance δ given by the sum ofthe molecular radii.
• The reaction rate will depend on two factors :
• the number of collisions per unit time (the collision frequency)• the fraction of collisions having an energy greater than a certain
threshold energy E*.

Simple collision theory : quantitative aspects.
Products)()( →+ kgBgA
Hard sphere reactantsMolecular structure anddetails of internal motionsuch as vibrations and rotationsignored.
Two basic requirements dictate a collision event.
• One must have an A,B encounter over a sufficiently short distance to allowreaction to occur.
• Colliding molecules must have sufficient energy of the correct type to overcome the energy barrier for reaction. A threshold energy E* is required.
Two basic quantities are evaluated using the Kinetic Theory of gases : the collision frequency and the fraction of collisions that activate moleculesfor reaction.To evaluate the collision frequency we need a mathematical way to definewhether or not a collision occurs.

Ar
Brδ
Area = σ
A
B
The collision cross section σdefines when a collision occurs.
( )22BA rr +== ππδσ
Effective collisiondiameter
BA rr +=δ
The collision cross section for two molecules can be regarded to be the area within which the center of theprojectile molecule A must enter around the target molecule Bin order for a collision to occur.

A
BA rr +=δ
B
δ≤b
δ>b
δ>b
δ≤b
δ≤b
Cross sectionalArea of disc
2δπσ =
Criterion forSuccessful collision
Collisionpossible
Collisionimpossible δ>b

−
Tkmv
B2exp
2
v
• The velocity distribution curvehas a very characteristic shape.
• A small fraction of moleculesmove with very low speeds, asmall fraction move with very high speeds, and the vast majorityof molecules move at intermediatespeeds.
• The bell shaped curve is called aGaussian curve and the molecularspeeds in an ideal gas sample areGaussian distributed.
• The shape of the Gaussian distribution curve changes as the temperature is raised.
• The maximum of the curve shifts tohigher speeds with increasing temperature, and the curve becomesbroader as the temperatureincreases.
• A greater proportion of thegas molecules have high speeds at high temperature than at low temperature.
Maxwell-Boltzmann velocity
Distribution function
=Tk
mvvFB2
4)(2/3
2
ππ
)(vF
Gas molecules exhibita spread or distributionof speeds.

The collision frequency is computed via the kineticTheory of gases.We define a collision number (units: m-3s-1) ZAB.
Mean relative velocityUnits: m2s-1rBAAB vnnZ 2δπ=
BA rr +=δnj = number density of molecule j (units : m-3)
Mean relative velocity evaluated via kinetic theory.
Average velocity of a gas moleculeMB distribution of velocitiesenables us to statistically estimate the spread ofmolecular velocities in a gas
( )
−
=
= ∫∞
Tkmv
TkmvvF
dvvFvv
BB 2exp
24)(
22/32
0
ππ
Maxwell-Boltzmann velocityDistribution function
Some maths !
mTkv B
π8
= Mass ofmolecule

We now relate the average velocity to the meanrelative velocity.If A and B are different molecules then 22
BAr vvv +=
j
Bj m
Tkvπ8
=
µπTkv B
r8
=Hence the collision numberbetween unlike moleculescan be evaluated.
BA
BA
mmmm
+=µReduced mass
rBAAB vnnZ 2δπ=
For collisions between like molecules vvr 2=The number of collisions per unittime between a single A molecule and other Amolecules
2/182
=A
BAA m
TknZπ
σBA
BBAAB
nZn
TknnZ
=
=2/1
8µπ
σ
Total number of collisionsbetween like molecules
2/12 8
22
2
==A
BA
AAAA m
TknnZZπ
σWe divide by 2 to ensureThat each A,A encounterIs not counted twice.
Collision frequencyfactor

*E
Molecular collision iseffective only iftranslational energyof reactants is greater than somethreshold value.
Fraction of moleculeswith kinetic energy greater Than some minimum Thresholdvalue ε*
( )
−=>
TkF
B
*exp* εεε


• The simple collision theory expression for the reaction rate R between unlikemolecules
−=−=
TknZn
dtdnR
BBA
A *exp ε2/1
8
=µπ
σ TkZ B
• The more usual rate expression for abimolecular reaction between A and B is kab
dtdaR =−=
• We introduce molar variables
dtdaN
dtdn
Nnb
Nna
NE
AA
A
B
A
A
A
=
==
= ** ε • Hence the SCT rate expression becomes
−=−=
RTEabZN
dtdaR A
*expAvogadro constant
• The bimolecular rate constant forcollisions between unlike molecules is given by
−=
−
=
RTEz
RTETkNk
AB
BA
*exp
*exp82/1
µπσ
−=
−
=
RTEz
RTE
mTkNk
AA
BA
*exp
*exp22/1
πσ Collision
Frequencyfactor
• Similarly for bimolecular collisionsbetween like molecules
Both of theseexpressions aresimilar to the Arrhenius equation.

We compare the results of SCT with the empirical Arrhenius eqn.In order to obtain an interpretation of the activation energy andPre-exponential factor.
A,B encounters
−=
RTEAk A
obs exp
−=
−
=
RTEz
RTETkNk
AB
BA
*exp
*exp82/1
µπσ
−=
−
=
RTEz
RTE
mTkNk
AA
BA
*exp
*exp22/1
πσ
A,A encounters
mkNA
ATAzA
BA
AAobs
πσ 82''
''
=
==
• SCT predictsthat the pre-exponentialfactor should depend on temperature.
µπσ B
A
ABobs
kNA
ATAzA
8'
'
=
==Pre-exponentialfactor
SCT• The threshold energy and theactivation energy can also becompared. 2
2*lnRT
RTEdT
kd +=
2
lnRTE
dTkd A=
Arrhenius• Activation energy exhibitsa weak T dependence. 2
* RTEEA += *EEA ≅

SCT : a summary.• The major problem with SCT is that the threshold energy E* is very
difficult to evaluate from first principles.• The predictions of the collision theory can be critically evaluated by
comparing the experimental pre-exponential factor with that computed using SCT.
• We define the steric factor P as the ratio betweenthe experimental and calculated A factors.
• We can incorporate P into the SCTexpression for the rate constant.
• For many gas phase reactionsP is considerably less than unity.
• Typically SCT will predict that Acalc will be in the region 1010-1011 Lmol-1s-1 regardless of the chemical nature of the reactants and products.
• What has gone wrong? The SCT assumption of hard sphere collisionneglects the important fact that molecules possess an internal structure.It also neglects the fact that the relative orientation of the colliding molecules will be important in determining whether a collision will lead to reaction.
• We need a better theory that takes molecular structure into account. The activated complex theory does just that .
calcAAP exp=
−=
−=
RTEPzk
RTEPzk
AA
AB
*exp
*exp

−=
−=
RTEPzk
RTEPzk
AA
AB
*exp
*exp
−=
−
=
RTEz
RTETkNk
AB
BA
*exp
*exp82/1
µπσ
−=
−
=
RTEz
RTE
mTkN
AA
BA
*exp
*exp22/1
πσ
Steric factor(Orientation requirement)
Weaknesses:• No way to compute P from molecularparameters
• No way to compute E* from first principles.Theory not quantitative or predictive.Strengths:•Qualitatively consistent with observation (Arrhenius equation).• Provides plausible connection between microscopic molecular properties andmacroscopic reaction rates.
• Provides useful guide to upper limits for rateconstant k.
TransportpropertySummary of SCT. Energy criterion
A,B encounters
A,A encounters
k

[ ] CABABCBCA +→→+ *


AEsAE
r
0U∆

Activated complexTransition state
∆G*Progress of a chemical reaction can beexpressed in terms of a plot of energyversus reaction co-ordinate.The reaction coordinate may be describedin terms of changes in particular bond lengthssince these will vary as the reaction progresses.
ener
gy
productsreactants
Reaction coordinate
Activated Complexor Transition State

The transition state or activated complex is a high energyspecies of fleeting (ca fs lifetime, 1fs = 10-15s) existence. Its structurehas features both of the reactants and the products.1999 Nobel Prize in Chemistry awarded to Ahmed Zewailfrom Caltech for his studies of transition states of chemicalreactions by femtosecond spectroscopy using laser technology.Experimental study of very short timescales is calledfemtochemistry.
Transition states can have different geometries.

Basic assumption : activated complexX* is treated as a thermodynamic
quantity in thermodynamic equilibrium with the reactants.A (g) + B(g) X* Products
Kc*
ν*
Bimolecular reaction frequency of decompositionof activated complex
Reaction molecularity m : number ofmolecules which come together to formthe activated complex.m = 1 : unimolecular reactionm = 2 : bimolecular reaction .
Equilibrium constant forreactant/transition statetransformation.
∗∗= xR νabxKc
∗∗ =
abKx c∗∗ =
abKR c∗∗=ν kabR =
∗∗= cKk ν
Reaction rate R depends on the frequency ofdecomposition and concentration of activatedcomplexes. bimolecular reaction
rateconstant
This fundamental expression must now beevaluated.

*0 )( nC cKK ∆∗∗ =
1 molL-1
For an ideal gas or for reactions in solution :
thermodynamicequilibrium constant
121 −=−=∆ ∗nChange in # molesfor reactant /TStransformation
0cKKC
∗∗ =
==
∗∗∗∗
0cKKk C νν
hTkB=∗ν
h = Planck’s constant = 6.63x10⁻³⁴JskB = Boltzmann constant = 1.38x10⁻²³ JK-1
For T = 298 K
112106 −∗ ×≅ sνThis is of the correctorder of magnitude fora molecular vibrationfrequency.
Not all transition states go and formproducts.
∗
∗∗∗∗
=
==
Khc
Tk
cKKk
B
C
0
0
κ
νκνκ
κ = transmission coefficient0 < κ < 1
We assume that the TSdecomposes with a frequency given by:
k has units Lmol-1s-1

We relate K* to the Gibbs energy of activation ∆G* ∗∗−=∆ KRTG ln0
∆−=
∗∗
RTGK
0
exp
∆−
=
∗
RTG
hcTkk B
0
0 expκ
Eyring equation : fundamental ACT result. ∗∗∗∆−∆=∆ 000 STHG
∆−
∆
=
∗∗
RTH
RS
hcTkk B
00
0 expexpκ enthalpy ofactivation
entropy ofactivation
−=
RTEAk Aexp We obtain a useful
interpretation foractivation energy andpre-exponential factor.

=
dTkdRTEA
ln2
∆−
∆
=
∗∗
RTH
RS
hcTkk B
00
0 expexpκ
internal energy of activation pre-exponential factor A
−
∆+
=
∗
RTE
RS
hcTkk AB exp2exp
0
0κ∗∗∗
∗
∆+∆=∆
+∆=000
0
VPUH
RTUEA
volume of activation bimolecular gasphase reactioncondensed phases
m = 2 bimolecular reaction
( ) RTRTmRTnVPV
−=−=∆=∆
≅∆∗∗
∗
10
0
0
ideal gases reaction molecularity
mRTEH A −=∆ ∗0
m = 1, condensed phases, unimoleculargas phase reactionsm = 2, bimolecular gas phase reactions

( )
−
∆+
=
∗
− RTE
RSm
chTkk A
mB
m expexp0
10κ m = molecularity
( )
∆+
=
∗
− RSm
chTkA m
B0
10expκ
pre-exponential factor related to entropyof activation (difference in entropy betweenreactants and activated complex
∆S0* explained interms of changes in translational, rotational and vibrationaldegrees of freedom on going fromreactants to TS.
Aln
RES A−=
kln
T1
( )
∆+
==
∗
− RSm
chTkPZA m
B0
10expκ
collision theory positive1Pnegative1
01
0
0
0
∗
∗
∗
∆>
∆<
≅∆≅
SSPSP
TS less ordered thanreactants
TS more orderedthan reactants
steric factor