Keeping track 2016 export revenue from high-value … · Keeping track 2016 export revenue from...
36
www.pwc.co.nz Keeping track 2016 export revenue from high-value foods High-Value Nutrition National Science Challenge July 2017
Transcript of Keeping track 2016 export revenue from high-value … · Keeping track 2016 export revenue from...
www.pwc.co.nz
Keeping track 2016 export revenue from high-value foods
High-Value Nutrition National Science Challenge
July 2017

PwC Page i
Table of contents
Executive summary 2
Introduction 3
Method for updating the estimates 5
Interviews 7
Overseas research 9
Estimates of 2016 export revenue 13
Change in export revenue 17
Product case studies 21
Conclusion 23
References 24
Appendix A – HS codes 26
Appendix B – 2016 exports 29
Appendix C – Restrictions 35

PwC Page 2
Executive summary The Centre for High-Value Nutrition (HVN) National Science Challenge is focused on developing the science and commercial opportunities of high-value nutrition foods. The multi-year programme, funded through the Ministry of Business, Innovation and Employment, has a key performance indicator (KPI) of supporting a $1 billion increase in New Zealand exports by 2025. This report is the second annual exercise in measuring progress towards that KPI.
HVN commissioned an earlier report that set a baseline from the calendar year 2014 and estimated export revenue for 2015. This follow-on report employs the same method to estimate export revenue of high-value nutrition foods for 2016.
For the purpose of this exercise we group high-value foods into three separate categories of food that either have proven health claims, have general health claims or are especially nutritious. The total of all three represents New Zealand’s potential high-value nutrition foods, and accounted for $21 billion or around 75 per cent of all food and beverage export revenue in 2016. HVN is working to realise that potential, to help food products move into higher-value categories and increase export revenues.
For foods with proven health claims, exports have increased from $565 million in 2014 to $1,256 million in 2016, an increase of $691 million. In 2016, kiwifruit remains the only product in the category of proven health claims, that is, the only food export from New Zealand with scientifically validated health claims. Other food products appear to be making progress towards this status, including avocado, boysenberries and flaxseed.
From our interviews of food and beverage companies we found that there is significant research being carried out into the health benefits and nutritional value of food products. While much of this research is still in the early stages, it shows that producers are recognising the value that consumers place on food with health benefits. The impact of these research and development programmes is likely to be seen in export revenue in the coming years.
Our in-market research in Asia showed that the markets for functional food and beverages is still growing quickly. New Zealand’s reputation for producing safe and nutritious food has allowed some of our products to dominate the shelves in China and South-East Asia.
PwC Page 3
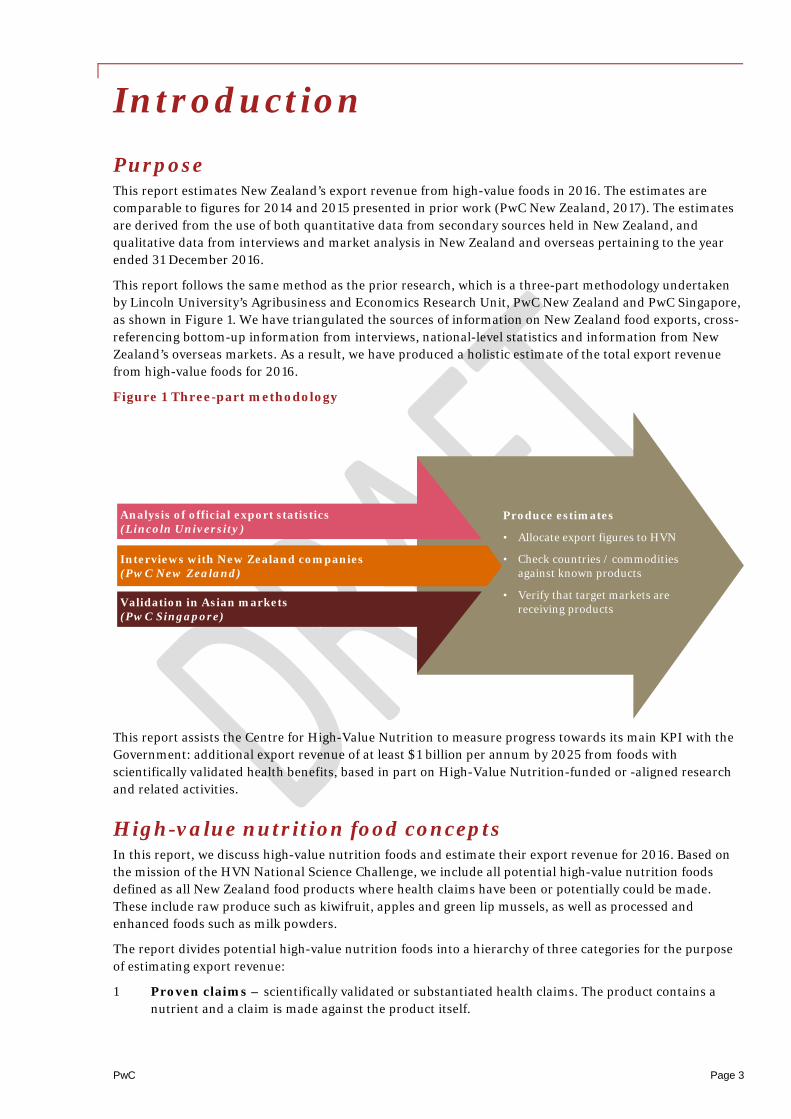
Introduction Purpose This report estimates New Zealand’s export revenue from high-value foods in 2016. The estimates are comparable to figures for 2014 and 2015 presented in prior work (PwC New Zealand, 2017). The estimates are derived from the use of both quantitative data from secondary sources held in New Zealand, and qualitative data from interviews and market analysis in New Zealand and overseas pertaining to the year ended 31 December 2016.
This report follows the same method as the prior research, which is a three-part methodology undertaken by Lincoln University’s Agribusiness and Economics Research Unit, PwC New Zealand and PwC Singapore, as shown in Figure 1. We have triangulated the sources of information on New Zealand food exports, cross-referencing bottom-up information from interviews, national-level statistics and information from New Zealand’s overseas markets. As a result, we have produced a holistic estimate of the total export revenue from high-value foods for 2016.
Figure 1 Three-part methodology
This report assists the Centre for High-Value Nutrition to measure progress towards its main KPI with the Government: additional export revenue of at least $1 billion per annum by 2025 from foods with scientifically validated health benefits, based in part on High-Value Nutrition-funded or -aligned research and related activities.
High-value nutrition food concepts In this report, we discuss high-value nutrition foods and estimate their export revenue for 2016. Based on the mission of the HVN National Science Challenge, we include all potential high-value nutrition foods defined as all New Zealand food products where health claims have been or potentially could be made. These include raw produce such as kiwifruit, apples and green lip mussels, as well as processed and enhanced foods such as milk powders.
The report divides potential high-value nutrition foods into a hierarchy of three categories for the purpose of estimating export revenue:
1 Proven claims – scientifically validated or substantiated health claims. The product contains a nutrient and a claim is made against the product itself.
Analysis of official export statistics(Lincoln University)
Interviews with New Zealand companies(PwC New Zealand)
Validation in Asian markets(PwC Singapore)
Produce estimates
• Allocate export figures to HVN
• Check countries / commodities against known products
• Verify that target markets are receiving products
PwC Page 4
2 General health claims – a specific nutrient does something good. The claim is made on the specific ingredient or nutrient, but the product containing the ingredient or nutrient does not make a claim.
3 Especially nutritious – a food or nutrient is generally perceived to improve overall health and well-being, reduce the risk of specific diseases or minimise the effects of other health concerns, but does not make a claim as such. These are not strictly functional foods but have the potential for enhancement, fortification or further research to make the product a functional food.
We chose the definition of functional foods from Diplock, et al. (1999) to use when selecting foods that fit into the first tier, proven claims: “A food can be regarded as ‘functional’ if it is satisfactorily demonstrated to affect beneficially one or more target functions in the body, beyond adequate nutritional effects, in a way that is relevant to either an improved state of health and well-being and/or reduction of risk of disease. Functional foods must remain foods and they must demonstrate their effects in amounts that can normally be expected to be consumed in the diet: they are not pills or capsules, but part of a normal food pattern.”
Organisation This report is structured as follows:
1 It outlines the collection of export revenue data from Statistics New Zealand, explains the process of interviewing New Zealand firms in the food and beverage industry, discusses insights from market research in Asia and explains the technique used to separate data on export revenues into the high-value nutrition tiers.
2 The report then presents the estimates of 2016 export revenue.
3 It discusses the year-to-year changes in export revenue of categories of high-value foods between 2014 and 2016.
4 The report concludes by outlining three food types that illustrate development towards health claims.
PwC Page 5
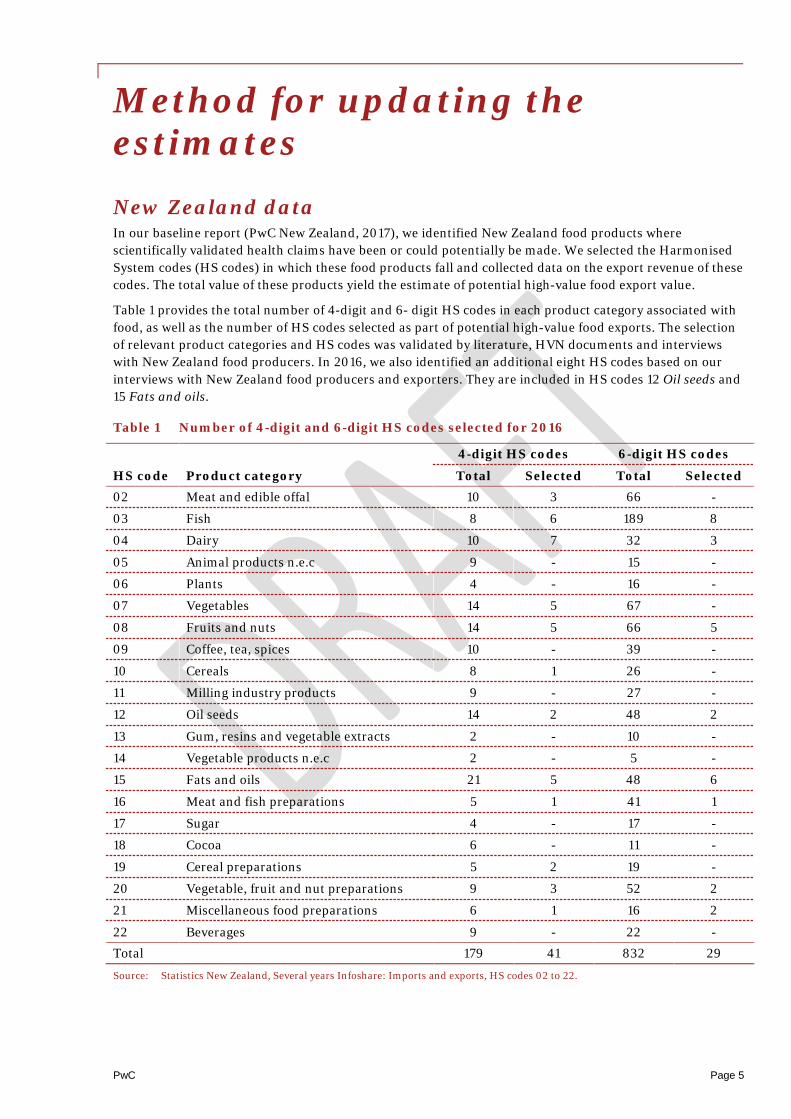
Method for updating the estimates New Zealand data In our baseline report (PwC New Zealand, 2017), we identified New Zealand food products where scientifically validated health claims have been or could potentially be made. We selected the Harmonised System codes (HS codes) in which these food products fall and collected data on the export revenue of these codes. The total value of these products yield the estimate of potential high-value food export value.
Table 1 provides the total number of 4-digit and 6- digit HS codes in each product category associated with food, as well as the number of HS codes selected as part of potential high-value food exports. The selection of relevant product categories and HS codes was validated by literature, HVN documents and interviews with New Zealand food producers. In 2016, we also identified an additional eight HS codes based on our interviews with New Zealand food producers and exporters. They are included in HS codes 12 Oil seeds and 15 Fats and oils.
Table 1 Number of 4-digit and 6-digit HS codes selected for 2016
HS code Product category
4-digit HS codes 6-digit HS codes
Total Selected Total Selected 02 Meat and edible offal 10 3 66 -
03 Fish 8 6 189 8
04 Dairy 10 7 32 3
05 Animal products n.e.c 9 - 15 -
06 Plants 4 - 16 -
07 Vegetables 14 5 67 -
08 Fruits and nuts 14 5 66 5
09 Coffee, tea, spices 10 - 39 -
10 Cereals 8 1 26 -
11 Milling industry products 9 - 27 -
12 Oil seeds 14 2 48 2
13 Gum, resins and vegetable extracts 2 - 10 -
14 Vegetable products n.e.c 2 - 5 -
15 Fats and oils 21 5 48 6
16 Meat and fish preparations 5 1 41 1
17 Sugar 4 - 17 -
18 Cocoa 6 - 11 -
19 Cereal preparations 5 2 19 -
20 Vegetable, fruit and nut preparations 9 3 52 2
21 Miscellaneous food preparations 6 1 16 2
22 Beverages 9 - 22 -
Total 179 41 832 29
Source: Statistics New Zealand, Several years Infoshare: Imports and exports, HS codes 02 to 22.
PwC Page 6
We also looked at data on the export volumes for some product categories and examined the average prices in New Zealand dollars for selected products using the export revenue and volume data. This allowed us to identify the drivers behind some high-value nutrition food where export revenues have been falling.
Value is hard to measure As we found in the previous research, export revenue from functional foods is hard to measure. There continue to be different understandings among industry participants of what sort of health claim is sufficient for food to be considered functional. Our measure of export revenue is a holistic estimate that draws on the previously mentioned sources of information.
To measure export revenue from functional foods, including exports that arise from HVN-funded and -aligned research and related activities, we categorise potential high-value nutrition food products into three tiers of a pyramid. This hierarchical structure allows us to identify a holistic estimate of potential high-value nutrition foods, while separating exports in an effort to account for the scientific and regulatory barriers to entering the top tier.

PwC Page 7
Interviews The second stage involved gathering information from interviews with New Zealand food and beverage firms to separate export revenue into high-value nutrition categories. The interviews collected qualitative information on research and development around validating health benefits as well as information on export activities. We also collected quantitative information about what and how much is being produced.
We contacted 31 food and beverage organisations across the supply chain to request participation in a semi-structured interview around functional foods and exports. Fifteen food and beverage organisations agreed to participate, with six under the condition that their names would not be publicly reported. Four firms were follow-up interviews from last year. The firms we interviewed and their reported food and beverage sectors are shown in Table 2.
Table 2 New Zealand firms interviewed by PwC New Zealand
Firms Sector Alliance Group Limited Meat Atkins Ranch Meat Midland Oil Oils NZ Avocado Fruit and Vegetables NZ King Salmon Fish Sanford Limited Fish Sanitarium Grain Smartfoods Limited Grain Zespri Group Limited Fruit and Vegetables Source: PwC interviews with New Zealand food and beverage firms (2017). Notes: 1. Six organisations are excluded from this table as they gave the interview under the condition the organisation name would not be
publicly reported. 2. The organisations we interviewed included three each from the grain sector and the fruit and vegetable sector, two each from
meat, dairy, oils and fish, and one honey sector company.
In addition to interviewing organisations from a range of food sectors, we wanted to ensure that the interviews captured firms across the different parts of the supply chain. Table 3 lists the number of New Zealand food and beverage firms interviewed in each part of the supply chain. Note that there are a number of vertically integrated organisations that indicated they participate in more than one part of the supply chain.
Table 3 Number of interviewed firms in each part of the supply chain
Supply chain Number of firms Grower 6 Agribusiness 5 Processor 10 Manufacturer 10 Wholesaler 9 Exporter 10 Research and development 11 Marketing and communications 11
Source: PwC interviews with New Zealand food and beverage firms (2017).

PwC Page 8
One of the key messages that came from our interviews was that New Zealand food and beverage companies are aware of the importance of health benefits. Despite there still being some ambiguity on the definition of a functional food, many producers market their food products based on health benefits. The majority of these health benefits still fall into the middle and bottom tiers of potential high-value nutrition food.
The most common type of health benefits reported by food and beverage organisations concerned a specific ingredient or nutrient that does something good. This places those products in the middle tier of health claims. In order to move up to the top tier of proven claims, the claim must be scientifically validated and be made against the product itself. In 2016, kiwifruit is still the only product that meets these standards.
Some of the firms we interviewed reported that they are conducting research into the health benefits of their products. Outside of HVN-funded and -aligned research, there are other programmes that are looking into health benefits and paths to increase export revenue of food. While this research is still ongoing, it is likely that some impacts on marketing and export revenues may be seen in the coming years.
PwC Page 9
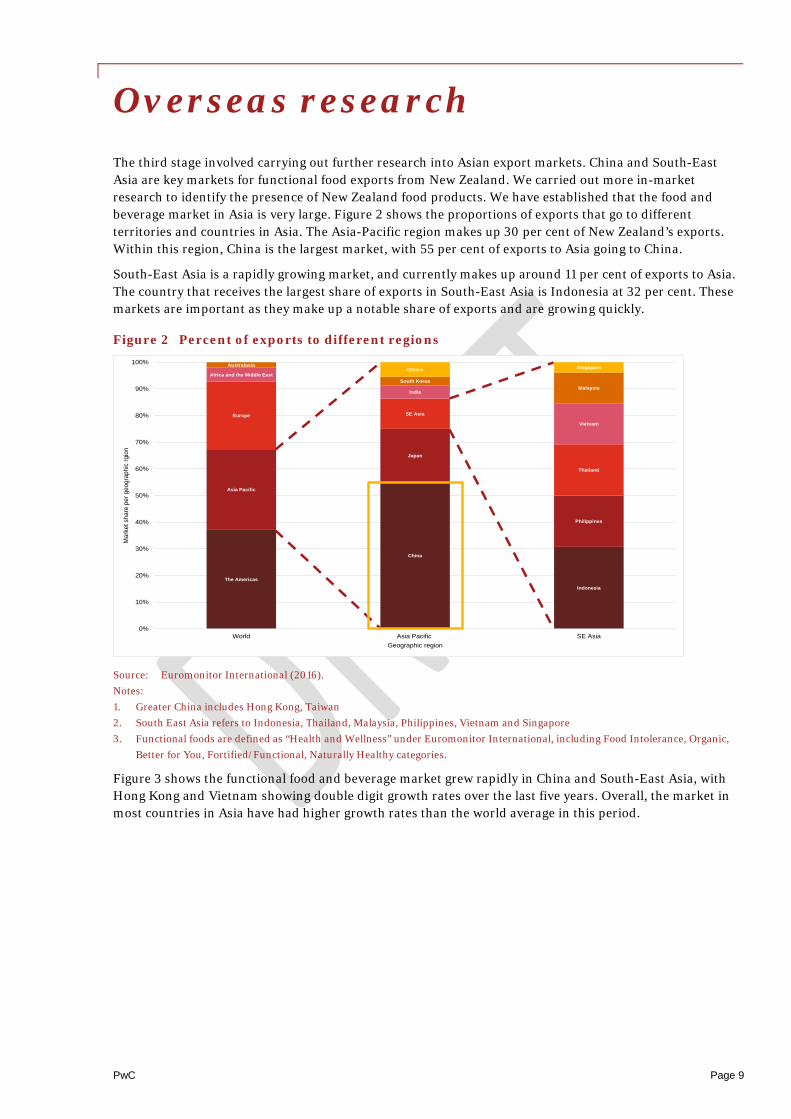
Overseas research The third stage involved carrying out further research into Asian export markets. China and South-East Asia are key markets for functional food exports from New Zealand. We carried out more in-market research to identify the presence of New Zealand food products. We have established that the food and beverage market in Asia is very large. Figure 2 shows the proportions of exports that go to different territories and countries in Asia. The Asia-Pacific region makes up 30 per cent of New Zealand’s exports. Within this region, China is the largest market, with 55 per cent of exports to Asia going to China.
South-East Asia is a rapidly growing market, and currently makes up around 11 per cent of exports to Asia. The country that receives the largest share of exports in South-East Asia is Indonesia at 32 per cent. These markets are important as they make up a notable share of exports and are growing quickly.
Figure 2 Percent of exports to different regions
Source: Euromonitor International (2016). Notes: 1. Greater China includes Hong Kong, Taiwan 2. South East Asia refers to Indonesia, Thailand, Malaysia, Philippines, Vietnam and Singapore 3. Functional foods are defined as “Health and Wellness” under Euromonitor International, including Food Intolerance, Organic,
Better for You, Fortified/Functional, Naturally Healthy categories.
Figure 3 shows the functional food and beverage market grew rapidly in China and South-East Asia, with Hong Kong and Vietnam showing double digit growth rates over the last five years. Overall, the market in most countries in Asia have had higher growth rates than the world average in this period.
The Americas
Asia Pacific
Europe
Africa and the Middle East
Australasia
China
Japan
SE Asia
India
South Korea
Others
Indonesia
Philippines
Thailand
Vietnam
Malaysia
Singapore
0%
10%
20%
30%
40%
50%
60%
70%
80%
90%
100%
World Asia Pacific SE Asia
Mar
ket s
hare
per
geo
grap
hic
rgio
n
Geographic region

PwC Page 10
Figure 3 Growth of health and wellness food and beverage market, 2011 to 2016 (CAGR*)
Source: Euromonitor International (2016). Notes: 1. Health and Wellness is defined by Euromonitor International to include the following categories: Food Intolerance, Organic,
Better for You, Fortified/Functional, Naturally Healthy. 2. Greater China refers to China, Hong Kong and Taiwan. SE Asia refers to Indonesia, Thailand, Vietnam, and Singapore. 3. *CAGR is the compound annual growth rate over the time period.
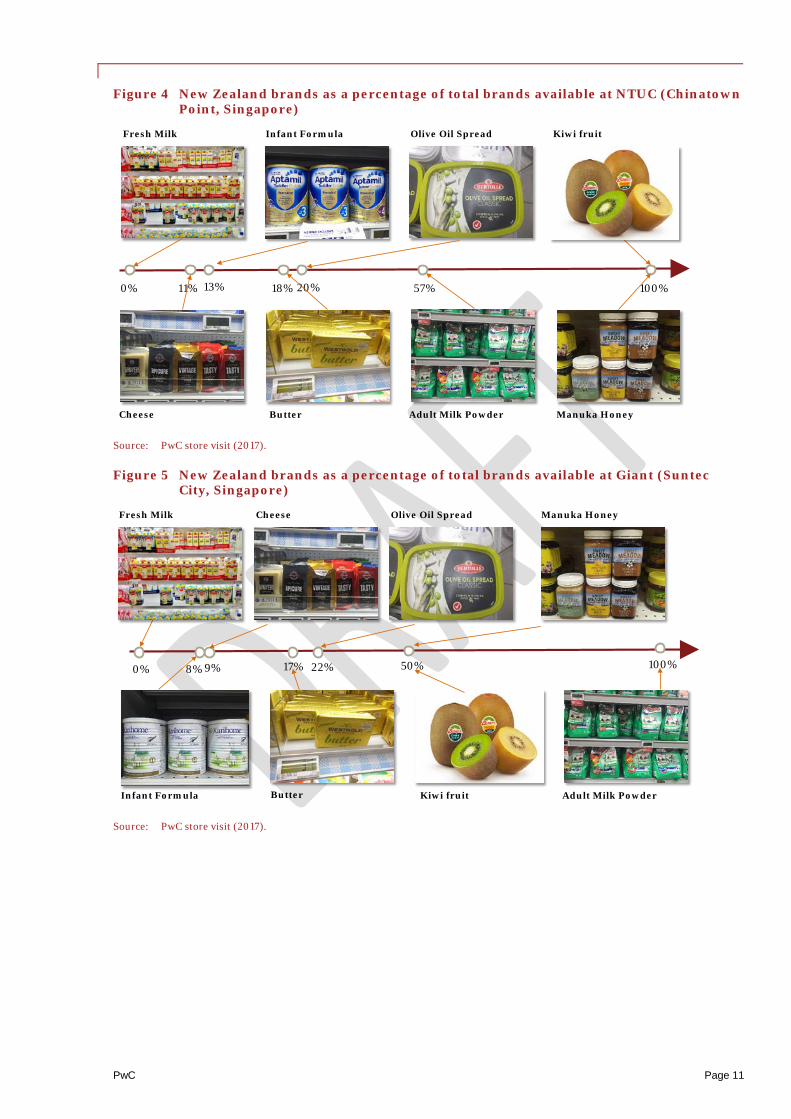
Another key message from our research in Asian markets concerns the types of New Zealand products that interest Asian consumers. Visits to supermarkets in South-East Asia revealed that New Zealand brands have substantial market share of certain products on the shelves.
The figures below show the percentage of available brands that are from New Zealand in a range of supermarkets in Singapore. In two of the three stores visited, New Zealand kiwifruit made up all of the kiwifruit available for sale. Adult milk powder is the only dairy product in which New Zealand brands are widely available. In particular, butter and cheese are two products where New Zealand brands are not well represented in supermarkets in Singapore. In each of the store visits, there were no New Zealand brands of fresh milk found on shelves. The relatively short shelf-life of fresh milk may be prohibitive in getting these products to supermarkets in Asia.
2.1%
8.6%
5.7%
12.2%
10.8%
8.7%
6.5%
5.2%
4.2%
2.6% 2.1%
0%
1%
2%
3%
4%
5%
6%
7%
8%
9%
10%
11%
12%
13%
World GreaterChina
SE Asia Hong Kong Vietnam China Indonesia Thailand Malaysia Phillipines Singapore
Com
poun
d an
nual
gro
wth
rate
(201
1–20
16)
Geographic region
PwC Page 11
Figure 4 New Zealand brands as a percentage of total brands available at NTUC (Chinatown Point, Singapore)
Source: PwC store visit (2017).
Figure 5 New Zealand brands as a percentage of total brands available at Giant (Suntec City, Singapore)
Source: PwC store visit (2017).
0% 100%57%11% 13% 18% 20%
Kiwi fruit
Adult Milk PowderCheese Butter Manuka Honey
Olive Oil SpreadInfant FormulaFresh Milk
100%50%0% 8% 9% 17%
Kiwi fruit Adult Milk Powder
22%
Butter
Cheese Manuka Honey
Infant Formula
Olive Oil SpreadFresh Milk

PwC Page 12
Figure 6 New Zealand brands as a percentage of total brands available at Cold Storage (Bugis Junction, Singapore)
Source: PwC store visit (2017).
Figure 7 below shows the average prevalence of New Zealand brands of specified products in Singaporean supermarkets. In particular, mānuka honey from New Zealand make up 82 per cent of all mānuka honey available in supermarkets in Singapore. New Zealand kiwifruit make up 75 per cent of kiwifruit found in Singaporean supermarkets.
Figure 7 New Zealand brands as a percentage of total brands available in Singaporean supermarkets in 2016, by product type
Source: PwC store visit. Note: Food brands in one branch of a supermarket are assumed to be representative of another branch.
10% 100%83%0% 9%
Kiwi fruitAdult Milk Powder
29%
Butter
Cheese Manuka HoneyInfant Formula
Olive Oil Spread
Fresh Milk
8%
82%
75%
50%
17% 15%10% 10%
0%0%
10%
20%
30%
40%
50%
60%
70%
80%
90%
100%
Mānukahoney
Kiwifruit Adult milkpowder
Olive spread Butter Infantpowder
Cheese Fresh milk
Perc
ent o
f bra
nds
from
New
Zea
land
Food products
PwC Page 13
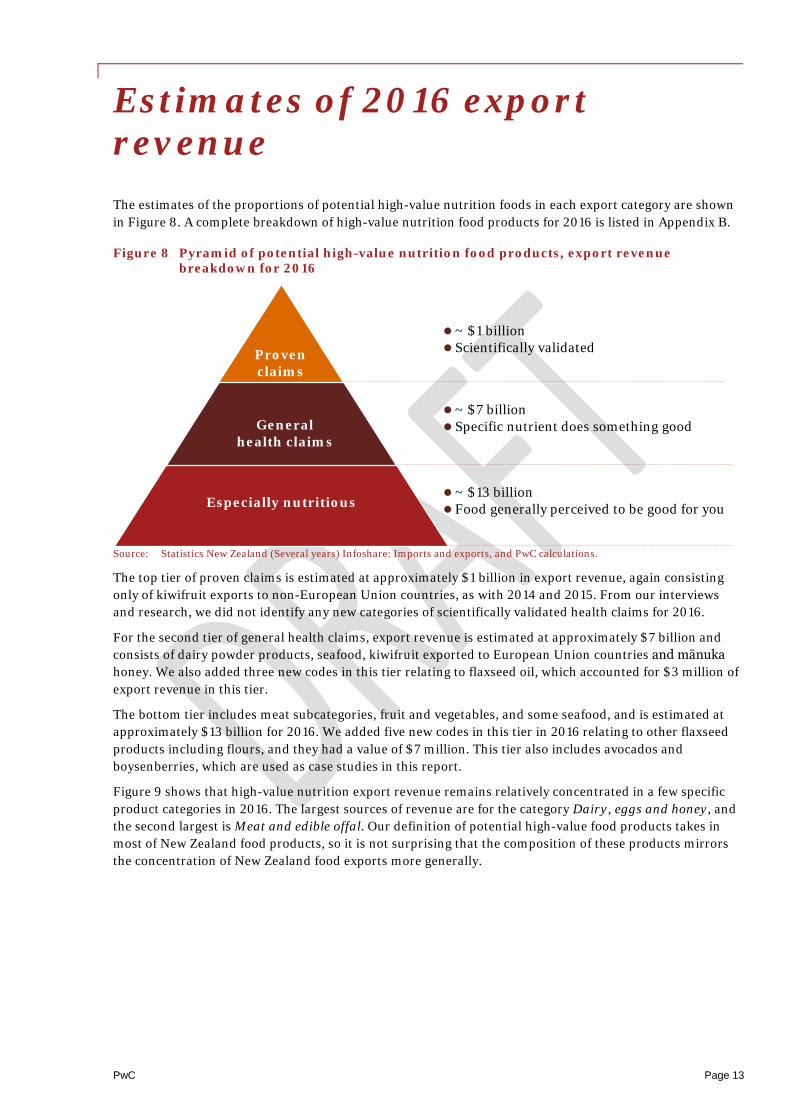
Estimates of 2016 export revenue The estimates of the proportions of potential high-value nutrition foods in each export category are shown in Figure 8. A complete breakdown of high-value nutrition food products for 2016 is listed in Appendix B.
Figure 8 Pyramid of potential high-value nutrition food products, export revenue breakdown for 2016
Source: Statistics New Zealand (Several years) Infoshare: Imports and exports, and PwC calculations.
The top tier of proven claims is estimated at approximately $1 billion in export revenue, again consisting only of kiwifruit exports to non-European Union countries, as with 2014 and 2015. From our interviews and research, we did not identify any new categories of scientifically validated health claims for 2016.
For the second tier of general health claims, export revenue is estimated at approximately $7 billion and consists of dairy powder products, seafood, kiwifruit exported to European Union countries and mānuka honey. We also added three new codes in this tier relating to flaxseed oil, which accounted for $3 million of export revenue in this tier.
The bottom tier includes meat subcategories, fruit and vegetables, and some seafood, and is estimated at approximately $13 billion for 2016. We added five new codes in this tier in 2016 relating to other flaxseed products including flours, and they had a value of $7 million. This tier also includes avocados and boysenberries, which are used as case studies in this report.
Figure 9 shows that high-value nutrition export revenue remains relatively concentrated in a few specific product categories in 2016. The largest sources of revenue are for the category Dairy, eggs and honey, and the second largest is Meat and edible offal. Our definition of potential high-value food products takes in most of New Zealand food products, so it is not surprising that the composition of these products mirrors the concentration of New Zealand food exports more generally.
Especially nutritious
Generalhealth claims
Provenclaims
~ $1 billion Scientifically validated
~ $7 billion Specific nutrient does something good
~ $13 billion Food generally perceived to be good for you

PwC Page 14
Figure 9 High-value nutrition export revenue for 2016, by selected product categories (2-digit HS codes) ($ millions)
Source: Statistics New Zealand (Several years) Infoshare: Imports and exports, and PwC calculations.
Table 4 shows the breakdown of export revenue from high-value nutrition food products for 2016, by the food product category at the 2-digit HS code level.
Table 4 New Zealand and high-value nutrition export revenue for 2016, by selected product categories (2-digit HS codes) ($ millions)
High-value nutrition food product
Product category
Total product category exports
Total high-value
nutrition exports
Proven claims
General health claims
Especially nutritious
Dairy, eggs and honey 11,501 9,770 - 6,024 3,746
Meat and edible offal 5,913 5,431 - - 5,431
Fruits and nuts 2,729 2,642 1,256 448 938
Fish 1,607 1,604 - 595 1,009
Miscellaneous food preparations
1,166 928 - - 928
Vegetables 439 346 - 10 336
Cereal preparations 1,210 192 - - 192
Vegetable, fruit, and nut preparations
308 120 - 3 117
Meat and fish preparations
285 31 - 8 23
Fats and oils 170 29 - 13 16
Cereals 27 0 - - 0
Oil seeds 177 2 - 1 1
Total 25,532 21,097 1,256 7,103 12,738 Source: Statistics New Zealand (Several years) Infoshare: Imports and exports, and PwC calculations. Note: Totals may be subject to rounding error.
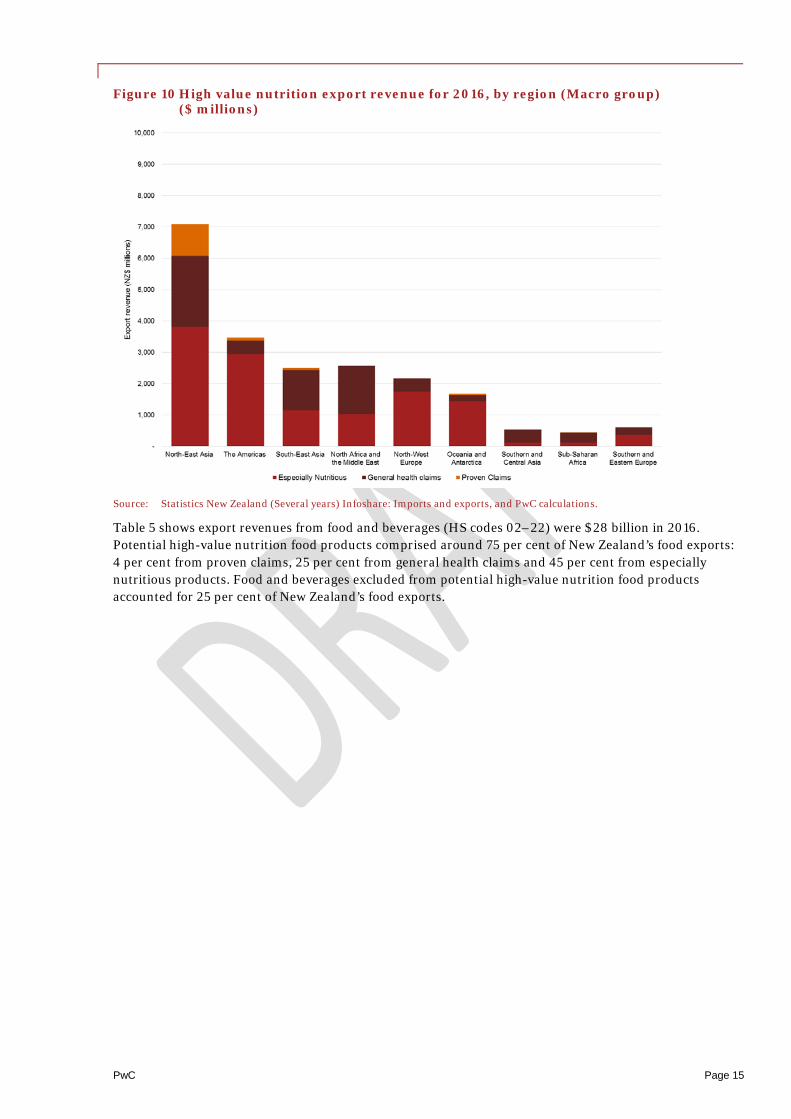
Figure 10 and Table 5 show that high-value nutrition export revenue is concentrated in North-East Asia.
PwC Page 15
Figure 10 High value nutrition export revenue for 2016, by region (Macro group) ($ millions)
Source: Statistics New Zealand (Several years) Infoshare: Imports and exports, and PwC calculations.
Table 5 shows export revenues from food and beverages (HS codes 02–22) were $28 billion in 2016. Potential high-value nutrition food products comprised around 75 per cent of New Zealand’s food exports: 4 per cent from proven claims, 25 per cent from general health claims and 45 per cent from especially nutritious products. Food and beverages excluded from potential high-value nutrition food products accounted for 25 per cent of New Zealand’s food exports.

PwC Page 16
Table 5 New Zealand and high-value nutrition export revenues for 2016, by region (Macro group) ($ millions)
High-value nutrition food product
Region
Total NZ food
exports
Total high-value
nutrition exports
Proven claims
General health claims
Especially nutritious
North-East Asia 9,079 7,090 1,011 2,268 3,810
The Americas 4,632 3,474 87 443 2,944
South-East Asia 3,138 2,505 69 1,283 1,153
North Africa and the Middle East
2,849 2,581 18 1,535 1,029
Oceania and Antarctica 3,698 1,686 46 207 1,434
North-West Europe 3,024 2,168 - 419 1,749
Southern and Central Asia
584 549 18 401 130
Sub-Saharan Africa 485 443 6 317 120
Southern and Eastern Europe
663 601 2 229 369
Total 28,153 21,097 1,256 7,103 12,738 Source: Statistics New Zealand (Several years) Infoshare: Imports and exports, and PwC calculations. Note: Totals may be subject to rounding error.
PwC Page 17
Change in export revenue Organisations are moving towards a high-value nutrition model in order to extract more value from food products. In this section we outline the changes in export revenue from the baseline report. We also look at the export markets and products that are driving these changes.
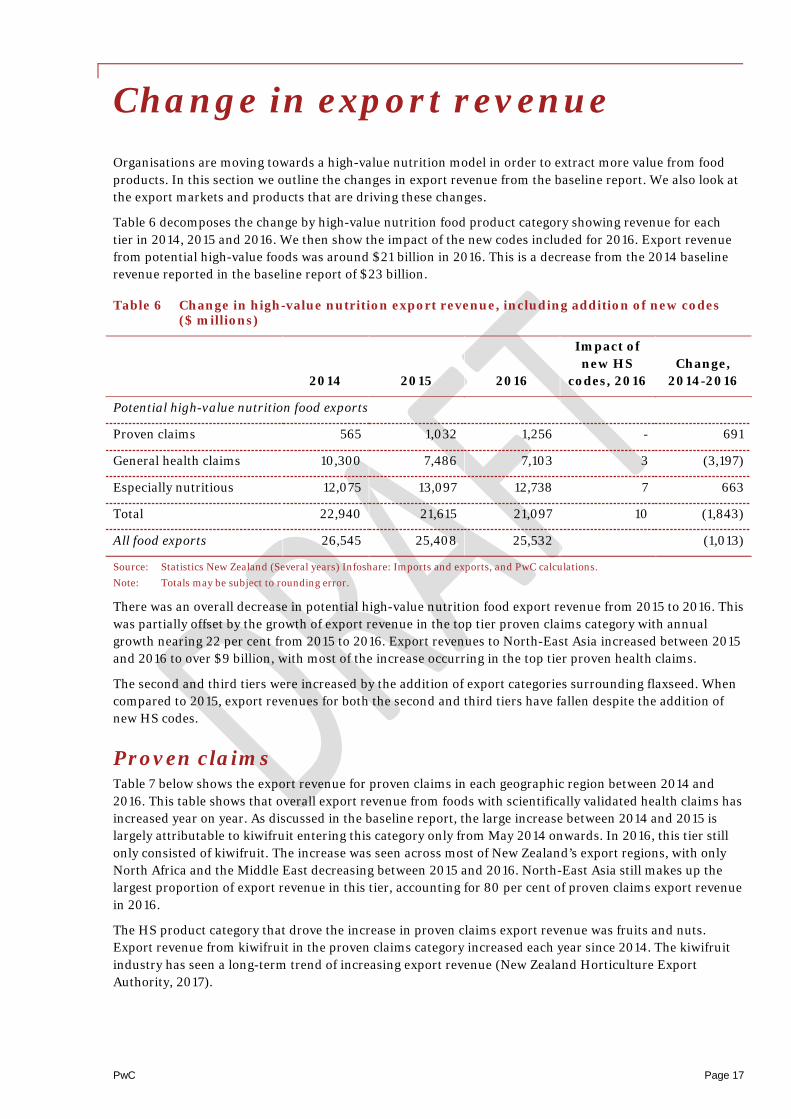
Table 6 decomposes the change by high-value nutrition food product category showing revenue for each tier in 2014, 2015 and 2016. We then show the impact of the new codes included for 2016. Export revenue from potential high-value foods was around $21 billion in 2016. This is a decrease from the 2014 baseline revenue reported in the baseline report of $23 billion.
Table 6 Change in high-value nutrition export revenue, including addition of new codes ($ millions)
2014 2015 2016
Impact of new HS
codes, 2016 Change,
2014-2016
Potential high-value nutrition food exports
Proven claims 565 1,032 1,256 - 691
General health claims 10,300 7,486 7,103 3 (3,197)
Especially nutritious 12,075 13,097 12,738 7 663
Total 22,940 21,615 21,097 10 (1,843)
All food exports 26,545 25,408 25,532 (1,013)
Source: Statistics New Zealand (Several years) Infoshare: Imports and exports, and PwC calculations. Note: Totals may be subject to rounding error.
There was an overall decrease in potential high-value nutrition food export revenue from 2015 to 2016. This was partially offset by the growth of export revenue in the top tier proven claims category with annual growth nearing 22 per cent from 2015 to 2016. Export revenues to North-East Asia increased between 2015 and 2016 to over $9 billion, with most of the increase occurring in the top tier proven health claims.
The second and third tiers were increased by the addition of export categories surrounding flaxseed. When compared to 2015, export revenues for both the second and third tiers have fallen despite the addition of new HS codes.
Proven claims Table 7 below shows the export revenue for proven claims in each geographic region between 2014 and 2016. This table shows that overall export revenue from foods with scientifically validated health claims has increased year on year. As discussed in the baseline report, the large increase between 2014 and 2015 is largely attributable to kiwifruit entering this category only from May 2014 onwards. In 2016, this tier still only consisted of kiwifruit. The increase was seen across most of New Zealand’s export regions, with only North Africa and the Middle East decreasing between 2015 and 2016. North-East Asia still makes up the largest proportion of export revenue in this tier, accounting for 80 per cent of proven claims export revenue in 2016.
The HS product category that drove the increase in proven claims export revenue was fruits and nuts. Export revenue from kiwifruit in the proven claims category increased each year since 2014. The kiwifruit industry has seen a long-term trend of increasing export revenue (New Zealand Horticulture Export Authority, 2017).

PwC Page 18
Table 7 Proven claims export revenues each year, by region (Macro group) ($ millions)
Year Change, 2014-2016 Region 2014 2015 2016
North-East Asia 436 813 1,011 575
The Americas 35 72 86 51
South-East Asia 36 62 68 32
North Africa and the Middle East 10 21 18 8
Oceania and Antarctica 37 43 46 9
North-West Europe - - - -
Southern and Central Asia 6 13 18 12
Sub-Saharan Africa 5 6 6 1
Southern and Eastern Europe 2 2 2 0
Total 565 1,032 1,256 691 Source: Statistics New Zealand (Several years) Infoshare: Imports and exports, and PwC calculations. Note: Totals may be subject to rounding error.
General health claims Table 8 below shows the change in export revenue for general health claims in each geographic region between 2014 and 2016. Export revenue for this tier decreased significantly since 2014. The decrease from 2014 to 2015 is largely attributable to lower commodity prices. Export revenue for this tier continued to fall in 2016, although there are some export markets where revenue increased. Export revenue for this tier increased in key markets such as North-East Asia. The largest decreases in revenue for this tier came from exports to the Americas and South-East Asia, down $296 million and $210 million respectively from 2015 to 2016.
Table 8 General health claims export revenue each year, by region (Macro group) ($ millions)
Year Change, 2014-2016 Region 2014 2015 2016
North-East Asia 4,408 2,230 2,268 (2,140)
The Americas 550 739 443 (107)
South-East Asia 1,937 1,493 1,283 (654)
North Africa and the Middle East 1,866 1,487 1,535 (331)
Oceania and Antarctica 217 211 207 (10)
North-West Europe 318 386 419 101
Southern and Central Asia 447 379 401 (46)
Sub-Saharan Africa 403 377 317 (86)
Southern and Eastern Europe 155 186 229 74
Total 10,300 7,486 7,103 (3,197) Source: Statistics New Zealand (Several years) Infoshare: Imports and exports, and PwC calculations. Note: Totals may be subject to rounding error.
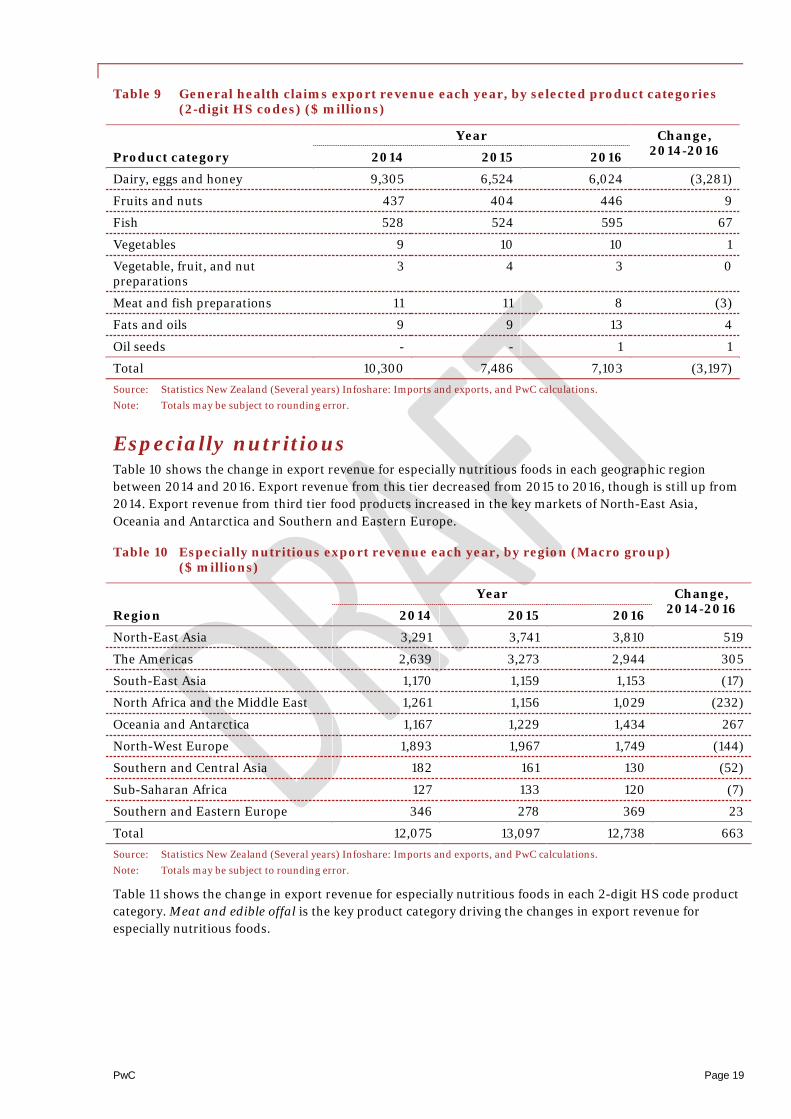
Table 9 shows the change in export revenue for general health claims in each 2-digit HS code product category. A decrease in export revenue in the Dairy, eggs and honey category was the main driver of the lower export revenue for this tier between 2014 and 2016. The decrease in this category was largely attributable to a drop in dairy prices over this period (Statistics New Zealand, 2016).
PwC Page 19
Table 9 General health claims export revenue each year, by selected product categories (2-digit HS codes) ($ millions)
Year Change, 2014-2016 Product category 2014 2015 2016
Dairy, eggs and honey 9,305 6,524 6,024 (3,281)
Fruits and nuts 437 404 446 9
Fish 528 524 595 67
Vegetables 9 10 10 1
Vegetable, fruit, and nut preparations
3 4 3 0
Meat and fish preparations 11 11 8 (3)
Fats and oils 9 9 13 4
Oil seeds - - 1 1
Total 10,300 7,486 7,103 (3,197) Source: Statistics New Zealand (Several years) Infoshare: Imports and exports, and PwC calculations. Note: Totals may be subject to rounding error.
Especially nutritious Table 10 shows the change in export revenue for especially nutritious foods in each geographic region between 2014 and 2016. Export revenue from this tier decreased from 2015 to 2016, though is still up from 2014. Export revenue from third tier food products increased in the key markets of North-East Asia, Oceania and Antarctica and Southern and Eastern Europe.
Table 10 Especially nutritious export revenue each year, by region (Macro group) ($ millions)
Year Change, 2014-2016 Region 2014 2015 2016
North-East Asia 3,291 3,741 3,810 519
The Americas 2,639 3,273 2,944 305
South-East Asia 1,170 1,159 1,153 (17)
North Africa and the Middle East 1,261 1,156 1,029 (232)
Oceania and Antarctica 1,167 1,229 1,434 267
North-West Europe 1,893 1,967 1,749 (144)
Southern and Central Asia 182 161 130 (52)
Sub-Saharan Africa 127 133 120 (7)
Southern and Eastern Europe 346 278 369 23
Total 12,075 13,097 12,738 663 Source: Statistics New Zealand (Several years) Infoshare: Imports and exports, and PwC calculations. Note: Totals may be subject to rounding error.
Table 11 shows the change in export revenue for especially nutritious foods in each 2-digit HS code product category. Meat and edible offal is the key product category driving the changes in export revenue for especially nutritious foods.

PwC Page 20
Table 11 Especially nutritious export revenue each year, by selected product categories (2-digit HS codes) ($ millions)
Year Change, 2014-2016 Product category 2014 2015 2016
Dairy, eggs and honey 3,878 3,634 3,746 (132)
Meat and edible offal 5,473 6,329 5,431 (42)
Fruits and nuts 714 797 938 224
Fish 841 920 1,009 168
Miscellaneous food preparations 559 797 928 369
Vegetables 311 305 336 25
Cereal preparations 162 179 192 30
Vegetable, fruit, and nut preparations
96 95 117 21
Meat and fish preparations 32 32 23 (9)
Fats and oils 10 9 16 6
Cereals 0 0 0 -
Oil seeds - - 1 1
Total 12,075 13,097 12,738 663 Source: Statistics New Zealand (Several years) Infoshare: Imports and exports, and PwC calculations. Note: Tables may be subject to rounding error.

PwC Page 21
Product case studies The interviews conducted with New Zealand food and beverage producers and additional market research revealed that some industries and product types are making progress towards producing foods with validated health claims. While these products did not reach export markets in 2016, research and development and production are likely to lead to more food export revenues in the top tier category, proven health claims, in coming years. We highlight below some examples of products where we are seeing general health claims emerging.
Avocados Avocados brought in $125 million of export revenue in 2016. Traditionally, Australia has been the main export market for avocados from New Zealand. In June 2014, NZ Avocado partnered with MPI in the Go Global Primary Growth Partnership (PGP) Programme, an initiative to increase the export opportunities for avocados. The long-term goal is that the New Zealand avocado industry is globally competitive and high value and delivers sustainable economic growth. Additional benefits include increased awareness among New Zealand consumers of health attributes of avocados.
Since the programme began, there have been significant increases in export revenue from avocados. Compound annual growth has been around 23 per cent, driven mostly by quantity growth of around 22 per cent.
As part of the push to grow the export revenue from avocados, NZ Avocado is undertaking marketing projects to highlight the nutritional benefits of avocados. Avocados contain around 20 vitamins, monounsaturated fats and high amounts of folate. Avocados do not currently have a substantiated health claim and sit in the especially nutritious category of potential functional foods. It is possible that they will move to the general health claims category in the future.
Boysenberries Boysenberries are another example of the type of high-value food that New Zealand industry is targeting for development. New Zealand is the world’s largest producer of boysenberries, producing around 3,000 tonnes a year. Two thirds of the boysenberries produced here are exported, bringing in around $4 million in 2016 (AgriHQ, 2017). The value flows to New Zealand through exports, and the product is being targeted in export markets that countries’ characteristics and the benefits that product can supply.
Boysenberries are increasingly being used in products that are being marketed overseas as having very good health properties (AgriHQ, 2017). A new boysenberry-based liquid supplement made in New Zealand by a partnership between Plant and Food and Anagenix is being introduced in China. Boysenberries have properties that help repair lung tissue and reduce inflammation and mucus production. The product’s marketing targets concerns in China around air pollution, claiming health benefits for lungs.
While boysenberries were not scientifically validated in 2016, boysenberries and boysenberry products are included in especially nutritious foods due to their potential to be marketed with health claims on lung health. They will be included in general health claims next year.
Flaxseed Oils Nutritional oils made from a range of fruits and seeds also have high-value potential. Flaxseed oil is a good example of a food product with health benefits, although it does not currently have a scientifically validated health claim. For 2016, we added flaxseed or linseed products in this year’s export calculations. Around 80 per cent of the flaxseed oil New Zealand-produced flaxseed oil is exported to key markets such in Asia, Australia and North America.
PwC Page 22
Flaxseed oil is a concentrated natural forms of omega-3, as well as containing other essential fatty acids. There is a lack of available omega-3 in most modern diets, and it is therefore a very common dietary supplement. It has a range of perceived health benefits, including relief from allergies and eczema, improved complexion and lowered cholesterol (Midland Holdings Limited, 2016). We considered the benefits of flaxseed oil and included it in the second tier of general health claims for 2016.
PwC Page 23
Conclusion This report estimates the export revenue of New Zealand’s potential high-value foods in 2016. Using export data from Statistics New Zealand, interviews with food and beverage firms and market research in Asia we were able to give a holistic estimate of the value of these high-value food exports. We also looked at the changes to export revenue from the baseline report, separating out the three tiers of potential high-value nutrition foods.
In 2016, potential high-value nutrition foods brought in $21 billion in export revenue. Export revenue from the top tier proven claims was over $1 billion of this. Kiwifruit is still the only New Zealand export food product with a proven claim.
The second tier general health claims brought in $7 billion in export revenue. This was mainly attributed to dairy products and honey. The third tier of especially nutritious foods made up over 60 per cent of high-value nutrition export revenue, with $13 billion.
The export data shows that export revenue for the top tier proven claims has increased since 2014. This tier has increased in value by $691 million due to kiwifruit achieving a proven claim and to its subsequent export growth. North-East Asia, including China, was the source of 80 per cent of proven claims export revenue. This is a key market that is very large and growing quickly.
Market research in China and South-East Asia highlighted that kiwifruit and mānuka honey are popular New Zealand products. New Zealand brands make up the majority of brands sold for both these products in supermarkets in Singapore.
The interviews and research highlighted products for which scientifically validated claims are currently being developed, such as avocado, boysenberries and flaxseed. These developments, as with the HVN-aligned research, are ongoing so did not have an impact on export value calculations for 2016.
PwC Page 24
References AgriHQ. (2017). Boysenberry producer sets sights on China.
Canadean. (2015). Hot new food trends in Asia-Pacific.
Diplock, A. T., Aggett, P. J., Ashwell, M., Bornet, F., Fern, E. B., & Roberfroid, M. B. (1999). Scientific concepts in functional foods in Europe: Consensus document. British Journal of Nutrition, 81, S1–S27.
Elite Fine Food LLP. (2016). PwC Interview with Elite Fine Food LLP. (PwC Singapore, Interviewer)
Euromonitor International. (2016). Health and Wellness Solutions. Retrieved from www.euromonitor.com/health-and-wellness-solutions
European Commission. (Several years). EU Register on Nutrition and Health Claims. Retrieved from Nutrition and Health Claims: http://ec.europa.eu/food/safety/labelling_nutrition/claims/register
Food Xervices Inc. (2016). PwC Interview with Food Xervices Inc. (Pwc Singapore, Interviewer)
Frosts Food & Beverage Pte Ltd. (2016). Interview with Frosts Food & Beverage Pte Ltd. (PwC Singapore, Interviewer)
Midland Holdings Limited. (2016). Retrieved from Oil Seed Extractions: http://www.osel.co.nz/content/Product_Flyers/FlaxSeedOil.pdf
New Zealand Horticulture Export Authority. (2017). Kiwifruit Industry Profile. Retrieved from http://www.hea.co.nz/2012-05-11-03-05-28/kiwifruit-trade
New Zealand Firms. (2017). PwC interviews with New Zealand food and beverage firms. (PwC New Zealand, Interviewer)
(2017). PwC interviews with New Zealand food and beverage firms.
PwC New Zealand. (2017). Measuring what counts: Export revenue from New Zealand's high-value foods. Auckland: Report to the Centre of High-Value Nutrition.
PwC store visit. (2017).
PwC New Zealand. (2016). Measurement of NZ high-value nutrition export revenues: Methodology report. Auckland: Report to the Centre of High-value Nutrition.
Smart, J., Cameron-Smith, D., & Allain, E. (2014). Revised Business and Science Plans. Auckland: Centre for High-Value Nutrition.
Smart, J., Cameron-Smith, D., & Allain, E. (2015). National Roadshow. Auckland: Centre for High-Value Nutrition.
Statistics New Zealand. (2011). New Zealand Harmonised System Classifications 2012. Wellington: Statistics New Zealand. Retrieved from http://www.stats.govt.nz
Statistics New Zealand. (2015). Global New Zealand – International trade, investment, and travel profile: Year ended December 2015. Wellington: Ministry of Foreign Affairs and Trade and Statistics New Zealand. Retrieved from http://www.stats.govt.nz
PwC Page 25
Statistics New Zealand. (2016). Economic Indicators. Retrieved from http://www.stats.govt.nz/browse_for_stats/economic_indicators/prices_indexes/bpi-dairy-prices-jun-16.aspx
Statistics New Zealand. (Several years). Infoshare: Imports and exports. Retrieved from www.stats.govt.nz/infoshare
The Nielsen Company. (2015). Healthy eating trends around the world – January 2015. Retrieved from www.nielsen.com
Wilkinson, O. (2016). PwC interview with Oliver Wilkinson, South-East Asia Retail and Conumer Expert. (PwC Singapore, Interviewer)
Zespri Group Limited. (2014). NZ’s first self-substantiated health claim for Zespri. Retrieved from Zespri Kiwifruit: www.zespri.com
PwC Page 26
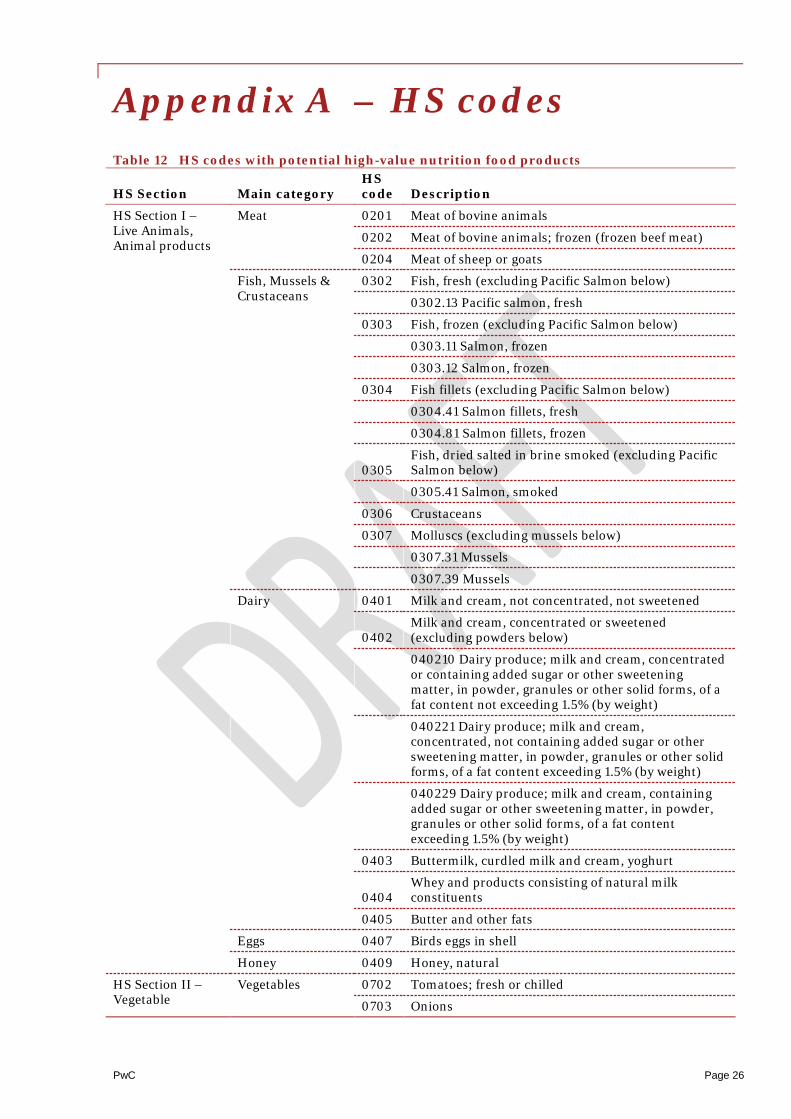
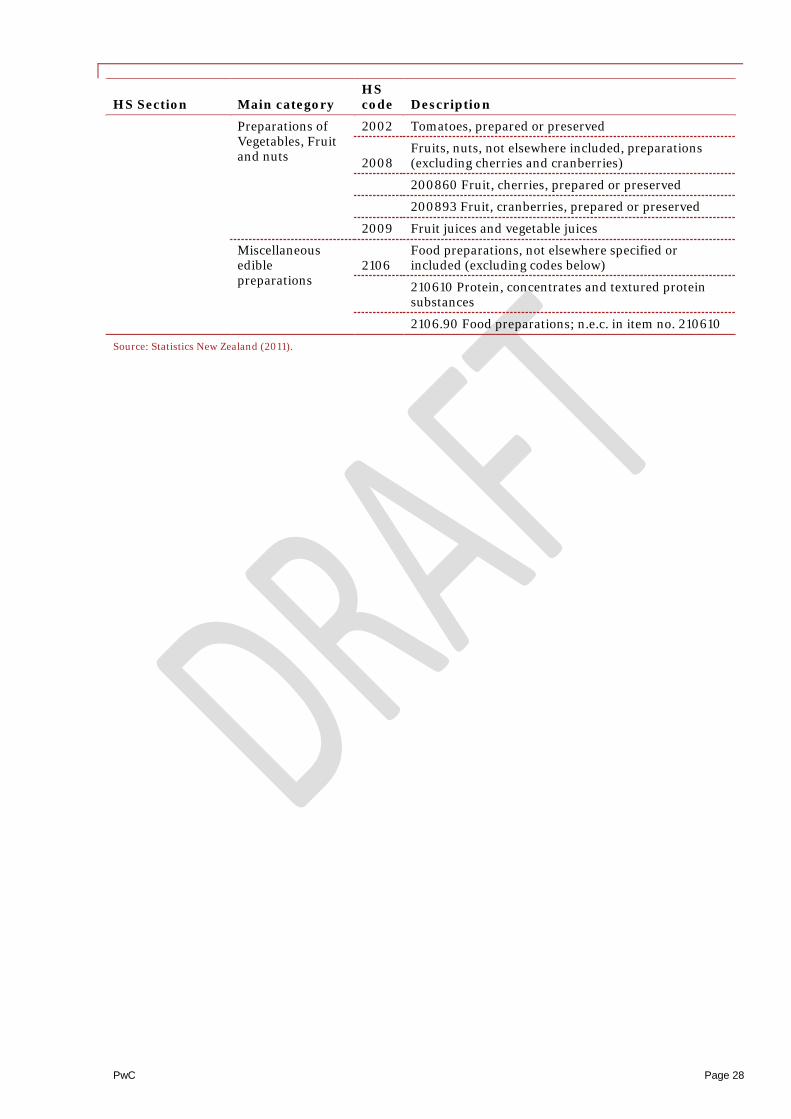
Appendix A – HS codes Table 12 HS codes with potential high-value nutrition food products
HS Section Main category HS code Description
HS Section I – Live Animals, Animal products
Meat 0201 Meat of bovine animals
0202 Meat of bovine animals; frozen (frozen beef meat)
0204 Meat of sheep or goats
Fish, Mussels & Crustaceans
0302 Fish, fresh (excluding Pacific Salmon below)
0302.13 Pacific salmon, fresh
0303 Fish, frozen (excluding Pacific Salmon below)
0303.11 Salmon, frozen
0303.12 Salmon, frozen
0304 Fish fillets (excluding Pacific Salmon below)
0304.41 Salmon fillets, fresh
0304.81 Salmon fillets, frozen
0305 Fish, dried salted in brine smoked (excluding Pacific Salmon below)
0305.41 Salmon, smoked
0306 Crustaceans
0307 Molluscs (excluding mussels below)
0307.31 Mussels
0307.39 Mussels
Dairy 0401 Milk and cream, not concentrated, not sweetened
0402 Milk and cream, concentrated or sweetened (excluding powders below)
040210 Dairy produce; milk and cream, concentrated or containing added sugar or other sweetening matter, in powder, granules or other solid forms, of a fat content not exceeding 1.5% (by weight)
040221 Dairy produce; milk and cream, concentrated, not containing added sugar or other sweetening matter, in powder, granules or other solid forms, of a fat content exceeding 1.5% (by weight)
040229 Dairy produce; milk and cream, containing added sugar or other sweetening matter, in powder, granules or other solid forms, of a fat content exceeding 1.5% (by weight)
0403 Buttermilk, curdled milk and cream, yoghurt
0404 Whey and products consisting of natural milk constituents
0405 Butter and other fats
Eggs 0407 Birds eggs in shell
Honey 0409 Honey, natural
HS Section II – Vegetable
Vegetables 0702 Tomatoes; fresh or chilled
0703 Onions

PwC Page 27
HS Section Main category HS code Description
products 0704 Cabbages, cauliflower, broccoli, kale
0709 Vegetables (not elsewhere included, e.g. spinach)
0710 Vegetables, frozen
Fruits and Nuts 0804
Dates, figs, pineapples, avocados, guavas, mangoes and mangosteen, fresh or dried
080440 fruit, edible; avocados, fresh or dried
0805 Citrus fruit, fresh or dried
0808 Apples, pears and quinces, fresh (excluding apples)
080810 Apples
0810 Fruit, fresh, not elsewhere included (excluding berries and kiwifruit below)
081020 Blackberries, fresh
081040 Cranberries, fresh
081050 Kiwifruit, fresh
0811 Fruits and Nuts, uncooked or cooked
Cereals 1004 Oats
HS Section III – Animal or Vegetable fats and oils
Oils and Fats 1204 Oil seeds; linseed, whether or not broken
1208 Flours and meals of oil seeds or oleaginous fruits; other than those of mustard
120810 Flours and meals; of soya beans
120890 Flours and meals of oil seeds or oleaginous fruits (excluding soya beans and mustard seeds)
1504 Fats and Oil and their fractions of fish and marine mammals (excluding fish oil below)
150410 Oils of fish
1509 Olive oil and its fractions (excluding olive oil below)
150910 Vegetable oils, olive oil, virgin
1512 Sunflower seed
1515
Fixed vegetable fats and oils and their fractions, whether or not refined but not chemically modified (excluding linseed oil and n.e.c below)
151511 Linseed oil and its fractions, crude
151519 Linseed oil and its fractions, other than crude
151590 Vegetable fats and oils and their fractions, n.e.c elsewhere in 1515
1517 Margarine (excluding liquid margarine below)
151710 Margarine, liquid margarine
HS Section IV – Prepared foodstuffs
Meat, Fish or Crustaceans, Molluscs and other preparations
1605 Crustaceans, prepared or preserved (excluding mussels below)
160553 Mussels, prepared or preserved
Preparations of cereals, flour, starch or milk, pastrycooks’ products
1904
Prepared foods obtained by swelling or roasting cereals or cereal products (e.g. cornflakes) cereals in grain form of in the form of lakes or other worked grains, pre-cooked or otherwise prepared, n.e.c.
1905 Bread, pastry, cakes, biscuits, other bakers wares
PwC Page 28
HS Section Main category HS code Description
Preparations of Vegetables, Fruit and nuts
2002 Tomatoes, prepared or preserved
2008 Fruits, nuts, not elsewhere included, preparations (excluding cherries and cranberries)
200860 Fruit, cherries, prepared or preserved
200893 Fruit, cranberries, prepared or preserved
2009 Fruit juices and vegetable juices
Miscellaneous edible preparations
2106 Food preparations, not elsewhere specified or included (excluding codes below)
210610 Protein, concentrates and textured protein substances
2106.90 Food preparations; n.e.c. in item no. 210610
Source: Statistics New Zealand (2011).

PwC Page 29
Appendix B – 2016 exports Table 13 High-value nutrition export revenue for 2016, all selected product categories ($
millions) HS code Description
Proven claims
General health claims
Especially nutritious
0201 Meat of bovine animals - - 341
0202 Meat of bovine animals; frozen (frozen beef meat) - - 2,445
0204 Meat of sheep or goats - - 2,645
0302 Fish, fresh (excluding Pacific Salmon below) - 23 70
0302.13 Pacific salmon, fresh - 13 40
0303 Fish, frozen (excluding Pacific Salmon below) - 94 282
0303.11 Salmon, frozen - 0 0
0303.12 Salmon, frozen - 1 3
0304 Fish fillets (excluding Pacific Salmon below) - 67 202
0304.41 Salmon fillets, fresh - 0 1
0304.81 Salmon fillets, frozen - 3 8
0305 Fish, dried salted in brine smoked (excluding Pacific Salmon below) - 1 4
0305.41 Salmon, smoked - 1 3
0306 Crustaceans - 90 271
0307 Molluscs (excluding mussels below) - 41 124
0307.31 Mussels - 3 -
0307.39 Mussels - 256 -
0401 Milk and cream, not concentrated, not sweetened - - 420
0402
Milk and cream, concentrated or sweetened (excluding powders below) - - 1
040210 Dairy produce; milk and cream, concentrated or containing added sugar or other sweetening matter, in powder, granules or other solid forms, of a fat content not exceeding 1.5% (by weight) - 1,257 -
040221 Dairy produce; milk and cream, concentrated, not containing added sugar or other sweetening matter, in powder, granules or other solid forms, of a fat content exceeding 1.5% (by weight) - 4,538 -
040229 Dairy produce; milk and cream, containing added sugar or other sweetening matter, in powder, granules or other solid forms, of a fat - - 28
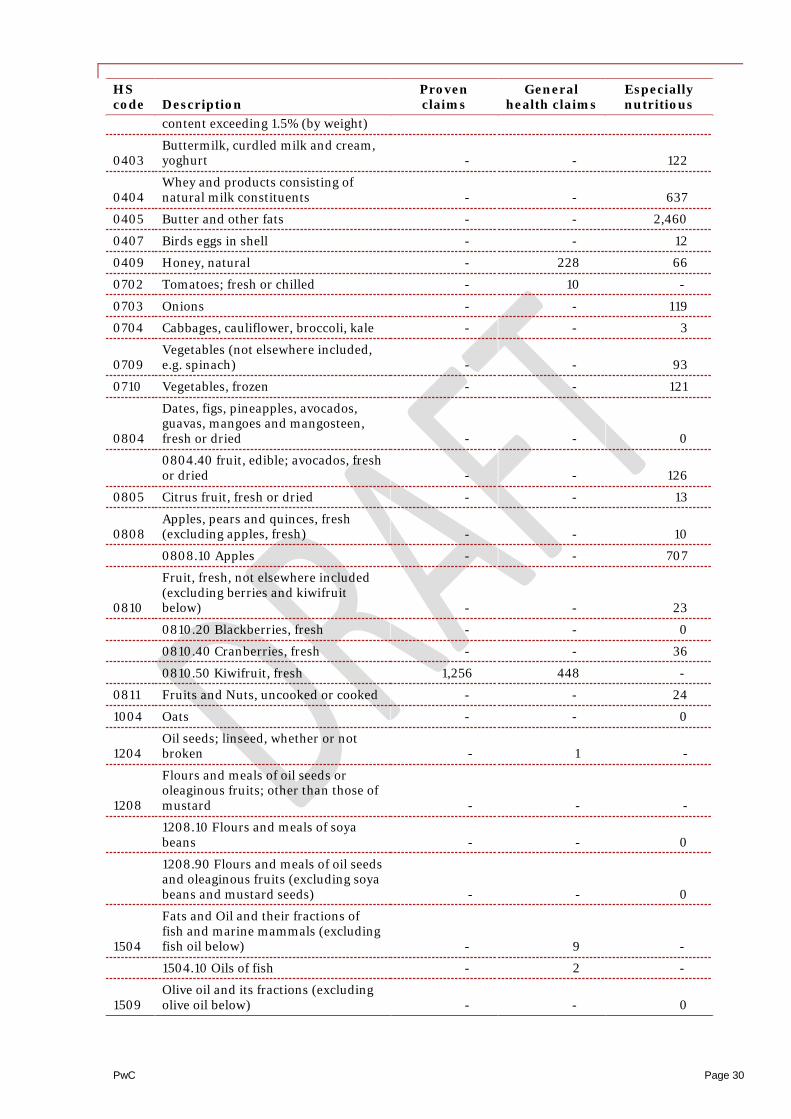
PwC Page 30
HS code Description
Proven claims
General health claims
Especially nutritious
content exceeding 1.5% (by weight)
0403 Buttermilk, curdled milk and cream, yoghurt - - 122
0404 Whey and products consisting of natural milk constituents - - 637
0405 Butter and other fats - - 2,460
0407 Birds eggs in shell - - 12
0409 Honey, natural - 228 66
0702 Tomatoes; fresh or chilled - 10 -
0703 Onions - - 119
0704 Cabbages, cauliflower, broccoli, kale - - 3
0709 Vegetables (not elsewhere included, e.g. spinach) - - 93
0710 Vegetables, frozen - - 121
0804
Dates, figs, pineapples, avocados, guavas, mangoes and mangosteen, fresh or dried - - 0
0804.40 fruit, edible; avocados, fresh or dried - - 126
0805 Citrus fruit, fresh or dried - - 13
0808 Apples, pears and quinces, fresh (excluding apples, fresh) - - 10
0808.10 Apples - - 707
0810
Fruit, fresh, not elsewhere included (excluding berries and kiwifruit below) - - 23
0810.20 Blackberries, fresh - - 0
0810.40 Cranberries, fresh - - 36
0810.50 Kiwifruit, fresh 1,256 448 -
0811 Fruits and Nuts, uncooked or cooked - - 24
1004 Oats - - 0
1204 Oil seeds; linseed, whether or not broken - 1 -
1208
Flours and meals of oil seeds or oleaginous fruits; other than those of mustard - - -
1208.10 Flours and meals of soya beans - - 0
1208.90 Flours and meals of oil seeds and oleaginous fruits (excluding soya beans and mustard seeds) - - 0
1504
Fats and Oil and their fractions of fish and marine mammals (excluding fish oil below) - 9 -
1504.10 Oils of fish - 2 -
1509 Olive oil and its fractions (excluding olive oil below) - - 0

PwC Page 31
HS code Description
Proven claims
General health claims
Especially nutritious
1509.10 Vegetable oils, olive oil, virgin - - 0
1512 Sunflower seed - - 0
1515
Fixed vegetable fats and oils and their fractions, whether or not refined but not chemically modified (excluding linseed oil and n.e.c below) - - 0
1515.11 Linseed oil and its fractions, crude - 1 -
1515.19 Linseed oil and its fractions, other than crude - 2 -
1515.90 Vegetable fats and oils and their fractions, n.e.c elsewhere in 1515 - - 7
1517 Margarine (excluding liquid margarine below) - - 2
1517.10 Margarine, liquid margarine - - 7
1605 Crustaceans, prepared or preserved (excluding mussels below) - 6 17
1605.53 Mussels, prepared or preserved - 2 6
1904
Prepared foods obtained by swelling or roasting cereals or cereal products (e.g. cornflakes) cereals in grain form of in the form of lakes or other worked grains, pre-cooked or otherwise prepared, n.e.c. - - 47
1905 Bread, pastry, cakes, biscuits, other bakers wares - - 145
2002 Tomatoes, prepared or preserved - 3 -
2008
Fruits, nuts, not elsewhere included, preparations (excluding cherries and cranberries) - - 39
2008.60 Fruit, cherries, prepared or preserved - - 0
2008.93 Fruit, cranberries, prepared or preserved - - 0
2009 Fruit juices and vegetable juices - - 78
2106
Food preparations, not elsewhere specified or included (excluding codes below) - - -
2106.10 Protein, concentrates and textured protein substances - - 2
2106.90 Food preparations; n.e.c. in item no. 2106.10 - - 926
Total 1,256 7,103 12,738 Source: Statistics New Zealand (Several years) Infoshare: Imports and exports, and PwC calculations. Note: Totals may be subject to rounding error.

PwC Page 32
Table 14 High-value nutrition export revenue for 2016, all selected product categories (percentage attribution of each product category)
HS code Description
Proven claims
General health claims
Especially nutritious
0201 Meat of bovine animals - - 100%
0202 Meat of bovine animals; frozen (frozen beef meat) - - 100%
0204 Meat of sheep or goats - - 100%
0302 Fish, fresh (excluding Pacific Salmon below) - 25% 75%
0302.13 Pacific salmon, fresh - 25% 75%
0303 Fish, frozen (excluding Pacific Salmon below) - 25% 75%
0303.11 Salmon, frozen - 25% 75%
0303.12 Salmon, frozen - 25% 75%
0304 Fish fillets (excluding Pacific Salmon below) - 25% 75%
0304.41 Salmon fillets, fresh - 25% 75%
0304.81 Salmon fillets, frozen - 25% 75%
0305 Fish, dried salted in brine smoked (excluding Pacific Salmon below) - 25% 75%
0305.41 Salmon, smoked - 25% 75%
0306 Crustaceans - 25% 75%
0307 Molluscs (excluding mussels below) - 25% 75%
0307.31 Mussels - 100% -
0307.39 Mussels - 100% -
0401 Milk and cream, not concentrated, not sweetened - - 100%
0402
Milk and cream, concentrated or sweetened (excluding powders below) - - 100%
040210 Dairy produce; milk and cream, concentrated or containing added sugar or other sweetening matter, in powder, granules or other solid forms, of a fat content not exceeding 1.5% (by weight) - 100% -
040221 Dairy produce; milk and cream, concentrated, not containing added sugar or other sweetening matter, in powder, granules or other solid forms, of a fat content exceeding 1.5% (by weight) - 100% -
040229 Dairy produce; milk and cream, containing added sugar or other sweetening matter, in powder, granules or other solid forms, of a fat content exceeding 1.5% (by weight) - - 100%
0403 Buttermilk, curdled milk and cream, yoghurt - - 100%
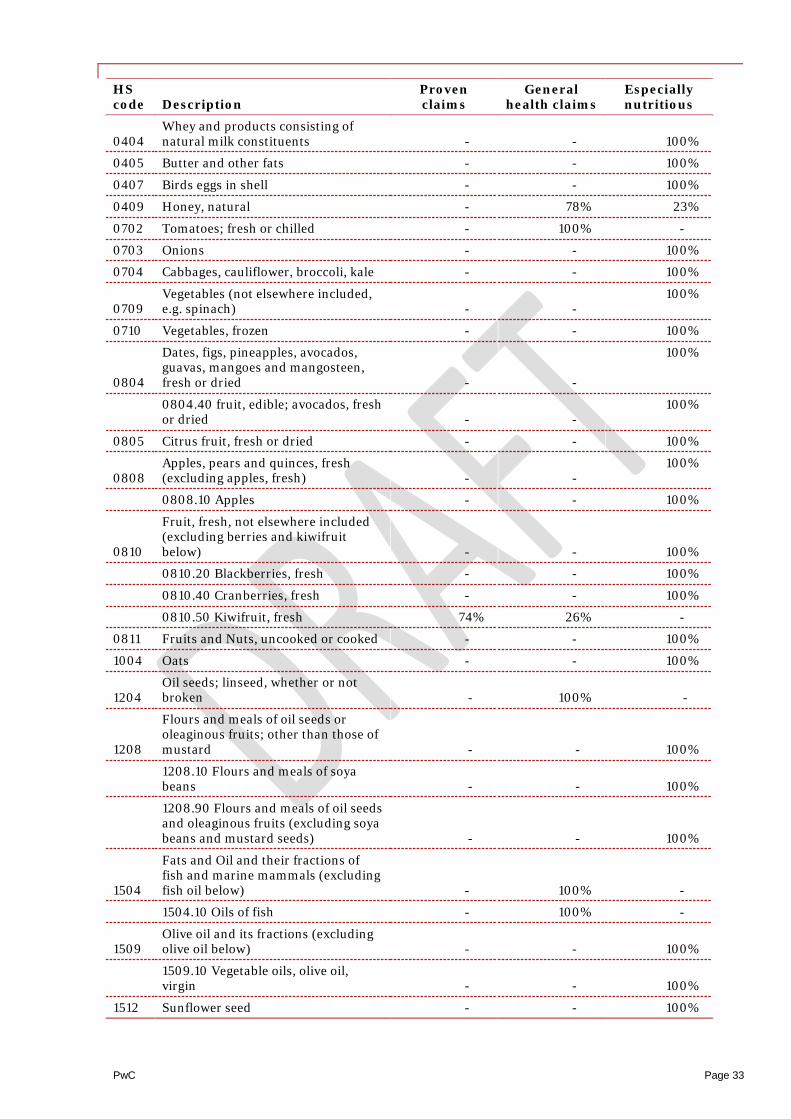
PwC Page 33
HS code Description
Proven claims
General health claims
Especially nutritious
0404 Whey and products consisting of natural milk constituents - - 100%
0405 Butter and other fats - - 100%
0407 Birds eggs in shell - - 100%
0409 Honey, natural - 78% 23%
0702 Tomatoes; fresh or chilled - 100% -
0703 Onions - - 100%
0704 Cabbages, cauliflower, broccoli, kale - - 100%
0709 Vegetables (not elsewhere included, e.g. spinach) - -
100%
0710 Vegetables, frozen - - 100%
0804
Dates, figs, pineapples, avocados, guavas, mangoes and mangosteen, fresh or dried - -
100%
0804.40 fruit, edible; avocados, fresh or dried - -
100%
0805 Citrus fruit, fresh or dried - - 100%
0808 Apples, pears and quinces, fresh (excluding apples, fresh) - -
100%
0808.10 Apples - - 100%
0810
Fruit, fresh, not elsewhere included (excluding berries and kiwifruit below) - - 100%
0810.20 Blackberries, fresh - - 100%
0810.40 Cranberries, fresh - - 100%
0810.50 Kiwifruit, fresh 74% 26% -
0811 Fruits and Nuts, uncooked or cooked - - 100%
1004 Oats - - 100%
1204 Oil seeds; linseed, whether or not broken - 100% -
1208
Flours and meals of oil seeds or oleaginous fruits; other than those of mustard - - 100%
1208.10 Flours and meals of soya beans - - 100%
1208.90 Flours and meals of oil seeds and oleaginous fruits (excluding soya beans and mustard seeds) - - 100%
1504
Fats and Oil and their fractions of fish and marine mammals (excluding fish oil below) - 100% -
1504.10 Oils of fish - 100% -
1509 Olive oil and its fractions (excluding olive oil below) - - 100%
1509.10 Vegetable oils, olive oil, virgin - - 100%
1512 Sunflower seed - - 100%

PwC Page 34
HS code Description
Proven claims
General health claims
Especially nutritious
1515
Fixed vegetable fats and oils and their fractions, whether or not refined but not chemically modified (excluding linseed oil and n.e.c below) - - 100%
1515.11 Linseed oil and its fractions, crude - 100% -
1515.19 Linseed oil and its fractions, other than crude - 100% -
1515.90 Vegetable fats and oils and their fractions, n.e.c elsewhere in 1515 - - 100%
1517 Margarine (excluding liquid margarine below) - - 100%
1517.10 Margarine, liquid margarine - - 100%
1605 Crustaceans, prepared or preserved (excluding mussels below) - 25% 75%
1605.53 Mussels, prepared or preserved - 25% 75%
1904
Prepared foods obtained by swelling or roasting cereals or cereal products (e.g. cornflakes) cereals in grain form of in the form of lakes or other worked grains, pre-cooked or otherwise prepared, n.e.c. - - 100%
1905 Bread, pastry, cakes, biscuits, other bakers wares - - 100%
2002 Tomatoes, prepared or preserved - 100% -
2008
Fruits, nuts, not elsewhere included, preparations (excluding cherries and cranberries) - - 100%
2008.60 Fruit, cherries, prepared or preserved - - 100%
2008.93 Fruit, cranberries, prepared or preserved - - 100%
2009 Fruit juices and vegetable juices - - 100%
2106
Food preparations, not elsewhere specified or included (excluding codes below) - - 100%
2106.10 Protein, concentrates and textured protein substances - - 100%
2106.90 Food preparations; n.e.c. in item no. 2106.10 - - 100%
Source: Statistics New Zealand (Several years) Infoshare: Imports and exports, and PwC calculations. Note: Percentage totals may be subject to rounding error.
PwC Page 35
Appendix C – Restrictions This report has been prepared solely for the purposed stated herein and should not be relied upon for any other purpose. We accept no liability to any party should it be used for any purpose other than that for which it was prepared.
To the fullest extent permitted by law, PwC accepts no duty of care to any third party in connection with the provision of this Report and/or any related information or explanation (together, the Information). Accordingly, regardless of the form of action, whether in contract, tort (including without limitation, negligence) or otherwise, and to the extent permitted by applicable law, PwC accepts no liability of any kind to any third party and disclaims all responsibility for the consequences of any third party acting or refraining to act in reliance on this Information.
We have not independently verified the accuracy of information provided to us, and have not conducted any form of audit in respect of the organization for which work is completed. Accordingly, we express no opinion on the reliability, accuracy, or completeness of the information provided to us and upon which we have relied.
The statements and opinions expressed herein have been made in good faith, and on the basis that all information relied upon is true and accurate in all material respects, and not misleading by reason of omission or otherwise.
The statements and opinions expressed in this Report are based on information available as at the date of the Report.
We reserve the right, but will be under no obligation, to review and amend our Report, if any additional information, which was in existence on the date of this Report, was not brought to our attention, or subsequently comes to light.
This Report is issued pursuant to the terms and conditions set out in our contract with the University of Auckland dated 29 June 2016.