KAY COUNTY SHALE SUBGRADE STABILIZATION REVISITEDdocs.trb.org/prp/13-1530.pdf · ... KAY COUNTY...
15
Nevels, et al 1 Title: KAY COUNTY SHALE SUBGRADE STABILIZATION REVISITED Submitted: 15 November 2012 (revised) Word Count: 3581 + 7 figures = 5331 Name: Joakim G. Laguros, Ph.D., P.E. Affiliation: David Ross Boyd Professor Emeritus, (formerly School of Civil Engineering and Environmental Science, University of Oklahoma Email: [email protected] Name: James B. Nevels, Jr., Ph.D., P.E. (corresponding author) Affiliation: Geotechnical Engineering Consultant (formerly Geotechnical Engineer/Branch Manager, Oklahoma Department of Transportation) Address: P.O. Box 636, Norman, OK 73070 Telephone: (405) 818-2897 Email: [email protected] Name: Curt Hayes Affiliation: (formerly geologist, Research and Development Division, Oklahoma Department of Transportation) Address: 1809 Edgewood Dr., Edmond, OK 73013 Telephone: (405) 341-1115 Email: [email protected] Name: Christopher R. Clarke, P.E. Affiliation: Geotechnical Laboratory Supervisor, Materials Division/Geotechnical Branch, Oklahoma Department of Transportation Address: 200 NE 21 st Street, Oklahoma City, OK 73105 Telephone: (405) 522-4994 Email: [email protected] Name: Scott O. Cosby Affiliation: Transportation Specialist II, Materials Division/Geotechnical Branch, Oklahoma Department of Transportation Address: 200 NE 21 st Street, Oklahoma City, OK 73105 Telephone: (405) 522-4996 Email: [email protected] TRB 2013 Annual Meeting Paper revised from original submittal.
Transcript of KAY COUNTY SHALE SUBGRADE STABILIZATION REVISITEDdocs.trb.org/prp/13-1530.pdf · ... KAY COUNTY...

Nevels, et al 1
Title: KAY COUNTY SHALE SUBGRADE STABILIZATION REVISITED
Submitted: 15 November 2012 (revised)
Word Count: 3581 + 7 figures = 5331
Name: Joakim G. Laguros, Ph.D., P.E.
Affiliation: David Ross Boyd Professor Emeritus,
(formerly School of Civil Engineering and Environmental Science, University of
Oklahoma
Email: [email protected]
Name: James B. Nevels, Jr., Ph.D., P.E. (corresponding author)
Affiliation: Geotechnical Engineering Consultant
(formerly Geotechnical Engineer/Branch Manager, Oklahoma Department of
Transportation)
Address: P.O. Box 636, Norman, OK 73070
Telephone: (405) 818-2897
Email: [email protected]
Name: Curt Hayes
Affiliation: (formerly geologist, Research and Development Division, Oklahoma Department
of Transportation)
Address: 1809 Edgewood Dr., Edmond, OK 73013
Telephone: (405) 341-1115
Email: [email protected]
Name: Christopher R. Clarke, P.E.
Affiliation: Geotechnical Laboratory Supervisor, Materials Division/Geotechnical Branch,
Oklahoma Department of Transportation
Address: 200 NE 21st Street, Oklahoma City, OK 73105
Telephone: (405) 522-4994
Email: [email protected]
Name: Scott O. Cosby
Affiliation: Transportation Specialist II, Materials Division/Geotechnical Branch, Oklahoma
Department of Transportation
Address: 200 NE 21st Street, Oklahoma City, OK 73105
Telephone: (405) 522-4996
Email: [email protected]
TRB 2013 Annual Meeting Paper revised from original submittal.
Nevels, et al 2
ABSTRACT
This paper presents a re-examination of a research project on US-77 in Kay County, Oklahoma
concerning chemical stabilization of an 8-inch compacted shale subbase layer completed in
1983. The primary focus of this paper was to examine the changes in the pavement surface
deflection and backcalculated modulus of the stabilized subbase layer within the project test
sections over time.
The original research project test sections were identified and tested with a trailer
mounted Falling Weight Deflectometer (FWD) unit in August 2010. The FWD deflection
survey performed in July 2000 and the original Benkelman beam deflection survey performed in
June 1985 following the original pavement construction were used in this pavement analysis.
The pavement had been overlain with two thin (1-inch and 11/2 inch) asphalt overlays.
The FWD deflection data was normalized by ratio of the new thickness to the original pavement
thickness so that the original Benkelman beam deflection data could be used. The pavement
analysis uses the two-layer Hogg model and three-layer model in the Modulus 6.0 software to
estimate the subgrade modulus and 8-inch stabilized subbase layer subgrade modulus
respectively.
The conclusions are the following: a) the pavement surface deflections indicate that the
stabilized subbase layer sections have relatively stiff subgrade support, b) the three-layer model
predicts a higher subbase layer modulus, and c) chemically stabilized subbase layers do not
significantly lose strength or degrade with time and can be depended on as part of the structural
section.
TRB 2013 Annual Meeting Paper revised from original submittal.
Nevels, et al 3
INTRODUCTION
This paper revisits a research project that was completed 28 years ago dealing with the soil
stabilization of shale materials used in a compacted subgrade. The purpose of the original
research project was to evaluate the effect that these different chemical soil stabilizers had on the
shale subgrade materials. The intent of this original research work was to use a significant
amount of chemical soil stabilizer on these problem shale materials and to evaluate the field
implementation of shale stabilization. At that time, the Oklahoma Department of Transportation
(ODOT) commonly used cement, hydrated lime, and Class C fly ash in their subgrade soil
stabilization work.
An exhaustive laboratory research study (Phase I) had been completed prior to the field
implementation phase on representative shale samples from the project site to assess the shale
properties. Phase I of the research project was completed in September 1984 under ODOT Study
No. 79-09-2 (1) supervised by the ODOT Research and Development Division and funded by the
Federal Highway Administration. The results of this laboratory study showed that 14 percent
cement, 4.5 percent quicklime (equivalent to 6.0 percent hydrated lime), and 25 percent fly ash
stabilized the shale subgrade soils. Supporting the use of these chemical soil stabilizers, previous
research using qualitative X-ray diffraction studies of Oklahoma shales showed substantial
decrease in the activity of the clay minerals as a result of stabilization (2). Phase II of the
research project dealt with the analysis of samples prepared during construction and those cored
from underneath the pavement section. Phase II of this research project was completed in July
1987 under ODOT Study No. 83-07-2 (3) supervised by the ODOT Research and Development
Division and funded by the Federal Highway Administration. The results of Phase II showed
significant amelioration of the engineering properties of the stabilized shale subgrade material, a
USCS CL material, as manifested by their plasticity, compressive and beam strength compared
to the raw (non-stabilized) shale material. Examination of the micrographs of the stabilized
shale samples revealed the same dense particle packing and reduction in void space as had been
seen in previous research in Oklahoma shale samples (4). Benkelman beam deflection
measurements were made following the completion of the finished subgrade and pavement
section on June 18, 1985 to verify improvement in deformation resistance.
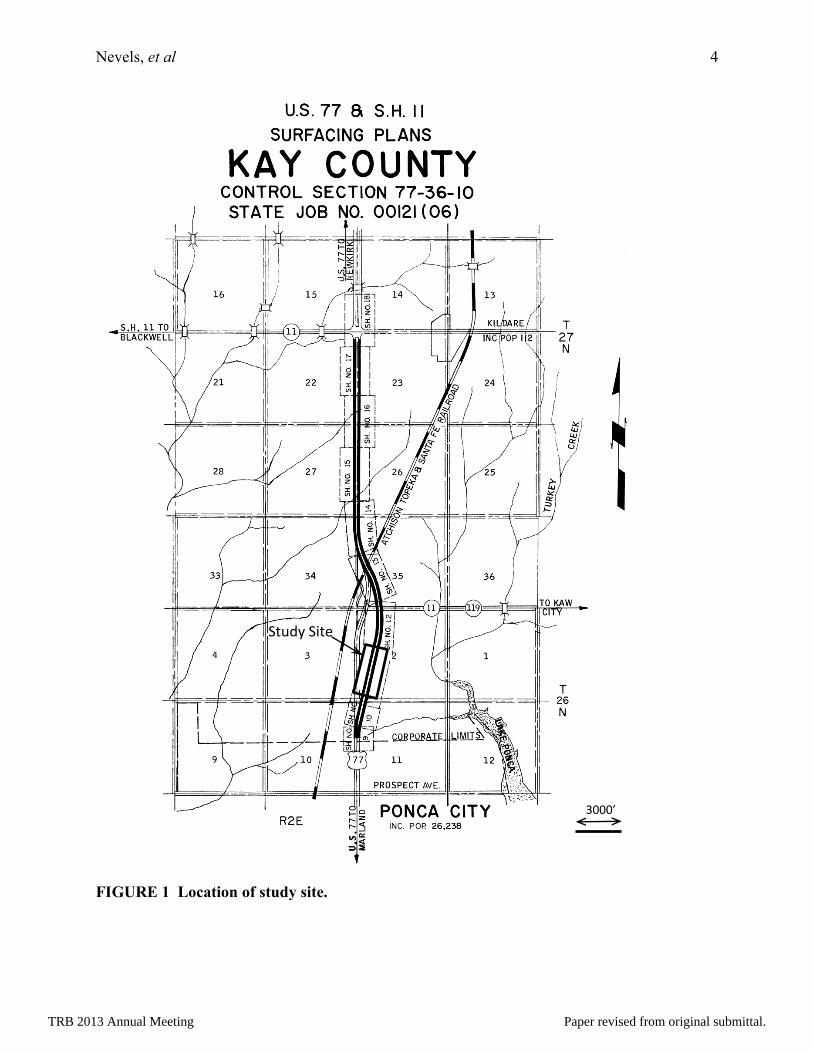
The project location was on a section of highway US-77 just north of Ponca City in Kay
County, Oklahoma, (see Figure 1). The study area (not plotted to scale) is immediately north of
Hubbard Road and approximately 1.125 miles north of Prospect Avenue shown in Figure 1. The
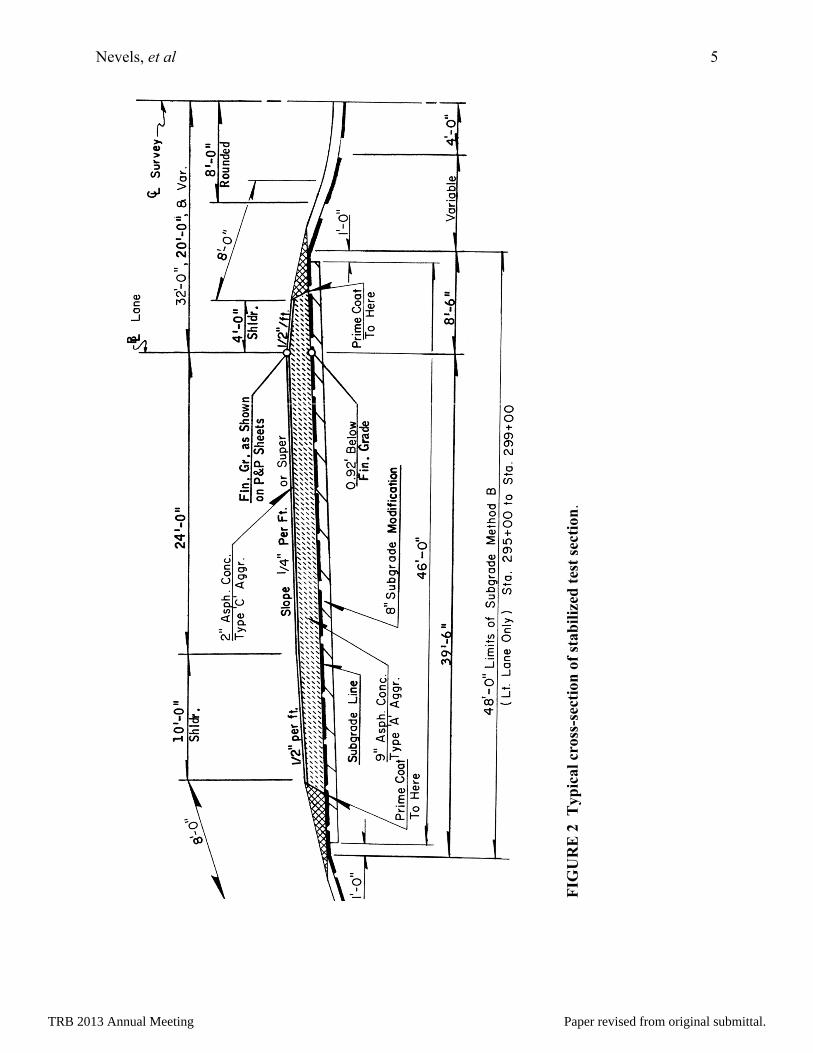
project typical plan design pavement section is presented in Figure 2. The pavement grade line is
at 0 to 1 percent grade. The site location is in a wet freeze-thaw cycling region of the Country.
The preliminary project design plans were initially developed in 1976 and finalized in
1981. The AASHTO Interim Guide for Design of Pavement Structures, 1972, Revised 1981(6)
was the pavement design document applicable for this project. The average daily traffic (ADT)
in 1976 was 4,900, and the estimated 20 year ADT was 9,900. According to the current 2010
ADT map (5), the ADT is 11,200. The appropriate regional factor for freeze-thaw for Kay
County (prescribed in the AASHTO Interim Guide for Design of Pavement Structures, 1972,
revised 1981) was applied.
The pavement performed very well over the years with no rutting or other pavement
roughness. The surface condition of the pavement at the test section did develop a significant
amount of random cracks that had to be sealed and maintained. The pavement maintenance was
limited for many years requiring only the sealing of the random occurring cracks. The original
pavement surface was overlain in 1998 with 1 inch of Type D asphalt and again in 2006 with a
TRB 2013 Annual Meeting Paper revised from original submittal.
Nevels, et al 4
FIGURE 1 Location of study site.
3000’
Study Site
TRB 2013 Annual Meeting Paper revised from original submittal.
Nevels, et al 5
FIG
UR
E 2
T
yp
ical
cross
-sec
tion
of
stab
iliz
ed t
est
secti
on
.
TRB 2013 Annual Meeting Paper revised from original submittal.
Nevels, et al 6
¾-inch of S6 leveling course and 1½-inch of S4 wearing course for a total overlay thickness of
2¼-inches. ODOT’s purpose of these thin pavement overlays was to maintain the structural
integrity due to the increased and future traffic loading.
The objective of this paper is to evaluate the overall pavement performance through the
years by looking at the changes in the surface deflection and the backcalculated modulus of the
stabilized 8-inch subbase layer by comparing deflection data at three time periods.
PROJECT DESCRIPTION
The fill material which constitutes the pavement subgrade was placed in 1980. It was a plastic
weathered shale material which belonged to the lower Wellington Formation of Permian
geologic age. This shale varied in color from yellowish gray to gray and grayish brown. The
AASHTO classification of the subgrade shale material ranged from A-7-6 (25) to A-7-6 (39),
and the plasticity index values varied from 26 to 37. Construction of the stabilized base course
test sections started on September 6, 1983.
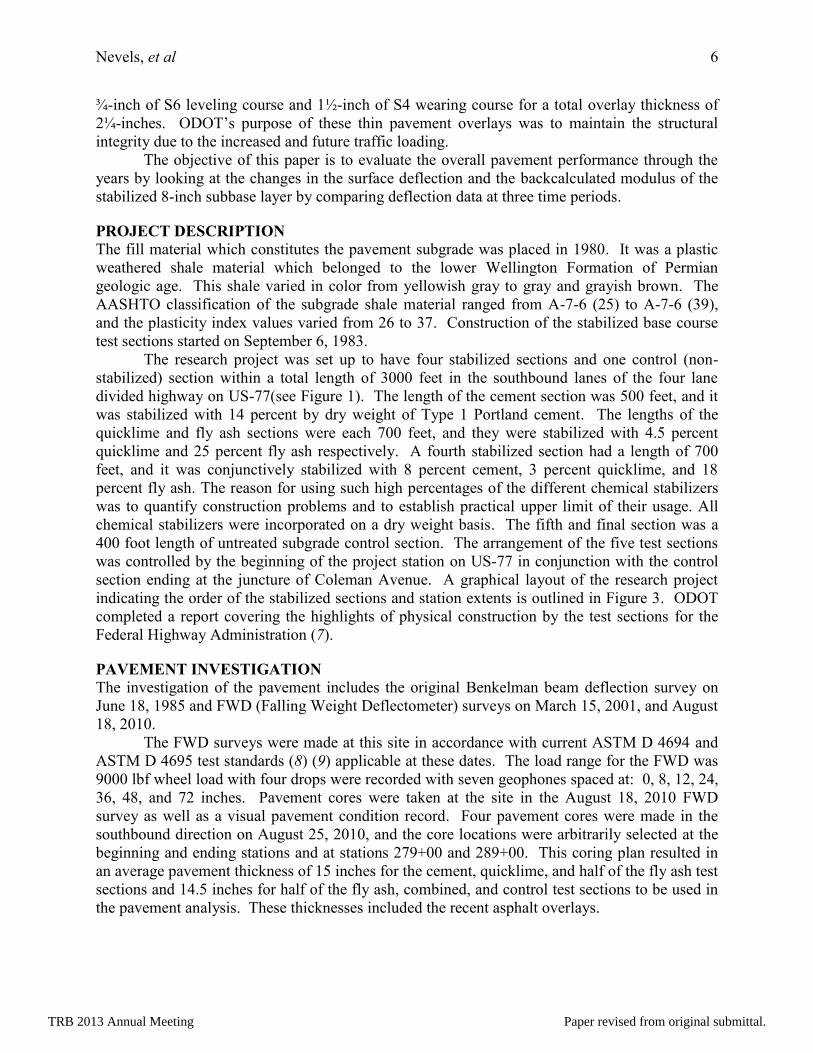
The research project was set up to have four stabilized sections and one control (non-
stabilized) section within a total length of 3000 feet in the southbound lanes of the four lane
divided highway on US-77(see Figure 1). The length of the cement section was 500 feet, and it
was stabilized with 14 percent by dry weight of Type 1 Portland cement. The lengths of the
quicklime and fly ash sections were each 700 feet, and they were stabilized with 4.5 percent
quicklime and 25 percent fly ash respectively. A fourth stabilized section had a length of 700
feet, and it was conjunctively stabilized with 8 percent cement, 3 percent quicklime, and 18
percent fly ash. The reason for using such high percentages of the different chemical stabilizers
was to quantify construction problems and to establish practical upper limit of their usage. All
chemical stabilizers were incorporated on a dry weight basis. The fifth and final section was a
400 foot length of untreated subgrade control section. The arrangement of the five test sections
was controlled by the beginning of the project station on US-77 in conjunction with the control
section ending at the juncture of Coleman Avenue. A graphical layout of the research project
indicating the order of the stabilized sections and station extents is outlined in Figure 3. ODOT
completed a report covering the highlights of physical construction by the test sections for the
Federal Highway Administration (7).
PAVEMENT INVESTIGATION
The investigation of the pavement includes the original Benkelman beam deflection survey on
June 18, 1985 and FWD (Falling Weight Deflectometer) surveys on March 15, 2001, and August
18, 2010.
The FWD surveys were made at this site in accordance with current ASTM D 4694 and
ASTM D 4695 test standards (8) (9) applicable at these dates. The load range for the FWD was
9000 lbf wheel load with four drops were recorded with seven geophones spaced at: 0, 8, 12, 24,
36, 48, and 72 inches. Pavement cores were taken at the site in the August 18, 2010 FWD
survey as well as a visual pavement condition record. Four pavement cores were made in the
southbound direction on August 25, 2010, and the core locations were arbitrarily selected at the
beginning and ending stations and at stations 279+00 and 289+00. This coring plan resulted in
an average pavement thickness of 15 inches for the cement, quicklime, and half of the fly ash test
sections and 14.5 inches for half of the fly ash, combined, and control test sections to be used in
the pavement analysis. These thicknesses included the recent asphalt overlays.
TRB 2013 Annual Meeting Paper revised from original submittal.
Nevels, et al 7
FIG
UR
E 3
L
oca
tion
of
test
sect
ion
s.
TRB 2013 Annual Meeting Paper revised from original submittal.
Nevels, et al 8
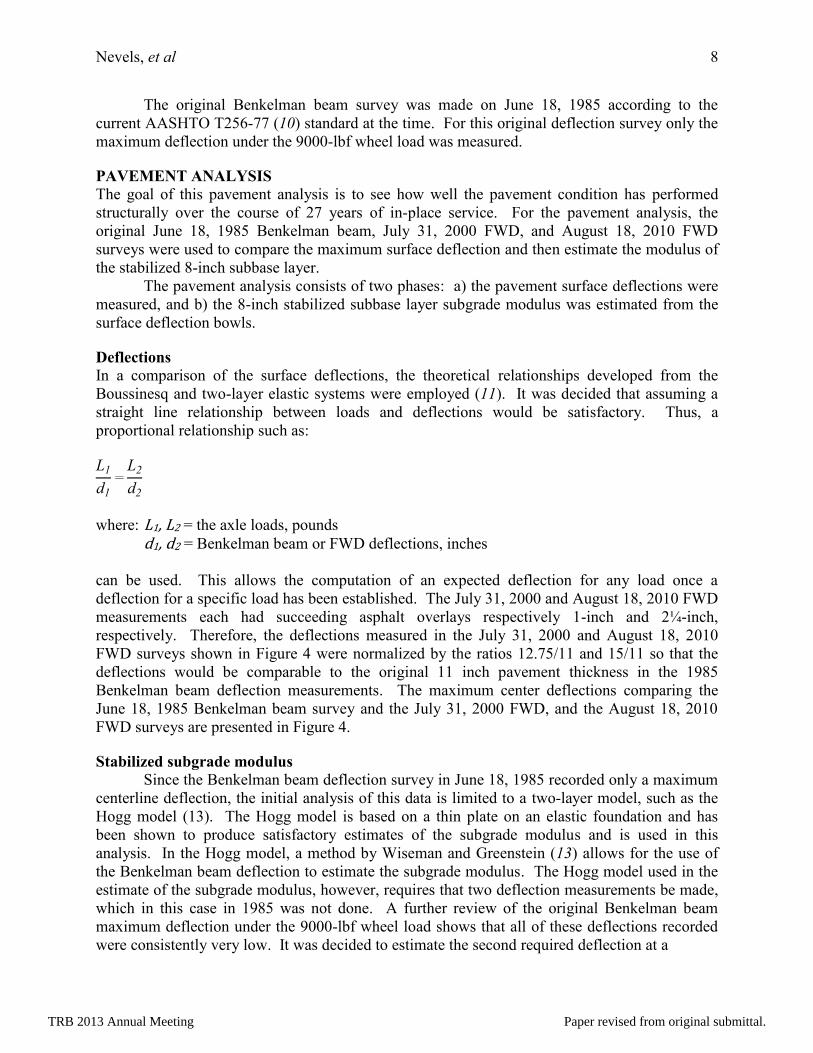
The original Benkelman beam survey was made on June 18, 1985 according to the
current AASHTO T256-77 (10) standard at the time. For this original deflection survey only the
maximum deflection under the 9000-lbf wheel load was measured.
PAVEMENT ANALYSIS
The goal of this pavement analysis is to see how well the pavement condition has performed
structurally over the course of 27 years of in-place service. For the pavement analysis, the
original June 18, 1985 Benkelman beam, July 31, 2000 FWD, and August 18, 2010 FWD
surveys were used to compare the maximum surface deflection and then estimate the modulus of
the stabilized 8-inch subbase layer.
The pavement analysis consists of two phases: a) the pavement surface deflections were
measured, and b) the 8-inch stabilized subbase layer subgrade modulus was estimated from the
surface deflection bowls.
Deflections
In a comparison of the surface deflections, the theoretical relationships developed from the
Boussinesq and two-layer elastic systems were employed (11). It was decided that assuming a
straight line relationship between loads and deflections would be satisfactory. Thus, a
proportional relationship such as:
where: L1, L2 = the axle loads, pounds
d1, d2 = Benkelman beam or FWD deflections, inches
can be used. This allows the computation of an expected deflection for any load once a
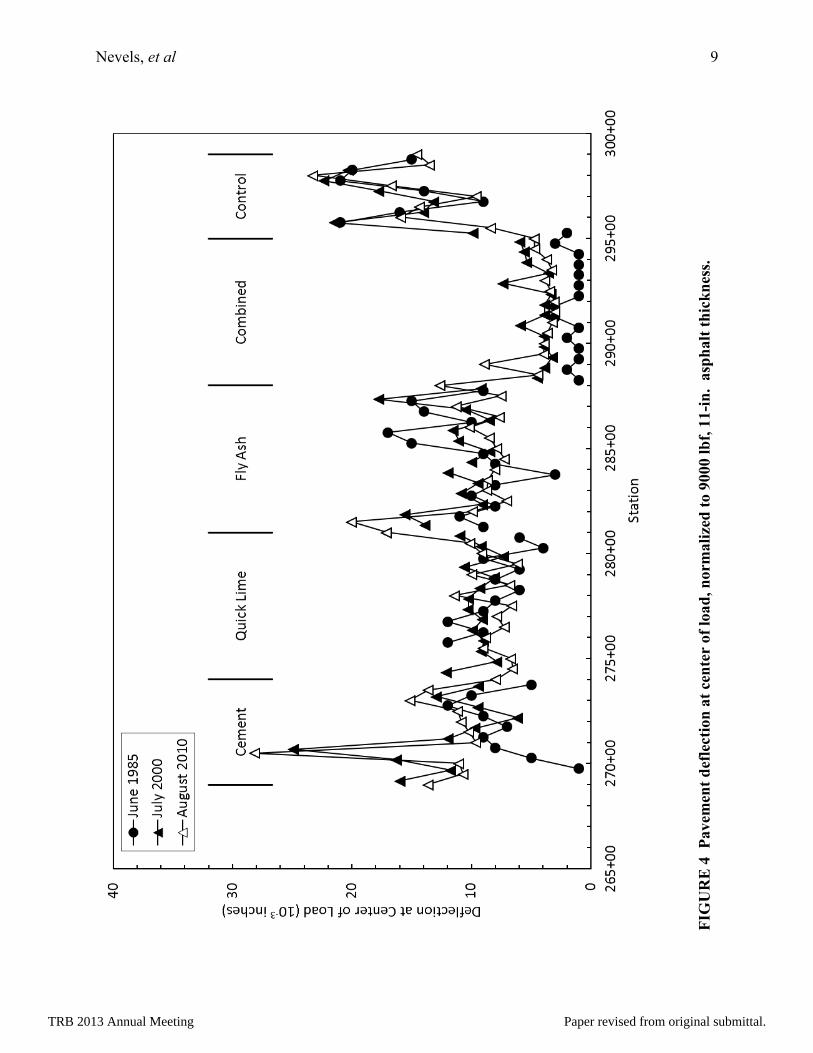
deflection for a specific load has been established. The July 31, 2000 and August 18, 2010 FWD
measurements each had succeeding asphalt overlays respectively 1-inch and 2¼-inch,
respectively. Therefore, the deflections measured in the July 31, 2000 and August 18, 2010
FWD surveys shown in Figure 4 were normalized by the ratios 12.75/11 and 15/11 so that the
deflections would be comparable to the original 11 inch pavement thickness in the 1985
Benkelman beam deflection measurements. The maximum center deflections comparing the
June 18, 1985 Benkelman beam survey and the July 31, 2000 FWD, and the August 18, 2010
FWD surveys are presented in Figure 4.
Stabilized subgrade modulus
Since the Benkelman beam deflection survey in June 18, 1985 recorded only a maximum
centerline deflection, the initial analysis of this data is limited to a two-layer model, such as the
Hogg model (13). The Hogg model is based on a thin plate on an elastic foundation and has
been shown to produce satisfactory estimates of the subgrade modulus and is used in this
analysis. In the Hogg model, a method by Wiseman and Greenstein (13) allows for the use of
the Benkelman beam deflection to estimate the subgrade modulus. The Hogg model used in the
estimate of the subgrade modulus, however, requires that two deflection measurements be made,
which in this case in 1985 was not done. A further review of the original Benkelman beam
maximum deflection under the 9000-lbf wheel load shows that all of these deflections recorded
were consistently very low. It was decided to estimate the second required deflection at a
TRB 2013 Annual Meeting Paper revised from original submittal.
Nevels, et al 9
FIG
UR
E 4
P
avem
ent
def
lecti
on
at
cen
ter
of
loa
d, n
orm
ali
zed
to 9
000 l
bf,
11
-in
. a
sph
alt
th
ick
nes
s.
TRB 2013 Annual Meeting Paper revised from original submittal.
Nevels, et al 10
FIG
UR
E 5
B
ack
calc
ula
ted
mod
uli
usi
ng 2
-layer
mod
el, se
mi-
infi
nit
e d
epth
.
TRB 2013 Annual Meeting Paper revised from original submittal.

Nevels, et al 11
FIG
UR
E 6
S
tati
stic
al
dis
trib
uti
on
of
mod
ulu
s valu
es.
TRB 2013 Annual Meeting Paper revised from original submittal.
Nevels, et al 12
FIG
UR
E 7
C
om
pari
son
of
mod
uli
calc
ula
ted
usi
ng 2
-layer
ver
sus
3-l
ayer
mod
el, A
ugu
st 2
01
0.
TRB 2013 Annual Meeting Paper revised from original submittal.
Nevels, et al 13
location within the characteristic length of 100 cm (39.4 in.) at 40 percent of the maximum
deflection in order to evaluate the stabilized subgrade modulus by using the Hogg model. The
rational for using 40 percent of the maximum deflection was based on Benkelman procedures
that would have a second deflection measurement to be located between 40 and 80 cm (14).
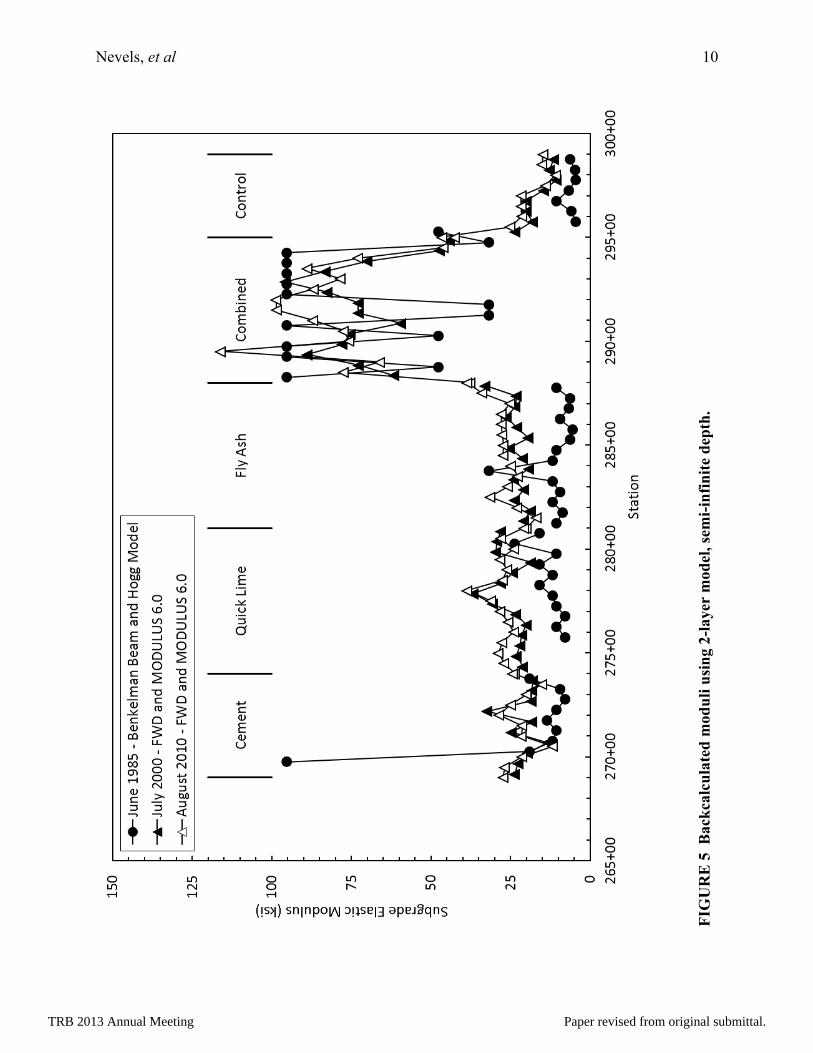
The subgrade modulus was first estimated for a two-layer model by two methods: a) the
Hogg model used for the original June 18, 1985 Benkelman beam deflection survey and b) the
Modulus 6.0 software (12) by TTI was used for the July 31, 2000 and the August 18, 2010 FWD
deflection surveys. The subgrade modulus versus the test section station extents comparing the
June 18, 1985 Benkelman Beam deflection survey with the July 31, 2000 FWD, and the August
18, 2010 FWD deflection measurements are presented in Figure 5. The statistical distribution of
the backcalculated subgrade moduli is shown in Figure 6.
The subgrade modulus shown in Figure 5 includes both the subgrade modulus of the 8-
inch stabilized subbase layer along with the underlying subgrade modulus. Again the two-layer
Hogg model was used because the original Benkelman beam deflection measurements cannot
estimate multilayer subgrade moduli.
Since the subgrade modulus profiles based on the two FWD surveys for the two-layer
model presented in Figure 5 are very similar, the August 18, 2010 FWD deflection profile was
selected for use in a three-layer model in the Modulus 6.0 software to further identify the
subgrade modulus of the 8-inch stabilized subbase layer. Note that the subgrade modulus profile
using the Benkelman beam deflection data is not as accurate in estimating the subgrade modulus
in a two-layer model as the two FWD surveys and therefore is not considered in further analysis.
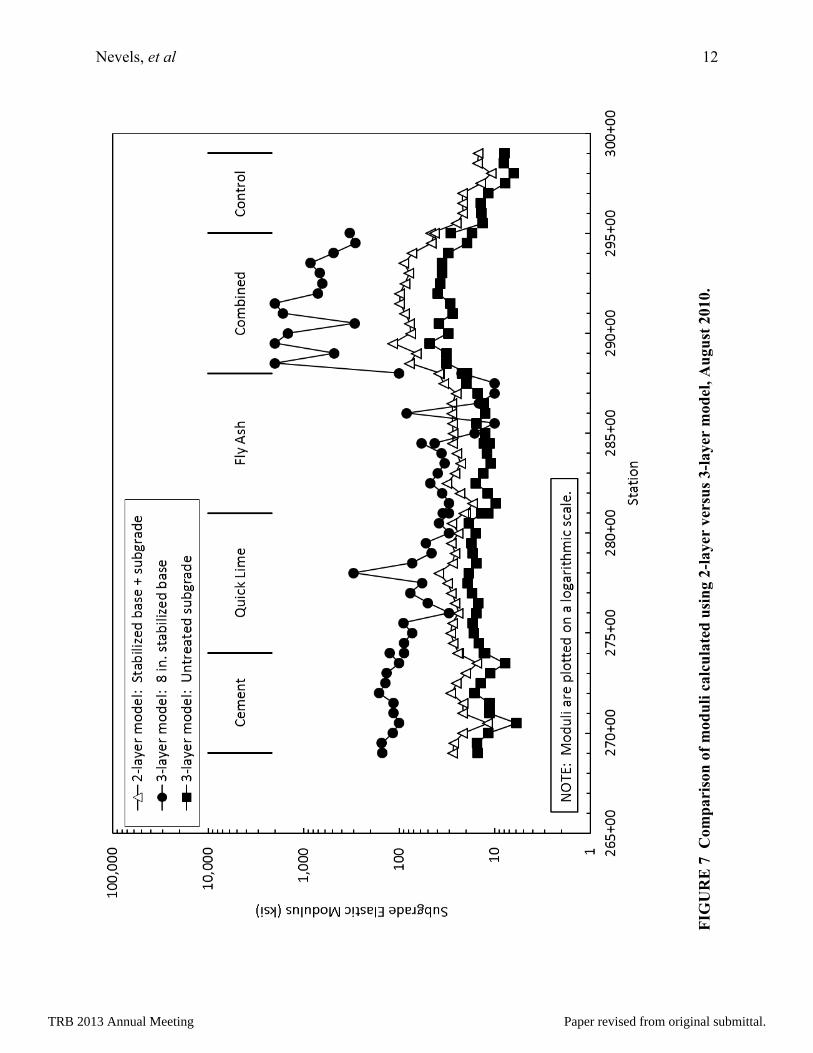
In the backcalculation of the subgrade modulus of the 8-inch stabilized subbase layer, the
pavement thickness varies as noted earlier as required by the AASHTO/Modulus segmented
station core location criteria over the length of the test sections. In Figure 7 the three-layer
model using in the Modulus 6.0 software for data derived from the August 2010 FWD deflection
profile indicates the subgrade modulus of the 8-inch subbase layer. Also shown in Figure 7 is
the two-layer subgrade modulus of the 8-inch stabilized subbase layer plus the underlying
subgrade from Figure 5.
Data analysis
Considering the surface deflections shown in Figure 4, the pavement surface deflections
measured in the original 1985 Benkelman beam survey and in the July 31, 2000 and August 18,
2010 FWD surveys have not deviated considerably. What is of note pertaining to the deflection
profiles shown in Figure 4 are the following: a) for the cement, quick lime, and cement test
sections the average deflection ranges approximately between 8 and 12 x 10-3
inches discounting
the spikes, b) for the combined test section the deflection ranges approximately between 0.5 and
2.5 x 10⁻³
inches, and c) for the control test section the deflection ranges between 9 and 22 x 10-3
inches. The stiffness of the stabilized 8-inch subbase layer is contributing to a lower pavement
deflection within the study extent.
Considering the backcalculated subgrade modulus (8-inch stabilized subbase layer along
with the underlying subgrade modulus) profiles for the two-layer model presented in Figure 5 for
the two FWD surveys are the following: a) for the subgrade modulus profiles for the cement,
quick lime, and cement test sections have a very narrow range between 20 and 35 ksi and b) for
the subgrade modulus profile for the combined test section, the range is approximately between
70 and 120 ksi. For the control test section, the subgrade modulus range is between 10 and 25
ksi in the two FWD surveys. The backcalculated subgrade modulus estimated by the Hogg two-
layer model for the Benkelman beam survey falls short of the FWD surveys except only in the
TRB 2013 Annual Meeting Paper revised from original submittal.

Nevels, et al 14
combined test section where the subgrade modulus is comparable. The subgrade modulus
estimated by the 1985 Benkelman beam survey does serve as a base line.
In Figure 7 the subgrade modulus of the 8-inch subbase layer is further distinguished
from the underlying untreated subgrade modulus in a three-layer model. Plotted also in Figure 7
is the subgrade modulus for the August 2010 two-layer model which includes the 8-inch
stabilized subbase layer modulus plus the underlying subgrade modulus from Figure 5. Some
variation can now be seen in Figure 7 between the cement, quick lime, and fly ash test sections
with the fly ash test section showing the larger range in the 8-inch stabilized subbase layer
modulus in the three-layer model. Again the combined test section indicates the highest range in
the 8-inch stabilized subbase layer modulus.
CONCLUSION
Based on the results of the surface deflections measured and the estimated backcalculated
subgrade modulus the following conclusions can be made:
The pavement surface deflections indicate that the cement, quick lime, and fly ash test
sections have a relatively stiff subgrade support. In the combined test section the
deflections indicate simply a very rigid subgrade support. The control test section shows
much higher and greater variability in deflections which were anticipated. It can be
concluded that the pavement surface deflections have not changed much with time.
Based on a comparison between the two and three-layer models presented in Figure 7
August 2010 data, the subgrade modulus for the 8-inch stabilized subbase layer shows a
higher modulus for the cement, quick lime, fly ash, and combined test sections for the
three-layer model compared with the two-layer model. Splitting the fly ash section in
two subsections based on segmented station core location requirement resulted in only a
slight deviation in increased modulus trend. The subgrade modulus for the 8-inch
stabilized subbase layer is substantially higher than the untreated subgrade in the three-
layer model.
A reasonable conclusion in the data analysis is that the subgrade modulus of the 8-inch
stabilized subbase layer based on the results shown in Figures 5 and 6 has not changed
significantly with time. This study supports the theory that chemically stabilized subbase
layers do not significantly lose strength or degrade with time and can be depended on as
part of the structural section. The subgrade modulus estimated by the 1985 Benkelman
beam survey in the two-layer Hogg model represents a minimum baseline.
REFERENCES
1. Laguros, J. G., and R. Medhani. Stabilization of Oklahoma Shales: Field
Implementation Phases. ODOT Study No. 79-09-2. School of Civil Engineering and
Environmental Science, University of Oklahoma, Norman, Oklahoma, 1984.
2. Laguros, J. G. Predictability of Physical Changes of Clay Forming Materials in
Oklahoma. Report No. ODOT 68-03-2. School of Civil Engineering and Environmental
Science, University of Oklahoma, Norman, Oklahoma, 1972.
3. Laguros, J. G., and M. S. Keshawarz. Construction and Performance of the Stabilized
Base Course on US-77 Ponca City, Kay County. ODOT Study No. 83-07-2. School of
Civil Engineering and Environmental Science, University of Oklahoma, Norman,
Oklahoma, 1987.
TRB 2013 Annual Meeting Paper revised from original submittal.

Nevels, et al 15
4. Laguros, J. G., and K. Jha. Stabilization of Oklahoma Shales. Report No. ODOT 73-04-
2, ORA 158-602. School of Civil Engineering and Environmental Science, University of
Oklahoma, Norman, Oklahoma, 1977.
5. 2010 Annual Average Daily Traffic. Planning and Research Division, Oklahoma
Department of Transportation, Oklahoma City, Oklahoma, 2010.
6. AASHTO Interim Guide for Design of Pavement Structures 1972, Chapter III Revised,
1981, American Association of State Highway and Transportation Officials, Washington
D.C., 1981.
7. Hayes, C. J. Class C Fly Ash Modified Subgrade. Research and Development Division,
Oklahoma Department of Transportation, Oklahoma City, Oklahoma, 1985.
8. ASTM D 4694-96, American Society for Testing and Materials, Part II, Volume 04.03,
June 2000 and November 2009.
9. ASTM D 4695, American Society for Testing and Materials, Part II, Volume 04.03, June
2000 and December 2003.
10. AASHTO T256-77, American Association of State Highway and Transportation
Officials, Part II Volume 13, Methods of Sampling and Testing, July 1982.
11. Pavement Deflection Analysis. NHI Course No. 13127, FHWA-HI-94-021. FHWA,
U.S. Department of Transportation, Washington, D.C., 1994.
12. Modulus 6.0, for Windows: User’s Manual. Report 0-1869-2. Texas Transportation
Institute, College Station, Texas, 2001.
13. Wiseman, G., and J. Greenstein. Comparison of Methods of Determining Pavement
Parameters from Deflection Bowl Measurements. In Proceedings of the 7th Asian
Regional Conference on Soil Mechanics and Foundation Engineering, 1983, pp. 158-
165.
14. Berger, L. and J. Greenstein. Use of Pocket Computers for Rehabilitation of Rural Roads
in Dominica. In Transportation Research Record, No. 997, Transportation Research
Board of the National Academies, Washington D.C., 1984, pp. 90-98.
TRB 2013 Annual Meeting Paper revised from original submittal.