
Global Action Plan for Prevention and Control of Pneumonia (GAPP)

� � � � � � � � � � � � � � � � � � � � � � � � � � � � � � � � � � � � � � � � � � � � � � � � � � � � � � � � � � � � � � � � � � � � � � � � � � � � � � � � � � � � � � � � � � � � � � � � � � � � � � � � � � �
��
��
�
1

� � � � � � � � � � � � � � � � � � � � � � � � � � � � � � � � � � � � � � � � � � � � � � � � � � � � � � � � � � � � � � � � � � � � � � � � � � � � � � � � � � � � � � � � � � � � � � � � � � � � � � � � � � �
“Jumping the Gapp”
��
��
�
Gerwin HendriksenTechnical ArchitectAMIS Services BV, The Netherlandshttp://www.amis.nl
[email protected]. 2.6
Problem Solution
© G. Hendriksen 2008
DISALLOWED CHANGE / TRACING

� � � � � � � � � � � � � � � � � � � � � � � � � � � � � � � � � � � � � � � � � � � � � � � � � � � � � � � � � � � � � � � � � � � � � � � � � � � � � � � � � � � � � � � � � � � � � � � � � � � � � � � � � � �
Who I am…
� Started as DBA at Dedicate (later called Parity) for 1.5 years
� Worked for 5 years at Oracle The Netherlands� First 1.5 year as RDBMS analyst� Rest worked as ARE EBS Performance and RAC
��
��
�
• This included Content Lead of EBS with RAC world wide
� Worked for 2 years at IBM� Business Consultancy Services
� Now working for almost 2 years at AMIS Services BV in the Netherlands (tech. blog is well known)� Technical Architect

� � � � � � � � � � � � � � � � � � � � � � � � � � � � � � � � � � � � � � � � � � � � � � � � � � � � � � � � � � � � � � � � � � � � � � � � � � � � � � � � � � � � � � � � � � � � � � � � � � � � � � � � � � �
Agenda…
� What Means GAPP ??� Introduction To The Practical Case� Wait Time And Method-R� Telling A Story� The GAPP Analyses
��
��
�
� The GAPP Analyses� GAPP Used In Service Oriented Architectures� Conclusions� Q/A

� � � � � � � � � � � � � � � � � � � � � � � � � � � � � � � � � � � � � � � � � � � � � � � � � � � � � � � � � � � � � � � � � � � � � � � � � � � � � � � � � � � � � � � � � � � � � � � � � � � � � � � � � � �
What Means GAPP…
http://carymillsap.blogspot.com/2008/02/how-ofa-began-part-1.html
Marketing Rule #1: If it doesn't have a name, it doesn't exist.
� To be able to talk about the approach I need to have a name, see a post of Cary Millsap:
��
��
�
“General Approach Performance Profiling”- in short -“GAPP”

� � � � � � � � � � � � � � � � � � � � � � � � � � � � � � � � � � � � � � � � � � � � � � � � � � � � � � � � � � � � � � � � � � � � � � � � � � � � � � � � � � � � � � � � � � � � � � � � � � � � � � � � � � �
Jumping The Gap With GAPP…
jumping the GAPP…
Working….
��
��
�
Problem Solution
© G. Hendriksen 2008
DISALLOWED CHANGE / TRACINGToo slow….
No way to pinpoint where the problem is the regular way….
Coming up with a solution….

� � � � � � � � � � � � � � � � � � � � � � � � � � � � � � � � � � � � � � � � � � � � � � � � � � � � � � � � � � � � � � � � � � � � � � � � � � � � � � � � � � � � � � � � � � � � � � � � � � � � � � � � � � �
Introduction To The Practical Case
��
��
�
Practical Case

� � � � � � � � � � � � � � � � � � � � � � � � � � � � � � � � � � � � � � � � � � � � � � � � � � � � � � � � � � � � � � � � � � � � � � � � � � � � � � � � � � � � � � � � � � � � � � � � � � � � � � � � � � �
Coming in at the Customer Site…
� Coming in at a customer with the assignment to find proof for certain performance bottlenecks.� The most important business process had a
performance with a high variance, and on occasion an unacceptable performance.
��
��
�
� The most important business process was: � Login to an E-Banking application should never take
longer than 5 seconds to complete.� When taking more than 5 seconds, old bank account
balance information is provided.

� � � � � � � � � � � � � � � � � � � � � � � � � � � � � � � � � � � � � � � � � � � � � � � � � � � � � � � � � � � � � � � � � � � � � � � � � � � � � � � � � � � � � � � � � � � � � � � � � � � � � � � � � � �
The high variance in response time…
60
70
80
90
100
Perc
enta
ge
Percentage logins (PCT_GT_5SEC) which took longer than 5 seconds:
��
��
�
0
10
20
30
40
50
PCT_GT_5SEC
Time

� � � � � � � � � � � � � � � � � � � � � � � � � � � � � � � � � � � � � � � � � � � � � � � � � � � � � � � � � � � � � � � � � � � � � � � � � � � � � � � � � � � � � � � � � � � � � � � � � � � � � � � � � � �
What was going on…
� Not able to change anything in the application.� Not allowed to trace (only very limited)� A Test environment, not resembling the
production system.� The architecture is complex due to the high
��
��
�
� The architecture is complex due to the high amount of different technologies and tiers� Two Oracle 9.2.0.6 databases� DB2 with LDAP� Web Sphere� Generated SQL (CoolGen)� Etc.

� � � � � � � � � � � � � � � � � � � � � � � � � � � � � � � � � � � � � � � � � � � � � � � � � � � � � � � � � � � � � � � � � � � � � � � � � � � � � � � � � � � � � � � � � � � � � � � � � � � � � � � � � � �
What data was available to use…
� From the system there was months of system metrics’ available in nmon files.� Nigels Monitoring Tool (not officially supported by IBM)� Measurement on 5 minutes snapshot base
� From the business process were percentages available, how many times the response time (R)
��
��
�
available, how many times the response time (R) was above 5 seconds� Moniforce Data by external party� Measurement on 5 minutes snapshot base
� Stats pack data was available on the backend database.

� � � � � � � � � � � � � � � � � � � � � � � � � � � � � � � � � � � � � � � � � � � � � � � � � � � � � � � � � � � � � � � � � � � � � � � � � � � � � � � � � � � � � � � � � � � � � � � � � � � � � � � � � � �
Data Sources…
Front end back end “ E ” “ Q “
Network
��
��
�
Front end machine
back end machine
Web UsersStorage
SAN
“ E ” “ Q “
© Drawing by G. Hendriksen 2008
(Moniforce Data = R)
(NMON Data) (NMON Data)

� � � � � � � � � � � � � � � � � � � � � � � � � � � � � � � � � � � � � � � � � � � � � � � � � � � � � � � � � � � � � � � � � � � � � � � � � � � � � � � � � � � � � � � � � � � � � � � � � � � � � � � � � � �
What can GAPP do…
� Based on the available data, able to find out due to what in the (SOA) architecture the high variance in R was caused.
� In the end able to predict R from the business process, only based on available metrics’
��
��
�
� Jump the Gap:� Not allowed to trace� Not allowed to change anything in the application� Not having a representative test environment

� � � � � � � � � � � � � � � � � � � � � � � � � � � � � � � � � � � � � � � � � � � � � � � � � � � � � � � � � � � � � � � � � � � � � � � � � � � � � � � � � � � � � � � � � � � � � � � � � � � � � � � � � � �
Wait Time And Method-R
��
��
�
Method-R

� � � � � � � � � � � � � � � � � � � � � � � � � � � � � � � � � � � � � � � � � � � � � � � � � � � � � � � � � � � � � � � � � � � � � � � � � � � � � � � � � � � � � � � � � � � � � � � � � � � � � � � � � � �
Method-R and the sequence diagram…
AS NET DS SAN STOR • The Business Processes are shown in different colors.
• R=S+W or R=R1+R2+…
• Response Time (R)
• Service Time (S)
• Wait Time (W)
R
R
R
Tiers
��
��
�
R
R
R
RW
S
© Diagram by G. Hendriksen 2008, original diagram idea by Hotsos
Time Time Time

� � � � � � � � � � � � � � � � � � � � � � � � � � � � � � � � � � � � � � � � � � � � � � � � � � � � � � � � � � � � � � � � � � � � � � � � � � � � � � � � � � � � � � � � � � � � � � � � � � � � � � � � � � �
Highlighted the “Red” process…
AS NET DS SAN STOR
R R
W STiers
��
��
�
© Diagram by G. Hendriksen 2008, original diagram idea by Hotsos
Time Time Time Time

� � � � � � � � � � � � � � � � � � � � � � � � � � � � � � � � � � � � � � � � � � � � � � � � � � � � � � � � � � � � � � � � � � � � � � � � � � � � � � � � � � � � � � � � � � � � � � � � � � � � � � � � � � �
Increasing Response Time…
R
W S
Rslow
W S• “Service Time” stays within
limits the same, given the fact that the process is doing every time something similar.
• “Wait Time” is caused by
��
��
�
• “Wait Time” is caused by resource business
• “Wait Time” is causing the significant part of the variance in R
© Diagram by G. Hendriksen 2008, original diagram idea by Hotsos
Time Time

� � � � � � � � � � � � � � � � � � � � � � � � � � � � � � � � � � � � � � � � � � � � � � � � � � � � � � � � � � � � � � � � � � � � � � � � � � � � � � � � � � � � � � � � � � � � � � � � � � � � � � � � � � �
Illustrative M/M/m Model Simplified…
6
7
8
9
10
1 Channel
2 Channels
4 Channels
6 channels
8 Channels
m
Res
pons
e tim
e (s
econ
ds)
��
��
�
0
1
2
3
4
5
0 10 20 30 40 50 60 70 80 90 100
8 Channels
10 Channels
16 Channels
24 Channels
32 Channels
64 Channels
Res
pons
e tim
e (s
econ
ds)
Percentage utilization (�)

� � � � � � � � � � � � � � � � � � � � � � � � � � � � � � � � � � � � � � � � � � � � � � � � � � � � � � � � � � � � � � � � � � � � � � � � � � � � � � � � � � � � � � � � � � � � � � � � � � � � � � � � � � �
The Complexity…
� Basically we should know how busy (utilization) each resource is in the architecture.� This to have an indication of the “Wait Time” on that
resource.
� Only measuring how much we read, write, transfer or process is not enough.
��
��
�
or process is not enough.� Think about a cache in a Storage Server for example.
• Read request from server is only getting data from the Storage Server cache.
• In other cases the read request will go to the physical spindles
� Time Synchronization is very important� For Example, compare numbers by aggregating

� � � � � � � � � � � � � � � � � � � � � � � � � � � � � � � � � � � � � � � � � � � � � � � � � � � � � � � � � � � � � � � � � � � � � � � � � � � � � � � � � � � � � � � � � � � � � � � � � � � � � � � � � � �
Telling A Story
��
��
�

� � � � � � � � � � � � � � � � � � � � � � � � � � � � � � � � � � � � � � � � � � � � � � � � � � � � � � � � � � � � � � � � � � � � � � � � � � � � � � � � � � � � � � � � � � � � � � � � � � � � � � � � � � �
The Story of Bob the Merchant…
� Every working day going to the market
� Spending every time 200 $ to go there
� A Profit between -100 $ (loss) and 500$
��
��
�
� Simon says Bob should always write down:� The month� The temperature� The amount of rainfall� The profit
© Story by G. Hendriksen 2008

� � � � � � � � � � � � � � � � � � � � � � � � � � � � � � � � � � � � � � � � � � � � � � � � � � � � � � � � � � � � � � � � � � � � � � � � � � � � � � � � � � � � � � � � � � � � � � � � � � � � � � � � � � �
The “GAPP” Analyses
��
��
�
Analyses

� � � � � � � � � � � � � � � � � � � � � � � � � � � � � � � � � � � � � � � � � � � � � � � � � � � � � � � � � � � � � � � � � � � � � � � � � � � � � � � � � � � � � � � � � � � � � � � � � � � � � � � � � � �
How could we use the system metrics…
� From the CPU (aggregated and per CPU):� User% = Percentage Application code (kernel
programmers call this user mode) of total CPU time. This includes programs and RDBMS
� Sys% = Percentage Kernel code of total CPU time. This is invoked by either a system call or hardware interrupt
��
��
�
is invoked by either a system call or hardware interrupt including the regular clock interrupts
� Wait% = Percentage Wait for I/O of total CPU time. This really is idle but there is outstanding disk I/O
� CPU% = USER% + SYS% � Basically the real CPU utilization.

� � � � � � � � � � � � � � � � � � � � � � � � � � � � � � � � � � � � � � � � � � � � � � � � � � � � � � � � � � � � � � � � � � � � � � � � � � � � � � � � � � � � � � � � � � � � � � � � � � � � � � � � � � �
How could we use the system metrics…
� For the I/O:� Disk Busy% = The percentage of the time the disk was
found in use
� For the Memory:� Percentage used memory
For the Network:
��
��
�
� For the Network:� read kB/s and write kB/s = The kilobytes read and
written on the network� packin and packout = The number of network packets
(in=received, out=sent)

� � � � � � � � � � � � � � � � � � � � � � � � � � � � � � � � � � � � � � � � � � � � � � � � � � � � � � � � � � � � � � � � � � � � � � � � � � � � � � � � � � � � � � � � � � � � � � � � � � � � � � � � � � �
The to be compared graphs…
0
20
40
60
80
100
PCT_GT_5SEC
60
80
100
0
20
40
60
80
100
USER_E
60
80
100
��
��
�
0
20
40USER_Q
0
20
40
60
80
100
WAIT_Q
0
20
40WAIT_E
0
20
40
60
80
100
HDISK5_QEtc……
© Graphs by G. Hendriksen 2008

� � � � � � � � � � � � � � � � � � � � � � � � � � � � � � � � � � � � � � � � � � � � � � � � � � � � � � � � � � � � � � � � � � � � � � � � � � � � � � � � � � � � � � � � � � � � � � � � � � � � � � � � � � �
� Collecting� Which parts of the technical infrastructure are involved
in the business process� What data is available and in which granularity
Synchronization
Steps for the GAPP Analyses…�
��
��
� Synchronization� Aggregation on lowest granularity of all used data
� Data Mining
� Interpretation

� � � � � � � � � � � � � � � � � � � � � � � � � � � � � � � � � � � � � � � � � � � � � � � � � � � � � � � � � � � � � � � � � � � � � � � � � � � � � � � � � � � � � � � � � � � � � � � � � � � � � � � � � � �
� Creation of 11G Database� Inserting all records from system metrics and
business process � Nmon files (using external tables)� Moniforce data (using external tables)
What was done in the practical case…�
��
��
11Gnmon
nmon
Moni-force
ANALYSIS

� � � � � � � � � � � � � � � � � � � � � � � � � � � � � � � � � � � � � � � � � � � � � � � � � � � � � � � � � � � � � � � � � � � � � � � � � � � � � � � � � � � � � � � � � � � � � � � � � � � � � � � � � � �
Using DBMS_PREDICTIVE_ANALYTICS…
� Another Data Mining engine could be used� Open Source, etc. (e.g. http://www.r-project.org/)
� DBMS_PREDICTIVE_ANALYTICS *� Procedure EXPLAIN
��
��
�
� Procedure EXPLAIN• Ranks attributes in order of influence in explaining a target
column
� Procedure PREDICT• Predict the value of a column. By filling in for some cases the
value of the to be predicted column, the not filled in values will be predicted. So the procedure creates a self learning model.
* Part of Oracle Data Mining (ODM)

� � � � � � � � � � � � � � � � � � � � � � � � � � � � � � � � � � � � � � � � � � � � � � � � � � � � � � � � � � � � � � � � � � � � � � � � � � � � � � � � � � � � � � � � � � � � � � � � � � � � � � � � � � �
Calling the procedures…
BEGIN
DBMS_PREDICTIVE_ANALYTICS.EXPLAIN(
data_table_name => 'ghh_model_augsepoct_TS',
explain_column_name => 'PCT_GT_5SEC_CHD',
result_table_name => 'ghh_test52_expl');
END;
/
DECLARE
EXPLAIN
��
��
�
DECLARE
v_accuracy NUMBER(10,9);
BEGIN
DBMS_PREDICTIVE_ANALYTICS.PREDICT(
accuracy => v_accuracy,
data_table_name => 'ghh_model_augsepoct_TS',
case_id_column_name => 'TIME',
target_column_name => 'PCT_GT_5SEC_CHD',
result_table_name => 'ghh_predict_mod_augsepoct_TS');
DBMS_OUTPUT.PUT_LINE('Accuracy = ' || v_accuracy);
END;
/
PREDICT

� � � � � � � � � � � � � � � � � � � � � � � � � � � � � � � � � � � � � � � � � � � � � � � � � � � � � � � � � � � � � � � � � � � � � � � � � � � � � � � � � � � � � � � � � � � � � � � � � � � � � � � � � � �
Back to the big variance in R…
60
70
80
90
100
Perc
enta
ge
Percentage logins (PCT_GT_5SEC) which took longer than 5 seconds:
��
��
�
0
10
20
30
40
50
PCT_GT_5SEC
Time

� � � � � � � � � � � � � � � � � � � � � � � � � � � � � � � � � � � � � � � � � � � � � � � � � � � � � � � � � � � � � � � � � � � � � � � � � � � � � � � � � � � � � � � � � � � � � � � � � � � � � � � � � � �
August, September, October Explained…
50
60
70
80
90
100
Inde
x nu
mbe
r�
��
��
0
10
20
30
40 IDX
Factors of Explanation

� � � � � � � � � � � � � � � � � � � � � � � � � � � � � � � � � � � � � � � � � � � � � � � � � � � � � � � � � � � � � � � � � � � � � � � � � � � � � � � � � � � � � � � � � � � � � � � � � � � � � � � � � � �
Understanding The Explanation Index number…
R
W S• Basically we search for the block with the
biggest variance
• The factor with the biggest variance in the “Wait Time”, will have the highest index number.
��
��
�
number.
• So the higher the Index number, the higher the impact on the total variance of R, and so worth investigation.
© Diagram by G. Hendriksen 2008, original diagram idea by Hotsos

� � � � � � � � � � � � � � � � � � � � � � � � � � � � � � � � � � � � � � � � � � � � � � � � � � � � � � � � � � � � � � � � � � � � � � � � � � � � � � � � � � � � � � � � � � � � � � � � � � � � � � � � � � �
The big variance in R…
60
70
80
90
100
Perc
enta
ge
Percentage logins (PCT_GT_5SEC) which took longer than 5 seconds:
��
��
�
0
10
20
30
40
50
PCT_GT_5SEC
Time

� � � � � � � � � � � � � � � � � � � � � � � � � � � � � � � � � � � � � � � � � � � � � � � � � � � � � � � � � � � � � � � � � � � � � � � � � � � � � � � � � � � � � � � � � � � � � � � � � � � � � � � � � � �
A Simple Model Used…
60
70
80
90
100
Perc
enta
ge
Percentage logins (PCT_GT_5SEC) which took longer than 5 seconds:
��
��
�
0
10
20
30
40
50PCT_GT_5SEC
PREDICTION
Time* Model created for Aug., Sep. and Oct.
� � � � � � � � � � � � � � � � � � � � � � � � � � � � � � � � � � � � � � � � � � � � � � � � � � � � � � � � � � � � � � � � � � � � � � � � � � � � � � � � � � � � � � � � � � � � � � � � � � � � � � � � � � �
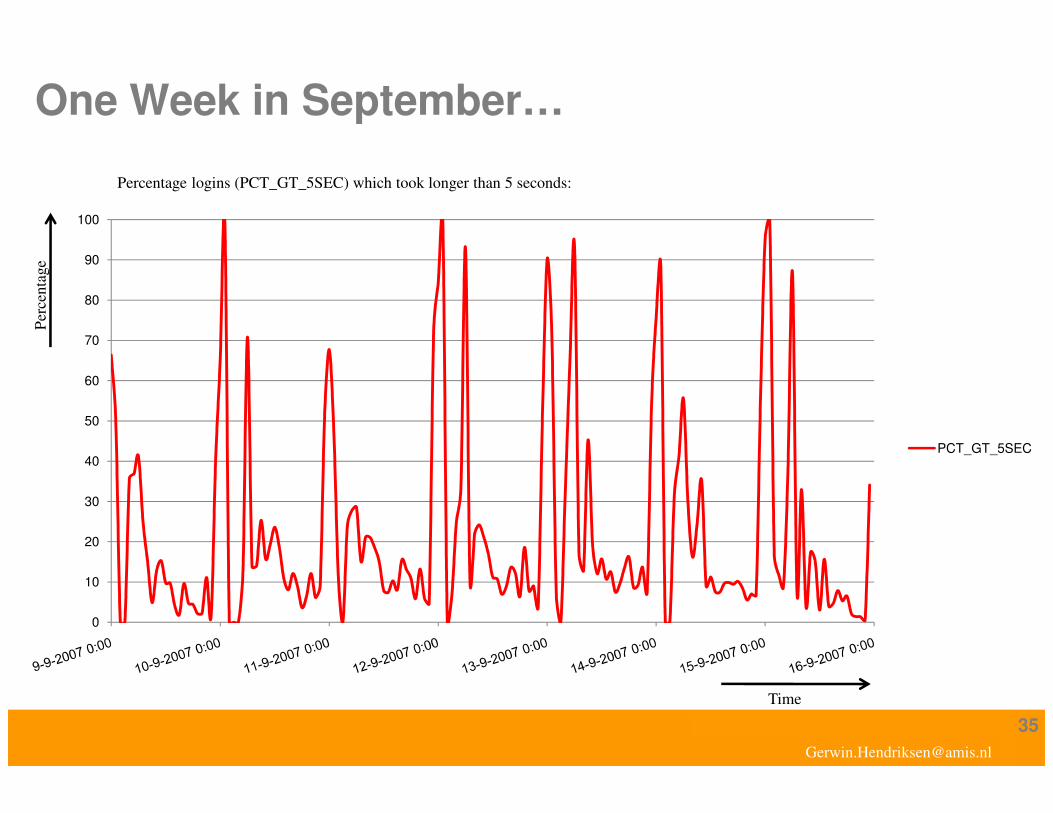
One Week in September…
60
70
80
90
100
Perc
enta
ge
Percentage logins (PCT_GT_5SEC) which took longer than 5 seconds:
��
��
�
0
10
20
30
40
50
PCT_GT_5SEC
Time

� � � � � � � � � � � � � � � � � � � � � � � � � � � � � � � � � � � � � � � � � � � � � � � � � � � � � � � � � � � � � � � � � � � � � � � � � � � � � � � � � � � � � � � � � � � � � � � � � � � � � � � � � � �
Modeled with a simple model…
60
70
80
90
100
Perc
enta
ge
Percentage logins (PCT_GT_5SEC) which took longer than 5 seconds:
��
��
�
0
10
20
30
40
50PCT_GT_5SEC
PREDICTION
Time* Model created for Aug., Sep. and Oct.

� � � � � � � � � � � � � � � � � � � � � � � � � � � � � � � � � � � � � � � � � � � � � � � � � � � � � � � � � � � � � � � � � � � � � � � � � � � � � � � � � � � � � � � � � � � � � � � � � � � � � � � � � � �
The Model, now alone (in red)…
60
70
80
90
100
Perc
enta
ge
Percentage logins (PCT_GT_5SEC) which took longer than 5 seconds:
��
��
�
0
10
20
30
40
50
prediction
Time* Model created for Aug., Sep. and Oct.

� � � � � � � � � � � � � � � � � � � � � � � � � � � � � � � � � � � � � � � � � � � � � � � � � � � � � � � � � � � � � � � � � � � � � � � � � � � � � � � � � � � � � � � � � � � � � � � � � � � � � � � � � � �
When 25% I/O Reduction…
60
70
80
90
100
Perc
enta
ge
Percentage logins (PCT_GT_5SEC) which took longer than 5 seconds:
��
��
�
0
10
20
30
40
50prediction
25pctreduc
Time* Models created for Aug., Sep. and Oct.

� � � � � � � � � � � � � � � � � � � � � � � � � � � � � � � � � � � � � � � � � � � � � � � � � � � � � � � � � � � � � � � � � � � � � � � � � � � � � � � � � � � � � � � � � � � � � � � � � � � � � � � � � � �
September 22:00 – 02:00 Explained…
50
60
70
80
90
100
Inde
x nu
mbe
r�
��
��
0
10
20
30
40 IDX
Factors of Explanation
� � � � � � � � � � � � � � � � � � � � � � � � � � � � � � � � � � � � � � � � � � � � � � � � � � � � � � � � � � � � � � � � � � � � � � � � � � � � � � � � � � � � � � � � � � � � � � � � � � � � � � � � � � �
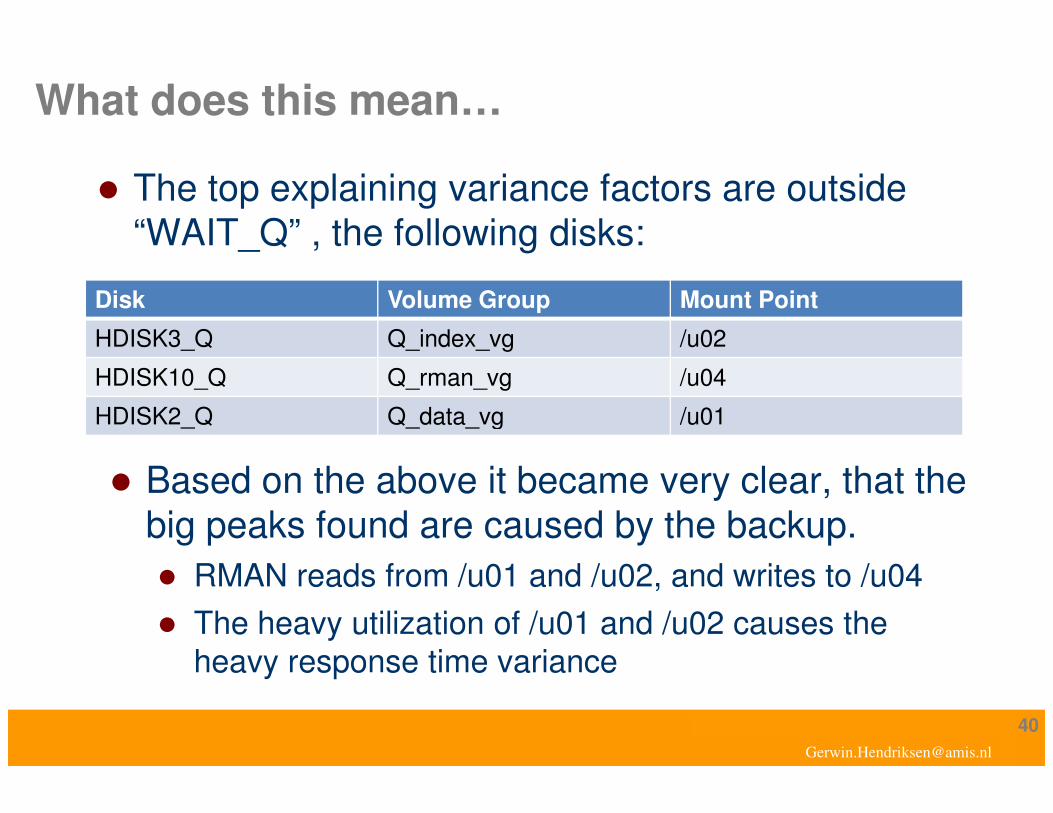
What does this mean…
Disk Volume Group Mount Point
HDISK3_Q Q_index_vg /u02
HDISK10_Q Q_rman_vg /u04
HDISK2_Q Q_data_vg /u01
� The top explaining variance factors are outside“WAIT_Q” , the following disks:
��
��
�
HDISK2_Q Q_data_vg /u01
� Based on the above it became very clear, that the big peaks found are caused by the backup.� RMAN reads from /u01 and /u02, and writes to /u04� The heavy utilization of /u01 and /u02 causes the
heavy response time variance

� � � � � � � � � � � � � � � � � � � � � � � � � � � � � � � � � � � � � � � � � � � � � � � � � � � � � � � � � � � � � � � � � � � � � � � � � � � � � � � � � � � � � � � � � � � � � � � � � � � � � � � � � � �
August, Sept., Oct. 9:00 – 15:00 Explained…
50
60
70
80
90
100
Inde
x nu
mbe
r�
��
��
0
10
20
30
40IDX
Factors of Explanation

� � � � � � � � � � � � � � � � � � � � � � � � � � � � � � � � � � � � � � � � � � � � � � � � � � � � � � � � � � � � � � � � � � � � � � � � � � � � � � � � � � � � � � � � � � � � � � � � � � � � � � � � � � �
Enhancements in the system…
� The research has shown that something was going on at the Storage layer
� Memory was added to the machines� More I/O was cached
• But was still covering up some of the Storage issues
� Database buffer cache size increase
��
��
�
� Database buffer cache size increase
� The Storage has been reconfigured, which solved a lot of the trouble
� Due to the growth of the business, now the system is hitting new performance variance from other causes

� � � � � � � � � � � � � � � � � � � � � � � � � � � � � � � � � � � � � � � � � � � � � � � � � � � � � � � � � � � � � � � � � � � � � � � � � � � � � � � � � � � � � � � � � � � � � � � � � � � � � � � � � � �
Variance of R in Jan 2008…
60
70
80
90
100
Perc
enta
ge
Percentage logins (PCT_GT_5SEC) which took longer than 5 seconds:
��
��
�
0
10
20
30
40
50
PCT_GT_5SEC
Time

� � � � � � � � � � � � � � � � � � � � � � � � � � � � � � � � � � � � � � � � � � � � � � � � � � � � � � � � � � � � � � � � � � � � � � � � � � � � � � � � � � � � � � � � � � � � � � � � � � � � � � � � � � �
November, Dec., Jan. 9:00 – 15:00 Explained…
50
60
70
80
90
100
Inde
x nu
mbe
r�
��
��
0
10
20
30
40IDX
Factors of Explanation

� � � � � � � � � � � � � � � � � � � � � � � � � � � � � � � � � � � � � � � � � � � � � � � � � � � � � � � � � � � � � � � � � � � � � � � � � � � � � � � � � � � � � � � � � � � � � � � � � � � � � � � � � � �
What to do with the found information…
� Basically we should start to investigate what each component has in common� So what has HDISK2_E to do with CPU_E� HDISK2_E is part of datavg and has mount point /u01
��
��
�
� The CPU and /u01 of the front-end machine (E) are the most explaining factors for the variance in the “Response Time” (R)
� This is the mount point with the data of the front-end database.

� � � � � � � � � � � � � � � � � � � � � � � � � � � � � � � � � � � � � � � � � � � � � � � � � � � � � � � � � � � � � � � � � � � � � � � � � � � � � � � � � � � � � � � � � � � � � � � � � � � � � � � � � � �
Very Recently Used GAPP At A Customer…
GH200 GH300 GH400GH200 running:
� Oracle Internet Directory (shared)
� OID Database (shared)
GH300 running:
� Application Server OID (shared with other applications)
� Portal (shared with other applications)
� Application Server ADF
Web Users
Network
��
��
�
� OID Database (shared)
� Portal Database (shared)
GH400 running:
� Two database, which are shared for several applicationsBusiness case:
� Employee information screen too slow response times
� Logging in to the whole application too slow
Storage
SAN
© Drawing by G. Hendriksen 2008

� � � � � � � � � � � � � � � � � � � � � � � � � � � � � � � � � � � � � � � � � � � � � � � � � � � � � � � � � � � � � � � � � � � � � � � � � � � � � � � � � � � � � � � � � � � � � � � � � � � � � � � � � � �
The Factorial Analyses (Explain)…
Inde
x nu
mbe
r�
��
��
Factors of Explanation

� � � � � � � � � � � � � � � � � � � � � � � � � � � � � � � � � � � � � � � � � � � � � � � � � � � � � � � � � � � � � � � � � � � � � � � � � � � � � � � � � � � � � � � � � � � � � � � � � � � � � � � � � � �
The Model (Predict)…
Res
pons
e Ti
me
(ms)
��
��
�
Date (Time)
� � � � � � � � � � � � � � � � � � � � � � � � � � � � � � � � � � � � � � � � � � � � � � � � � � � � � � � � � � � � � � � � � � � � � � � � � � � � � � � � � � � � � � � � � � � � � � � � � � � � � � � � � � �
� Some peaks are not explained:� The data was on an 15 minute granularity� Not all involved factors were part of the analyses� Some OC4J container crashes have been caused by
to low memory settings
Interpretation…�
��
��
� The GAPP analyses showed that memory issues on the machine with the application servers and the portal database are having high impact on the response time of the researched business process.

� � � � � � � � � � � � � � � � � � � � � � � � � � � � � � � � � � � � � � � � � � � � � � � � � � � � � � � � � � � � � � � � � � � � � � � � � � � � � � � � � � � � � � � � � � � � � � � � � � � � � � � � � � �
GAPP Used In Service Oriented
��
��
�
Service Oriented Architectures

� � � � � � � � � � � � � � � � � � � � � � � � � � � � � � � � � � � � � � � � � � � � � � � � � � � � � � � � � � � � � � � � � � � � � � � � � � � � � � � � � � � � � � � � � � � � � � � � � � � � � � � � � � �
What about SOA, A Simple BPEL Process…
� BPEL Process steps are storedin dehydration store
��
��
�
� This data can be mined via the “GAPP” method

� � � � � � � � � � � � � � � � � � � � � � � � � � � � � � � � � � � � � � � � � � � � � � � � � � � � � � � � � � � � � � � � � � � � � � � � � � � � � � � � � � � � � � � � � � � � � � � � � � � � � � � � � � �
� The dehydration store contains data of BPEL processes and the timing data of the process steps. This information can be found in the “ORABPEL” schema
� The dehydration store contains also timing data of the Enterprise Service Bus (ESB). This
“GAPP” vs. Service Oriented Architectures…�
��
��
of the Enterprise Service Bus (ESB). This information can be found in the “ORAESB” schema
� “GAPP” will make it possible to find bottleneck steps within the BPEL process for specific times and conditions

� � � � � � � � � � � � � � � � � � � � � � � � � � � � � � � � � � � � � � � � � � � � � � � � � � � � � � � � � � � � � � � � � � � � � � � � � � � � � � � � � � � � � � � � � � � � � � � � � � � � � � � � � � �
The Timing data per instance within SOA Suite…
� Audit trail data can be found via the BPEL Process Manager
� Timing data is
��
��
�
� Timing data is stored in the dehydrationstore in table WORK_ITEM and XML-files

� � � � � � � � � � � � � � � � � � � � � � � � � � � � � � � � � � � � � � � � � � � � � � � � � � � � � � � � � � � � � � � � � � � � � � � � � � � � � � � � � � � � � � � � � � � � � � � � � � � � � � � � � � �
Conclusions
��
��
�

� � � � � � � � � � � � � � � � � � � � � � � � � � � � � � � � � � � � � � � � � � � � � � � � � � � � � � � � � � � � � � � � � � � � � � � � � � � � � � � � � � � � � � � � � � � � � � � � � � � � � � � � � � �
Pro’s of GAPP…
� GAPP can be used to determine where the most “WAIT Time” is spent for a certain business process in very complex architectures
� GAPP can be used without special tracing, it can use system metrics’, ASH data, etc.
��
��
�
� GAPP can find relations between components, which look not to be related at all (e.g. email and ERP system which share storage, network)
� GAPP is not database dependant� GAPP can use data mining software from all sources� GAPP can be used as a last resort

� � � � � � � � � � � � � � � � � � � � � � � � � � � � � � � � � � � � � � � � � � � � � � � � � � � � � � � � � � � � � � � � � � � � � � � � � � � � � � � � � � � � � � � � � � � � � � � � � � � � � � � � � � �
Con’s of GAPP…
� GAPP can only be used when data has already been gathered over time
� GAPP has no use for performance investigation of business processes which have no stable “Service Time”
��
��
�
� GAPP only works when the workload overtime has a repetitive pattern
� To use GAPP, knowledge of the infrastructure is needed, changes can be a big problem
� Time differences between components in the architecture can be a big problem

� � � � � � � � � � � � � � � � � � � � � � � � � � � � � � � � � � � � � � � � � � � � � � � � � � � � � � � � � � � � � � � � � � � � � � � � � � � � � � � � � � � � � � � � � � � � � � � � � � � � � � � � � � �
Conclusions…
� GAPP is a nice way of business process profiling in complex architectures (SOA architectures).
� Within the restrictions of GAPP, GAPP can be very powerful and can be used in a general way, independent of the technology
��
��
�
� GAPP can be a nice add on to Performance Management systems
� GAPP can predict possible future scenarios� Although there are very expensive tools which
could possible do this, this is a much cheaper approach

� � � � � � � � � � � � � � � � � � � � � � � � � � � � � � � � � � � � � � � � � � � � � � � � � � � � � � � � � � � � � � � � � � � � � � � � � � � � � � � � � � � � � � � � � � � � � � � � � � � � � � � � � � �
Reference…
� AMIS Technology blog:� http://technology.amis.nl/blog/
� NMON tool:� http://www-941.ibm.com/collaboration/wiki/display/WikiPtype/nmon+Manual
� Method-R:� Oracle Performance by Cary Millsap (http://method-r.com/)
��
��
�
� Oracle Performance by Cary Millsap (http://method-r.com/)
� Oracle Data Mining:� http://www.oracle.com/technology/products/bi/odm/index.html
� Package DBMS_PREDICTIVE_ANALYTICS• Oracle® Database PL/SQL Packages and Types Reference• 11g Release 1 (11.1) (Part Number B28419-03)• Chapter 89

� � � � � � � � � � � � � � � � � � � � � � � � � � � � � � � � � � � � � � � � � � � � � � � � � � � � � � � � � � � � � � � � � � � � � � � � � � � � � � � � � � � � � � � � � � � � � � � � � � � � � � � � � � �
Thank you for
Q/AMIND THE GAPP
��
��
�
you for your
attention Q/A

� � � � � � � � � � � � � � � � � � � � � � � � � � � � � � � � � � � � � � � � � � � � � � � � � � � � � � � � � � � � � � � � � � � � � � � � � � � � � � � � � � � � � � � � � � � � � � � � � � � � � � � � � � �
��
��
�
60