JSW Steel Limited · modernization-cum-capacity enhancement, 0.2MTPA Tin plate mill ... Manage...
45
JSW Steel Limited Investor Presentation August 2017
Transcript of JSW Steel Limited · modernization-cum-capacity enhancement, 0.2MTPA Tin plate mill ... Manage...
JSW Steel LimitedInvestor PresentationAugust 2017

2
Agenda
Overview Value Proposition
Performance Overview
Guidance Business Environment

3* Listed company
^ USD/` = 64.0773 (RBI reference rate as on July 31, 2017)
JSW Group – overview
Presence across the core sectors
JSW Steel:8,346
JSW Energy:
1,803
As on July 31, 2017
JSW Steel*: India’s leading integrated steelproducer (Steel making capacity: 18 MTPA)
JSW Cement: Manufacturer of PSC, OPCand GGBS cement (Operational plants’capacity: 10.3 MTPA)
JSW Infrastructure: Engaged in development and operations of ports (Operational capacity: 70 MTPA)
JSW Energy*: Engaged across the value chainof power business (Operational plants’capacity: 4,531 MW)
Market cap of listed businesses ($10,149 mn^)

4
JSW Steel – India’s leading steel manufacturer
Leading steel manufacturer in
India
Integrated manufacturing
process
Diversified product portfolio
Strong distribution network and
export presence
Globalpresence
Technological competence
Combination of state-of-the-art steel making technologies: Corex, DRI, Blast Furnace
International presence in mining assets (Chile, US and Mozambique) and value-added facilities (Plate and Pipe mill in US)
Integrated steel manufacturing facilities – from raw material processing plants to value-added product capacities
Installed capacity 18 MTPA, at strategic locations in South and West India
Pan India marketing and distribution network, export presence in ~100 countries across the 5 continents
Extensive portfolio of products – HR, CR, galvanized/galvalume, pre-painted, tinplates, electrical steel (CRNO), TMT bars, wire rods, special steel bars, rounds and blooms

5(1) Calculated as consolidated EBITDA/steel sales, (2) From 31st March 2002 to 31st March 2017,
(3) USD/` = 64.8386 (RBI reference rate as on Mar 31, 2017)
Transformational journey to market leadership
FY2002 FY2010 FY2017
Capacity (MTPA) 1.6 7.8 18.0 CAGR FY2002–FY2017: 18%Capacity increased to 18MTPA in Mar 2016
Production (MTPA) 1.3 6.0 15.8 CAGR FY2002–FY2017: 18%
Revenue (USD mn) 268 3,006 9,336 CAGR FY2002–FY2017: 27%
EBITDA (USD mn) 43 641 1,878 CAGR FY2002–FY2017: 29%
EBITDA/ton(1) (USD/ton) 34 112 128 CAGR FY2002–FY2017: 9%
Market Cap (USD mn) 81 3,565 7,016 Significant value creation with 86x increase in market value(2)
Technology Corex Corex, BF Corex, BF, DRI Combination of industry leading technologies
Product Mix FlatsFlats, long,
special steel and value added
Flat, long, special steel & high value-added
auto, electrical grade
Continuously expanding product canvas with focus on high-end value-added products
Unrelenting progress through the economic cycles

6
Continuously evaluating opportunities to deliver value enhancing growth
Key new projects by 2020
Dolvi: Capacity expansion to 10 MTPA, 1.5MTPA Coke Oven at Dolvi Coke Projects Limited
Vijayanagar: BF-3 revamp & upgradation, CRM-1 complex capacity expansion, Pipe Conveyor System for Iron ore and new Water Reservoir
Salem: capacity expansion to 1.2MTPA
Vasind and Tarapur: modernization-cum-capacity enhancement, 0.2MTPA Tin plate mill
2017
74% stake in Praxair’s(3)
the industrial gases joint venture(4)
Won 5 iron ore mines in Karnataka (111 mntonnes estimated resources)
2015
CRM2—Phase 2
0.2MTPA Electrical Steel Mill
2016
18 MTPA
Won Moitra coal mine in Jharkhand
2009
7.8 MTPA
2014
New CRM2—Phase I
4 MTPA—Pellet Plant(2)
1 MTPA—Coke Oven Plant(2)
Welspun Maxsteel
50% stake in VallabhTinplate
2012
HSM-2 Capacity Expansion to 5 MTPA
2013
14.3 MTPA post Ispat merger
2010
3.5 MTPA—HSM-2
JSW-JFE Strategic Partnership
Coal mining concessions in US
2011
49.3% stake in Ispat Industries
2008
Iron Ore mines in Chile
2007
4.8 MTPA
1.0 MTPA—CRM
Plate and Pipe Mill in US
Coal mining concessions in Mozambique
2006
3.8 MTPA
2005
2.5 MTPA
Color Coating Line
EURO IKON2002
1.6 MTPA
2004
SISCOL(1)
(1) Southern Iron and Steel Company, (2) Amba River Coke Limited, (3) Praxair India Private Limited, (4) JSW Praxair Oxygen Private Limited
Combination of Organic and Inorganic growth

7(1) Translated at USD/` = 44.65 (RBI reference rate as on Mar 31, 2011)
JSW – JFE strategic partnership
Value creation for both the partners
JSW Steel:
Focused expansion plans in India
Optimized capital structure through deleveraging
Access to cutting edge technologies
JFE:
Presence in growing Indian market
Future growth through equity participation
Strategic production base in India for existing automobile customers
Technology agreements
Benefits to JSW Steel driven by:
Access to fast growing auto steel market
Technical know-how for electrical steel manufacturing
Short learning curve
Application engineering
New product development
Benchmarking and personnel training
General technical assistance agreements
Operational excellence and cost reduction for sustainable operations by:
Improvement in quality, productivity, yield , and energy efficiency
Sharing best maintenance, environment management, and safety practices
Benchmarking, training and talent sharing
Standardization of processes
One of the largest FDI in the Indian Metals and Mining space – Equity infusion by JFE of Rs. 5,410 Crores (~US$1.2 bn) (1) for 14.99% equity stake
Deleveraged Balance Sheet to support next phase of growth
Access to cutting edge technologies and fast growing automotive steel market
Operational excellence to result in cost reduction

8
Balanced corporate strategy
Selective Growth
Diversification of Product Profile and
Customer Base
Backward & Forward Integration, and Focus on Resource
Optimization
Prudent balance sheet management
Sustainability with focus on Quality, R&D and Innovation
Maintain market share through selective organic and inorganic growth
Undertake brownfield expansions at low specific investment cost per ton
Consider inorganic opportunities that are value accretive
Increase proportion of high margin value-added products
Diversify customer base, both within India and abroad
Continue to focus on rural markets in India
Continue to evaluate raw material assets in India and abroad to secure key raw material supplies and reduce cost of production by targeting strategic tie-ups and investments
Focus on cost reduction and energy efficiency
Continuously seek to improve financial profile
Manage capacity expansion and debt profile to capture market opportunities without excessive risk
Committed to sustainable and eco-friendly technologies to drive growth
Focus on Quality, R&D and Innovation to drive cost efficiency and new product development

9
Strong and balanced Board comprising experts of eminence & integrity
Savitri Devi JindalP. Hemalatha, IASNominee Director of KSIIDC
Executive Directors Independent Directors Nominee DirectorsChairperson—Emeritus
Sajjan JindalChairman & Managing Director
Seshagiri Rao M.V.SJoint Managing Director & Group CFO
Dr. Vinod Nowal Dy. Managing Director
Jayant AcharyaDirector (Commercial & Marketing)
Dr. Vijay Kelkar Ex-Finance Secretary, Ex-Secretary of MoP&G, Ex-Chairman Finance Commission
Promoter Director
Board fundamentally committed to sustainable business
Haigreve KhaitanSenior Partner at M/s. Khaitan& Co, India's one of the oldest and full service law firm
Malay Mukherjee 40yrs of rich experience in mining and steel industry
Seturaman MahalingamCA, Ex-CFO of TCS, Ex member of the Tax Administration Reform Commission
Kannan Vijayaraghavan, FCA and Certified Management Consultant
Dr. Punita Kumar Sinha Former CIO at The Asia Tigers Fund
Hiroyuki OgawaNominee Director of JFE Steel Corporation

10
FY17 performance on sustainability matrixes
8,73,635 GJ
Waste heat utilized4.12 MTMaterial Recycled
35%Recycled & reused water
28%Decrease in LTIFR over FY16
18%Increase in Expenditure for corporate social responsibility over FY16
20%Reduction in Specific Water consumption over FY16
18.4%Reduction in Specific Energy consumption over FY16
2016
‘Golden Peacock Innovative Product’ Award
‘Steelie Award 2016’ in the innovation category for “thedevelopment of advanced high strength automotive steels withspeed and innovation” by the World Steel Association
The National Award for Supply Chain and Logistics Excellenceunder steel industry Category by CII
Accreditation with level 5 for Total Cost Management (TCM)Maturity Model Assessment by TCM division of CII
2nd Prize in the National Energy Conservation Awards 2016 toVijayanagar Works in “Integrated Steel Sector” and KalmeshwarWorks in “Steel Re-Rolling Mills Sector” by ‘Bureau of EnergyEfficiency’ of India
2015 Porter’s Prize for ‘Leveraging Unique Activities’
JSW Group received Porter’s Prize for ‘Creating Shared Values’

11
Agenda
Overview Value Proposition
Performance Overview
Guidance Business Environment

12
Strong fundamentals to boost India steel demand
Multi-location manufacturing facilities
Diversified product profile
Domestic market leader with strong export presence
Strong sales and marketing platform
Focus on operational efficiency
Strategic expansion aided by strong project execution
Proven ability to acquire and turnaround assets
Robust financial profile
A platform of strength and agility
1
2
3
4
5
6
7
8
9

13(1) Reserve Bank of India and IMF, (2) World Steel Association, IMF [World Economic Outlook – 2016], (3) World Steel Association [Short range outlook – Oct 2016], (4) Bubble size represents total steel demand of respective country
Strong fundamentals to boost India steel demand
5.6% 6.5% 7.2% 7.9%
7.1% 7.2%
FY13 FY14 FY15 FY16 FY17E FY18E
Strong economic growth with improving fundamentals
India’s GDP growth continues to register stellar performance in a worldseeing sluggish growth
After temporary impact of demonetization, economy activity is improvingwith increasing public spending, declining fiscal deficit, benign inflation,lower oil prices and easing interest rate trajectory
India GDP growth(1)
• (%)
Government reforms to boost industry growth
Various measures in different sectors, easing FDI norms and initiatives such as‘Make in India’ aim at driving growth & development
The finance minister in his recent budget speech, stressed on continuingwith economic reforms along with increase in public investment ininfrastructure and development projects.
c.$60 Bn allocated for infrastructure development in 2017-18
India steel consumption to rise at a faster rate
o India’s steel consumption was 84 million tonnes in 2016 and is expected to rise to ~89 million tonnes in 2017(3)
Potential for substantial growth in steel consumption(2)(4)
o World Per Capita Consumption was ~206 Kgs in 2016o India Per Capita Consumption was ~64 Kgs in 2016
With the growth in economy, JSW Steel is well positioned to be part of the India growth story
(200)
0
200
400
600
800
1,000
1,200
1,400
0 10,000 20,000 30,000 40,000 50,000 60,000 70,000
China
IndiaBrazilMexicoRussia
Italy
Japan
South Korea
France
Canada
Germany
USA
Per
cap
ita
Stee
l Co
nsu
mp
tio
n in
20
16
(K
g.)
GDP per capita in 2016 ($)
1

14*JSW Steel Coated Products Limited
^ JSW Steel (Salav) Limited
Multi-location manufacturing facilities
Leveraging locational advantage to increase market share strategically
2
Dolvi: 5 MTPA
3.5 MTPA Blast Furnace 1.6 MTPA gas based DRI 55 MW Power Plant
Salem: 1 MTPA
1 MTPA Blast Furnaces 0.5 MTPA Blooming Mill 60 MW Power Plant
Kalmeshwar (JSCPL*)
0.58 MTPA GP/GC 0.19 MTPA Colour
Coating Line
Vasind & Tarapur (JSCPL*)
1.18 MTPA GP/GC 0.5 MTPA Colour Coating Line 30 MW Power Plant
Vijayanagar: 12 MTPA
1.7 MTPA Corex 10.4 MTPA Blast Furnaces 854 MW Power Plant
Salav: 0.9 MTPA DRI (^)
Geographically diversified with manufacturing facilities in South and West India
US plate and pipe mill
JSW Steel ownership: 90%
Acquisition cost: $810mn
Capacity: 1.2 Net MTPA Plates and 0.55 Net MTPA Pipes
Acquired in 2007
Opportunity for diversification in terms of products, markets and geographies
US coal mines JSW Steel ownership: 100%
Acquisition cost: $70mn
Chile iron ore mines
JSW Steel ownership: 70%
Acquisition cost: $252mn
Started operations in FY11
Maritime concession to develop cape size port in North Caldera
Mozambique coal mines
JSW Steel ownership: 100%
Early stage development in progress
Strategic overseas presence

15
Wide offering of Flat and Long products
Continuously increasing value added products
Diversified portfolio to address growing demand for value-added steel
Commissioned new facilities to further enrich product mix
Leveraging JFE Steel’s well-established manufacturing technology for high value-added products for auto-grade steel
Developing new products, capturing niche markets
Automotive Grade Steel:
Enhanced focus on cold rolled, galvanised and galvanneal products for body panels of automobiles
Electrical Steel:
Commissioned Cold Rolled Non-grain Oriented (CRNO) steel plant to address domestic demand by substituting imports of high grade electrical steel
Color Coated Products:
Largest color coated facility to address construction, warehousing and roofing requirements
State-of-the-art color coating line for appliance grade products used in consumer durables
Diversified Product Profile
GC
TMT
Slabs
ColorCoated
HRC
Billets
HR Plates
Blooms
CRC
Wire Rods
Continuously enriching product mix
3

16Indicates new grade approval in 1QFY18
Above mentioned approved grades are the highest among the specific product/grade-group; the lower grades uptothe highest grades are also approved.
Product/Grade approvalsApplications Components
Hood 270F 340P 270F 340P JSC340HN CR240B2Roof 270F 590R CR210B2Doors 270F JSC270DU 270F JAC270DU SGARC40Body s ide outer 270F 270F JAC340PBIW (Inner) 980Y 590R 440WFloor 270F HX220YD SAGA270CStructura l 980Y 590Y 590R BSK46 SAPH 370 S550MCReinf. Pi l lar 980Y HX180YD SGARC440Fuel Tank DX57Wheels SPFH440 SPFH590 SAPH 590 HR 750Engine SCM435 S36CV 86B45 SAE1070 SAE4140 SAE1018 EN1APB 16MnCr5LSiTransmiss ion 16MnCr5 SAE4124 SAE8822 SAE5160 SAE4145 20MnCr5NiAxels 150M36Tractor 815M17Suspens ion 51CrMoVnBearings 100CrMnSi6-4 SAF5019Front Panel EDD IFSide Panel D DDOuter shel lLPG Cyl inder shel l IS 15194 HS345
Structura l SS540 MSL I Gr6 ASTM A 792 5700MCWeather Res is tant IRSM 41
Heat Exchanger SPCCTAlternator 50C1000 50C700 65C1000 65SP1000 50SP1050Auto Electrica ls 50C1000 50C800 50C600 50C470Fan 50C1000 50SP1000 35C360 35C360FHP Motors 50C1000 50C800 50C700 50C600 50SP1050 50SP890Generators 50C530 50C470 50C470 S 50C400 50C310 65C700Compresors 50C1000 50C800 (P) 50C600 50C530 50C470 50C470 PInd. Motors 50C800 50C600 65C600 50C530 65C530Pump Motors 50C1000 50C800 50C700 50SP1050 50SP890Trans Lam 50C1000 50C800 50C700 50C600 50C530 50C470 35C360 35C300
CR Coated HRPO HR
Alloy Steel Longs
Electrical Steel
Fully Processed Semi Processed
General Engineering
JIS G3131SPHD
Grades Approved
Automotive
Appliance
SCGA 270D + JAZ
BTC330R/BTC245R
3

17(1) Joint Plant Committee, (2) Revenue from operations as per Ind-AS from FY16 onwards
Domestic market leader with strong export presence
Penetrating further to capture growing domestic demand withunique marketing strategy – pan India retail network with morethan 8,100 outlets (includes JSW Connect, JSW Shoppe, JSWExplore as well as non-exclusive retailers)
Delivered industry leading sales volume growth at 20%YoY in FY17
One of the largest exporter of steel products from India withexport presence in over 100 countries
Ability to re-align sales effort and shift between domestic andexport markets as per market conditions – strategically reducedshare of exports to 12% of total sales in FY16, as global steelconsumption declined 3% YoY in CY15. Exports have againrecovered in FY17
Flexibility to shift between domestic and international markets based on market conditions
4
77%85% 84%
76%88%
75%
23%15% 16%
24%12%
25%
FY08 FY10 FY12 FY15 FY16 FY17
11.4% 13.4% 6.9% 3.3% India Finished Steel Consumption Growth(1)
JSW Export Turnover/ revenue(2) as % of Total
JSW Domestic Turnover/ revenue(2) as % of Total
4.5% 2.6%

18
Multi-sectoral volume growth
Optimizing market mix and product mix to derivemaximum benefit from sector growth
Leveraging export presence
New product approvals for Original EquipmentManufacturers (OEMs) and automotive customers
Increase in value added products leading toincremental growth in focus sectors and alsofacilitating import substitution
Focused on Retail Sales – increased reach andpenetration
Strong sales and marketing platform
Segmented approach to address different retail segments
Metro / Urban
Urban /Semi-urban
Semi-urban /
Rural
‘JSW explore’ Branded, multiple product service center
for steel solutions Just-in-time solution with in-house
profiling lines and Value Added Services Franchisee Model
‘JSW Shoppe’
Steel distribution
Enhanced customer experience
‘JSW Shoppe Connect’ Smaller retail format linked to JSW
explore/Shoppe Last mile link to talukas/rural areas Sales to end consumers and MSMEs
Increased customer focus and market penetration
5

19(1) Total production (15.80MT) divided by total no. of employees on Company payroll (11,848) in FY17
Focus on operational efficiency
Diverse blend of technology
Coke Making: Recovery and Non-recovery Coke Ovens
Agglomeration: Pelletisation and Beneficiation Plants
Iron Making: Blast Furnace, Corex, Sponge Iron (DRI)
Steel Making: Basic Oxygen Furnace (BOF), Electric Arc Furnace (EAF), Conarc
Casting: Continuous Casting, Thin Slab Casting, Billet Casting
High labourproductivity
Improving labour productivity: Current production of ~1,334 tons/ employee(1)
In-house training programs internal faculty
Continuously investing, building and enhancing competencies
Integrated operations
Integrated manufacturing facilities: From pelletisation / beneficiation to downstream value-add capabilities
Dedicated port and railway siding for logistics support
100% assured power supply through captive power plants and arrangements with JSW Energy and the power grid
Resulting in operational efficiency with:
Reduced raw material costs
Focus on process improvements
Waste gas utilization for power generation
Solid waste management and zero effluent discharge
Efficient operations resulting in low conversion cost
High level of integration and technological expertise leading to reduced production cost and time
6

20(1) IGAAP based Gross Block as on Mar 31, 2017 (` 65,485 Crores translated at USD/`. = 64.8386 RBI Reference as on Mar 31, 2017) divided by total capacity (18MTPA)
Strategic expansion aided by strong project execution
Focus on low cost and returns accretive brownfield projects to capitalise on expected demand growth
Strong project execution capabilities …
Experienced in-house project management team
Supported by cross-functional team (commercial, finance and legal department)
Established long-term relationship with key domestic and international suppliers
Savings in procurement cost by negotiating firm prices for follow-on orders
… at low specific investment cost(1)
Low specific investment cost of $561/ton of capacity expansion shows cost and project management efficiency
Major new & on-going Projects
Vijayanagar Works:
BF-3 revamp & upgradation, CRM-1 complex capacity expansion, Pipe Conveyor System for Iron ore and new Water Reservoir
Dolvi Works:
Capacity expansion to 10 MTPA, 1.5MTPA Coke Oven at Dolvi Coke Projects Limited
Salem Works:
Capacity expansion from 1 MTPA to 1.2 MTPA by setting up certain new facilities and debottlenecking/modification of existing facilities
Setting-up of Reheating Furnace in Bar Rod Mill, Coke Oven and Turbo Generator
Vasind and Tarapur Works:
Modernization-cum-capacity enhancement, 0.2MTPA Tin plate mill
7

21(1) Implemented in a wholly owned subsidiary Amba River Coke Limited.
Proven ability to acquire and turnaround assets
December 2010 Completed Initiatives—FY2011–2015 FY2016-2017
Inability to service existing debt
Inadequate cashflows
Corporate debt restructuring (CDR) case
Exit from CDR
Generating positive profit after tax
Plant under maintenance Loss making at EBITDA level High interest cost Financially distressed
Infusion of equity Alignment of marketing strategies resulting in freight
synergies and VAT benefits Reduction of high cost working capital funding Refinancing of existing debt Electricity sourcing from JSW Energy at competitive
prices Commissioning of 4MTPA pellet plant(1), 1MTPA coke
oven(1), waste gas based 55MW power plant, railway siding, and lime calcination plant
Capacity expanded to 5MTPA Diversified product offering from Flat
steel only to mix of Flat and Long steel
Stabilized/ ramped-up the expanded capacity
Case Study: Turnaround strategy at JSW Ispat’s Dolvi plant
JSW Steel has a proven track record of acquiring troubled assets and turning them around in record time by closely integrating them with its existing operations thus creating synergies and optimizing cost
Able to leverage an acquisition to maximum value accretion through application of knowledge and experience
8
22
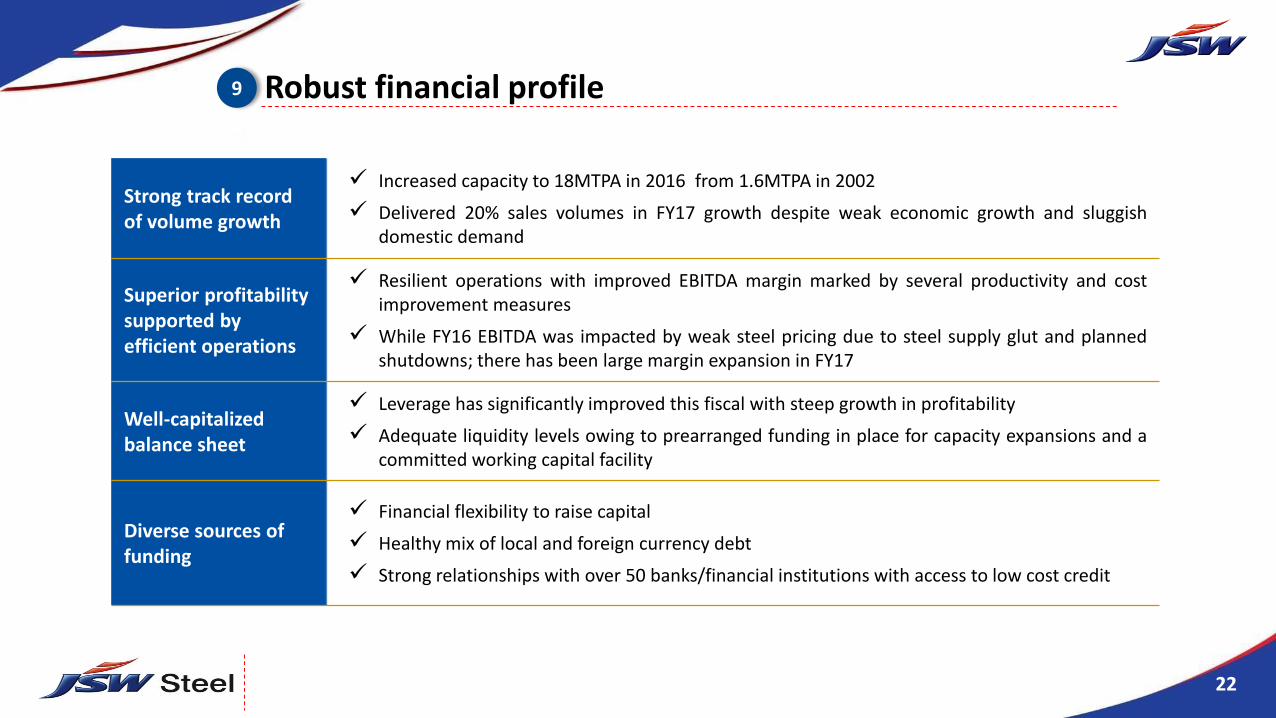
Robust financial profile
Strong track record of volume growth
Increased capacity to 18MTPA in 2016 from 1.6MTPA in 2002
Delivered 20% sales volumes in FY17 growth despite weak economic growth and sluggishdomestic demand
Superior profitability supported by efficient operations
Resilient operations with improved EBITDA margin marked by several productivity and costimprovement measures
While FY16 EBITDA was impacted by weak steel pricing due to steel supply glut and plannedshutdowns; there has been large margin expansion in FY17
Well-capitalized balance sheet
Leverage has significantly improved this fiscal with steep growth in profitability
Adequate liquidity levels owing to prearranged funding in place for capacity expansions and acommitted working capital facility
Diverse sources of funding
Financial flexibility to raise capital
Healthy mix of local and foreign currency debt
Strong relationships with over 50 banks/financial institutions with access to low cost credit
9

23
Historical EBITDA per ton – JSW Steel Standalone
6,2
62
7,5
88
7,5
89
7,0
77
9,2
31
5,8
92
4,0
59
5,4
00
5,3
98
5,4
69
6,9
88
8,5
34
8,5
45
8,0
52
7,4
78
7,1
37
6,8
59
6,9
85
6,0
54
7,0
28
8,4
02
7,1
51
6,5
69
6,8
87
8,3
40
9,5
46
6,2
79
6,2
68
8,6
86
1QF
18
4Q
FY
17
3Q
FY
17
2Q
FY
17
1QF
Y17
4Q
FY
16
3Q
FY
16
2Q
FY
16
1QF
Y16
4Q
FY
15
3Q
FY
15
2Q
FY
15
1QF
Y15
4Q
FY
14
3Q
FY
14
2Q
FY
14
1QF
Y14
4Q
FY
13
3Q
FY
13
2Q
FY
13
1QF
Y13
4Q
FY
12
3Q
FY
12
2Q
FY
12
1QF
Y12
4Q
FY
11
3Q
FY
11
2Q
FY
11
1QF
Y11
EB
IT
DA
(R
s p
er
to
n)

24
Agenda
Overview Value Proposition
Performance Overview
Guidance Business Environment

25
Key highlights – 1QFY18
Standalone performance
Crude Steel production: 3.91 million tonnes
Steel sales: 3.51 million tonnes
Quarterly EBITDA : ` 2,198 crores
Net Debt to Equity: 1.71x and Net Debt to EBITDA: 3.81x
JSW Steel Coated Products
Highest ever quarterly Steel sales: 0.48 million tonnes
Highest ever quarterly EBITDA: ` 205 crores
Consolidated performance
Quarterly Operating EBITDA : ` 2,617 crores
Net Debt to Equity: 1.97x and Net Debt to EBITDA: 3.76x
Key update
2nd prize to Tarapur works and 3rd prize to Kalmeshwar Works for excellence in energy conservation and management in ‘Metal & Steel’ category at 11th State level energy conservation award by Maharashtra Energy development Agency (MEDA)

26
3.87 3.914.10
1QFY17 1QFY18 4QFY17
Crude Steel Production
All figures are in million tonnes
Quarterly volumes – standalone
YoY
+1%
1QFY17 1QFY18 4QFY17
Flat 2.74 2.76 2.98
Long 0.85 0.83 0.82
3.343.51
3.96
1QFY17 1QFY18 4QFY17
Steel Sales
YoY
+5%
1QFY17 1QFY18 4QFY17
Flat 2.48 2.57 2.90
Long 0.74 0.75 0.78
Semis 0.12 0.18 0.27
QoQ
-5%
QoQ
-11%
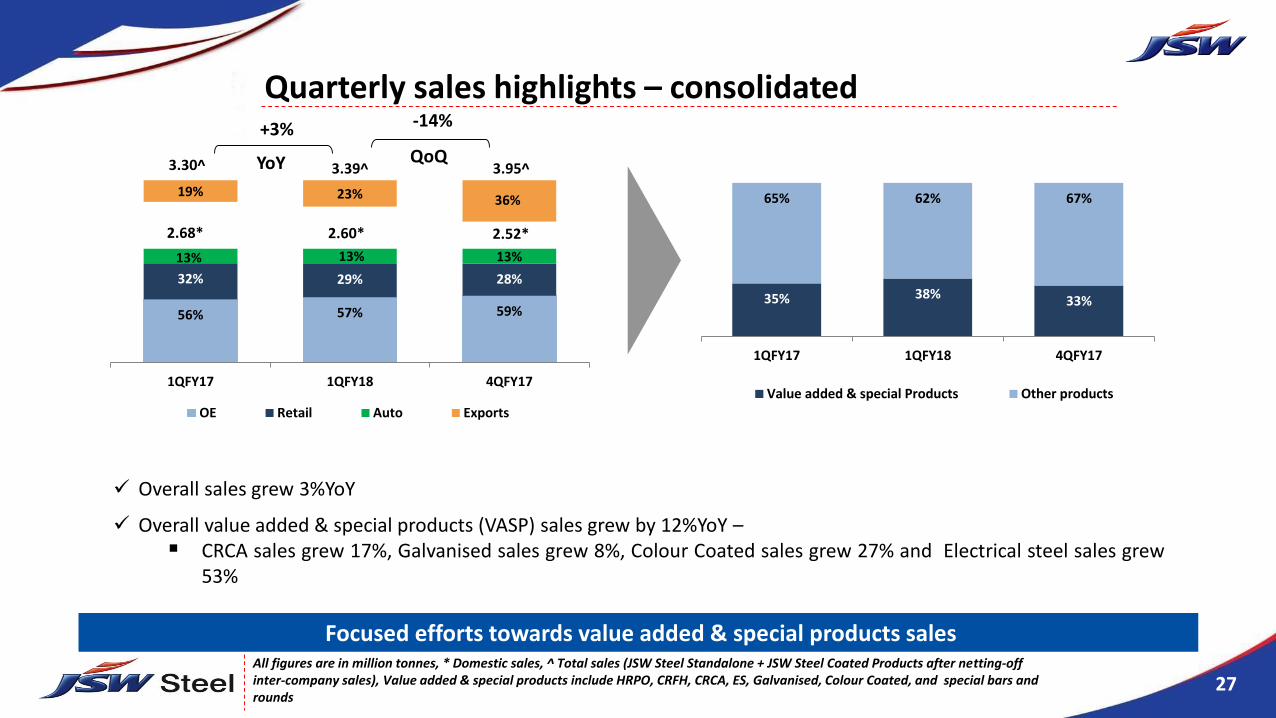
27All figures are in million tonnes, * Domestic sales, ^ Total sales (JSW Steel Standalone + JSW Steel Coated Products after netting-off inter-company sales), Value added & special products include HRPO, CRFH, CRCA, ES, Galvanised, Colour Coated, and special bars and rounds
Quarterly sales highlights – consolidated
56% 57% 59%
32% 29% 28%
13% 13% 13%
2.68* 2.60* 2.52*
19% 23% 36%
3.30^ 3.39^ 3.95^
1QFY17 1QFY18 4QFY17
OE Retail Auto Exports
35% 38% 33%
65% 62% 67%
1QFY17 1QFY18 4QFY17
Value added & special Products Other products
Overall sales grew 3%YoY
Overall value added & special products (VASP) sales grew by 12%YoY – CRCA sales grew 17%, Galvanised sales grew 8%, Colour Coated sales grew 27% and Electrical steel sales grew
53%
Focused efforts towards value added & special products sales
YoY
+3%
QoQ
-14%

28
Branded Sales ratio to overall retail sales grew to 54%
Added 263 new Retailers to the network; JSW now has footprints across 575 districts with over 8,100 exclusive and non-exclusive retail outlets
Engaged with 900+ influencer/ retailers through 90+ meets
Retail segment highlights for 1QFY18
846761
707
1QFY17 1QFY18 4QFY17
Retail sales (‘000 tonnes)
52% 54% 54%
48% 46% 46%
1QFY17 1QFY18 4QFY17
Branded Sales Others

29
Particulars 1QFY18 1QFY17
` Crores USD mn ` Crores USD mn
Revenue from operations 15,096 2,332 12,021 1,857
Operating EBITDA 2,198 340 3,083 476
Other Income 48 7 44 7
Finance Cost 907 140 863 133
Depreciation 732 113 729 113
Profit Before Tax 607 94 1,535 237
Tax 188 29 453 70
Profit after Tax 419 65 1,082 167
Diluted EPS (`)* 1.73 4.48
USD/` = 64.7379 (RBI reference rate as on June 30, 2017)
* Not Annualized
1Q financials – standalone

30
3,083
2,198
143
1,957
(3,009)
24
EBITDA1QFY17
Volume NSR Cost Others EBITDA1QFY18
$476 $22
$302
($465)
$4 $340
USD/` = 64.7379 (RBI reference rate as on June 30, 2017)
Operating EBITDA movement – standalone
` crore/ USD mn

31
Volumes 1QFY18 1QFY17
Production 0.44 0.41
Sales 0.48 0.40
` crore
Operational performance – JSW Steel Coated Products
Million tonnes
Key P&L data 1QFY18 1QFY17
Revenue from Operations 3,060 2,194
Operating EBITDA 205 159
Profit after Tax 117 74

32
Sales (net tonnes) 1QFY18 1QFY17
Plate Mill 52,410 27,542
Pipe Mill 11,993 5,618
Production (net tonnes) 1QFY18 1QFY17
Plate Mill 65,491 37,859
Utilization (%) 28% 16%
Pipe Mill 11,562 4,598
Utilization (%) 8% 3%
USD mn
Net tonnes = 0.907 metric tonnes
Operational performance – US Plate & Pipe Mill
Key P&L data 1QFY18 1QFY17
Revenue from Operations 58.67 25.26
EBITDA 5.10 (5.45)

33
Particulars 1QFY18 1QFY17
` Crores USD mn ` Crores USD mn
Revenue from operations 15,977 2,468 12,886 1,990
Operating EBITDA 2,617 404 3,256 503
Other Income 41 6 33 5
Finance Cost 945 146 936 145
Depreciation 819 127 817 126
Profit Before Tax 894 138 1,536 237
Tax 284 44 451 70
Share of Associates and Joint Ventures 14 2 11 2
Profit after Tax 624 96 1,096 169
Diluted EPS (`)* 2.59 4.63
USD/` = 64.7379 (RBI reference rate as on June 30, 2017)
* Not Annualized
1Q financials – consolidated

34
41,549 43,323
5,068
501
3,277
34 449
Net Debt*as on Mar'17
New Loan Taken Repayments Pre-payments Fx Impact Movement inCash & CashEquivalents
Net Debt*as on Jun'17
$6,418
$783
($77)
($506)
$5 $69 $6,692
USD/` = 64.7379 (RBI reference rate as on June 30, 2017)
*Net Debt excludes Acceptances
Net debt movement – consolidated
` crore/ USD mn
Particulars 30.06.2017 31.03.2017
Cash & cash equivalent (` crore) 1,336 1,785
Net Debt/Equity (x) 1.97 1.85
Net Debt/EBITDA (x) 3.76 3.41
35
Agenda
Overview Value Proposition
Performance Overview
Guidance Business Environment
36
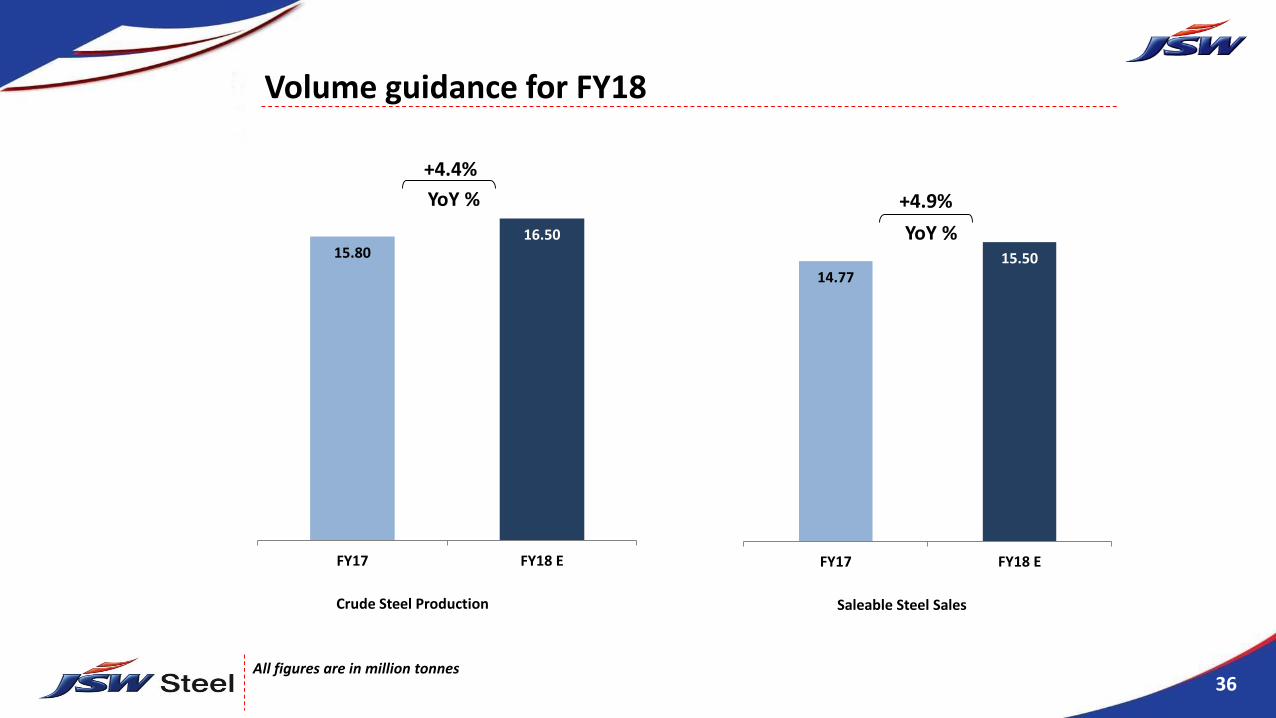
14.7715.50
FY17 FY18 E
Saleable Steel Sales
All figures are in million tonnes
Volume guidance for FY18
15.8016.50
FY17 FY18 E
Crude Steel Production
YoY %
+4.4%
YoY %
+4.9%

37All figures in ` crores
Rolling Capex Plan: FY18-21
FY17:4,300 2,800
8,000
FY18:2,700 4,200 1,050 530
19,200
3,235
18,815
Rolling Capex(FY17-FY18)
FY17 capexoutflow
CapexCarriedforward
Ind-ASimpact of
1.5mtpa CokeOven at DCPL
MiningCapex
Expansion/upgradtion
projects
Other costsaving
projects
Rolling Capex(FY18-FY21)
7,000
26,815
Debt:5,000
Debt:10,000
Equity:3,000
Equity:8,815
FY18 Capex FY19-FY21Capex
8,000
18,815
38
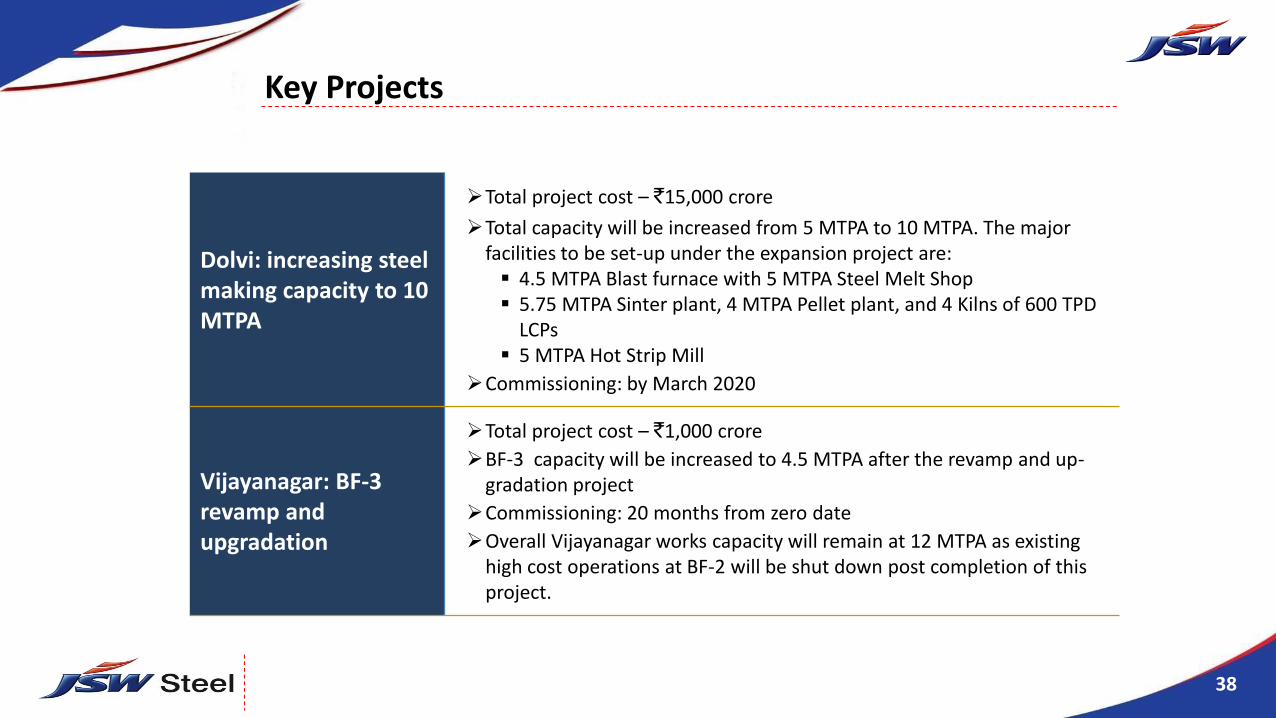
Key Projects
Dolvi: increasing steel making capacity to 10 MTPA
Total project cost – `15,000 crore
Total capacity will be increased from 5 MTPA to 10 MTPA. The major facilities to be set-up under the expansion project are: 4.5 MTPA Blast furnace with 5 MTPA Steel Melt Shop 5.75 MTPA Sinter plant, 4 MTPA Pellet plant, and 4 Kilns of 600 TPD
LCPs 5 MTPA Hot Strip Mill
Commissioning: by March 2020
Vijayanagar: BF-3 revamp and upgradation
Total project cost – `1,000 crore
BF-3 capacity will be increased to 4.5 MTPA after the revamp and up-gradation project
Commissioning: 20 months from zero date
Overall Vijayanagar works capacity will remain at 12 MTPA as existing high cost operations at BF-2 will be shut down post completion of this project.

39
Key Projects contd. …
Vijayanagar: CRM-1 complex capacity expansion
Total project cost – `2,000 crore
CRM1 complex capacity will be increased from 0.85 MTPA to 1.80 MTPA alongwith two Continuous Galvanizing Line of 0.45 MTPA each, a new 1.2 MTPA Continuous Pickling Line for HRPO products, and a new 0.80 MTPA HR Skin Pass Mill for HR Black & HRSPO products
Commissioning: by Sep 2019
Vasind and Tarapur : modernisation-cum-capacity enhancement
Total project cost – `1,200 crore
The modernisation cum capacity enhancement project includes:
increase in cold rolling capacity from 1.16 MTPA to 2.12 MTPA by replacing exisitng CR mills with Batch Tandem CR mills
increase in GI/GL capacity by 0.63 MTPA increase in colour coating capacity by 0.08 MTPA
Commissioning: by April 2019

40
Agenda
Overview Value Proposition
Performance Overview
Guidance Business Environment

41Source: Bloomberg, IMF and JSW Steel
Global economy
Global growth outlook remains firm
Global growth outlook on track, economic activity in bothadvanced and emerging / developing economies expected toaccelerate
US growth expectation marked down amidst less expansionarypolicy stance
Euro area activity continues to improve helped byexpansionary monetary policy and reduced politicaluncertainity as well as better domestic demand
Japan growth outlook turns marginally better than earliersupported by private consumption and export growth
Chinese economic growth positively surprise on the back offiscal policy supported front‐loaded infrastructure investment
3.2% 1.
7% 1.6%
1.8%
1.0% 4.
3%
7.1%
6.7%
3.5%
2.0%
2.1%
1.9%
1.3% 4.
6%
7.2
%
6.7%
World AMEs US EuroArea
Japan EMEs India China
2016 2017P
GDP growth - IMF projections for 2016 and 2017 (%YoY)
-4-202468
De
c-1
4
Mar
-15
Jun
-15
Sep
-15
De
c-1
5
Mar
-16
Jun
-16
Sep
-16
De
c-1
6
Mar
-17
Jun
-17
US Eurozone Japan China
Index of Industrial Production (% YoY)

42Source: World Steel, ISSB, MySteel and JSW Steel
Global steel scenario
Global steel demand growth appears to be better than earlier expectations
Global steel production grew by ~36mmt in 1HCY17 asagainst WSA’s CY17 estimate for demand growth of ~20mmt
However, China has positively surprised with a ~35mmtapparent steel demand growth in 1HCY17against a flattishdemand estimate by WSA’s for CY17. This growth wasprimarily driven by government stimulus
Overall Chinese steel exports have come down by ~28% in1HCY17
Exports from Japan and Korea continue to remain atelevated levels with pricing at a discount to their domesticmarket prices
Steel prices are improving with upward pressure on iron oreand coking coal amidst improved demand environment inChina
200
350
500
650
800
De
c-1
4
Mar
-15
Jun
-15
Sep
-15
De
c-1
5
Mar
-16
Jun
-16
Sep
-16
De
c-1
6
Mar
-17
Jun
-17
North America ExW North Europe ExWChina export FOB Black Sea export FOB
HR
C p
rice
s ($
/to
nn
e)
50
75
100
125
150
500
575
650
725
800
875
De
c-1
4
Mar
-15
Jun
-15
Sep
-15
De
c-1
5
Mar
-16
Jun
-16
Sep
-16
De
c-1
6
Mar
-17
Jun
-17
China apparent Steel Consumption (annualized, mmt)
China steel Exports (annualized, mmt) -RHS

43Source: JPC and JSW Steel, All figures are in million tonnes, ^Average monthly imports during FY16, * Apparent finished steel consumption net of double counting effect
Indian economy and steel industry
Steel imports, after correcting in April, have again risen to~8mmt on annualized basis
Crude steel production increased by 3.5%YoY in 1QFY18whereas apparent finished steel consumption grew by4.6%YoY
Steel demand is improving with increasing public sectorspending; reflected in increased activity in sectors likeroads, power T&D, solar energy, earthmoving equipments,pre-enginnered buildings, and water & gas pipelines,
Sluggish private capex remains a concern
Steel demand growth is on track to grow by ~5% in FY18
69
7
60
4
56
1 72
0
57
9
64
0 84
1
63
4
58
7
69
0
64
8
57
4
65
9
63
6
75
1 1,0
58
Jun
-17
May
-17
Ap
r-1
7
Mar
-17
Feb
-17
Jan
-17
De
c-1
6
No
v-1
6
Oct
-16
Sep
-16
Au
g-1
6
Jul-
16
Jun
-16
May
-16
Ap
r-1
6
FY1
6^
Monthly steel imports (in '000 tons)
23.7220.08
24.5621.01
Crude Steel
Production
Apparent Finished Steel
Consumption*
1QFY17
1QFY18
3.5%4.6%

44
Certain statements in this report concerning our future growth prospects are forward looking statements, which involve anumber of risks, and uncertainties that could cause actual results to differ materially from those in such forward lookingstatements. The risk and uncertainties relating to these statements include, but are not limited to risks and uncertaintiesregarding fluctuations in earnings, our ability to manage growth, intense competition within Steel industry including thosefactors which may affect our cost advantage, wage increases in India, our ability to attract and retain highly skilledprofessionals, time and cost overruns on fixed-price, fixed-time frame contracts, our ability to commission mines withincontemplated time and costs, our ability to raise the finance within time and cost client concentration, restrictions onimmigration, our ability to manage our internal operations, reduced demand for steel, our ability to successfully completeand integrate potential acquisitions, liability for damages on our service contracts, the success of the companies in which theCompany has made strategic investments, withdrawal of fiscal/governmental incentives, impact of regulatory measures,political instability, legal restrictions on raising capital or acquiring companies outside India, unauthorized use of ourintellectual property and general economic conditions affecting our industry. The company does not undertake to update anyforward looking statements that may be made from time to time by or on behalf of the company.
Forward looking and cautionary statement

45
Thank you