Journal of Marketing and Consumer Behaviour in …1... · Overview The Journal of Marketing and...
74
Journal of Marketing and Consumer Behaviour in Emerging Markets University of Warsaw Faculty of Management JMCBEM 1(1)2015 ISSN 2449-6634
Transcript of Journal of Marketing and Consumer Behaviour in …1... · Overview The Journal of Marketing and...
ISSN 2449-6634 © Faculty of Management University of Warsaw. All rights reserved.
Journal of Marketing and Consumer Behaviour in Emerging Markets 1(1)2015
Journal of Marketing and Consumer Behaviour
in Emerging Markets
University of Warsaw Faculty of Management
JMCBEM 1(1)2015
ISSN 2449-6634

OverviewThe Journal of Marketing and Consumer Behaviour in Emerging Markets (JMCBEM) is an open access journal. The submission of manuscripts is free of fee payment. This journal follows a double-blind reviewing procedure. The JMCBEM is indexed in ECONPAPERS and IDEAS/RePEC.
Aims and scopeUnderstanding consumer behaviour is crucial for the development of effective marketing strategies. The Journal of Marketing and Consumer Behaviour in Emerging Markets (JMCBEM) is an academic journal which aims at the dissemination of studies from a range of areas including marketing, consumer behaviour, consumer research and consumption, In addition, it intends to include case studies, as well as new concepts and practices reflecting managerial research. JMCBEM seeks to blend both theory and practice and thus contribute to the advancement of the field. We expect submitted articles to be theoretically sound, provide significant research findings and implications for existing approaches.
Special IssuesJMCBEM welcomes publication of Special Issues, whose aim is to bring together and integrate work on a specific theme; open up a previously under-researched area; or bridge the gap between formerly rather separate research communities, who have been focusing on similar or related topics. Thematic issues are strongly preferred to a group of loosely connected papers.Proposals of Special Issues should be submitted to [email protected]. All proposals are being reviewed by the Editorial Team on the basis of certain criteria that include e.g.: the novelty, importance and topicality of the theme; whether the papers will form an integrated whole; and the overall ‹added value› of a Special Issue.
Editorial BoardEditors❖ Editor in-chief: Dr Katarzyna Dziewanowska, University of Warsaw, Warsaw, Poland❖ Co-Editor: Dr Agnieszka Kacprzak, University of Warsaw, Warsaw, Poland
Editorial Advisory Board❖ Professor Marc Ant, Faculty of Business Administration, Bonn-Rhine-Sieg-University of Applied Sciences, Germany❖ Professor Gül Bayraktaroğlu,Faculty of Business, Dokuz Eylül University, Turkey❖ Professor Seong-Do Cho, College of Business and Administration, Chonnam National University, South Korea❖ Professor Carmen Costea, Spiru Haret University Bucharest, Romania❖ Professor Grzegorz Karasiewicz, Faculty of Management, University of Warsaw, Poland❖ Professor Ilsang Ko, College of Business and Administration, Chonnam National University, South Korea❖ Professor Robert Kozielski, Faculty of Management, University of Łódź, Poland❖ Professor Jan Nowak, Tischner European University, Poland❖ Professor Sanda Renko, Faculty of Economics & Business, University of Zagreb, Croatia❖ Professor Edyta Rudawska, Faculty of Economics and Management, Szczecin University❖ Professor Andrzej Wiatrak, Faculty of Management, University of Warsaw, Poland
Associate Editors❖ Dr Iwona Kowalska, Statistical Editor
Assistant Editor❖ Paulina Koziara
Editorial Office: Faculty of Management, University of Warsaw, Szturmowa Str. 1/3, Postal Code 02-678 Warsaw, Email: [email protected]
Publisher: Faculty of Management Publishing House, University of Warsaw, Szturmowa Str. 1/3, Postal Code 02-678 Warsaw; Telephone: +48 22 55 34 164; Fax: +48 22 55 34 001; [email protected]
© UW Faculty of Management 2015. Copyright by Faculty of Management University of Warsaw Publishing House
Webpage of Journal of Marketing and Consumer Behaviour in Emerging Markets:http://www.wz.uw.edu.pl/portale/journal-of-marketing-and-consumer-behaviour-in-emerging-markets/dzial/view-papers
Journal of Marketing and Consumer Behaviour in Emerging Markets 1(1)2015
ISSN 2449-6634 © Faculty of Management University of Warsaw. All rights reserved.

ISSN 2449-6634 © Faculty of Management University of Warsaw. All rights reserved.
Journal of Marketing and Consumer Behaviour in Emerging Markets 1(1)2015
Contents
Sharmuud Haliun, Seong-Do ChoThe Effects of Korean Country-of-Origin on Mongolian Consumer Product
Evaluation and Purchase Intention . . . . . . . . . . . . . . . . . . . . . . . . . . . . . . . . . . . . . 4
Natalia GmerekThe determinants of Polish movies’ box office performance in Poland . . . . . . . . . . . . . . . 15
M. Sadiq SohailGender differences in mall shopping:
a study of shopping behaviour of an emerging nation . . . . . . . . . . . . . . . . . . . . . . . 36
Agnieszka Kacprzak, Katarzyna DziewanowskaDoes a global young consumer exist? A comparative study
of South Korea and Poland . . . . . . . . . . . . . . . . . . . . . . . . . . . . . . . . . . . . . . . . . . 47
Michael C. Handrinos, Dimitrios Folinas, Konstantinos RotsiosUsing the SERVQUAL model to evaluate the quality of services
for a farm school store . . . . . . . . . . . . . . . . . . . . . . . . . . . . . . . . . . . . . . . . . . . . . 62

© Faculty of Management University of Warsaw. All rights reserved. DOI: 10.7172/2449-6634.jmcbem.2015.1.1
Journal of Marketing and Consumer Behaviour in Emerging Markets 1(1)2015 4
(4–14)
The Effects of Korean Country-of-Origin on Mongolian Consumer Product Evaluation and Purchase Intention
Sharmuud HaliunMBA, College of Business Administration
Chonnam National University, KoreaEmail: [email protected]
Seong-Do Cho*
Professor of Marketing, College of Business Administration Chonnam National University, Korea
E-mail: [email protected]
Received: 23 May 2014 / Revised: 20 January 2015 / Accepted: 16 February 2015 / Published online: 26 March 2015
ABSTRACT
The economy of Mongolia has been growing, especially due to imports growing more than exports. The purpose of this study is to examine the impact of a Korean country-of-origin on Mongolian consumer product evaluation and purchase intention using a Korean laptop. Specifically, this study tested the independent and moderating roles of human values and socio-psychological variables in the relationships between country-of-origin, product evaluation, and purchase intention. The survey was conducted with 143 young respondents in Mongolia. The results of this study indicate that Korean country-of-origin positively affects Mongolian consumer product evaluation and purchase intention. Second, because the human value of power is tied into consumers’ social status and positions, Mongolian consumers with more power had weaker purchase intention for Korean country-of-origin products. However, findings show that the international social network moderates effects of Korean country-of-origin in product evaluation. In other words, Mongolian consumers with connections to international people tend to positively evaluate products imported from developed Asian countries.
JEL classification: M00; M1; M3; F00; F2; F6
Keywords: Country-of-origin, Mongolian consumer, human value, international social network
1. INTRODUCTION
The lives of Mongolian consumers are linked to Asian markets and international trade more intensely than ever before. Consumers can choose foreign products ranging from basic necessities, such as water and tea, to advanced technological products, like automobiles and computers.
* Corresponding author, Yongbongro 77, Bukgu, Gwangju 500-757 Korea, TEL:+82-62-530-1445, FAX:+82-62-530-1449
© Faculty of Management University of Warsaw. All rights reserved. DOI: 10.7172/2449-6634.jmcbem.2015.1.1
Journal of Marketing and Consumer Behaviour in Emerging Markets 1(1)2015
Sharmuud Haliun, Seong-Do Cho
5
(4–14)
Only a select few of these products were available to Mongolian consumers a few decades ago. Now consumers of all social classes can afford to purchase a variety of foreign products. Many multinational corporations draw consumers’ attention to products by the product’s design, performance, the producer’s name, and the country-of-origin (COO). Phrases like “this product is from somewhere” or “it is made in another country” demonstrate the COO can play a significant role in advertising and selling products. For example, typical Mongolian customers think that Chinese products are of bad quality and Russian products are of good quality.
The “made-in” label increases consumers’ awareness of sourcing and represents attractive features of products from certain countries (Nebenzahl and Jaffe, 1998). Nagashima (1970) defines “made in” as the image, the picture, the reputation, and the stereotype that businessmen and consumers attach to products of a specific country. This image is created by representative products, national characteristics, economic and political background, history, and traditions. The label has a strong influence on consumer behavior in the international market, as it is associated with personal experience, mass communication, and views of national opinion leaders” (Nagashima, 1970).
This study follows a stream of prior studies on the effects of COO on product evaluation and consumer perceptions of product quality in markets in various stages of development (Pappu, Quester and Cooksey, 2007; Josiassen and Harzing, 2008; Usunier and Centre, 2008; Sharma, 2011). This stream of research suggests specific lines of inquiry into COO. First, the business community needs better understanding of how consumers attach importance to various cues like COO. Second, research needs to investigate the socio-psychological process that underlies consumer perceptions about products imported from developed and emerging markets. Finally, inquiries are needed into consumers’ intentions towards imported products from different types of markets (Sharma, 2011). Mongolian consumers provide an opportunity to study these three questions. Mongolia is an emerging market country in Asia and has high imports from all around the world, especially developed Asian countries such as Korea. There is little research exploring the effects of COO on Mongolian consumer product evaluation and purchase intention (hereinafter PE and PI, respectively). Therefore, this study examines the effects of Korean COO on Mongolian consumer PE and Mongolian consumer PI toward a Korean product. In addition, this study investigates if the values of the Mongolian consumer play independent and moderating roles in the Korean COO and Mongolian consumer PE relationship and Mongolian consumer PI toward a Korean product.
2. THEORETICAL BACKGROUND AND HYPOTHESES
2.1. The effect of Country-of-Origin
Schooler (1965) is generally considered the first researcher to empirically study the link between COO and the PE. Other prior research on COO effects discusses diverse theoretical perspectives about COO preferences. Some authors stipulate that consumers in developed countries generally prefer domestic products to imported ones (Samiee, 1994; Elliott and Cameron, 1994; Hulland, et al., 1996). Other findings assert that consumers from developing countries prefer imported products from developed countries (Ahmed and d’Astous, 2008; Sharma, 2011). These theories show that COO effects vary from one country to another because of differences in economic, sociocultural, and political factors. Furthermore, COO effects are influenced by demographics (Shimp and Sharma, 1987; Maheswaran, 1994). Research demonstrates that COO effects are particularly strong among the elderly, less educated and politically conservative groups. In addition, these effects are related to consumer knowledge, familiarity, and experience with a product category or a specific brand (Scheafer, 1997), and involvement.
© Faculty of Management University of Warsaw. All rights reserved. DOI: 10.7172/2449-6634.jmcbem.2015.1.1
Journal of Marketing and Consumer Behaviour in Emerging Markets 1(1)2015
Sharmuud Haliun, Seong-Do Cho
6
(4–14)
Consumers use an evaluation-based inference (Alba and Hutchinson, 1987) to reason that a product image correlates with the producer country (Yaprak and Parameswaran, 1986). A halo effect is a phenomenon where consumers make inferences about product quality based on the image they have about a country. Han (1989) found that when judging an unfamiliar product, consumers infer the product quality based on a country’s image, which then influences consumers’ attitudes toward other attributes.
Consumers use intrinsic and extrinsic cues to evaluate products. Intrinsic cues involve the physical composition of a product (e.g., taste, design, and other tangible features), whereas extrinsic cues are related to a brand name, retailer reputation, products’ COO and warranty (Ahmed and d’Astous, 2008). As an extrinsic cue, products’ COO can be manipulated without physically changing the products. Although they have no direct impact on the product’s performance, extrinsic cues are part of the product’s total image and thus can influence consumers’ PE and PI.
COO effects depend on product categories (Roth and Romeo, 1992) and product dimensions (Leoniduo et al., 1999). Consumers stereotype countries based on the counties’ level of industrialization or development (Iyer and Kalita, 1997), and degree of marketing sophistication and manufacturing infrastructure for the product (Chryssochoidis, Krystallis, and Perreas, 2007). Additionally, consumers tend to use COO stereotypes when product information is ambiguous (Leonidou et al., 1999; Martin, Lee and Lacey, 2011). A handful of research studies confirm the existence of national stereotyping phenomenon in the U.S. and Japan (Nagashima, 1970), Finland (Darling and Kraft, 1977), England (Bannister and Saunders, 1978), France (Baumgartner and Jolibert, 1978) and Canada (Wall and Heslop, 1986).
The effects of COO on PE and PI show that consumers perceive products to be higher quality if made in developed countries in comparison to products from emerging markets (Josiassen and Harzing, 2008; Pappu, Quester, and Cooksey, 2007; Usunier and Cestre, 2008). Buying and possessing imported products may denote higher levels of material achievement for consumers in emerging markets, helping them make a positive impression on their peers (Cleveland, Laroche, and Papadopoulos, 2009). Especially in Asia, consumers in emerging markets perceive imported products form developed markets to be superior quality, and products from other emerging markets to be similar or inferior to their domestic products (Hu et al., 2008; Kinra, 2006; Wang and Yang, 2008).
With regard to products from emerging market, studies of the COO effects on PE show a clear preference for foreign goods (Ettenson, 1993; Wang and Yang, 2008). However, studies did not show the same consensus in COO effects in terms of product attributes, product availability and complexity, perceptions about domestic products, private versus public consumption context, cultural orientation and ethnocentrism (Bandyopadhyay and Banerjee, 2002; Hu, Li, Xie, and Zhou, 2008; Huddleston, Good and Stoel, 2001; Kinra, 2006; Klein, Ettenson, and Krishnan, 2006; Lee, Garbarino, and Lerman, 2007; Reardon, Miller, Vida, and Kim, 2005; Supphellen and Gronhaug, 2003). This study asks: “Does a developed country’s (Korea) COO have a positive effect on emerging market (Mongolian) consumers’ PE and PI?”
1.2. Human Value
Rokeach (1973) suggests that human values guide principles in one’s life and these values are tied to self-concept. Thus, a person chooses products that reflect his or her values and opinions. For instance, if a cultural group interprets Gatorade as symbolizing “a sense of achievement,” individuals will perceive the product based on their values of achievement. People who value “a sense of achievement” would perceive that Gatorade tastes good and have a favorable attitude and PI toward it, whereas those who reject “a sense of achievement” would experience negative feelings about Gatorade (Allen, 2008).

© Faculty of Management University of Warsaw. All rights reserved. DOI: 10.7172/2449-6634.jmcbem.2015.1.1
Journal of Marketing and Consumer Behaviour in Emerging Markets 1(1)2015
Sharmuud Haliun, Seong-Do Cho
7
(4–14)
Allen and Ng (1999) found that among the consumers who consider the symbolic meaning of products important, human values had a significant influence on their final product choice. In addition, Allen (2002) experimented with the human value content using symbolic meaning of a product and found that participants changed their product attitude (i.e., those who endorsed the value became favorable, whereas those who rejected the value became negative).
Thus, to study the specific human values to be associated with a product, this study will use domains outlined by Schwartz (1992) for the selection of individual human values and subsequent analyses.
Two steps were taken to decide which specific values and value domains should be used and associated with a product for Mongolian consumers. The first step was to understand human values. The second step was to select value domains for the manipulation; these domains would include the individual values chosen to test with Mongolian consumers. Four domains were selected from Schwartz (1992). First, Schwartz’s universalism domain includes values such as world of peace, social justice, inner harmony, protection of environment, unity with nature, world of beauty, wisdom, equality, broadmindedness, and location in self-transcendence. Second, the power domain is the least similar to universalism, and includes values such as seeking authority, wealth, social recognition, and preserving one’s public image. Third, the security domain was chosen because it represents a midway point between the universalism and power domains. The security domain includes values such as national security, family security, social order, reciprocation of favors, sense of belonging, and cleanliness. Finally, international social network was included because it is closely associated with globalization and COO.
Prior research has used human values to explain cross-cultural consumers’ attitude, perception, intention, and evaluation. This study conceptualizes COO in terms of human values for investigation. Approaches such as the activities-interests-opinions (Wells and Tigert, 1971) and the observations of values all aim to uncover and leverage the link between product attributes and consumer values. For instance, Allen and colleagues (Allen, 2002; Allen, Gupta, and Monnier, 2008) show that Australian consumers evaluate a product such as meat more favorably because it is associated with the human value of power. Because the power value is connected to social status, the power value could moderate the impact of COO. For instance, social status could lessen Mongolian consumer PE and PI for a high involvement product like a Korean laptop. Similarly, security increases passive attitudes, possibly leading to a negative impact on Mongolian consumer PE and PI. However, international social network could enhance the influence of Korean COO on PE and PI because networks could broaden Mongolian consumers’ global point of view and tolerance of others.
Some antecedents demonstrate that security and tradition have negative effects on global products but positive effects on local products. On the contrary, power and universalism have demonstrated positive effects on global products, but negative effects on local products (Steenkamp and de Jong, 2010). Therefore, this study suggests the following hypotheses.
H1: Korean COO has a positive influence on Mongolian consumer PE and PI toward a Korean product.
H2: Mongolian consumers with high universalism and international social network values have more favorable PE and PI toward a Korean product than consumers with low universalism and international social network values.
H3: Mongolian consumers with low security and power values have more favorable PE and PI toward a Korean product than consumers with high universalism and international social network values.

© Faculty of Management University of Warsaw. All rights reserved. DOI: 10.7172/2449-6634.jmcbem.2015.1.1
Journal of Marketing and Consumer Behaviour in Emerging Markets 1(1)2015
Sharmuud Haliun, Seong-Do Cho
8
(4–14)
H4: In the relationship between Korean COO and PE and PI, universalism and international social network increase the influence of Korean COO on Mongolian consumer PE and PI.
H5: In the relationship between Korean COO and PE and PI, security and power decrease the influence of Korean COO on Mongolian consumer PE and PI.
3. METHOD
3.1. Research design and sample
This study used a survey method to investigate the effects of COO on Mongolian consumer PE and PI toward a Korean product. A total of 143 Mongolian consumers were contacted using convenience sampling. A laptop was chosen as a durable product due to its familiarity and universal use by both genders. In addition to its universality in these two categories, Korea has a dominant market share with a positive perception in the Mongolian laptop market. The method chosen for this study sought to answer the research questions in such a manner that would test the effects of COO on consumers’ responses under the circumstance that only COO information was available. The questionnaire was firstly prepared in the English language and translated into the Mongolian language. It was pretested with ten Mongolian students and reworded.
A total of 143 usable questionnaires were included in the data analysis. Of the total of 143 respondents, 67 (53.20%) were male, 76 (46.80%) were female. 107 (74.80%) were 18–29 years old, 31 (21.70%) were 30–49 years old, and 5 (3.50%) were 50–64 years old. The most common level of education was college graduate at 101 (70.60%). Other educational levels represented were 21 respondents with post-graduate degrees (15.00%), 12 with trade/technical/vocational training (8.40%), six with some college (4.20%), and three were high school graduates (2.10%). There were no respondents with only ‘Some high school’.
3.2. Measurement
All the items of this study are listed in Table 1. Overall, this study measured two types of constructs as discussed above. The first type is general values and the second type is consumer-domain specific values. General values such as universalism, security, and power used by Steenkamp and de Jong (2010) were modified for this study. This study modified the measures used by Nijssen and Douglas (2008) to measure international social network. For this study, PI and PE measures used by Sharma (2011) were modified. COO measures were developed and tested in terms of reliability and validity.
© Faculty of Management University of Warsaw. All rights reserved. DOI: 10.7172/2449-6634.jmcbem.2015.1.1
Journal of Marketing and Consumer Behaviour in Emerging Markets 1(1)2015
Sharmuud Haliun, Seong-Do Cho
9
(4–14)
4. RESULTS
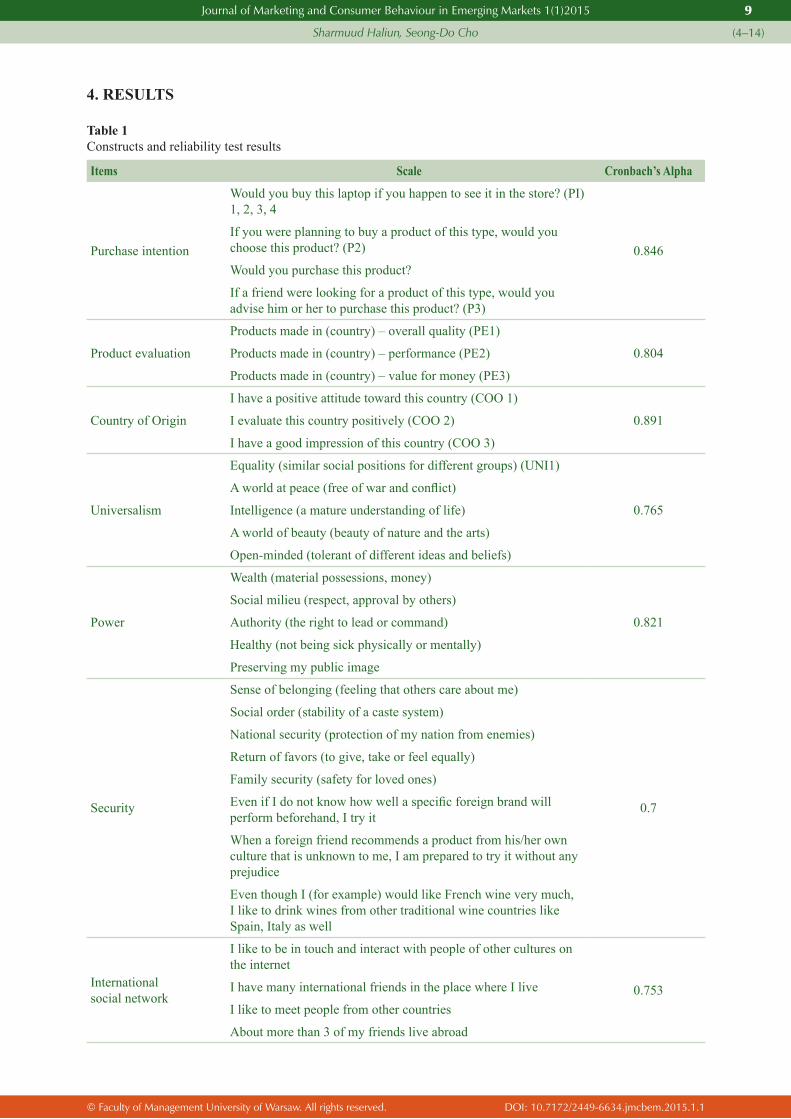
Table 1Constructs and reliability test results
Items Scale Cronbach’s Alpha
Purchase intention
Would you buy this laptop if you happen to see it in the store? (PI) 1, 2, 3, 4
0.846If you were planning to buy a product of this type, would you choose this product? (P2)
Would you purchase this product?
If a friend were looking for a product of this type, would you advise him or her to purchase this product? (P3)
Product evaluation
Products made in (country) – overall quality (PE1)
0.804Products made in (country) – performance (PE2)
Products made in (country) – value for money (PE3)
Country of Origin
I have a positive attitude toward this country (COO 1)
0.891I evaluate this country positively (COO 2)
I have a good impression of this country (COO 3)
Universalism
Equality (similar social positions for different groups) (UNI1)
0.765
A world at peace (free of war and conflict)
Intelligence (a mature understanding of life)
A world of beauty (beauty of nature and the arts)
Open-minded (tolerant of different ideas and beliefs)
Power
Wealth (material possessions, money)
0.821
Social milieu (respect, approval by others)
Authority (the right to lead or command)
Healthy (not being sick physically or mentally)
Preserving my public image
Security
Sense of belonging (feeling that others care about me)
0.7
Social order (stability of a caste system)
National security (protection of my nation from enemies)
Return of favors (to give, take or feel equally)
Family security (safety for loved ones)
Even if I do not know how well a specific foreign brand will perform beforehand, I try it
When a foreign friend recommends a product from his/her own culture that is unknown to me, I am prepared to try it without any prejudice
Even though I (for example) would like French wine very much, I like to drink wines from other traditional wine countries like Spain, Italy as well
International social network
I like to be in touch and interact with people of other cultures on the internet
0.753I have many international friends in the place where I live
I like to meet people from other countries
About more than 3 of my friends live abroad
© Faculty of Management University of Warsaw. All rights reserved. DOI: 10.7172/2449-6634.jmcbem.2015.1.1
Journal of Marketing and Consumer Behaviour in Emerging Markets 1(1)2015
Sharmuud Haliun, Seong-Do Cho
10
(4–14)
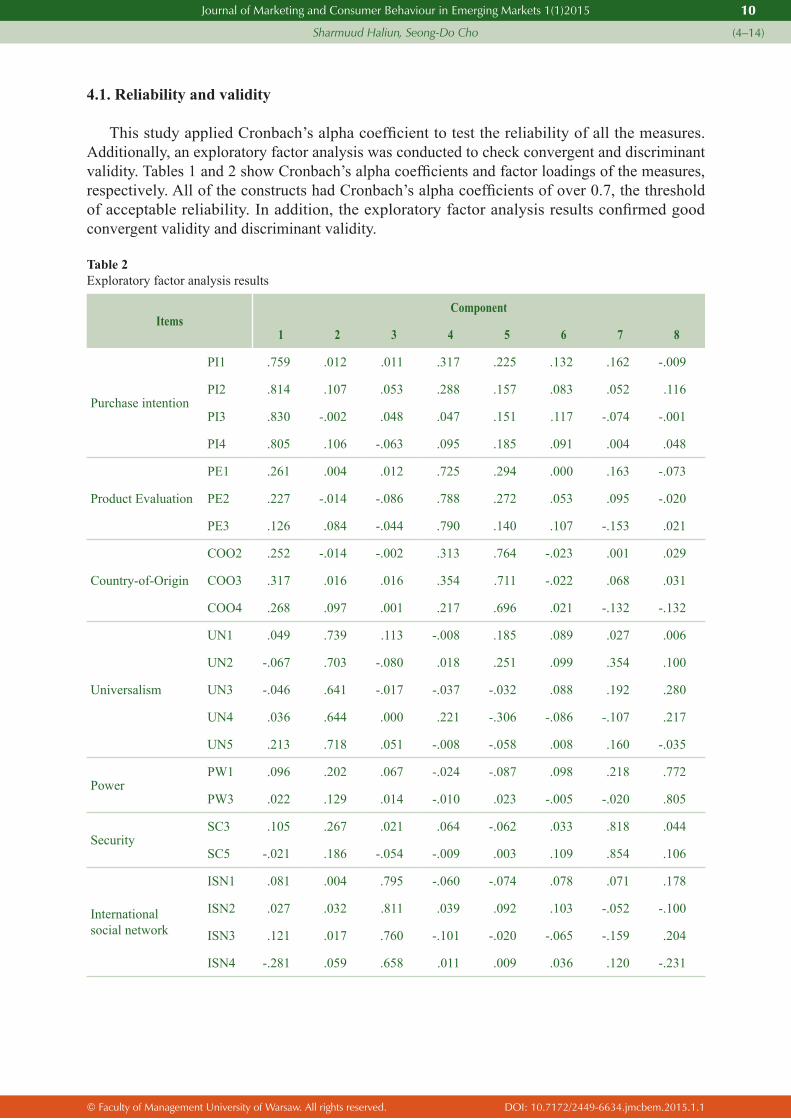
4.1. Reliability and validity
This study applied Cronbach’s alpha coefficient to test the reliability of all the measures. Additionally, an exploratory factor analysis was conducted to check convergent and discriminant validity. Tables 1 and 2 show Cronbach’s alpha coefficients and factor loadings of the measures, respectively. All of the constructs had Cronbach’s alpha coefficients of over 0.7, the threshold of acceptable reliability. In addition, the exploratory factor analysis results confirmed good convergent validity and discriminant validity.
Table 2Exploratory factor analysis results
ItemsComponent
1 2 3 4 5 6 7 8
Purchase intention
PI1 .759 .012 .011 .317 .225 .132 .162 -.009
PI2 .814 .107 .053 .288 .157 .083 .052 .116
PI3 .830 -.002 .048 .047 .151 .117 -.074 -.001
PI4 .805 .106 -.063 .095 .185 .091 .004 .048
Product Evaluation
PE1 .261 .004 .012 .725 .294 .000 .163 -.073
PE2 .227 -.014 -.086 .788 .272 .053 .095 -.020
PE3 .126 .084 -.044 .790 .140 .107 -.153 .021
Country-of-Origin
COO2 .252 -.014 -.002 .313 .764 -.023 .001 .029
COO3 .317 .016 .016 .354 .711 -.022 .068 .031
COO4 .268 .097 .001 .217 .696 .021 -.132 -.132
Universalism
UN1 .049 .739 .113 -.008 .185 .089 .027 .006
UN2 -.067 .703 -.080 .018 .251 .099 .354 .100
UN3 -.046 .641 -.017 -.037 -.032 .088 .192 .280
UN4 .036 .644 .000 .221 -.306 -.086 -.107 .217
UN5 .213 .718 .051 -.008 -.058 .008 .160 -.035
PowerPW1 .096 .202 .067 -.024 -.087 .098 .218 .772
PW3 .022 .129 .014 -.010 .023 -.005 -.020 .805
SecuritySC3 .105 .267 .021 .064 -.062 .033 .818 .044
SC5 -.021 .186 -.054 -.009 .003 .109 .854 .106
International social network
ISN1 .081 .004 .795 -.060 -.074 .078 .071 .178
ISN2 .027 .032 .811 .039 .092 .103 -.052 -.100
ISN3 .121 .017 .760 -.101 -.020 -.065 -.159 .204
ISN4 -.281 .059 .658 .011 .009 .036 .120 -.231
© Faculty of Management University of Warsaw. All rights reserved. DOI: 10.7172/2449-6634.jmcbem.2015.1.1
Journal of Marketing and Consumer Behaviour in Emerging Markets 1(1)2015
Sharmuud Haliun, Seong-Do Cho
11
(4–14)
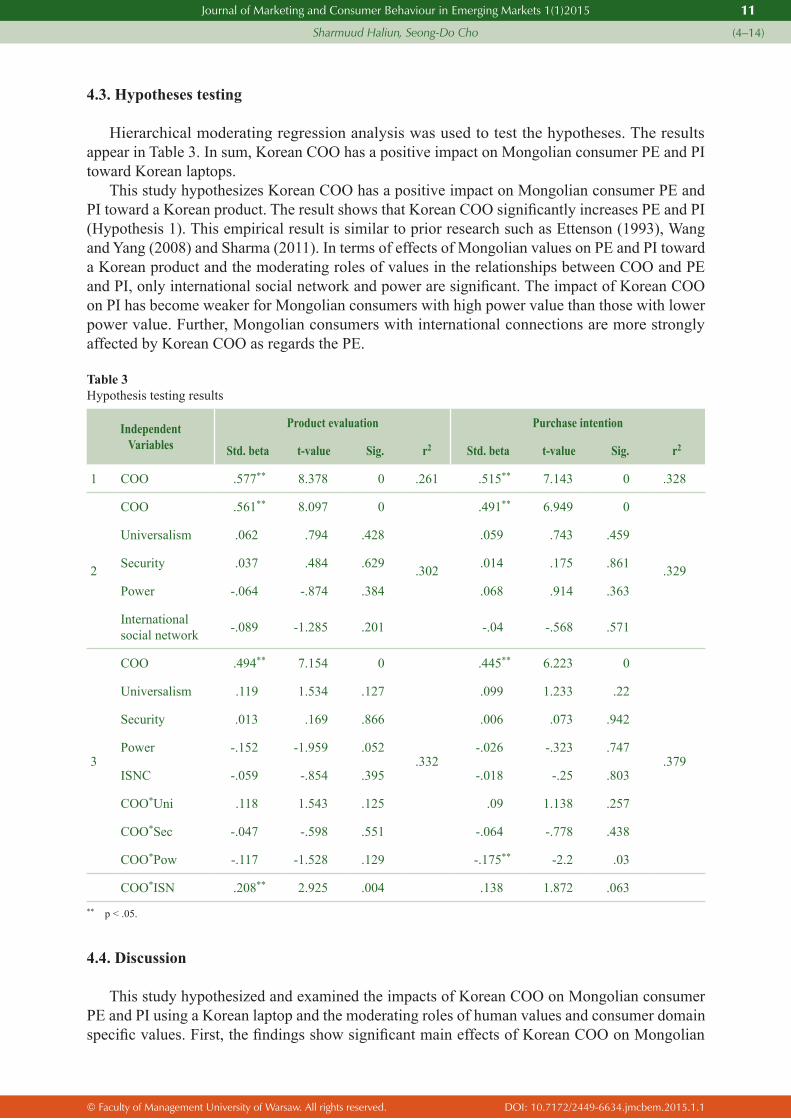
4.3. Hypotheses testing
Hierarchical moderating regression analysis was used to test the hypotheses. The results appear in Table 3. In sum, Korean COO has a positive impact on Mongolian consumer PE and PI toward Korean laptops.
This study hypothesizes Korean COO has a positive impact on Mongolian consumer PE and PI toward a Korean product. The result shows that Korean COO significantly increases PE and PI (Hypothesis 1). This empirical result is similar to prior research such as Ettenson (1993), Wang and Yang (2008) and Sharma (2011). In terms of effects of Mongolian values on PE and PI toward a Korean product and the moderating roles of values in the relationships between COO and PE and PI, only international social network and power are significant. The impact of Korean COO on PI has become weaker for Mongolian consumers with high power value than those with lower power value. Further, Mongolian consumers with international connections are more strongly affected by Korean COO as regards the PE.
Table 3Hypothesis testing results
IndependentVariables
Product evaluation Purchase intention
Std. beta t-value Sig. r2 Std. beta t-value Sig. r2
1 COO .577** 8.378 0 .261 .515** 7.143 0 .328
2
COO .561** 8.097 0
.302
.491** 6.949 0
.329
Universalism .062 .794 .428 .059 .743 .459
Security .037 .484 .629 .014 .175 .861
Power -.064 -.874 .384 .068 .914 .363
International social network -.089 -1.285 .201 -.04 -.568 .571
3
COO .494** 7.154 0
.332
.445** 6.223 0
.379
Universalism .119 1.534 .127 .099 1.233 .22
Security .013 .169 .866 .006 .073 .942
Power -.152 -1.959 .052 -.026 -.323 .747
ISNC -.059 -.854 .395 -.018 -.25 .803
COO*Uni .118 1.543 .125 .09 1.138 .257
COO*Sec -.047 -.598 .551 -.064 -.778 .438
COO*Pow -.117 -1.528 .129 -.175** -2.2 .03
COO*ISN .208** 2.925 .004 .138 1.872 .063** p < .05.
4.4. Discussion
This study hypothesized and examined the impacts of Korean COO on Mongolian consumer PE and PI using a Korean laptop and the moderating roles of human values and consumer domain specific values. First, the findings show significant main effects of Korean COO on Mongolian
© Faculty of Management University of Warsaw. All rights reserved. DOI: 10.7172/2449-6634.jmcbem.2015.1.1
Journal of Marketing and Consumer Behaviour in Emerging Markets 1(1)2015
Sharmuud Haliun, Seong-Do Cho
12
(4–14)
consumer PE and PI. Therefore, this study provides evidence that Mongolian consumers could have a favorable attitude and PI toward products imported from developed Asian countries (Ahmed and d’Astous, 2008; Verlegh and Steenkamp, 1999). Second, the study examines the direct and moderating impacts of international social network on the PE and PI of a Korean product. Interestingly, an international social network has a significant influence on PE. Mongolian consumers who have international social networks are willing to purchase a Korean laptop. This study did not demonstrate that Mongolian consumers have developed broadmindedness. Mongolia has a monoculture and nationalism for keeping pure Mongolian tradition, which would mean an introverted consumer view and denial of world-mindedness (Ahmed and d’Astous, 2008; Verlegh and Steenkamp, 1999). Therefore, international social network could play a significant role in accepting developed countries’ products in Asia. Another significant result was the power value, indicating that highly respected and powerful Mongolian consumers tend to be hesitating to purchase a Korean laptop because they would be conscious of other Mongolians’ evaluation and their inner social motive.
5. CONCLUSION AND LIMITATIONS
There are some limitations of this study including the product choice, types of goods, and sample. The product choice was not perfect because a laptop is a durable product and respondents had existing preferences due to previous exposure to famous brands. In reality, when consumers buy a laptop, they consider performance, size, cost-benefit ratio, price, and other consumer-specific specifications. Intangible services were not used in the study, which could limit the generalizability of the conclusion. Future research could use multiple products and services, a variety of durable goods, and an assortment of “Made In” labels. This can help negate respondent’s prior memories and knowledge of brands. In addition to simulating a real purchase environment, using intangible goods enables researchers to investigate and compare the impact of country-of-origin cues on consumer judgments in multiple situations. Consumers may obtain information about quality and performance by experiences and feelings. Using intangible services and multiple cues can facilitate the researchers’ examinations of consumers’ information processing regarding both PE and PI. In addition, the respondents of the survey were mostly young collegiate students. Therefore, in future research, diverse respondents should be included in the sample.
This study has some important business implications. For marketing, it is important to understand other countries’ consumers and cultures. When Western companies want to enter the Mongolian market, they could take advantage of developed Asian countries COO by using Asian brands and distributing products through developed Asian countries. Especially in developing Asian countries such as Mongolia, marketers need to appeal to international social connections with creative advertisements to reduce the negative influence of power value among consumers.
References
Alba, J.W. and Hutchinson, W.J. (1987) “Dimensions of Consumer Expertise”, Journal of Consumer Research, 13(4), pp. 411–454.
Ahmed, S.A. and d’Astous, A. (2008) “Antecedents, Moderators and Dimensions of Country-of-Origin Evaluation”, International Marketing Review, 25(1), pp. 75–106.
Bannister, J.P. and Saunders, J.A. (1978) “UK Consumers’ Attitudes towards Imports: The Measurement of National Stereotype Image”, European Journal of Marketing, 12(8), pp. 562–570.
Baumgartner, G. and Jolibert, A. (1978) “The Perception of Foreign Products in France”, Advances in Consumer Research, 5, pp. 603–605.
Cleveland, M., Michel, L. and Nicolas, P. (2009) “Cosmopolitanism, Consumer Ethnocentrism, and Materialism: An Eight-Country Study of Antecedents and Outcomes”, Journal of International Marketing, 17(1), pp. 116–146.
© Faculty of Management University of Warsaw. All rights reserved. DOI: 10.7172/2449-6634.jmcbem.2015.1.1
Journal of Marketing and Consumer Behaviour in Emerging Markets 1(1)2015
Sharmuud Haliun, Seong-Do Cho
13
(4–14)
Darling, J.R. and Kraft, F.B. (1977) “A Competitive Profile of Products and Associated Marketing Practices of Selected European and Non-European Countries”, European Journal of Marketing, 11(7), pp. 519–530.
Elliott, G.R., and Cameron, R.C. (1994) “Customer Perception of Product Quality and the Country-of Origin Effect”, Journal of International Marketing, 2(2), pp. 49–62.
Ettenson, R. (1993) “Brand Name and Country of Origin Effects in the Emerging Market Economies of Russia, Poland, and Hungary”, International Marketing Review, 10(5), pp. 14–36.
Han, C.M. (1989) “Country Image: Halo or Summary Construct”, Journal of Marketing Research, 26(2), pp. 222–229.Huddleston, P., Good, K.G. and Leslie, S. (2001) “Consumer Ethnocentrism, Product Necessity and Polish
Consumers’ Perceptions of Quality”, International Journal of Retail and Distribution Management, 29(5), pp. 236–246.
Hu, X., Li, L., Xie, C. and Zhou, J. (2008) “The effects of Country-of-Origin on Chinese Consumers’ Wine Purchasing Behavior”, Journal of Technology Management in China, 3(3), pp. 292–306.
Hulland, J., Todi, H.S. and Lecraw, D.J. (1996) “Country-of-Origin Effects on Sellers’ Price Premiums in Competitive Philippine Markets”, Journal of International Marketing, 4(1), pp. 57–79.
Hurt, T.H., Joseph, K. and Cook, C.D. (1977) “Scales for the Measurement of Innovativeness”, Human Communication Research, 14(1), pp. 58–65.
Iyer, G.R. and Kalita, J.K. (1997) “The Impact of Country of Origin and Country of Manufacture Cues on Consumer Perceptions of Quality and Value”, Journal of Global Marketing, 11(1), pp. 7–28.
Josiassen, A. and Harzing, A-W. (2008) “Descending from the ivory tower: Reflections on the Relevance and Future of Country of-Origin Research”, European Management Review, 5(4), pp. 264–270.
Klein, J.G., Ettenson, R. and Krishnan, B.C. (2006) “Extending the Construct of Consumer Ethnocentrism: when Foreign Products are Preferred”, International Marketing Review, 23(3), pp. 304–321.
Lee J., Garbarino, E. and Lerman, D. (2007) “How Cultural Differences in Uncertainty Avoidance Affect Product Perceptions.” International Marketing Review, 24(3), pp. 330–349.
Leonidou L.C., Hadjimarcou, J.S., Kaleka, A.A. and Stamenova, G.T. (1999) “Bulgarian Consumers’ Perceptions of Products Made in Asia Pacific”, International Marketing Review, 16(2), pp. 126–142.
Maheswaran, D. (1994) “Country-of-Origin as a Stereotype: Effects of Consumer Expertise and Attribute Strength on Product Evaluation”, Journal of Consumer Research, 21(2), pp. 354–366.
Martin, B.A., Wai, S., Lee, M.S. and Lacey, C. (2011) “Countering Negative Country of Origin Effects Using Imagery Processing”, Journal of Consumer Behavior, 10(2), pp. 80–92.
Nagashima, A. (1970) “A Comparison of Japanese and US. Attitudes toward Foreign Products, Journal of Marketing”, 34(1), pp. 68–74.
Nebenzahl, I.D. and Jaffe, E.D. (1998) “Ethical Dimensions of Advertising Executions”, Journal of Business Ethics, 17(7), pp. 805–815.
Nijssen, E.J. and Douglas, S.P. (2008) “Consumer World-Mindedness, Social-Mindedness, and Store Image”, Journal of International Marketing, 16(3), pp. 84–107.
Pappu, R., Quester, P.G. and Cooksey, R.W. (2007) “Country image and Consumer-Based Brand Equity: Relationships and Implications for International Marketing”, Journal of International Business Studies, 38(4), pp. 726–745.
Reardon, J., Miller, C., Vida, I. and Kim, I. (2005) “The Effects of Ethnocentrism and Economic Development on the Formation of Brand and ad Attitudes in Transitional Economies”, European Journal of Marketing, 39(7), pp. 737–754.
Rokeach, M. (1973) The Nature of Human Values, New York, The Free Press. Roth, M.S. and Romeo, J.B. (1992) “Matching Product Category and Country Image Perceptions: A Framework for
Managing Country-of-Origin Effect”, Journal of International Business Studies, 26(3), pp. 477–497.Samiee, S. (1994) “Consumer Evaluation of Products in a Global Market”, Journal of International Business Studies,
25(3), pp. 579–604.Schooler, R.D. (1965) “Product bias in the Central American Common Market”, Journal of Marketing Research,
2(4), pp. 394–397.Schwartz, S.H. (1992) “Universals in the Content and Structure of Values: Theoretical Advances and Empirical Test
in 20 Countries”, Advances in Experimental Social Psychology, 25, pp. 1–66.Sharma, P. (2011) “Country of Origin Effects in Developed and Emerging Markets: Exploring the Contrasting roles
of Materialism and Value Consciousness”, Journal of International Business Studies, 42(2), pp. 285–306.Shimp, T.A. and Sharma, S. (1987) “Consumer Ethnocentrism: Construction and Validation of the CETSCALE”,
Journal of Marketing Research, 24(3), pp. 280–289. Steenkamp, J.E.M., and de Jong, M.G. (2010) “A Global Investigation into the Constellation of Consumer Attitudes
Toward Global and Local Products”, Journal of Marketing, 74(6), pp. 8–40.Usunier, J-C and Cestre, G. (2008) “Further Considerations on the Relevance of Country-of-Origin Research”,
European Management Review, 5(4), pp. 271–274.Verlegh, Peeter W.J. and Steenkamp, Jan-Benedict (1999) “A Review and Meta-analysis of Country-of-Origin
Research, ” Journal of Economic Psychology, 20(5), pp. 521–546.
© Faculty of Management University of Warsaw. All rights reserved. DOI: 10.7172/2449-6634.jmcbem.2015.1.1
Journal of Marketing and Consumer Behaviour in Emerging Markets 1(1)2015
Sharmuud Haliun, Seong-Do Cho
14
(4–14)
Wall, M. and Heslop, L.A. (1986) “Consumer Attitudes Toward Canadian-made versus Imported Products”, Journal of Academy of Marketing Science, 14(2), pp. 27–36.
Wang, X. and Yang, Z. (2008) “Does Country-of-Origin matter in the Relationship between Brand Personality and Purchase Intention in Emerging Economies?: Evidence from China’s Auto Industry”, International Marketing Review, 25(4), pp. 458–474.
Yaprak, A. and Parameswaran, R. (1986) “Strategy Formulation in Multinational Marketing: A Deductive, Paradigm-Integrating Approach”, Advances in International Marketing, 1, pp. 21–45.

© Faculty of Management University of Warsaw. All rights reserved. DOI: 10.7172/2449-6634.jmcbem.2015.1.2
Journal of Marketing and Consumer Behaviour in Emerging Markets 1(1)2015 15
(15–35)
The determinants of Polish movies’ box office performance in Poland
Natalia Gmerek*
University of Warsaw, PolandE-mail: [email protected]
Received: 02.02.2015 / Revised: 07.04.2015 / Accepted: 14.04.2015 / Published online: 24.04.2015
ABSTRACT
This paper provides an empirical analysis of financial performance of movies produced in Poland between 2000 and 2011. To understand the reason for a motion picture’s success in the theatrical channel various factors concerning total domestic box office performance were regressed from the box office results of 207 movies. This study proposes that the success of a movie can be determined by three elements: product attributes, distribution-related variables and information sources.
The results show that the production budget, movie type – sequel or adaptation, star power, genre, scope of the movie’s release and audience rating are closely related to box office, influencing it in a positive way. On the other hand, critics’ rating, release date (April, July, August) and strong competitive pressure from other movies have a substantial negative influence on box office. The results suggest that the overall movie quality (product-related variables) has an economically and statistically significant effect on total demand for Polish movies.
JEL classification: M300, M310, M390, M00
Keywords: motion picture success, box office performance, multiple regression analysis
1. INTRODUCTION
For almost a century, and especially since World War II, Hollywood has dominated the national and international motion picture markets (Scott, 2004). Despite early beliefs that this domination could be redressed, the European and Hollywood film industries constantly battle. In spite of the strong domestic performance of Indian, Nigerian and, to a lesser degree, Korean productions, American film still dominates the global box office. While the number of films produced in India, Nigeria and Europe respectively is greater than in the US, the number of films produced does not correlate with the level of international exposure or revenue earned (Kerrigan, 2010). Global recognition and acceptance of American English and cultural references give American films an automatic advantage over European films on the movie market. It has become so difficult for European films, particularly non-English language productions, to penetrate international markets
* University of Warsaw, 1/3 Szturmowa Street, 02-678 Warsaw, Poland.
© Faculty of Management University of Warsaw. All rights reserved. DOI: 10.7172/2449-6634.jmcbem.2015.1.2
Journal of Marketing and Consumer Behaviour in Emerging Markets 1(1)2015
Natalia Gmerek
16
(15–35)
that European producers concentrate on their national audiences trying to fulfill their preferences as precisely as they can.
In this case, the key marketing challenge is to identify factors responsible for adequately high box office. Despite the growing number of publications on the factors determining motion picture performance, no explicit position concerning the relevancy and direction of influence of individual factors has been developed. The uniqueness of the motion picture markets in individual countries requires an individualized approach, consisting in the selection and operationalization of the analyzed factors. Based on a review of marketing literature, we can conclude that most of the research conducted so far in this respect focuses mainly on the American market, although in the last few years there has been a noticeable development of research dedicated to the identification of determinants of motion picture performance on individual European and Asian markets.
At the moment, the theatrical movie market in Poland is undergoing a phase of intense development. Every year more and more domestic cinematic productions are completed; however, the knowledge on the factors of a box office success or failure of a movie product is still rather scarce.
This paper seeks to fill this gap by presenting empirical results regarding the yet unexplored European market. The study concerns in particular the influence of a broad range of product attributes, distribution variables and information sources on the financial performance of feature films produced in Poland.
2. LITERATURE REVIEW
2.1. The notion of a motion picture’s success – an overview of measures and indicators
Numerous measures and indicators have been developed in marketing literature and market practice. These include (Simonton, 2009, pp. 403–405; Hadida, 2009, pp. 301–304):– total domestic box office– first-week box office– length of run– distributors’ rentals– exhibitors’ rentals– return on investment – ROI
The most popular measure applied by scientists who conducted research on the market success of motion pictures is the total box office (Hirschman and Pieros, 1985; Litman and Kohl, 1989; Wyatt and Badgar, 1990; Prag and Casavant, 1994; Sawhney and Eliashberg, 1996; De Vany and Walls, 1996; Eliashberg and Shugan, 1997; Ravid, 1999; De Vany and Walls, 1999; Ginsburg and Weyers, 1999; Bagella and Becchetti, 1999; Lampel and Shamsie, 2000; Zufryden, 2000; Eliashberg, Jonker, Sawhney and Wierenga, 2000; De Vany and Lee, 2001; Nelson, Donihue, Waldman and Wheaton, 2001; Hand, 2001; Canterbery and Marvasti, 2001; Collins, Hand and Snell, 2002; Elberse and Eliashberg, 2003; Holbrook, 2005; Delmestri, Montanari and Usai, 2005; Reinstein and Snyder, 2005; Ainslie, Dreye and Zufryden, 2005; Chang and Ki, 2005; Desai and Basuroy, 2005; De Vany and Walls, 2002; Walls, 1997, 2005a, 2005b; Liu, 2006; Lee, 2006; Hennig-Thurau, Houston and Sridhar, 2006; Sood, Dreze, 2006; Hadida, 2009; Simonton, 2009). There are several premises for the popularity of this measure among the researchers and analysts dealing with motion picture marketing. These include: regularity and rapidity of the collection of data on the number of tickets sold by specialized trade institutions, accessibility of data (total box office numbers are officially published), the possibility of comparison and analysis of performance-related data in various aspects (i.a. time and geographical location). Due to the

© Faculty of Management University of Warsaw. All rights reserved. DOI: 10.7172/2449-6634.jmcbem.2015.1.2
Journal of Marketing and Consumer Behaviour in Emerging Markets 1(1)2015
Natalia Gmerek
17
(15–35)
specific character of a motion picture’s length of run, namely the importance of the first screening phase, which is in most cases decisive in respect of the final movie performance results in the cinematic channel, the researchers more and more often focus on the first-week box office as an indicator of box office performance of a motion picture (De Vany and Walls, 1996; De Vany and Walls, 1999; Reinstein and Snyder, 2005); Ainslie, Dreye and Zufryden, 2005; Chang and Ki, 2005; Basuroy, Desai and Talukdar, 2006; Liu, 2006; Hennig-Thurau, Houston and Sridhar, 2006; Hennig-Thurau, Houston and Walsh, 2007).
Another measure of the market success of a motion picture is the length of run, that is the number of weeks of theatrical screenings. This criterion does not enjoy particular popularity among scientists and is not subject to deeper analyses. Marketing research proves that extension of a movie’s availability in theatres does not result in better box office performance (Sochay, 1994; De Vany and Walls, 1996; 1997; Walls, 1998; Jedidi, Krider and Weinberg, 1998); Lampel and Shamsie, 2000; Nelson, Donihue, Waldman and Wheaton, 2001; Chang and Ki, 2005; Lee, 2006). There are situations when a certain movie, after several screening weeks, generates higher sales than a movie screened for several dozen weeks.
Two further measures refer to the income from sales received by intermediaries on the movie market: distributor and exhibitor (Faulkner and Anderson, 1987; Baker and Faulkner, 1991; Sochay, 1994; Baimbridge, 1997; Albert, 1999; Litman, 1983; Smith and Smith, 1986; Wallace, Siegerman, and Holbrook, 1993; De Vany and Walls, 2002). For services provided to a given movie producer, these entities charge fees constituting part of the income from the tickets sold. This measure is highly subjective because the amount of fees received by individual entities is a derivative of both their negotiation force and market position.
The last and rarest measure encountered in professional and scientific publications is “return on investment”, that is a profitability indicator applied in order to measure the effectiveness of a company’s operation (Ravid, 1999; Lehmann, Weinberg, 2000; Miller and Shamsie, 2001; De Vany and Walls, 1999, 2002; Ravid and Basuroy, 2004; Jansen, 2005). The ROI depends on individual profit and the box office result per unit of invested assets. Due to the information necessary for the construction of this measure, the ROI is applied relatively rarely. The greatest problem for researchers is the determination of operational profit on the basis of data concerning the amount of total costs related to a movie production, in particular the P&A costs, which are difficult to assess. The method is considered useless and not accurate enough in the case of the motion picture market.
The analysis of determinants of motion picture performance conducted in this article refers to the total box office – a measure commonly assumed by the professional and scientific environment both on the foreign and Polish markets.
2.2. The determinants of motion picture performance – classification and importance on the market
The literature describing factors which influence the motion picture performance written so far focuses on two trends: psychological approach and economic approach. The psychological approach focuses on the problems related to the behavior of motion picture viewers. The marketing research conducted in this area mostly concerns questionnaire research sounding the opinions of individual viewers. It explains the motives and factors influencing consumers in the decision-making process regarding the selection of the movie theatre from among various forms of mass entertainment, as well as the selection of a particular movie1.
1 The psychological approach is presented in detail in the following publications: Cuadrado, M. and Frasquet, M. (1999), ‘Segmentation of cinema audiences: an exploratory study applied to young consumers’, Journal of Cultural Economics, Vol. 23 No. 4, pp. 257–267; D’Astous, A. and Touil, N. (1999), ‘Consumer evaluations of movies on the basis of critics’ judgments’, Psychology & Marketing, Vol. 16 No. 8, pp. 677–686;
© Faculty of Management University of Warsaw. All rights reserved. DOI: 10.7172/2449-6634.jmcbem.2015.1.2
Journal of Marketing and Consumer Behaviour in Emerging Markets 1(1)2015
Natalia Gmerek
18
(15–35)
The economic approach is focused on the issues of the quest for determinants influencing the financial performance of a given movie production. For this purpose, researchers usually use data concerning the sales of individual movie productions which are gathered in specialist databases. The analyses of dependencies between movie performance (box office) and selected factors are conducted with the use of various statistical tools.
In this article the author takes into consideration only the economic approach.
Based on broad literature (especially the work of Chang and Ki, 2005), this study proposes that the success of a movie is determined by three essential elements: product attributes, distribution-related variables and information sources.
Product attributes are brought in and assembled by the producers and the artistic and technical teams during a film’s production process. They include creative factors such as production costs, screenplay, genre and reputation of the film’s main contributors – the director and leading actors. The most important factor is the production budget, or what is often referred to as the “negative cost”. If we take into consideration the impact of the budget size on the movie’s success, we are able to discern two possible effects. Firstly, potential consumers see a movie’s budget as an indicator of quality as large budgets translate into lavish sets and costumes, expensive digital processing, and special effects that lead to an increased attractiveness for the audiences (Basuroy et al., 2003; Litman, 1982; Litman and Kohl, 1998). This indicator function is likely to prove true in cost-intensive genres, notably action and science-fiction movies (Hennig-Thurau et al., 2001). Secondly, production costs are an indication of the economic potential of a movie and the producer’s expectations that the movie’s story, cast and crew are attractive enough to generate the necessary earnings and assure an appropriate yield (Hennig-Thurau et al., 2001).
The production budget is largely devoted to the realization of a script. Therefore, many researchers have examined the characteristics of the screenplay which contribute to cinematic success. The resulting investigations tended to focus on sequels or movies based on a familiar story or another culture-inherent element (Hennig-Thurau et al., 2009; Sood and Dreze, 2006; Dhar et al., 2012). Taking into consideration the financial performance, sequels make good economic sense: the probability of making money is higher in the case of a sequel, especially in the early weeks of the theatrical run (De Vany and Walls, 1999; Ravid, 1999). Several researchers (Prag and Casavant, 1994; Ravid, 1999) proved that whether or not a film was a sequel turned out to be important in predicting the financial success of the movie. In the case of films based on adaptations it turns out that they tend to receive higher critical praise and succeed in the award categories, but do not stand out at the box office, and may actually perform worse if the adaptation is based on a play (Simonton, 2005b).
Vast film literature indicates that genre is an important influencer of audience expectations since people are more likely to pay attention to something that is personally relevant to them because they attach certain entertainment value to it (Hixson, 2006). Some movie genres have been analyzed concerning predictions of box office performance. For example, the comedy genre was a major topic in several studies (Litman, 1982; Sochay, 1994). In addition, the popularity of sci-fi/fantasy and horror genres was empirically supported in other literature (Litman, 1982).
Ultimately, the quality of a cinematic product must depend on the artists and experts who cooperate in its production. The empirical literature concentrates almost exclusively on whether movie stars ensure success, taking into consideration the criterion of financial performance (Basuroy et al., 2003; De Vany and Walls, 1999; Holbrook, 1999; Litman, 1983; Litman and Kohl, 1998; Prag and Casavant, 1994; Ravid, 1999; Sochay, 1994; Wallace et al., 1993; Simonton,
Moul, Ch. C. (2006), ‘The day after tomorrow: longer issues in theatrical exhibition’, Marketing Science, Vol. 25 No. 6, pp. 665–666; Moon, S., Bergey, P.K and Iacobucci, D. (2010), ‘Dynamic effects among movie ratings, movie revenues, and viewer satisfaction’, Journal of Marketing, Vol. 74 No. 1, pp. 108–121.
© Faculty of Management University of Warsaw. All rights reserved. DOI: 10.7172/2449-6634.jmcbem.2015.1.2
Journal of Marketing and Consumer Behaviour in Emerging Markets 1(1)2015
Natalia Gmerek
19
(15–35)
2009). In the research works the concept of “star” is defined in many different ways and therefore the results are not consistent. Some studies indicate that the presence of stars has a positive impact on box office success (Hadida, 2009; Sochay, 1994; Wallace et al., 1993), other studies claim that stars have no effect on box office performance (De Vany and Walls, 1999; Litman, 1983; Litman and Kohl, 1998; Prag and Casavant, 1994; Elberse, 2005, Ravid, 1999). Another problem lies in wages and fees of actors featuring in a movie. The wages of actors who are liked by viewers and able to attract them to movie theatres account for a considerable share of the production budget. Wages of actors appearing in “Lethal Weapon 4” totaled USD 50 million, half of which was earned by Mel Gibson (Hennig-Thurau et al., 2001, p. 10). This indicates a two-directional impact of “movie stars” on a motion picture’s financial success: on the one hand, they could have a potential positive impact on ticket sales and on the other hand, high costs of wages generate a negative effect on the profitability of a production for its producer and other investors (Hennig-Thurau, Houston and Walsh, 2007, pp.84–85).
Sedgwick and Pokorny (1999) emphasize that wages of actors sometimes absorb such a large part of the production budget that extra sales revenues do not cover that additional expenditure. A common phenomenon is that the most famous actors do not earn enough to cover their costs (Sedgwick and Pokorny, 1999, pp. 319–323).
The director is usually considered as the most important person during the shooting of a motion picture. For the audience, the director’s performance is much more difficult to evaluate than that of actors because the director’s work is “invisible” to them. However, there are certain well-known directors and viewers have higher expectations of films connected with these names. Still, most of the previous studies (Litman, 1982; Litman and Kohl, 1998; Sochay, 1994) reported that the effect of the director’s name was rather insignificant.
In France, Italy and Germany, strong box office records of directors positively influence their latest film’s admissions (Bagella and Becchetti 1999; Delmestri et al., 2005). These results confirm the leading role of movie directors in the European cinema (Svejenova, 2005).
Distribution-related variables consist of a film’s release strategy, in particular its release date, number of prints and market power of the distributor. One of the main strategic decisions made by distributors is the one regarding a movie’s release date. The two important considerations factored into this decision are the strong seasonal effect in the demand for movies and the competition that will be encountered throughout the movie’s run (Einav, 2002). When analyzing the American market, the period when movies generate the largest box office revenues are summer months (Wyatt and Badgar, 1990; Wallace et al., 1993; Sochay, 1994; Chang and Ki, 2005; Krider and Weinberg, 1998). The second important period is Christmas, and the third one is Easter (Litman, 1983; Sochay, 1994; Chang and Ki, 2005). The largest falls in the sales of theatre tickets are noted in the first months of each year (Simonton, 2009). The importance of the release date is greatly magnified by the fact that the performance during the first week accounts for a sizeable amount of the overall performance of the movie. On average, box office revenues in the first week account for almost forty percent of the movie’s total domestic revenues (Einav, 2002). Typically, movies with higher expected revenues are released on higher demand weekends.
A film that might otherwise do very well in the box office may find itself pushed aside by an abundance of competing films that opened at the same weekend or shortly before. Relevant literature indicates that there are two studies discussing empirical verifications of the competition on the theatrical movies’ market. The first one by Ainslie et al. (2005) refers to the American market, the second one by Basuroy et al. (2005) refers to the British market. The researchers unanimously state that simultaneous premieres of movies dedicated to the same audience or representing the same genre translate into worse sales results both in the first week and throughout the whole run.
© Faculty of Management University of Warsaw. All rights reserved. DOI: 10.7172/2449-6634.jmcbem.2015.1.2
Journal of Marketing and Consumer Behaviour in Emerging Markets 1(1)2015
Natalia Gmerek
20
(15–35)
Another crucial decision made by the distributors is the one concerning the scope of a movie’s release, that is the number of prints. There are three main types of release: wide release, platform release and limited release. Wide releases, which are most common in the case of main distributors, are those in which the movie screening begins in a large number of theatres, typically several thousand, accompanied by a very extensive national advertising campaign. Platform releases involve an initial release in a smaller number of theatres, often restricted to large cities, with advertising concentrated rather in local newspapers. In subsequent weeks the movie expands to additional screens and to more rural areas. Limited releases are those in which the movie is released in two or three cities without strong expectations of the movie’s potential for a wider release (Einav, 2002).
Wide-release films often tend to earn most at the first weekend of release (De Vany and Walls, 1999), and are also prone to generate larger box office revenues by the end of their theatrical run (Litman and Kohl, 1998; Sochay, 1994; Simonton, 2005b; Zufryden, 1996; Zuckerman and Kim, 2003; Elberse and Eliashberg, 2003; Ainslie et al., 2005; Hennig-Thurau et al. 2006).
The market power of the distributor has not been subject to a lot of research yet. In this paper it is assumed that distributors with high market power will gain a competitive advantage over other competitors in terms of securing and continuing a larger number of screens, forcing theatre owners to conduct more marketing activities in relation to their movies. For instance, Chang and Ki (2005) found that the length of the film run mostly depends on the distributor: films released by major distributors were screened in theatres longer.
Information sources mostly come into play around the film’s first release and fall into three categories: customer-based (audience rating), expert-based (critics’ rating) and advertising expenditures. The motion picture industry is an “experiential” product market, characterized by product quality information asymmetry between companies and consumer (Eliashberg and Sawhney, 1994). Advertisement is the main source of information for the audience on the upcoming movie; therefore, it plays a crucial role concerning the box office success of theatrical movies. Elliot and Simmons (2008) suggest that an important role of film advertising is to transmit quality signals to potential audiences. Advertising activities conducted to promote a movie product should be oriented towards the achievement of the highest box office numbers, in particular in the first period of the film’s run (Basuroy et al., 2006; Zufryden, 1996).
Several studies have established a link between advertising expenditures and box-office grosses. Prag and Casavant (1994), Zufryden (1996; 2000), and Moul (2004) all found evidence for a positive relationship between advertising and weekly or cumulative revenues. Lehmann and Weinberg (2000) showed that the level of advertising for a movie is positively correlated with opening strength. Elberse and Eliashberg (2003) found that the positive relationship between advertising expenditures and opening-week revenues is largely due to a second positive correlation, namely that between advertising expenditures and the screens allocated to a movie in its opening week.
There is also a clear hierarchy in advertising channels, with viewers considering television as more useful than printed media and radio. Consumers do not perceive trailers as advertising but rather as an opportunity to gain initial consumption experiences, thus it is extremely important for a film trailer to reach as wide an audience as possible (Hixson, 2006). Lastly, movie web page requests account for 14% of the variance of a film’s box office revenues, and, similarly to theatrical attendance, they peak in their first week (Zufryden, 2000).
In the motion picture industry critics play a significant role as far as the consumers’ decision is concerned. Most researchers have identified a positive relation between the critics’ judgment and box office success (Sawhney and Eliashberg, 1996; Sochay, 1994; Lampel and Shamsie, 2000; Collins et al., 2002; Zuckerman and Kim, 2003; Basuroy et al., 2003; Chang and Ki, 2005; Desai and Basuroy, 2005; Holbrook, 2005; Hennig-Thurau et al., 2006; Hennig-Thurau et al.,
© Faculty of Management University of Warsaw. All rights reserved. DOI: 10.7172/2449-6634.jmcbem.2015.1.2
Journal of Marketing and Consumer Behaviour in Emerging Markets 1(1)2015
Natalia Gmerek
21
(15–35)
2007). Nonetheless, some investigators have found no relationship between these two factors (Delmestri et al., 2005; Reinstein and Snyder, 2005), whereas others have found a negative association between them (Simonton, 2005a). These contradictory results reflect to a great extent the complexity of the phenomenon. The precise relation between the verdicts of the critics and box office returns varies across the successive weeks of the film’s theatrical run (Basuroy et al, 2003; Eliashberg and Shugan, 1997) and depends on whether the reviews are positive or negative in valence (Basuroy et al., 2003). Kamakura et al. (2006) imply that the correlation of aggregate critic opinion and movie appeal will in general be stronger than the correlation of an individual critic’s opinion and movie appeal since aggregate critic opinion represents the consensus among the majority of experts.
One of the most understudied variables in movie success research is the audience rating. It reflects the degree of preference of moviegoers and may function as an influencer which produces a word-of-mouth effect. Word of mouth has a stronger impact on the moviegoers’ willingness to watch a particular film than advertising (Moul, 2007). Similarly, word of mouth defined as audience ratings on popular movie websites such as the Internet Movie Database (IMDb) and Yahoo!Movies positively impacts the duration of a film’s theatrical run and its total box office revenues, particularly in the first (Chang and Ki, 2005) and five to six first weeks after release (Liu, 2006). The volume, not the valence (actual value), of user ratings posted on Yahoo!Movies correlates positively with daily box office revenues in the first two weeks of a film’s run (Duan et al., 2005) as well as with the weekly and total box office revenues (Liu, 2006).
3. METHODOLOGY AND DATA
3.1. Formulating the regression model
A sales regression analysis was conducted in order to identify factors determining the sale of movie tickets. On developed motion picture markets the sales regression analysis constitutes a frequently applied tool serving the purpose of identification of factors determining motion picture performance. It started to be popular in the 80s of the previous century, with the publication of the article written by Litman (1983) entitled Predicting success of theatrical movies: an empirical study. In that article, the regression model for motion pictures screened in the United States was presented for the first time. In our times, more and more researchers acknowledge this method as the most adequate and useful one in the analysis of dependencies on the movie market, allowing for the verification whether there is a correlation between variables, facilitating the assessment of strength and direction of this correlation and enabling the formulation of a mathematical form reflecting these correlations (Litman, 1983; Litman and Kohl, 1989; Sochay, 1994; Prag and Casavant, 1994; Smith and Smith, 1986; Ravid, 1999; Simonoff and Sparrow, 2000).
3.2. Presentation and operationalization of variables in the model
The available research results estimate multiple regression functions that examine the success drivers of Polish feature films in terms of total box office. Independent variables of the model consist of a vector of attributes that are supposed to affect a film’s performance. Three categories of independent variables were employed in the analysis: product attributes (production budget, genre, type of screenplay, number of famous actors, popularity of the director), distribution-related variables (market power of the distributor, release date and competition intensity, type of release) and information sources (advertising expenditures, critics’ rating and audience rating). An additional variable referring to the movie’s length of run was taken into consideration in the model, namely the first-week box office.
© Faculty of Management University of Warsaw. All rights reserved. DOI: 10.7172/2449-6634.jmcbem.2015.1.2
Journal of Marketing and Consumer Behaviour in Emerging Markets 1(1)2015
Natalia Gmerek
22
(15–35)
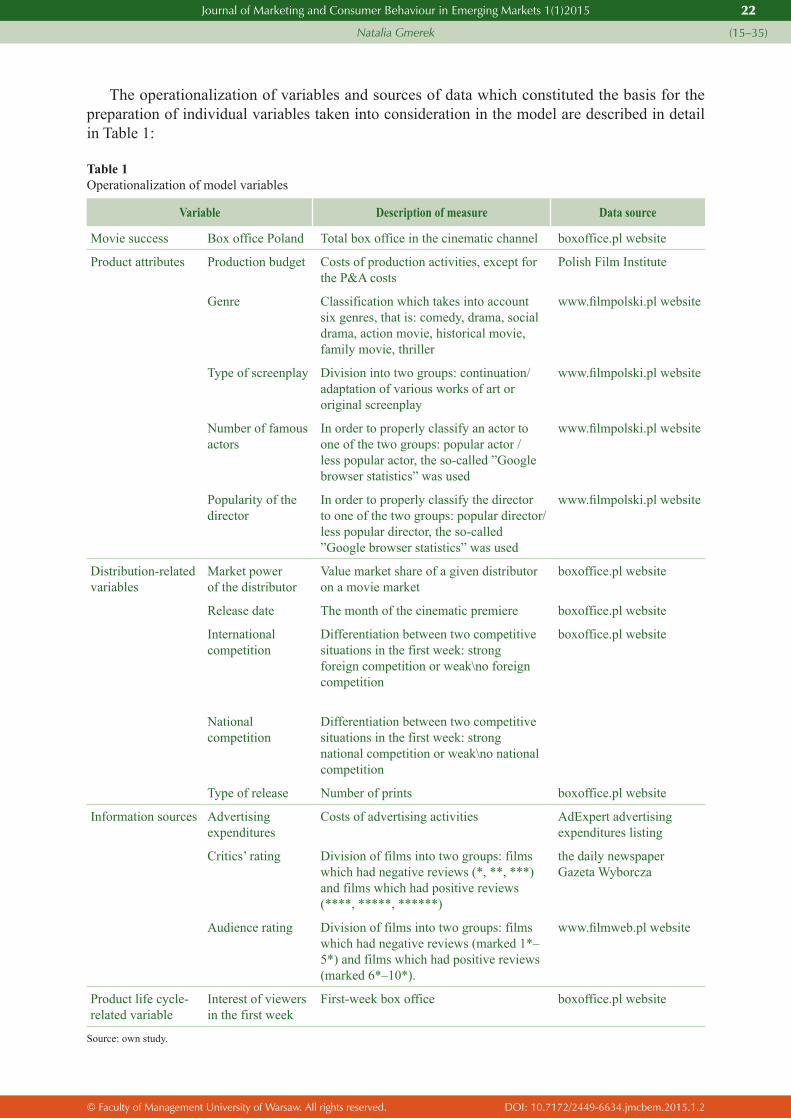
The operationalization of variables and sources of data which constituted the basis for the preparation of individual variables taken into consideration in the model are described in detail in Table 1:
Table 1Operationalization of model variables
Variable Description of measure Data source
Movie success Box office Poland Total box office in the cinematic channel boxoffice.pl website
Product attributes Production budget Costs of production activities, except for the P&A costs
Polish Film Institute
Genre Classification which takes into account six genres, that is: comedy, drama, social drama, action movie, historical movie, family movie, thriller
www.filmpolski.pl website
Type of screenplay Division into two groups: continuation/adaptation of various works of art or original screenplay
www.filmpolski.pl website
Number of famous actors
In order to properly classify an actor to one of the two groups: popular actor / less popular actor, the so-called ”Google browser statistics” was used
www.filmpolski.pl website
Popularity of the director
In order to properly classify the director to one of the two groups: popular director/less popular director, the so-called ”Google browser statistics” was used
www.filmpolski.pl website
Distribution-related variables
Market power of the distributor
Value market share of a given distributor on a movie market
boxoffice.pl website
Release date The month of the cinematic premiere boxoffice.pl website
International competition
Differentiation between two competitive situations in the first week: strong foreign competition or weak\no foreign competition
boxoffice.pl website
National competition
Differentiation between two competitive situations in the first week: strong national competition or weak\no national competition
Type of release Number of prints boxoffice.pl website
Information sources Advertising expenditures
Costs of advertising activities AdExpert advertising expenditures listing
Critics’ rating Division of films into two groups: films which had negative reviews (*, **, ***) and films which had positive reviews (****, *****, ******)
the daily newspaper Gazeta Wyborcza
Audience rating Division of films into two groups: films which had negative reviews (marked 1*–5*) and films which had positive reviews (marked 6*–10*).
www.filmweb.pl website
Product life cycle-related variable
Interest of viewers in the first week
First-week box office boxoffice.pl website
Source: own study.

© Faculty of Management University of Warsaw. All rights reserved. DOI: 10.7172/2449-6634.jmcbem.2015.1.2
Journal of Marketing and Consumer Behaviour in Emerging Markets 1(1)2015
Natalia Gmerek
23
(15–35)
The data concerning movie attendance were obtained from the boxoffice.pl website. The information necessary for the operationalization of the model variables was drawn from several different data sources, including the boxoffice.pl website, the www.filmweb.pl website, the daily newspaper Gazeta Wyborcza, AdExpert advertising expenditures listing and the Polish Film Institute.
3.3. Characteristics of research sample
The analyzed sample consists of 207 motion pictures produced and released in Poland between 2000 and 2011 for which complete data on the variables were available. The applied selection of the research sample is described as non-random research sample. It is to a large extent an exhaustive research, taking into consideration the analyzed period of time, because almost all components are subject to measurement. The main aim was to analyze as many theatrical movies which were available in terms of necessary research information as possible.
Among all 207 analyzed films the most numerous group consisted of comedies (88 movies, that is 42.51%). The second group are dramas (78 movies, that is 37.68%), the third group consisted of action movies (12 movies, that is 5.80%). The remaining genres have a small share in the analyzed group of motion pictures: social dramas (8 movies, that is 3.86%), historical movies (7 movies, that is 3.38%), family movies (7 movies, that is 3.38%), thrillers (6 movies, that is 2.90%), fantasy movies (1 movies, that is 0.49%). A significant majority of movies (170 movies, that is 82.13%) is based on an original screenplay. 29 movies (that is 14%) are adaptations of other works of art, and 8 movies (that is 3.87%) are a cinematic continuation. An average production budget of a Polish motion picture amounts to PLN 3,318,595. On average 2 popular actors play in a Polish motion picture, 50 movies (that is 24.15%) have a known and popular director, and 157 movies (that is 75.85%) have a less popular director.
The distribution of 72 motion pictures (34.78%) was conducted by entities with a significant position on the movie market: 3 movies – UIP, 6 movies – Forum Film, 35 movies – ITI Cinema, 19 movies – Monolith and Monolith Plus, 9 movies – Gutek Film. The distribution of 135 movies (65.22%) was conducted by small national business entities with a scarce movie distribution market share in Poland. Most movies had their premieres in November (28 movies), September (27 movies) and October (26 movies). Other months characterized by the highest number of theatrical premieres are: February (23 movies), March (22 movies), April (21 movies), May (15 movies), January (12 movies), August (11 movies), June (9 movies), December (8 movies) and July (5 movies).
In the case of 114 motion pictures (55.07%) there was a strong competition of foreign productions, and in the case of 93 movies (44.93%) weak competition of foreign productions. In the case of 54 motion pictures (26.09%) there was a strong competition of Polish productions, in the case of 117 movies (56.52%) there was a weak competition of Polish productions, 36 motion pictures (17.39%) did not have any competition from Polish productions. An average number of prints for screenings in cinemas amounts to 51.
An average level of budget for advertisement in the case of Polish motion pictures amounts to PLN 292,327.
The critics assessed movie productions as follows: 125 movies (60.39%) received a negative review whereas 82 movies (39.61%) had positive reviews. The structure of motion pictures according to the viewers’ assessment is as follows: 161 movies (77.78%) had a negative review whereas 46 movies (22,22%) had positive reviews.
© Faculty of Management University of Warsaw. All rights reserved. DOI: 10.7172/2449-6634.jmcbem.2015.1.2
Journal of Marketing and Consumer Behaviour in Emerging Markets 1(1)2015
Natalia Gmerek
24
(15–35)
4. RESULTS
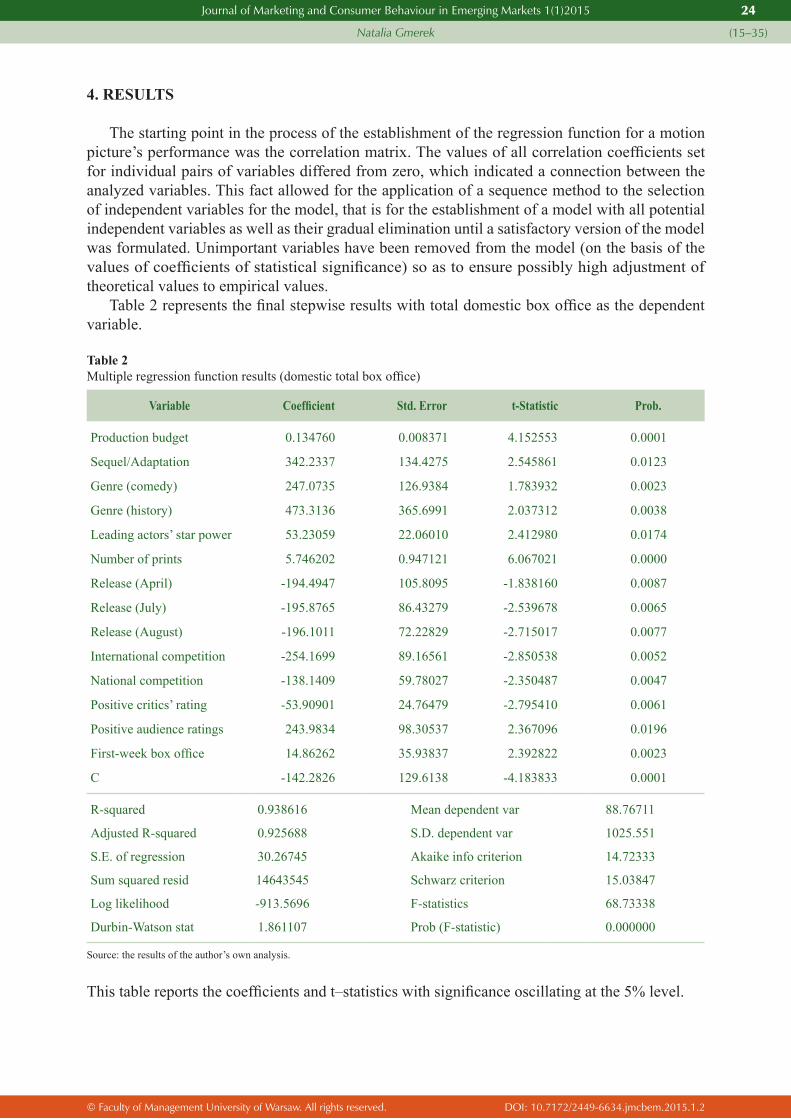
The starting point in the process of the establishment of the regression function for a motion picture’s performance was the correlation matrix. The values of all correlation coefficients set for individual pairs of variables differed from zero, which indicated a connection between the analyzed variables. This fact allowed for the application of a sequence method to the selection of independent variables for the model, that is for the establishment of a model with all potential independent variables as well as their gradual elimination until a satisfactory version of the model was formulated. Unimportant variables have been removed from the model (on the basis of the values of coefficients of statistical significance) so as to ensure possibly high adjustment of theoretical values to empirical values.
Table 2 represents the final stepwise results with total domestic box office as the dependent variable.
Table 2Multiple regression function results (domestic total box office)
Variable Coefficient Std. Error t-Statistic Prob.
Production budget 0.134760 0.008371 4.152553 0.0001
Sequel/Adaptation 342.2337 134.4275 2.545861 0.0123
Genre (comedy) 247.0735 126.9384 1.783932 0.0023
Genre (history) 473.3136 365.6991 2.037312 0.0038
Leading actors’ star power 53.23059 22.06010 2.412980 0.0174
Number of prints 5.746202 0.947121 6.067021 0.0000
Release (April) -194.4947 105.8095 -1.838160 0.0087
Release (July) -195.8765 86.43279 -2.539678 0.0065
Release (August) -196.1011 72.22829 -2.715017 0.0077
International competition -254.1699 89.16561 -2.850538 0.0052
National competition -138.1409 59.78027 -2.350487 0.0047
Positive critics’ rating -53.90901 24.76479 -2.795410 0.0061
Positive audience ratings 243.9834 98.30537 2.367096 0.0196
First-week box office 14.86262 35.93837 2.392822 0.0023
C -142.2826 129.6138 -4.183833 0.0001
R-squared
Adjusted R-squared
S.E. of regression
Sum squared resid
Log likelihood
Durbin-Watson stat
0.938616
0.925688
30.26745
14643545
-913.5696
1.861107
Mean dependent var
S.D. dependent var
Akaike info criterion
Schwarz criterion
F-statistics
Prob (F-statistic)
88.76711
1025.551
14.72333
15.03847
68.73338
0.000000
Source: the results of the author’s own analysis.
This table reports the coefficients and t–statistics with significance oscillating at the 5% level.
© Faculty of Management University of Warsaw. All rights reserved. DOI: 10.7172/2449-6634.jmcbem.2015.1.2
Journal of Marketing and Consumer Behaviour in Emerging Markets 1(1)2015
Natalia Gmerek
25
(15–35)
The variables taken into account in the final version of the model, thus determining the total box office (TBO), are: production budget (PB), screenplay as a continuation or adaptation of another work of art (SA), comedy genre (GC), historical genre (GH), number of popular actors playing in the movie (PA), number of prints (NP), opening night in April (AP), opening night in June (JU), opening night in August (AU), strong international competition (SIC), strong national competition (SNC), positive critics’ reviews (PCR), positive audience reviews (PAR) and first-week box office (FBO).
The application of linear interdependencies allowed for a quite thorough reproduction of the variability of the total box office of a motion picture.
On the basis of the estimation table presented above we can express the analytical form of the model describing total box office of a motion picture as follows:
DTBO = 0.1348*PB + 342.2337*SA + 247.0735*GC + 473.3136*GH + 53.2306*PA + 5.7462*NP – 194.4947*AP – 195.8765*JU – 196.1011*AU – 254.1699*SIC
– 138.1409*SNC – 53.9091*PCR + 243.9834*PAR + 14.86262*FBO – 142.2826
The interpretation of parameters of the above model is as follows2:
0.1348*PB – it means that if the production budget increases by one unit (that is by PLN 1,000), then the total box office increases by 134.8 viewers (assuming that the remaining independent variables remain stable).
342.2337*SA – it means that if the screenplay is a continuation/adaptation of another work of art, then the total box office increases by 342,233.7 viewers (assuming that the remaining independent variables remain stable).
473.3136*GH – it means that if the movie is a historical movie, then the total box office increases by 473,313.6 viewers (assuming that the remaining independent variables remain stable).
247.0735*GC – it means that if the movie is a comedy, then the total box office increases by 247,073.5 viewers (assuming that the remaining independent variables remain stable).
53.2306*PA – it means that if the number of popular actors in the movie increases by 1 person, then the total box office increases by 53,230.6 viewers (assuming that the remaining independent variables remain stable).
5.7462*NP – it means that if the total number of prints increases by one unit (that is by 1 print), then the total box office increases by 5,746.2 viewers (assuming that the remaining independent variables remain stable).
–194.4947*M4 – it means that if the movie has its premiere in April, then the total box office decreases by 194,494.7 viewers (assuming that the remaining independent variables remain stable).
–195.8765*M7 – it means that if the movie has its premiere in July, then the total box office decreases by 195,875.5 viewers (assuming that the remaining independent variables remain stable).
–196.1011*M8 – it means that if the movie has its premiere in August, then the total box office decreases by 196,101.1 viewers (assuming that the remaining independent variables remain stable).
–254.1699*IC – it means that if the movie has its premiere at the time when a competitive foreign movie which achieved high box office performance is screened, then the total box office decreases by 254,169.9 viewers (assuming that the remaining independent variables remain stable).
2 The dependent variable Y, that is total box office, is expressed in thousands of people, which influences the interpretation of the model’s parameters.
© Faculty of Management University of Warsaw. All rights reserved. DOI: 10.7172/2449-6634.jmcbem.2015.1.2
Journal of Marketing and Consumer Behaviour in Emerging Markets 1(1)2015
Natalia Gmerek
26
(15–35)
–138.1409*NC – it means that if the movie has its premiere at the time when a competitive Polish movie which achieved high box office performance is screened, then the total box office decreases by 138,140.9 viewers (assuming that the remaining independent variables remain stable).
–53.9091*PCR – it means that if the critics’ reviews were positive, the total box office decreases by 53,909.1 viewers (assuming that the remaining independent variables remain stable).
243.9834*PAR – it means that if the viewers’ opinions are positive, the total box office increases by 243,983.4 viewers (assuming that the remaining independent variables remain stable).
14.86262*FBO – it means that if the first-week box office increases by one unit (that is 1,000 viewers), then the total box office increases by 14,862 viewers (assuming that the remaining independent variables remain stable).
–142.2826 – constant C, without interpretation.
The assessment of statistical significance of the model was based on the assessment of stochastic parameters, verifying if the model is adjusted to empirical data (adjusted coefficient of determination, standard deviation of the residual component), and the assessment of structural parameters aimed at verification whether all parameters connected with independent variables were statistically significantly different from zero – this can be assumed from low values of empirical significance levels. The total statistical significance of the parameters in the model has been confirmed by means of the Fisher test.
The model explains to a great extent the variances concerning the total number of viewers (adjusted R2 = 0.926). It means that the established model explains the variability of the total box office of a motion picture in Poland at 92.6%. Therefore, we can state that the variability of total box office was described quite precisely by the abovementioned factors.
Standard deviation of the residual component (S.E. of regression = 30.26745) means that average deviation of theoretical total box office from the empirical total box office amounts to +/– 30,267 viewers. It is caused by the influence of factors which were not taken into account in the model.
In the abovementioned model all parameters connected with independent variables are statistically significantly different from zero – this can be assumed from low values of empirical significance levels (Probability).
The total statistical significance of parameters in the model was confirmed by means of the Fischer test, for which the empirical significance level amounts to 0.000.
Due to the fact that the model was established for large-scale data, i.e. refers to 207 cinematic productions, there is no need to analyze the auto-correlation of the residual component.
The model that includes total box office as a dependent variable shows that the production budget, movie type – sequel or adaptation, number of famous actors, genre – comedy and history, number of prints, positive audience rating were significantly related to box office influencing it in a positive way. On the other hand, favorable critics’ rating, movies released in April, July, August and strong competitive pressure from other movies were significantly related to box office results in a negative way. The results suggest that the overall movie quality (product-related variables) has an economically and statistically significant effect on the movie’s total demand.
© Faculty of Management University of Warsaw. All rights reserved. DOI: 10.7172/2449-6634.jmcbem.2015.1.2
Journal of Marketing and Consumer Behaviour in Emerging Markets 1(1)2015
Natalia Gmerek
27
(15–35)
5. DISCUSSION
The sales regression analysis designed on the basis of the number of viewers of Polish motion pictures allowed the identification of factors that have a significant, both positive and negative, influence over the movie theatre attendance and factors that are insignificant for a box office success on the theatrical movie market in Poland.
Marketing implications concerned with implementation of the developed regression model on the Polish theatrical movie market mean identification of activities and steps to be taken in the movie production organization process to efficiently manage theatrical movie sales.
Product activities
At the pre-production stage it is important to develop a good script being the basis of a future movie.
In Poland, similarly to the United States of America, theatrical movies being a continuation of a well-known cinematic theme or an adaptation of an existing work of art enjoy greater popularity among the audience than movies based on an original script. That is why it is worth to give a thought to the selection of a movie subject that is to a certain extent known to the audience from various works of art and entertainment contexts. In the case of movie producers who are planning to stay in the movie business on a long-term basis, the production of film series that continue the previous threads of movies and the experiences of characters already known to viewers can be taken into consideration. Another solution are movie adaptations of popular books, theatrical plays, TV series, computer games etc., that is of products of the cultural goods and services market which have already been recognized by wide audience.
The primary factor that translates into the final box office performance is the movie genre. The research also shows that historical movies and comedies achieve best box office performance. In the Polish cinema the historical aspect is rather rare and unexploited. It is also a less popular genre, nonetheless with a great potential concerning the number of viewers. Film producers should take into consideration the plot threads which are worth fictionalization and allow for the creation of an interesting story able to catch the attention of modern cinemaniacs.
Comedy is the most frequent genre on the Polish movie market, enjoying vast popularity among viewers. The last decade witnessed mostly romantic comedies which attract mostly female audience. Nevertheless, there is a visible return to thriller-comedies that enjoyed great popularity in the 90s, which is a better choice due to a more numerous target group of viewers interested in this genre.
Film adaptations of required readings (such as “Pan Tadeusz”, “Zemsta”, “W pustyni i w puszczy”) are quite popular. In the case of such movies the total number of viewers is definitely higher due to mass interest of school youth watching them during school trips to the cinema organized by their teachers. However, the possibilities in this respect are limited by the number of books constituting required readings at school which have not yet been adapted and which can be adapted for movie storyline purposes in practice.
Another important element translating into high box office performance is good cast. It should definitely include the so-called “stars”, that is well-known and popular actors mostly playing main characters. A popular cast works as a promotional element of the movie – the actors’ faces and names should be properly highlighted in the advertising materials. Moreover, popular actors and actresses arouse more interest of the journalists, who have a context for possible interviews or for articles about given “stars”. Writing scripts for certain actors or actresses, thanks to which the director is able to create a credible movie character, becomes a more and more frequent phenomenon.
© Faculty of Management University of Warsaw. All rights reserved. DOI: 10.7172/2449-6634.jmcbem.2015.1.2
Journal of Marketing and Consumer Behaviour in Emerging Markets 1(1)2015
Natalia Gmerek
28
(15–35)
The production budget level determines box office performance to a limited extent. It is obviously a very important factor indispensable for a movie project becoming a reality. However, the amount of financial investment is not translated into a Polish film’s success as regards audience turnout. There are high-budget productions that cannot attract viewers to the cinema, e.g. “Tajemnica Westerplatte” – its production cost PLN 13 million and the movie was seen by only 150 thousand viewers (Oświeciński), or medium- or low-budget films which enjoy great popularity due to interesting ideas and a well-narrated story (e.g. “Pod Mocnym Aniołem”).
In the United States, where movie productions cost from tens to hundreds of millions of dollars, it is a common marketing practice to inform the public about these numbers. Such impressive amounts are meant to generate media hype around the movie and, combined with film-set documentaries, attract viewers to cinemas. Due to much more modest budgets, such endeavors are pointless in Poland. An average budget of a Polish movie is around PLN 4 million. Few productions are more expensive and the budgets of some of them are very low, staying at PLN 200 thousand. For comparison: “Spectre”, the latest film about James Bond’s adventures, will cost USD 300 million, which is PLN 150 million more than the Polish Film Institute (PISF) has spent to finance Polish movies for nine years of its operation (Wierzchowska, 2015).
Distribution activities
A box office success of a theatrical movie depends on appropriate planning activities to determine the number of movie copies and the movie release date.
The main problem that existed until recently was the cost of producing a sufficient number of movie copies. Due to the high costs of producing 35 mm copies, distributors limited their number to several dozens. This means that premiere shows were available only to such cinemas that were able to guarantee the highest revenues for distributors. Because of lower ticket revenues, local cinemas did not receive a movie until it had already gathered audience in big cities, which might happen only after a few months of its release.
From 2004 onwards cinemas were being digitized, which made the production of movies on a film tape unprofitable. Digital cinema means a replacement of “analogue” cinema projectors with digital ones that display movies not from a 35 mm tape, but from a hard drive or other type of electronic memory. Digital cinema brings a solution to problems with fast copy production and reaching the viewer. The costs are low, which increases the number of copies available on the market significantly, and their production time is much shorter in comparison with the 35 mm tape. Delivery of copies to cinemas is also simplified (satellite broadcast, streaming).
Digital technology brings much convenience to theatrical distribution (Morley, 1998, p. 6):• no need to make hundreds of copies for demonstration and regular screening purposes,
with no certainty whether predictions as to the numbers will be accurate• no danger that the courier will not timely deliver the copy for the premiere show• no concern that any of the copies may be stolen or “borrowed” to be later added to
a purchased product in another part of the world with no consequences• a guarantee of unchanging, high-quality copies identical to the film master copy• no obligation to produce countless language versions on separate copies• no need to release several different audio formats• no problem of impurities on copies such as settling dust, scratches and scores
At present there are nearly 1,000 screening rooms equipped with modern digital projectors in Poland. All Polish multiplexes are fully digitized. Polish art-house and local cinemas which do not have money to purchase a projector themselves may apply for funding from the Polish Film Institute (Cyfryzacja w Polsce, 2015).
© Faculty of Management University of Warsaw. All rights reserved. DOI: 10.7172/2449-6634.jmcbem.2015.1.2
Journal of Marketing and Consumer Behaviour in Emerging Markets 1(1)2015
Natalia Gmerek
29
(15–35)
When planning a movie release date, the demand seasonality on the motion picture market should be taken into account. In contrast to the United States, the most favorable period for a film premiere are the first months of each year: January, February and March. However, this does not always hold true. In early spring there is usually one weekend with an unexpected drop in attendance – a movie that unluckily happens to be screened then becomes a cinematic failure. For example, this was the case at the weekend of 16–19 March 2012, when “Hans Kloss. Stawka większa niż śmierć” and “Mirror Mirror” premiered. The sun shone more intensively, no one went to cinemas, which proved to be very important for the performance of both movies.
Early autumn is another favorable date to release a movie in Polish theatres due to the forthcoming Gdynia Film Festival held in September. This event builds and strengthens awareness of the movie. The work of accredited journalists is invaluable for distributors and audiences. If a movie has commercial potential and is also successful at Gdynia Festival, the first part of the campaign, i.e. building movie awareness, has been completed. This was the case of such motion pictures as: “Jesteś Bogiem” and “Chce się żyć”. The premiere date of Paweł Pawlikowski’s “Ida” was rescheduled from November to October, when the movie won the “Złote Lwy” (Golden Lions) First Prize. Awards and critical acclaim were highlighted in its promotional campaign.
In spring, summer and weeks before Christmas the audience is reduced and good performance of Hollywood shows can be expected then.
Information activities
In the United States a generally accepted market practice is to invite movie critics to special previews in order to provide them with the necessary film material to write a review. A significant contribution to the development of the theory concerning the role of opinion leaders on the movie market was made by J. Eliashberg and S.M. Shugan (1997). They identified two alternative functions that film critics can perform on the movie market. Film critics may be opinion leaders influencing purchasing decisions of cinema audiences, thus exerting a decisive influence on the sales of a given motion picture (i.e. “influencers”), or anticipators of viewers’ behavior on the theatrical movie market, their attitudes towards the movie and the degree of their acceptance of the motion picture, foreseeing its possible success or failure without affecting sales (i.e. predictors) (Eliashberg and Shugan, 1997, pp. 68–79).
In Poland, in contrast to the US market, film critics’ reviews neither affect cinema attendance directly nor play a persuasive role. This does not mean that previews organized in view of journalists writing film reviews made available to the public before the premiere should be given up. It is important to remember that each item of news about a movie appearing in the mass media has an informative function and builds awareness among the audience.
The ultimate market verification of a motion picture lies in the hands, or rather eyes, of the viewers, who share their opinions on the movie with other consumers. In analyzing the motion picture market on its demand side, A. De Vany and W.D. Walls (1996) proposed a behavioral model showing the behavior of cinema audiences that suggests a strong correlation between their opinions and the demand for a motion picture (De Vany and Walls, 1996, p. 1510). Viewers leave cinema with certain memories and impressions which they immediately share with other consumers (Eliashberg et al., 2000, p. 227).
The buzz marketing is a recognized form of communication on the movie market due to high credibility of the messages passed between the audience members. Polish viewers are more likely to believe the positive opinions of other viewers than the reviews of professional film critics. These conclusions are consistent with the study results of Ch. Dellarocas, F.A. Neveen and Z. Xiaoquan (2007) indicating that the assessment made by viewers is a variable more strongly correlated with the box office performance than with film critics’ ratings (Dellarocas et al., 2007, pp. 39–41). J.A. Chevalier, D. Mayzlin (2006) stress that today’s interpersonal communication

© Faculty of Management University of Warsaw. All rights reserved. DOI: 10.7172/2449-6634.jmcbem.2015.1.2
Journal of Marketing and Consumer Behaviour in Emerging Markets 1(1)2015
Natalia Gmerek
30
(15–35)
is not limited to the traditional form of transmitting information personally, but can be carried out via the Internet (Chevalier and Mayzlin, 2006, pp. 345–346). The Internet is the most perfect medium for spreading viewers’ opinions on a movie. The expansion of movie websites, where users are responsible for the content or may freely express their opinions and appraise it, makes the exchange of opinions and recommendations concerning movies very easy. Nevertheless, encouraging discussion on the Internet can have either a negative or positive effect on the success of a movie. Because reviews and opinions travel so fast, good word-of-mouth can replace expensive large-scale marketing efforts and yet achieve excellent results (Mangold and Faulds, 2009).
Furthermore, the model proves that the number of viewers in the first week of the run determines the final box office performance. The life cycle of a film in the cinematic channel is short; therefore, marketing activities should be conducted prior to the movie premiere in theatres. The cinema premiere is the beginning of a film’s life, which may be compared with the launch of a new brand or a new product on the market. A promotional campaign, even if limited to a minimum, is necessary in such a situation to inform viewers that a new movie has appeared on the market.
The key element in the pre-premiere phase is to deliver the message about a movie production to the audience, with the aim of establishing the awareness of the upcoming movie, raising interest prior to the actual distribution to theatres and arousing curiosity and willingness to see the movie in its potential viewers.
Tools available to the distributor responsible for the movie promotion include, among others, paid advertising in the media, on external carriers and in the cinema. The second promotion element is PR, that is an activity resulting in journalistic notes, reviews, interviews, radio and television coverage. Attendance at festivals and awards were important elements of the promotion of Tomasz Wasilewski’s “Płynące wieżowce”. The director is not an artist widely known in Poland, hence the film distributor was concerned that the movie should appear at world film festivals first. The awards it won and its favorable reviews led to the positive rhetoric about “Płynące wieżowce”.
The Internet is a relatively new place for campaigns. In addition to film websites such as Filmweb.pl or Stopklatka.pl, a movie needs to be mentioned on general websites, where it is much more difficult to get the message about a film across.
Virtual promotions rely on marketing activities using social media. Using social networking to its fullest extent in a marketing campaign allows producers to create a two-way discussion with potential viewers. Social media marketing cannot be a one-sided flow of information from a movie studio to a viewer that traditional marketing relied on in the past. Companies that are encouraging viewer participation in the social media campaign are revolutionizing the way movies are marketed (Elliott, 2011). By investing in a relationship with Internet users, a movie creates an audience who feel partial ownership of the movie and are therefore interested in its success.
There are many ways of using social media websites for promoting movies. Some examples of this include creating Twitter accounts for a movie, and tweeting updates, premieres, actor/actress interviews, or give-away tie-ins. A marketing company might also make a Facebook page for a movie, encouraging people interested to “Like” their page and share it with their friends. YouTube can be used as a platform to not only show trailers, but also to create a channel dedicated to all official promos for a particular movie. By actively utilizing each channel of social media, a movie that would not normally garner a nationwide release might earn one. Though the trend in marketing through social media is a growing one, as of now it is difficult to determine the effectiveness of social media marketing. Many films are now attempting to use both traditional marketing and social media marketing, which makes it challenging to differentiate between them.

© Faculty of Management University of Warsaw. All rights reserved. DOI: 10.7172/2449-6634.jmcbem.2015.1.2
Journal of Marketing and Consumer Behaviour in Emerging Markets 1(1)2015
Natalia Gmerek
31
(15–35)
6. CONCLUSION
The causal analysis carried out for the purposes of this article helped systematize the knowledge about factors determining box office performance in Poland. When planning and organizing marketing activities to efficiently manage theatrical movie sales, the specificity of the life cycle of a movie product in the cinematic channel should be taken into account: the pre-premiere phase in the cinematic channel, premiere phase and post-premiere phase.
The pre-premiere phase is the period before film distribution in cinemas begins. The life cycle of a film in the cinematic channel is short; therefore, marketing activities should be conducted prior to the movie premiere in theatres. The key element in the pre-premiere phase is to deliver the message about the movie production to the audience, with the aim of establishing the awareness of the upcoming movie, raising interest prior to the actual distribution to theatres and arousing curiosity and willingness to see the movie in its potential viewers.
The premiere phase is the first week of a film’s run, that is the first phase of the life cycle of a motion picture. The primary marketing aim is to generate the highest possible box office revenues and gain a significant market share in a given week. Since the first phase of sales is crucial for a movie’s final success as regards audience turnout, the film producer’s marketing activities should be targeted at both the demand side (cinema viewers) and the supply side (the distributor and cinema operators) of the market.
Persuasive promotional activities that encourage the purchase and distribution activities that ensure sufficiently broad availability of a movie in cinemas, i.e. an adequate number of shows per day, are vital.
The post-premiere phase is the second phase of a film’s life cycle, comprising next weeks of its run until its final withdrawal from cinemas.
In the case of the post-premiere phase, the primary objective of producers’ activities should be to minimize the decrease in weekly sales, which is a characteristic trend on the theatrical movie market. This objective is achieved if viewers have positive experiences of the film and share their opinions with other consumers. In this period, in contrast to the pre-premiere phase, factors reflecting the product quality such as: the script, genre and cast become more important as they affect the final box office performance in Poland.
Taking into account further research development in this area, some limitations of this analysis and directions for further research should be identified.
A key research limitation is the set of factors included in the model and their operationalization. While selecting the model variables, the main objective was to take into consideration as many factors that could potentially determine the sales of a film product as possible. It should be emphasized that film products are evaluated both in terms of their market value reflected in the box office performance and in terms of their artistic value ensuring appreciation by the film industry (Addis and Holbrook, 2008, p. 88). This analysis excluded the variable expressing the film industry appreciation manifesting itself as awards granted to individual films, their creators and actors in various categories.
Some US researchers analyzing the relationship between the appreciation of a movie’s artistic quality and its box office performance took into account this variable (Holbrook, 1999; Hennig-Thurau at al., 2007; Holbrook and Addis, 2008; Holbrook, 2005; Prag and Casavant, 1994; Litman, 1983; Sawhney and Eliashberg, 1996; Sochay, 1994). The most popular film award, which enjoys the highest international renown, is The Academy Award, commonly known as the Oscar, awarded by the US Academy of Motion Picture Arts and Sciences. Rarely is this factor taken into account by researchers analyzing the box office success, for two reasons. Firstly, film awards are mainly awarded to American movies, which renders the use of this variable impossible for an analysis
© Faculty of Management University of Warsaw. All rights reserved. DOI: 10.7172/2449-6634.jmcbem.2015.1.2
Journal of Marketing and Consumer Behaviour in Emerging Markets 1(1)2015
Natalia Gmerek
32
(15–35)
of domestic productions on other foreign markets. Secondly, the Academy Awards ceremony is often held after theatrical premieres of many films, which does not allow for specifying explicit relationships between this factors and the number of viewers.
In Poland there are similar competition initiatives and the most popular and acclaimed ones include: Zbyszek Cybulski Award, Orzeł (Eagle) Award, Złote Lwy (Golden Lions) – the prize awarded at Gdynia Film Festival. However, film projects evaluated in these competitions are frequently productions whose life cycle has already been completed in the cinematic channel.
In the light of further development of the domestic film production, further research directions in analyzing the box office performance determinants should take into account a longer time horizon and a bigger research sample including new Polish motion pictures.
It should be highlighted that the sales regression function specified in this article illustrates certain regularities characteristic of the entire class of products. The analysis covered all motion pictures with no barriers to access to the necessary information. Given the vast diversity of film productions, this may be a research limitation since possible differences in the development of a different set of box office performance determinants for individual genres were disregarded. Taking into consideration the development of cinematic production in Poland, further research should include regression functions for homogeneous research samples. Referring to studies by M.S. Sawhney and J. Eliashberg (1996), a distinction should first be made between two specific types of worldwide cinematic production: commercial films addressed to broad, mass audience treating the cinema as a form of entertainment and art films that are ambitious, addressed to selective audience who treat the cinema as a cultural development element (Sawhney and Eliashberg, 1996).
The regression model presented in this article applies to sales determinants of Polish productions only. As shown by market data concerning the structure of motion pictures according to the country of production, the dominant group are foreign films (American and European). In order to obtain a complete picture of the specificity of box office performance determinants in Poland, separate regression models should be established for three research samples taking into account a division into Polish, American and European films.
Another complementary research direction should be an attempt to grasp a possible effect of the country of origin on the Polish motion picture market, that is to determine how information on the country where the film was produced affects cinema audiences’ purchasing decisions.
Those financially involved in cinematic productions benefit from sales of a film product in various distribution channels. A research area which has not been scientifically explored so far, either on the Polish market or in the various European countries, is the identification of box office performance determinants in other movie distribution channels (DVD, “pay-per-view” system, television). The causal analysis conducted in this case should be based on regression models designed for each sequential distribution channel prevailing on the movie market (a set of variables and their operationalization adapted to the specificities of each channel).
An issue still to be solved is also the influence of sales in the first theatrical distribution channel on the interest in the film in other channels as well as the impact of the duration of a market gap in the movie availability on the market (in particular between the two key channels: cinema and DVD) from the perspective of maximizing revenues from film product sales.
As for foreign films that premiere on many world markets, the problem of creating independent sources of revenue from film product sales should also involve a definition of relationships between the number of viewers on the primary market and the audience turnout on subsequent

© Faculty of Management University of Warsaw. All rights reserved. DOI: 10.7172/2449-6634.jmcbem.2015.1.2
Journal of Marketing and Consumer Behaviour in Emerging Markets 1(1)2015
Natalia Gmerek
33
(15–35)
foreign distribution markets, and the links between the total motion picture sales and the duration of a market gap in movie commercialization in other countries.
Finally, it is worth highlighting that the sales regression analysis presented should be verified by a quantitative panel study.
Due to its dynamic nature involving the collection of data from the same group of people (sample, panel) at several time points, a panel study would allow the identification of certain regularities concerning the stability and variability of cinema audience preferences. A comparison of the results of a panel study on cinema audiences with those of the movie sales regression analysis would show similarities and differences in significance of individual determinants, thus allowing for full understanding of box office success.
References
Ainslie, A., Dreye, X. and Zufryden, F. (2005) ‘Modeling movie life cycles and market share’, Marketing Science, 24 (3), pp. 508–517.
Albert, S. (1999) ‘Movie stars and the distribution of financially successful films in the motion picture industry’, Journal of Cultural Economics, 23 (4), pp. 325–329.
Bagella, M. and Becchetti, L. (1999) ‘The determinants of motion picture box office performance: evidence from movies produced in Italy’, Journal of Cultural Economics, 23 (4), pp. 237–256.
Baimbridge, M. (1997) ‘Movie admissions and rental income: the case of James Bond’, Applied Economics Letters, 4 (1), pp. 57–61.
Baker, W.W. and Faulkner, R.R. (1991) ‘Role as resource in the Hollywood film industry’, American Journal of Sociology, 97 (2), pp. 279–309.
Basuroy, S., Chatterjee, S. and Ravid, A. (2003) ‘How critical are critical reviews? The box office effects of film critics, star power, and budgets’, Journal of Marketing, 67 (4), pp. 103–117.
Basuroy, S., Desai, K.K. and Talukdar, D. (2005) ‘An empirical investigation of signaling in the motion picture industry’, Journal of Marketing Research, 43 (2), pp. 287–295.
Canterbery, E.R. and Marvasti, A. (2001) ‘The U.S. motion pictures industry: an empirical approach’, Review of Industrial Organization, 19 (1), pp. 81–98.
Chang, B.H. and Ki, E.J. (2005) ‘Devising a practical model for predicting theatrical movie success: focusing on the experience good property’, Journal of Media Economics, 18 (4), pp. 247–269.
Chevalier, J.A. and Mayzlin, D. (2006) ‘The effect of word of mouth on sales: online book reviews’, Journal of Marketing Research, 43 (3), pp. 345–354.
Collins, A., Hand, Ch. and Snell, M.C. (2002) ‘What makes a blockbuster? Economic analysis of film success in the United Kingdom’, Managerial and Decision Economics, 23 (6), pp. 343–354.
PISF, Cyfryzacja w Polsce. Retrieved 21.03.2015 from http://www.pisf.pl/rynek-filmowy/rynek-filmowy/cyfryzacja-kin.
Dellarocas, Ch., Neveen, F.A. and Xiaoquan, Z. (2007) ‘Exploring the value of online product reviews in forecasting sales: the case of motion pictures’, Journal of Interactive Marketing, 21 (4), pp. 23–45.
Delmestri, G., Montanari, F. and Usai, A. (2005) ‘Reputation and strength of ties in predicting commercial success and artistic merit of independents in the Italian feature film industry’, Journal of Management Studies, 42 (5), pp. 975–1002.
Desai, K.K. and Basuroy, S. (2005) ‘Interactive influence of genre familiarity, star power, and critics reviews in the cultural goods industry: the case of motion pictures’, Psychology & Marketing, 22 (3), pp. 203–224.
De Vany, A.S. and Lee, C. (2001) ‘Quality signals in information cascades and the dynamics of the distribution of motion picture box office revenues’, Journal of Economic Dynamics & Control, 25 (3/4), pp. 593–614.
De Vany, A.S. and Walls, W.D. (1999) ‘Uncertainty in the movie industry: does star power reduce the terror of the box office?’, Journal of Cultural Economics, 23 (4), pp. 285–318.
Dhar, T., Sun, G. and Weinberg, Ch.B. (2012) ‘The long - term box office performance of sequel movies’, Marketing Letters, 23 (1), pp. 13–29.
Duan, W., Gu, B. and Whinston, A.B. (2008) ‘The dynamics of online word-of-mouth and product sales. An empirical investigation of the movie industry’, Journal of Retailing, 84 (2), pp. 233–242.
Einav, L. (2002) ‘Seasonality and competition in time: an empirical analysis of release date decisions in the U.S. motion picture industry’. Retrieved 12.02.2014 from http://www.stanford.edu/~leinav/Release_Dates.pdf.
Elberse, A. (2007) ‘The power of stars: do star actors drive the success of movies?’, Journal of Marketing, 71 (4), pp. 102–120.
© Faculty of Management University of Warsaw. All rights reserved. DOI: 10.7172/2449-6634.jmcbem.2015.1.2
Journal of Marketing and Consumer Behaviour in Emerging Markets 1(1)2015
Natalia Gmerek
34
(15–35)
Elberse, A. and Eliashberg, J. (2003) ‘Demand and supply dynamics for sequentially released products in international markets: the case of motion pictures’, Marketing Science, 22 (3), pp. 329–347.
Eliashberg, J. and Sawhney, M.S. (1994) ‘Modeling goes to Hollywood: predicting individual differences in movie enjoyment’, Management Science, 40 (9), pp. 1151–1173.
Eliashberg, J. Jonker, J.J., Sawhney, M.S. and Wierenga, B. (2000) ‘Moviemod: an implementable decision-support system for prerelease market evaluation of motion pictures’, Marketing Science, 19 (3), pp. 226–243.
Elliott, S. (22.06.2011) ‘Building a buzz in social media ahead of traditional marketing’, New YorkTimes. Retrieved 21.03.2015 from http://www.nytimes.com/2011/06/23/business/media/23adco.html?_r=0.Elliott, C. and Simmons, R. (2008) ‘Determinants of UK box office success: the impact of quality signals’, Review
of Industrial Organization, 33 (2), pp. 93–111.Faulkner, R. and Anderson, A. (1987) ‘Short-term projects and emergent careers: evidence from Hollywood’,
American Journal of Sociology, 92 (4), pp. 879–909.Ginsburg, V. and Weyers, S. (1999) ‘On the perceived quality of movies’, Journal of Cultural Economics, 23 (4),
pp. 269–283.Hadida, A.L. (2009) ‘Motion picture performance: a review and research agenda’, International Journal of
Management Review, 11 (3), pp. 297–335.Hand, Ch. (2001) ‘Increasing returns to information: further evidence from the UK film market’, Applied Economics
Letters, 8 (6), pp. 419–421. Hennig-Thurau, T., Houston, M.B. and Heitjans, T. (2009) ‘Conceptualizing and measuring the monetary value
of brand extensions: the case of motion pictures’, Journal of Marketing, 73 (6), pp. 167–183.Hennig-Thurau, T., Houston, M.B. and Sridhar, S. (2006) ‘Can good marketing carry a bad product? Evidence from
the motion picture industry’, Marketing Letters, 17 (3), pp. 205–219. Hennig-Thurau T., Houston M.B. and Walsh G. (2007) ‘Determinants of motion picture box office and profitability:
an interrelationship approach’, Review of Managerial Science, 1 (1), pp. 65–92.Hennig-Thurau, T., Walsh, G. and Wruck, O. (2001) ‘An investigation into the factors determining the success of
service innovations: the case of motion picture’, Academy of Marketing Science Review, 2001 (6), pp. 1–23.Hirschman, E.C. and Pieros Jr, A. (1985) ‘Relationships among indicators of success in Broadway plays and motion
pictures’, Journal of Cultural Economics, 9 (1), pp. 35–63.Hixson, T.K. (2006) ‘Mission possible: targeting trailers to movie audiences’, Journal of Targeting, Measurement
and Analysis for Marketing, 14 (3), pp. 210–224.Holbrook, M.B. (1999) ‘Popular appeal versus expert judgments of motion pictures’, The Journal of Consumer
Research, 26 (2), pp. 144–155.Holbrook, M.B. (2005) ‘The role of ordinary evaluations in the market of popular culture: do consumers have “good
taste”?’, Marketing Letters, 16 (2), pp. 75–86.Holbrook M.B. and Addis M. (2008) ‘Art versus commerce in the movie industry: a two –path model of motion-
picture success’, Journal of Cultural Economics, 32 (2), pp. 87–107.Jansen, Ch. (2005) ‘The performance of German motion pictures, profits and subsidies: some empirical evidence’,
Journal of Cultural Economics, 29 (3), pp. 191–212.Jedidi, K., Krider, R.E. and Weinberg, Ch.B. (1998) ‘Clustering at the movies’, Marketing Letters, 9 (4), pp. 393–405.Kamakura, W. A., Basuroy, S. and Boatwright, P. (2006) ‘Is silence golden? An inquiry into the meaning of silence in
professional product evaluations’, Quantitative Marketing and Economics, 4 (2), pp. 119–141.Kerrigan, F. (2010) Film marketing, Oxford: Elsevier.Krider, R.E. and Weinberg, Ch. B. (1998) ‘Competitive dynamics and the introduction of new products: the motion
picture timing game’, Journal of Marketing Research, 35 (1), pp. 1–15.Lampel, J. and Shamsie, J. (2000) ‘Critical push: strategies for creating momentum in the motion picture industry’,
Journal of Management, 26 (2), pp. 233–257.Lee, F.L.F. (2006) ‘Cultural discount and cross-culture predictability: examining the box-office performance of
America movies in Hong-Kong’, Journal of Media Economics, 19 (4), pp. 259–278.Lehmann, D.R. and Weinberg, Ch.B. (2000) ‘Sales through sequential distribution channels: an application to movies
and videos’, Journal of Marketing, 64 (3), pp. 18–33.Litman, B.R. (1983) ‘Predicting success of theatrical movies: an empirical study’, Journal of Popular Culture, 16 (1),
pp. 159–175.Litman, B.R. and Kohl, L.S. (1998) ‘Predicting financial success of motion pictures: the 80’s experience’, Journal
of Media Economics, 2 (2), pp. 35–50.Liu, Y. (2006) ‘Word of mouth for movies: its dynamics and impact on box office revenue’, Journal of Marketing,
70 (3), pp. 74–89.Mangold, W.G. and Faulds, D.J. (2009) ‘Social media: the new hybrid element of the promotion mix’, Business
Horizons, 2009 (52), pp. 357–365.Miller, D. and Shamsie, J. (2001) ‘Learning across the life cycle: experimentation and performance among the
Hollywood studio heads’, Strategic Management Journal, 22 (8), pp. 725–738.

© Faculty of Management University of Warsaw. All rights reserved. DOI: 10.7172/2449-6634.jmcbem.2015.1.2
Journal of Marketing and Consumer Behaviour in Emerging Markets 1(1)2015
Natalia Gmerek
35
(15–35)
Morley, S.A. (1998) ‘Making digital cinema actually happen – what it takes and who’s going to do it’, Society of Motion Picture & Television Engineers, conference proceedings, 1998 (7), pp. 1–16.
Moul, C. (2004) ‘Word-of-mouth versus market saturation: explaining demand dynamics for movies and music’, working paper, Department of Economics, Washington University.
Moul, C. (2007) ‘Measuring word of mouth’s impact on theatrical movie admissions’, Journal of Economics & Management Strategy, 16 (4), pp. 859–892.
Nelson, R.A., Donihue, M.R., Waldman, D.M. and Wheaton, C. (2001) ‘What’s an Oscar worth?’, Economic Inquiry, 39 (1), pp. 729–754.
Oświeciński, R., ‘Hity i kity, czyli gdzie są pieniądze?’, film.org.pl. Retrieved 21.03.2015 from http://film.org.pl/kmf/blog/hity-i-kity-czyli-gdzie-sa-pieniadze-27384/.
Prag, J. and Casavant, J. (1994) ‘An empirical study of the determinants of revenues and marketing expenditures in the motion picture industry’, Journal of Cultural Economics, 18 (3), pp. 217–235.
Ravid, S.A. (1999) ‘Information blockbusters and stars: a study of the film industry’, Journal of Business, 72 (4), pp. 463–492.
Reinstein, D.A. and Snyder, Ch.M. (2005) ‘The influence of expert reviews on consumer demand for experience goods: a case study of movie critics’, Journal of Industrial Economics, 53 (1), pp. 27–51.
Sawhney, M.S. and Eliashberg, J. (1996) ‘A parsimonious model of forecasting gross box-office revenues of motion pictures’, Marketing Science, 15 (2), pp. 113–131.
Scott, A.J. (2004) ‘Hollywood and the world: the geography of motion picture distribution and marketing’, Review of International Political Economy, 11 (1), pp. 33–61.
Sedgwick, J. and Pokorny, M. (1999) ‘Movie stars and the distribution of financially successful films in the motion picture industry’, Journal of Cultural Economics, 23 (4), pp. 319–323.
Simonoff, J.S. and Sparrow, I.R. (2000) ‘Predicting movie grosses: winners and losers, blockbusters and sleepers’, Chance, 13 (3), pp. 15–24.
Simonton, D.K., (2005a) ‘Cinematic creativity and production budgets: does money make the movie?’, Journal of Creative Behavior, 39 (1), pp. 1–15.
Simonton, D.K. (2005b) ‘Film as art versus film as business: differential correlates of screenplay characteristics’, Empirical Studies of the Arts, 23 (2), pp. 93–117.
Simonton, D.K. (2009) ‘Cinematic success criteria and their predictors: the art and business of the film industry’, Psychology & Marketing, 26 (5), pp. 400–420.
Smith, S.P. and Smith, V.K. (1986) ‘Successful movies: a preliminary analysis’, Applied Economics, 18 (5), pp. 501–507.
Sochay, S. (1994) ‘Predicting the performance of motion pictures’, Journal of Media Economics, 7 (4), pp. 1–20.Sood, S. and Dreze, X. (2006) ‘Brand extensions of experiential goods: movie sequel evaluations’, Journal
of Consumer Research, 33 (3), pp. 352–360.Svejenova, S. (2005) ‘The path with the heart: creating the authentic career’, Journal of Management Studies, 42 (5),
pp. 947–974.Wallace, W., Seigerman, A. and Holbrook, M. (1993) ‘The role of actors and actress in the success of films: how
much is a movie star worth?’, Journal of Cultural Economics, 17 (1), pp. 1–27.Walls, W.D. (1997) Increasing returns to information: evidence from the Hong Kong movie market, Applied
Economics Letters, 4 (5), pp. 287–290.Walls, W.D. (2005a) ‘Demand stochastic, supply adaptation, and the distribution of film earnings’, Applied Economics
Letters, 12 (10), pp. 619–623.Walls, W.D. (2005b) ‘Modeling heavy tails and skewness in film returns’, Applied Financial Economics, 15 (17),
pp. 1181–1188.Wierzchowska, M. (13.01.2015) Polskie filmy na kroplówce, Puls Biznesu. Retrieved 21.03.2015 from http://www.
pb.pl/3982731,2178,polskie-filmy-na-kroplowce.Wyatt, R.O. and Badgar, D.P. (1990) ‘Effects of information and evaluation in film criticism’, Journalism Quarterly,
67 (2), pp. 359–368. Zuckerman, E. and Kim, T. (2003) ‘The critical trade-off: Identity assignment and box office success in the feature
film industry’, Industrial and Corporate Change, 12 (1), pp. 27–67.Zufryden, F.S. (1996) ‘Linking advertising to box-office performance of new film release – a marketing planning
model’, Journal of Advertising Research, 36 (4), pp. 29–41.Zufryden, F.S. (2000) ‘New film website promotion and box-office performance’, Journal of Advertising Research,
40 (1/2), pp. 55–64.
© Faculty of Management University of Warsaw. All rights reserved. DOI: 10.7172/2449-6634.jmcbem.2015.1.3
Journal of Marketing and Consumer Behaviour in Emerging Markets 1(1)2015 36
(36–46)
Gender differences in mall shopping: a study of shopping behaviour of an emerging nation
M. Sadiq Sohail*Professor of Marketing
King Fahd University of Petroleum & MineralsE-mail: [email protected]
Received: 23 May 2014 / Revised: 20 January 2015 / Accepted: 16 February 2015 / Published online: 26 March 2015
ABSTRACT
Fast developments in the food retailing industry have led to growth of shopping malls, particularly in the large cities of Saudi Arabia. The purpose of this study is to compare men and women for differences in mall shopping. Using empirical research, this paper examines differences between the genders associated with mall patronage. Based on a survey of 513 shoppers across Saudi Arabia, the study finds significant differences in shopping behaviour. The paper discusses the findings and makes recommendations to mall operators.
JEL classification: M300, M310, M390, M00
Keywords: gender differences, mall shopping, shopping behaviour, Saudi Arabia
1. INTRODUCTION
The retailing sector is rapidly transforming in Saudi Arabia and bears little resemblance to what it was even a decade ago. Retail sales are booming and are expected to grow from about $27 billion in 2011 to more than $37bn in 2015 (Business Monitor International, 2011). Of these sales, we estimate about 50 per cent share of shopping malls. Large retail operators in multiple formats are now dominating the sector, and competition in the retail marketplace has been steadily increasing (Sohail, 2008).
Saudi Arabia is the largest retail market in the Arabian Peninsula and continues to be an outperformer in the hypermarket segment. The larger size of population, the high percentage of youth population, and their high levels of disposable income, provide an attractive opportunity for retail sector growth. The recent trend in the Kingdom is characterized by an upsurge in shopping malls. A number of mega hypermarkets have appeared mainly in cities.
Rising incomes and busier lifestyles are creating the space for malls in the lives of the affluent masses. Further, given the nature of the society in Saudi Arabia, where opportunities for entertainment are limited, Saudis and the large expatriate population patronize malls not only
* Department of Management & Marketing, PO Box 210, Dhahran 31261.
© Faculty of Management University of Warsaw. All rights reserved. DOI: 10.7172/2449-6634.jmcbem.2015.1.3
Journal of Marketing and Consumer Behaviour in Emerging Markets 1(1)2015
M. Sadiq Sohail
37
(36–46)
for shopping but also see this as an opportunity to socialize. Malls are patronized by people who often come for socialization and window-shopping rather than actual shopping.
The importance of malls in retail research cannot be marginalized. The competition among malls to attract and retain customers is increasing. There is ample evidence in literature to show that there are differences between men and women in shopping behaviour. Shopping has been typically stereotyped as a female activity (Buttle, 1992). Women are more likely than men to shop for items like grocery and clothing, while men are shoppers of specialized items like cars (Chebat et al, 2005). However, these trends are getting phased out as the roles of men and women are beginning to overlap gradually (Darley and Smith, 1995).
While academic research has addressed mall patronage and gender effects, most of it has been in the context of the developed nations and there is a paucity of research on mall shopping and gender influences in Saudi Arabia. As a result, present understanding on this topic has remained context-specific limiting our knowledge of mall patronage to research conducted in developed countries. Researchers have highlighted that there are fundamental differences between developed nations and a developing nation on issues such as business environment, consumer behaviour and others (Sohail 2009; Kulviwat, et al, 2009; Zhou & Li, 2010). This evidence suggests that studying the contextual nuances in different national settings brings forth hitherto unexplored perspectives.
The objectives of this research are therefore to examine effects of gender influence on the shopper’s characteristics and their influence on patronage.
2. LITERATURE REVIEW
2.1. Gender differences in mall shopping
Gender difference is an external influence of consumer behaviour, and this difference has been well researched (example, Pease and Pease, 2001). In the marketing literature, researchers have examined gender differences in different streams of research, for example, message processing (Meyers-Levy and Sternthal, 1991), price promotions (Mazumdar and Papatla, 1995), impulse purchases (Dittmar et al., 1995), attitudes toward shopping forms (Rajpoot et al 2008, Alreck and Settle, 2002, Dholakia and Uusitalo, 2002, Dittmar et al., 2004, Garbarino and Strahilevitz, 2004 and Chang and Samuel, 2004), and advertising (Martin, 2003). This stream of research has substantiated differences between men and women in terms of behaviour attitude towards shopping.
Marketing researchers and practitioners have been reporting gender differences and have observed some notable differences. For example, it was found that 67% of women enjoy shopping, compared to 37% of men (Klein, 1998). Another research found that women are more likely to buy in a store than men (Lucas, 1998), and women are more likely to buy gifts than men (Yin, 2003). Similarly, it was found that women go shopping to browse around and see shopping as an enjoyable activity while men go shopping just to meet their needs, seeing it as a duty. (Durakbaşa and Cindoğlu, 2002).
2.2. Value
Consumer value places emphasis on the principle of maximizing efficiency or optimising output for a particular level of input (Sproles, 1980). In the marketing literature, value has been discussed in the context of exchange or a return for something, a trade-off between benefits or satisfaction received and costs or sacrifices incurred (Downs, 1961, Murphy and Enis, 1986). With

© Faculty of Management University of Warsaw. All rights reserved. DOI: 10.7172/2449-6634.jmcbem.2015.1.3
Journal of Marketing and Consumer Behaviour in Emerging Markets 1(1)2015
M. Sadiq Sohail
38
(36–46)
a similar concept, Zeithaml’s (1988) value definitions of “the quality I get for the price I pay” and “what I get for what I give” also signify a trade-off between the benefit and cost component of shopping value. Researchers have also identified other dimensions of value, such as pleasure from shopping (Downs, 1961 and O›Guinn and Faber, 1989), quality of service (Zeithaml, 1988), and convenience of shopping (Mazursky and Jacoby, 1986 ). The essence of all this research is that shoppers weigh costs beyond the monetary cost of goods.
Past research has also established the influence of personal values on consumer decision-making and consumption behaviour (example, Tai, 2008, Doran, 2009 and Durvasula et al., 2011). A number of past studies have identified the underlying values determining mall shopping behaviour (Shim and Eastlick, 1998, Swinyard, 1998, Thompson and Chen, 1998, Erdem et al., 1999 and Stoel et al., 2004). However, few have systematically examined how these values influence mall shopping behaviour (Cai and Shannon, 2012). Additionally, personal values are in part consequences of culture and ethnicity (Phinney et al, 2001) and as most studies are mainly conducted in a Western or different cultural context, the objective of the present study will be to indentify the underlying influence of personal values on shopping attitude of shoppers in Saudi Arabia. It is of interest to study whether Indian shoppers’ underlying personal values influence their mall patronage.
2.3. Lifestyle
The term Lifestyle has its roots in the field of psychology (Coreil et al. 1985). Lazer (1963) introduced the concept of lifestyle to marketing. The term embraces cultural affiliation, social status, family background, personality, motivation, cognition, and marketing stimulus (Horley 1992). Lifestyle can be identified by a wide range of activities, interests, and opinions (Plummer 1974). Lifestyle analysis may be defined as patterns of activities on which consumers spend their time and money (Engel et al., 1995). Since then, a number of studies have developed and refined methods and models to measure lifestyles (example, Green et al., 2006, Jih and Lee, 2004).
In the marketing discipline, numerous studies have shown that lifestyle is a predictor of consumer purchasing behaviour (Fullerton and Dodge, 1992 and Jih and Lee, 2004). In the context of mall shopping, an analysis of the lifestyle influence on consumer purchases can be helpful to identify the target markets and promote the malls offerings.
2.4. Shopping Orientation
A study on shopping orientation was first initiated by Stone (1954), who referred to shoppers’ styles. Since then, the term has expanded to include personal, economic, social, and recreational characteristics of shoppers (Visser and Du Preez, 2001).
Though many studies have examined shopping orientation, very few studies have examined shopping orientation in a mall setting (Mejia and Benjamin, 2002). Studies have identified the influence of recreation or entertainment as a source of differentiation that could attract shoppers into malls (Haynes and Talpade, 1996; Maronick and Stiff, 1985). Other studies have identified an increasing tendency towards mall patronage for exclusive window shopping (for example, Nicholls et al, 2002). The utilitarian dimension of shopping attitude is also fairly supported in the marketing literature (example Allard et al, 2009). Despite that previous research, little insights are available regarding the influence of orientations on shopping attitude. This study is an attempt in this direction. Moreover, keeping the Saudi context, a multi-item shopping orientation scale based on past research is developed to measure orientation attributes.
© Faculty of Management University of Warsaw. All rights reserved. DOI: 10.7172/2449-6634.jmcbem.2015.1.3
Journal of Marketing and Consumer Behaviour in Emerging Markets 1(1)2015
M. Sadiq Sohail
39
(36–46)
2.5. Hypotheses
The following hypotheses are postulated with assumed shoppers’ evaluations of the relationship between the attitude toward shopping and the other influence variables:
H1: There is a significant difference between men and women in their mall shopping value perceptions
H2: There is a significant effect of lifestyle influences between men and women towards mall shopping
H3: There are significant differences between men and women in terms of shopping orientation
3. METHODS
3.1. Questionnaire Development
The scales used in the study were drawn from review of relevant literature. The initial list of measures was developed from the list of Bellenger et al. (1977), and Sit et al. (2003), Homer and Kahle (1988) and Shim and Eastlick (1998). Initially, 18 items were identified. To identify questions, past research more germane to the purchase situation was reviewed (example, Kowinski, 1985, Feinberg et al., 1989, Bellenger and Korgaonkar, 1980, Westbrook and Black, 1985 and Lumpkin et al., 1986). Nineteen shopping orientation items were initially included. Finally, to measure lifestyle, items were borrowed from SRI value and lifestyles (VALS) program (Piirto, 1991) and from the works of Wu (2003). For this study, 22 items were identified.
A focus group discussion was conducted with ten randomly selected shoppers. The list of items relating to the model construct was revealed to the participants. They were then asked to select and assess the variables they felt were relevant to their context. Two rounds of discussions moderated by the author, each lasting about forty minutes, were undertaken. Findings from these discussions were used to develop the survey instrument design. The results generated 54 representative items of which sixteen items measure shopping orientation, fourteen items were included in the lifestyle construct and fifteen items were used to measure the value construct. All these items were measured on a five point scale. Finally, some statements were included to capture demographic information and mall patronage.
3.2. Data Collection
The target population of this study was all individual mall shoppers residing in Saudi Arabia. Because of difficulties in obtaining probabilistic samples in Saudi Arabia, a convenience sampling technique was used. In the first stage of data collection, initial recruits were randomly selected by the author from among university students in three major cities in Saudi Arabia. The chosen cities are spread across three different regions: Jeddah in the western province, Riyadh in the central province, and the tri-cities of Dhahran-Khobar-Dammam in the eastern province. All these efforts resulted in obtaining 513 usable responses.
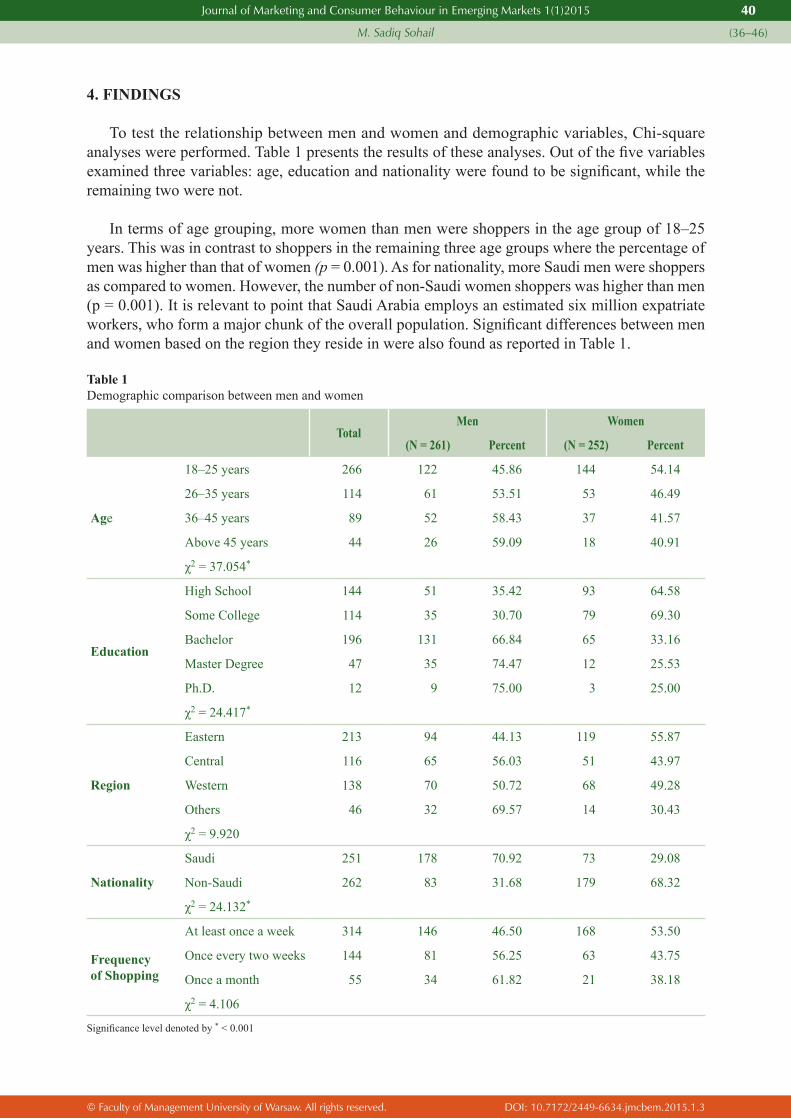
© Faculty of Management University of Warsaw. All rights reserved. DOI: 10.7172/2449-6634.jmcbem.2015.1.3
Journal of Marketing and Consumer Behaviour in Emerging Markets 1(1)2015
M. Sadiq Sohail
40
(36–46)
4. FINDINGS
To test the relationship between men and women and demographic variables, Chi-square analyses were performed. Table 1 presents the results of these analyses. Out of the five variables examined three variables: age, education and nationality were found to be significant, while the remaining two were not.
In terms of age grouping, more women than men were shoppers in the age group of 18–25 years. This was in contrast to shoppers in the remaining three age groups where the percentage of men was higher than that of women (p = 0.001). As for nationality, more Saudi men were shoppers as compared to women. However, the number of non-Saudi women shoppers was higher than men (p = 0.001). It is relevant to point that Saudi Arabia employs an estimated six million expatriate workers, who form a major chunk of the overall population. Significant differences between men and women based on the region they reside in were also found as reported in Table 1.
Table 1Demographic comparison between men and women
TotalMen Women
(N = 261) Percent (N = 252) Percent
Age
18–25 years 266 122 45.86 144 54.14
26–35 years 114 61 53.51 53 46.49
36–45 years 89 52 58.43 37 41.57
Above 45 years 44 26 59.09 18 40.91
χ2 = 37.054*
Education
High School 144 51 35.42 93 64.58
Some College 114 35 30.70 79 69.30
Bachelor 196 131 66.84 65 33.16
Master Degree 47 35 74.47 12 25.53
Ph.D. 12 9 75.00 3 25.00
χ2 = 24.417*
Region
Eastern 213 94 44.13 119 55.87
Central 116 65 56.03 51 43.97
Western 138 70 50.72 68 49.28
Others 46 32 69.57 14 30.43
χ2 = 9.920
Nationality
Saudi 251 178 70.92 73 29.08
Non-Saudi 262 83 31.68 179 68.32
χ2 = 24.132*
Frequency of Shopping
At least once a week 314 146 46.50 168 53.50
Once every two weeks 144 81 56.25 63 43.75
Once a month 55 34 61.82 21 38.18
χ2 = 4.106
Significance level denoted by * < 0.001
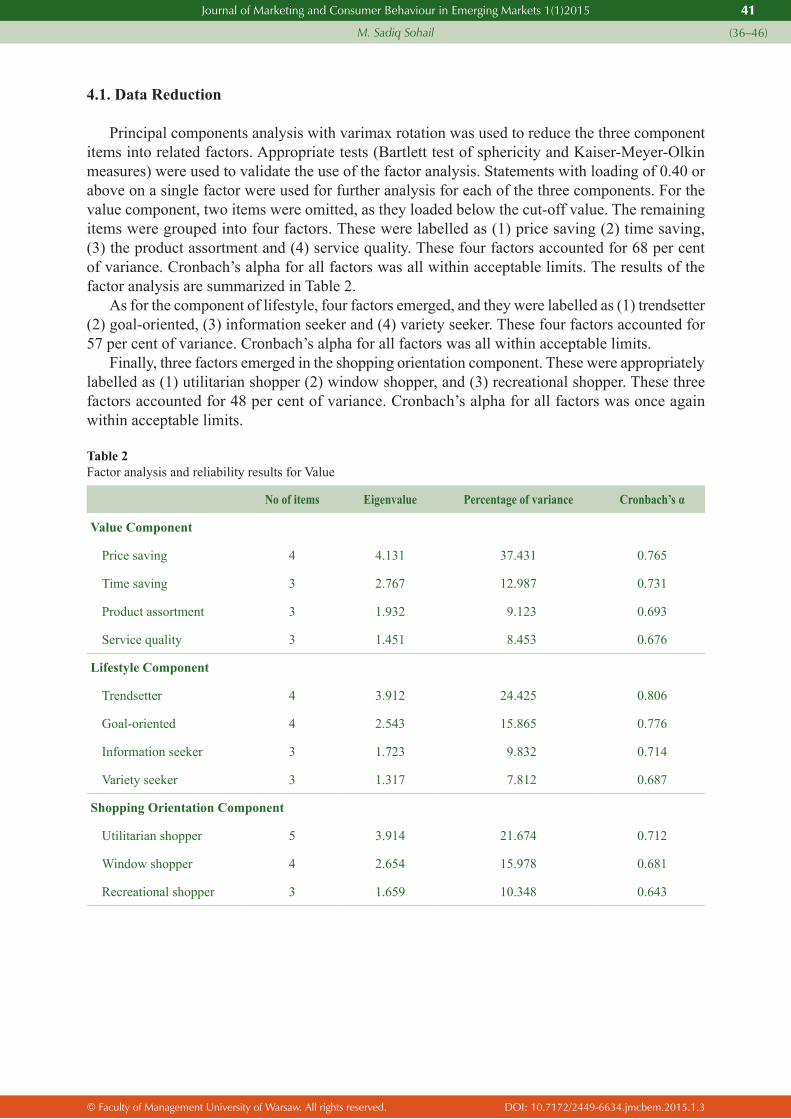
© Faculty of Management University of Warsaw. All rights reserved. DOI: 10.7172/2449-6634.jmcbem.2015.1.3
Journal of Marketing and Consumer Behaviour in Emerging Markets 1(1)2015
M. Sadiq Sohail
41
(36–46)
4.1. Data Reduction
Principal components analysis with varimax rotation was used to reduce the three component items into related factors. Appropriate tests (Bartlett test of sphericity and Kaiser-Meyer-Olkin measures) were used to validate the use of the factor analysis. Statements with loading of 0.40 or above on a single factor were used for further analysis for each of the three components. For the value component, two items were omitted, as they loaded below the cut-off value. The remaining items were grouped into four factors. These were labelled as (1) price saving (2) time saving, (3) the product assortment and (4) service quality. These four factors accounted for 68 per cent of variance. Cronbach’s alpha for all factors was all within acceptable limits. The results of the factor analysis are summarized in Table 2.
As for the component of lifestyle, four factors emerged, and they were labelled as (1) trendsetter (2) goal-oriented, (3) information seeker and (4) variety seeker. These four factors accounted for 57 per cent of variance. Cronbach’s alpha for all factors was all within acceptable limits.
Finally, three factors emerged in the shopping orientation component. These were appropriately labelled as (1) utilitarian shopper (2) window shopper, and (3) recreational shopper. These three factors accounted for 48 per cent of variance. Cronbach’s alpha for all factors was once again within acceptable limits.
Table 2Factor analysis and reliability results for Value
No of items Eigenvalue Percentage of variance Cronbach’s α
Value Component
Price saving 4 4.131 37.431 0.765
Time saving 3 2.767 12.987 0.731
Product assortment 3 1.932 9.123 0.693
Service quality 3 1.451 8.453 0.676
Lifestyle Component
Trendsetter 4 3.912 24.425 0.806
Goal-oriented 4 2.543 15.865 0.776
Information seeker 3 1.723 9.832 0.714
Variety seeker 3 1.317 7.812 0.687
Shopping Orientation Component
Utilitarian shopper 5 3.914 21.674 0.712
Window shopper 4 2.654 15.978 0.681
Recreational shopper 3 1.659 10.348 0.643

© Faculty of Management University of Warsaw. All rights reserved. DOI: 10.7172/2449-6634.jmcbem.2015.1.3
Journal of Marketing and Consumer Behaviour in Emerging Markets 1(1)2015
M. Sadiq Sohail
42
(36–46)
4.2. Results of hypothesis tests
4.2.1. Hypothesis 1
This study used an analysis of variance to provide evidence that mall shopping revealed significant differences based on gender. All the hypotheses were tested. The first hypothesis was to see for differences between men and women in their mall shopping value perceptions. Three of the four factors under this component were found to have a significant effect on gender. The first test for price saving was significant (p < 0.001). Men are more inclined to look for price saving compared to women. The result of the second test, seeking to determine whether a significant gender difference existed in terms of time saving, was also significant. By examining mean scores, it is obvious that men look for time saving as compared to women. This may be due to the fact that most women in Saudi Arabia have more time for socializing with limited opportunities for employment. The result of the third test, aimed to determine whether a significant difference existed between men and women in terms quality of service, was also significant. Mean score indicates that men are more likely to perceive value benefit by gauging the quality of service.
Because of the significance of the ANOVA tests, H1 was rejected.
4.2.2. Hypothesis 2
H2, which was postulated to determine gender differences related to the lifestyle components of shopping behaviour, was tested using separate ANOVA tests for each factor. The first two tests were insignificant. The result of the third test to determine whether a significant difference existed in terms of information seeking was significant. By examining mean scores, it appears that men (mean 3.49) were more likely to seek information when shopping compared with women (mean 2.35). This result related to the cognitive process components is somewhat in contrast to a finding of another study which found that women are generally more inquisitive than men when shopping (Underhill, 1999).
The result of the fourth test, intended to determine whether a significant difference existed between men and women in terms of variety-seeking, was significant, as well. Women (mean 4.07) are more likely than men (mean 2.92) to look for variety while shopping.
4.2.3. Hypothesis 3
It was hypothesized that significant differences existed between men and women with regard to shopping orientation. Of all three tests that were conducted, the first two tests were significant.
The first test was conducted to determine if any significant differences existed between men and women in terms of utilitarian shopping orientation. This was found to be significant. Men in general are high on the utilitarian shopping dimension and more price sensitive than women. The result of the second test, conducted to determine whether a significant gender difference existed in terms of window shopping orientation, was also significant. By examining mean scores, it is obvious that more women are window shoppers than men. This result finds support in another study, which concluded women see shopping as an enjoyable activity, while men end up making the purchases (Durakbaşa and Cindoğlu, 2002).
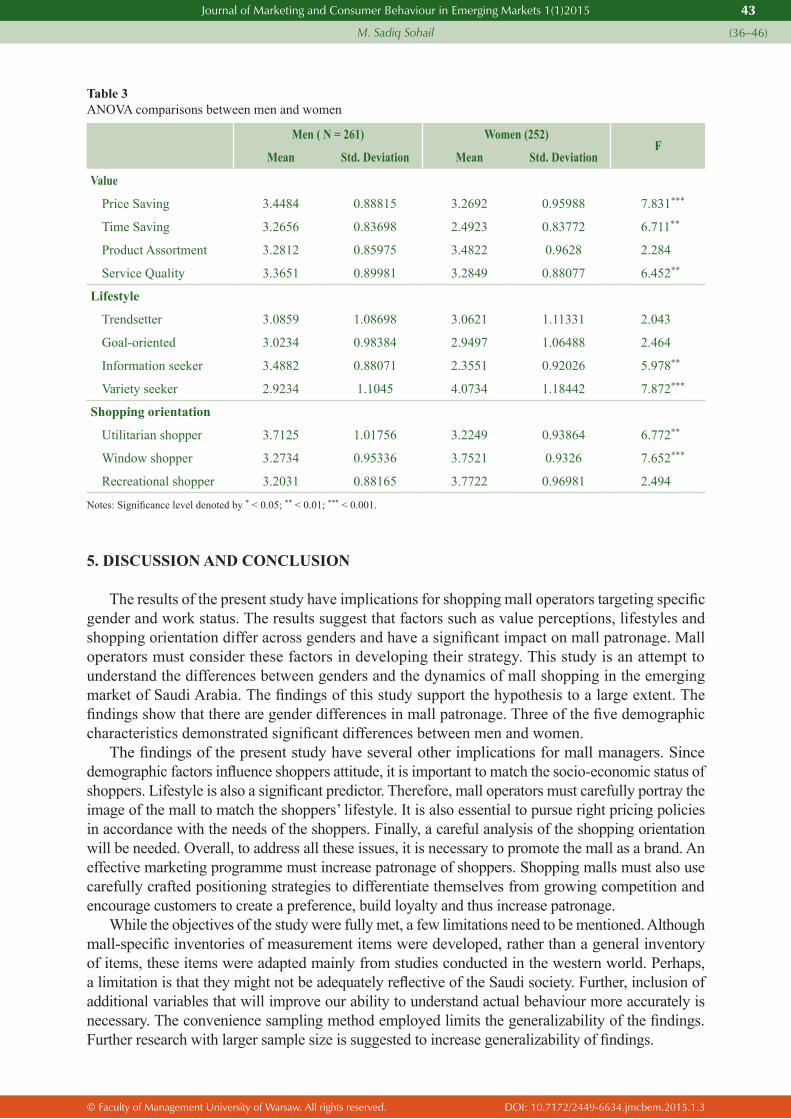
© Faculty of Management University of Warsaw. All rights reserved. DOI: 10.7172/2449-6634.jmcbem.2015.1.3
Journal of Marketing and Consumer Behaviour in Emerging Markets 1(1)2015
M. Sadiq Sohail
43
(36–46)
Table 3ANOVA comparisons between men and women
Men ( N = 261) Women (252)
FMean Std. Deviation Mean Std. Deviation
Value
Price Saving 3.4484 0.88815 3.2692 0.95988 7.831***
Time Saving 3.2656 0.83698 2.4923 0.83772 6.711**
Product Assortment 3.2812 0.85975 3.4822 0.9628 2.284
Service Quality 3.3651 0.89981 3.2849 0.88077 6.452**
Lifestyle
Trendsetter 3.0859 1.08698 3.0621 1.11331 2.043
Goal-oriented 3.0234 0.98384 2.9497 1.06488 2.464
Information seeker 3.4882 0.88071 2.3551 0.92026 5.978**
Variety seeker 2.9234 1.1045 4.0734 1.18442 7.872***
Shopping orientation
Utilitarian shopper 3.7125 1.01756 3.2249 0.93864 6.772**
Window shopper 3.2734 0.95336 3.7521 0.9326 7.652***
Recreational shopper 3.2031 0.88165 3.7722 0.96981 2.494
Notes: Significance level denoted by * < 0.05; ** < 0.01; *** < 0.001.
5. DISCUSSION AND CONCLUSION
The results of the present study have implications for shopping mall operators targeting specific gender and work status. The results suggest that factors such as value perceptions, lifestyles and shopping orientation differ across genders and have a significant impact on mall patronage. Mall operators must consider these factors in developing their strategy. This study is an attempt to understand the differences between genders and the dynamics of mall shopping in the emerging market of Saudi Arabia. The findings of this study support the hypothesis to a large extent. The findings show that there are gender differences in mall patronage. Three of the five demographic characteristics demonstrated significant differences between men and women.
The findings of the present study have several other implications for mall managers. Since demographic factors influence shoppers attitude, it is important to match the socio-economic status of shoppers. Lifestyle is also a significant predictor. Therefore, mall operators must carefully portray the image of the mall to match the shoppers’ lifestyle. It is also essential to pursue right pricing policies in accordance with the needs of the shoppers. Finally, a careful analysis of the shopping orientation will be needed. Overall, to address all these issues, it is necessary to promote the mall as a brand. An effective marketing programme must increase patronage of shoppers. Shopping malls must also use carefully crafted positioning strategies to differentiate themselves from growing competition and encourage customers to create a preference, build loyalty and thus increase patronage.
While the objectives of the study were fully met, a few limitations need to be mentioned. Although mall-specific inventories of measurement items were developed, rather than a general inventory of items, these items were adapted mainly from studies conducted in the western world. Perhaps, a limitation is that they might not be adequately reflective of the Saudi society. Further, inclusion of additional variables that will improve our ability to understand actual behaviour more accurately is necessary. The convenience sampling method employed limits the generalizability of the findings. Further research with larger sample size is suggested to increase generalizability of findings.
© Faculty of Management University of Warsaw. All rights reserved. DOI: 10.7172/2449-6634.jmcbem.2015.1.3
Journal of Marketing and Consumer Behaviour in Emerging Markets 1(1)2015
M. Sadiq Sohail
44
(36–46)
Acknowledgements
1. This study was funded under the King Fahd University of Petroleum and Minerals (KFUPM), Saudi Arabia, Internal Research Grants Program – Project No. IN101006. The author acknowledges KFUPM for the financial as well as other administrative support in completion of this research.
2. An earlier version of this paper was presented at the “Advances in Business-Related Scientific Research” Conference – ABSRC 2013 – Venice, Italy.
References
Allard, T., Babin, B.J. and Chebatc, J. (2009) ‘When income matters: Customers evaluation of shopping malls’ hedonic and utilitarian orientations”, Journal of Retailing and Consumer Services, Vol. 16, No. 1, pp. 40–49
Alreck, P. and Settle, R.B. (2002) ‘Gender effects on internet, catalogue and store shopping’, Journal of Database Management, Vol. 2002, pp. 150–162 (January).
Bellenger, D.N. and Korgaonkar, P.K. (1980) ‘Profiling the recreational shopper’, Journal of Retailing, Vol. 56, No. 3, pp. 77–92.
Bellenger, D.N., Robertson, D.H. and Greenberg, B.A. (1977) ‘Shopping centre patronage motives’, Journal of Retailing, Vol. 53, No. 2, pp. 29–38.
Business Monitor International (2011) ‘Saudi retail sales seen at $37 billion by 2015’, http://www.arabianbusiness.com/companies/business-monitor-international-74682.html.
Buttle, F. (1992) ‘Shopping motives constructions perspective’, Service Industries Journal, Vol. 12, No. 3, July, pp. 349–367.
Cai, Y. and Shannon, R. (2012) ‘Personal values and mall shopping behavior: The mediating role of attitude and intention among Chinese and Thai consumers’, Australasian Marketing Journal (AMJ), Vol. 20, No. 1, February, pp. 37–47.
Chang, J. and Samuel, N. (2004) ‘Internet shopper demographics and buying behavior in Australia’, Journal of American Academy of Business, Vol. 5, (September). pp. 171–176.
Chebat., J., Gélinas-Chebatc, C. and Therriend, K. (2005) ‘Lost in a mall, the effects of gender, familiarity with the shopping mall and the shopping values on shoppers’ way-finding processes’, Journal of Business Research, Vol. 58, No. 11, pp. 1590–1598.
Coreil, J., Levin J.S. and Jaco, E.G. (1985) ‘Lifestyle: An emergent concept in the socio-medical sciences’, Culture, Medicine and Psychiatry, Vol. 9, No. 4, pp. 423–437.
Darley, W.K and Smith, R.E. (1995) ‘Gender differences in information processing strategies: an empirical test of the selectivity model in advertising response’, Journal of Advertising, Vol. 24, No. 1, pp. 41–56.
Dholakia, R.R. and Uusitalo, O. (2002) ‘Switching to electronic stores: consumer characteristics and the perception of shopping benefits’, International Journal of Retail Distribution and Management, Vol. 30 (October), pp. 459–69.
Dittmar, H., Beattie, J. and Friese, S. (1995) ‘Gender identity and material symbols: objects and decision considerations in impulse purchases’, Journal of Economic Psychology, Vol. 16 (September), pp. 491–502.
Doran, C.J. (2009) ‘The role of personal values in fair trade consumption’, Journal of Business Ethics, Vol. 84, pp. 549–563.
Downs, A. (1961) ‘A theory of consumer efficiency’, Journal of Retailing, Vol. 37, pp. 6–12.Durakbasa, A. and Cindoglu, D. (2002) ‘Encounters at the counter: the gender dimension of the shopping experience
in contemporary Turkey’, in: Kagitcibasi, C. (Ed.), Fragments of Culture: The Everyday Life in Modern Turkey, I.B. Taurus, London, pp. 69–86.
Durvasula, S., Lysonski, S. and Madhavi, A.D. (2011) ‘Beyond service attributes: do personal values matter?, Journal of Services Marketing, 25 (1) (2011), pp. 33–46.
Engel, J.F., Blackwell, R.D. and Miniard, P.W. (1995) Consumer Behaviour, Dryden Press, Fort Worth, TX.Erdem, O., Oumlil, A.B. and Tuncalp, S. (1999) ‘Consumer values and the importance of store attributes’,
International Journal of Retail & Distribution Management, 27 (4) (1999), pp. 137–144.Feinberg, R.A., Meoli, J. and Sheffler, B. (1989) ‘There’s Something Social Happening at the Mall’, Journal
of Business and Psychology, 4, pp. 49–63, Fall.Fullerton, S. and Dodge, H.R. (1992) ‘A reassessment of life style and benefits-based segmentation strategies’,
Journal of Marketing Management, Vol. 2, No. 2, pp. 42–46.Garbarino, E. and Strahilevitz, M. (2004) ‘Gender differences in the perceived risk of buying online and the effects of
receiving a site recommendation’, Journal of Business Research, 57 (July), pp. 768–775.
© Faculty of Management University of Warsaw. All rights reserved. DOI: 10.7172/2449-6634.jmcbem.2015.1.3
Journal of Marketing and Consumer Behaviour in Emerging Markets 1(1)2015
M. Sadiq Sohail
45
(36–46)
Green, G.T., Cordell, H.K., Bertz, C.J. and Distefano, C. (2006) ‘Construction and validation of the national survey on recreation and the environment’s lifestyle scale’, Journal of Leisure Research, Vol. 38, No. 4, pp. 514–517.
Haynes, J. and Talpade, S. (1996) ‘Does entertainment draw shoppers? The effect of entertainment centers on shopping behavior in malls’, Journal of Shopping Center Research, Vol. 3, No. 2, pp. 29–48.
Homer, P.M. and Kahle, L.R. (1988) ‘A structural equation test of the value–attitude–behavior hierarchy’, Journal of Personality and Social Psychology, Vol. 54, pp. 638–646.
Horley, J. (1992) ‘A longitudinal examination of lifestyles’, Social Indicators Research, Vol. 26, No. 3, pp. 205–219.Jih, W.J.K. and Lee, S.F. (2004) ‘An exploratory analysis of relationships between cellular phone users’ shopping
motivators and lifestyle indicators’, Journal of Computer Information Systems, Vol. 44, No. 2, pp. 65–73.Klein, M. (1998) ‘He shops, she shops’, American Demographics, Vol. 20 (March), pp. 34–35.Kowinski, William Severini (1985) The Malling of America, New York: Morrow and Co., 1985. Kulviwat, S., Bruner, G. and Al-Shuridah, O. (2009) ‘The role of social influence on adoption of high tech
innovations: the moderating effect of public/private consumption’, Journal of Business Research, Vol. 62, No. 7, pp. 706–712.
Lazer, W. (1963) ‘Lifestyle Concepts and Marketing’, American Marketing Association, Chicago, IL. Lucas, J. (1998) ‘The critical shopping experience’, Marketing Management, Vol. 8, pp. 60–62 (Spring).Lumpkin, J.R. (1985) ‘Shopping orientation segmentation of the elderly consumer’, Journal of the Academy
of Marketing Science, Vol. 13, No. 2, pp. 139–151.Maronick, T.J. and Stiff, R.M. (1985) ‘The impact of a specialty retail center on downtown shopping behavior’,
Academy of Marketing Science Journal, Vol. 13, No. 3, pp. 292.Martin, B. (2003) ‘The influence of gender on mood effects in advertising’, Psychology and Marketing, Vol. 20
(March), pp. 249–73.Mazumdar, T. and Papatla, P. (1995) ‘Gender difference in price and promotion response’, Pricing Strategy &
Practice: An International Journal, Vol. 3, No. 1, pp. 21–33.Mazursky, D. and Jacoby, J. (1986) ‘Exploring the development of store images’, Journal of Retailing, 62 (2),
pp. 145–165.Mejia, L.C. and Benjamin, J.D. (2002) ‘What do we know about the determinants of shopping center sales? Spatial
vs. non-spatial factors’, Journal of Real Estate Literature, Vol. 10, No. 1, p. 3.Meyers-Levy, J. and Sternthal, B. (1991) ‘Gender differences in the use of message cues and judgments’, Journal
of Marketing Research, Vol. 28 (February), pp. 84–96.Murphy, P.E. and Enis, B.M. (1986) ‘Classifying products strategically’, Journal of Marketing, Vol. 50, No. 3,
pp. 24–42.Nicholls, J.A.F., Li, F., Kranendonk, C.J. and Roslow, S. (2002) ‘The seven year itch? Mall shoppers across time’,
Journal of Consumer Marketing, Vol. 19, No. 2/3, pp. 149.O'Guinn, T.C. and Faber, R.J. (1989) ‘A clinical screener for compulsive buying’, Journal of Consumer Research,
Vol. 19, No. 3, pp. 459–469.Pease, A. and Pease, B. (2001) Why Men Don’t Listen and Women can’t Read Maps: How we’re Different and What
to do About It, New York: Broadway.Phinney, J.S., Baumann, K. and Blanton, S. (2001) ‘Life Goals and Attributions for Expected Outcomes among
Adolescents from Five Ethnic Groups’, Hispanic Journal of Behavioural Sciences, Vol. 23, No. 4 (November), pp. 363–377, .
Piirto, R. (1991) ‘VALS the second time’, American Demographics, 13(7), p. 6–7.Plummer, J.T (1974) ‘The concept and application of lifestyle segmentation’, Journal of Marketing, Vol. 38, No. 1,
pp. 33–74.Prendergast, G., Marr, N. and Jarratt, B. (1998) ‘Retailer’s views of shopping centres: a comparison of tenants
and non-tenants’, International Journal of Retail & Distribution Management, Vol. 26, No. 4, pp. 162–171.Shim, S. and Eastlick, M.A. (1998) ‘The hierarchical influence of personal values on mall shopping attitude
and behaviour’, Journal of Retailing, Vol. 74, No. 1, pp. 139–160.Shim, S. and Eastlick, M.A. (1998) ‘The hierarchical influence of personal values on mall shopping attitude and
behavior’, Journal of Retailing, Vol. 74, No. 1, pp. 139–160.Sit, J., Merrilees, B. and Birch, D. (2003) ‘Entertainment seeking shopping center patrons: the missing segments’,
International Journal of Retail & Distribution Management, Vol. 31, No. 2, pp. 80–94.Sohail, M.S. (2009) ‘Marketing strategy, related factors and performance of firms across Saudi Arabia’, Journal
of International Business and Entrepreneurship Development, Vol. 4, No. 4, pp. 286–301.Sohail, M.S. (2008) ‘Shopping Behavior and Evaluation of Store Features: Perspectives from a Food Market in the
Arabian Peninsula’, The Journal of International Food and Agribusiness Marketing, Vol. 20, No. 3, pp. 5–27. Solomon, Michael (2004) Consumer Behavior: Buying, Having and Being. Prentice Hall: New Jersey.Sproles G.B. (1980) ‘New theoretical and empirical perspectives of efficiency’, in: Olson, J. (Ed.), Advances in
Consumer Research, Association for Consumer Research, Ann Arbor, MI, Vol. 7, pp. 178–179.
© Faculty of Management University of Warsaw. All rights reserved. DOI: 10.7172/2449-6634.jmcbem.2015.1.3
Journal of Marketing and Consumer Behaviour in Emerging Markets 1(1)2015
M. Sadiq Sohail
46
(36–46)
Stoel, L., Wickliffe, V. and Lee, K.H. (2004) ‘Attribute beliefs and spending as antecedents to shopping value’, Journal of Business Research, Vol. 57, pp. 1067–1073.
Stone, G.P. (1954) ‘City Shoppers and Urban Identification: Observations on the Social Psychology of City Life’, American Journal of Sociology, Vol. 60, No. 1 (Jul., 1954), pp. 36–45
Swinyard, W.R. (1998) ‘Shopping mall customer values: the national mall shopper and the list of values’, Journal of Retailing and Consumer Services, Vol. 5, No. 3, pp. 167–172.
Tai, H.C. (2008) ‘Relationship between the personal values and shopping orientation of Chinese consumers’, Asia Pacific Journal of Marketing and Logistics, Vol. 20, No. 4, pp. 381–395.
Thompson, K.E. and Chen, Y.L. (1998) ‘Retail store image: a means-end approach’, Journal of Marketing Practice, Vol. 4, No. 6, pp. 161–173.
Underhill, P. (1999) Why We Buy: The Science of Shopping, Simon & Schuster, New York, NY.Visser, E.M. & Du Preez, R. (2001) ‘Apparel shopping orientation: two decades of research’, Journal of Family
Ecology and Consumer Sciences, Vol. 29, pp. 72–81. Westbrook, R.A., Black, W.C. (1985) ‘A motivation-based shopper typology’, Journal of Retailing, Vol. 61, No. 1,
pp. 78–103.Wu, S.I. (2003) ‘The relationship between consumer characteristics and attitude toward online shopping’, Marketing
Intelligence and Planning, 21 (1) (2003), pp. 37–44. Yin, Sandra (2003) ‘Give and take’, American Demographics, Vol. 25, No. 12 (November), p. 19. Zeithaml, V.A. (1988) ‘Consumer perceptions of price, quality, and value: A means end model and synthesis of
evidence’, Journal of Marketing, Vol. 52, No. 3, pp. 2–22.Zhou, K. and Li, C. (2010) ‘How strategic orientations influence the building of dynamic capability in emerging
economies’, Journal of Business Research, Vol. 63, No. 3, pp. 2224–223.
© Faculty of Management University of Warsaw. All rights reserved. DOI: 10.7172/2449-6634.jmcbem.2015.1.4
Journal of Marketing and Consumer Behaviour in Emerging Markets 1(1)2015
Agnieszka Kacprzak, Katarzyna Dziewanowska
47
(47– 61)
Does a global young consumer exist? A comparative study of South Korea and Poland
Agnieszka KacprzakFaculty of ManagementUniversity of Warsaw
E-mail: [email protected]
Katarzyna DziewanowskaFaculty of ManagementUniversity of Warsaw
E-mail: [email protected]
Received: 06.02.2015 / Revised: 12.04.2015 / Accepted: 14.04.2015 / Published online: 24.04.2015
ABSTRACT
In this paper we analyse the phenomenon of the global young consumer. Taking the example of young people from South Korea and Poland, we show similarities and differences in their reaction to modern socio-cultural trends influencing consumption patterns. The globalization process is believed to affect most young people designated Generation Y. They were brought up in the Internet age, which ease homogenization of cultural values, attitudes and consumer behaviour. On the other hand, the impact of local culture on their behaviour as consumers must still be considered.
The results of quantitative studies conducted among 200 young Korean and Polish consumers were investigated. A research tool, in the form of six indices measuring the attitudes towards modern socio-cultural trends influencing consumer behaviour, was used (materialism, impulsive consumption, greening, virtualization, virtual tribalism, tribalism in real space). The findings suggest that there are significant differences in the level of materialism, greening and tribalism in real space between young Poles and Koreans while their attitudes to behaviour connected to Internet usage are similar. Therefore, the assumption can be made that the widespread use of new technologies is a characteristic feature that bonds Generation Y on a global scale while other aspects of consumer behaviour remain strongly influenced by local cultures. This makes a significant contribution to knowledge of marketing strategy planning in global companies targeting young consumers. It seems that the ethnocentric approach can be implemented only in the new technologies sector while for other products and services the polycentric strategy is more appropriate.
JEL classification: M300, M310, M390, M00
Keywords: globalization, young consumers, Generation Y, Korea, Poland, segmentation
© Faculty of Management University of Warsaw. All rights reserved. DOI: 10.7172/2449-6634.jmcbem.2015.1.4
Journal of Marketing and Consumer Behaviour in Emerging Markets 1(1)2015
Agnieszka Kacprzak, Katarzyna Dziewanowska
48
(47– 61)
1. INTRODUCTION
Nowadays consumers are increasingly being confronted with a global culture. Globalization in the field of the economy is followed by globalization of culture, which in turn influences consumption patterns (Guo, 2013). A growing number of people are cosmopolitans, citizens of the world, who are able to adapt to other cultures without complete abandonment of their own (Nijssen and Douglas, 2011). They are open to other norms, practices, experiences and behaviours which are a part of a global cultural code (Woodward et al., 2008; Arnett, 2002). People, who once lived in a fragmented, isolated and individualized world, are now interconnected by global means of communication such as the Internet (Bauman, 1998). Global awareness combines thinking about interdependencies that exist throughout the world and the sense of living in a global community rather than a country-specific one (Venter and Venter, 2010; Guo, 2013).
The Consumer Culture Theory (CCT) suggests that one of the promising fields of research is investigation of overlapping cultural groups existing within the frame of globalization (Arnould and Thompson, 2005). The global consumer culture manifests itself by a set of signs and symbols that are similarly understood by a large number of consumers in different countries (Archrpru Akaka and Alden, 2010). Thanks to the Internet or cable TV, consumers can easily obtain information about a product or a brand from any place in the world. The emergence of global media causes the homogenization of consumers’ tastes and needs world-wide. Moreover, some consumption objects like an iPhone or a cup of Starbucks coffee become signs of belonging to the segment of global cosmopolitans (Alden et al., 1999; Nijssen and Douglas, 2011; Stizhakova et al., 2008). It should be noted, however, that even though consumers understand signs and behaviour associated with global culture, they still use a local system of meanings in order to interpret them. Globalization can lead to convergence of cultures but, on the other hand, it can also cause a growth in heterogeneity due to the desire to preserve the uniqueness of local cultures (Archrpru Akaka and Alden, 2010).
In the past, global consumers were identified with a segment of the wealthiest, but nowadays global segments are more numerous and diversified. One such segment consists of teenagers who listen to the same kind of music, like the same kind of entertainment and prefer the same style in clothing (Douglas and Craig, 2011). Young consumers are considered to be the most converging market segment on a global scale (Choi and La Ferla, 2004). Regardless of their culture, teenagers have to deal with similar problems of adolescence, such as uncertainty, the authority of parents and peer group pressure (Solomon, 2013: 525). Some researchers claim that the beliefs of young people are very cosmopolitan due to the fact that they receive most of their information about the world around them from sources representing a global perspective. The media such as MTV deliver the same message to different countries, resulting in the standardization of the tastes of their audience (Domzal and Kernan, 1993). Teenagers are particularly interested in global media due to the fact that, unlike children, they are already mature enough to seek both information and experience beyond their family. At the same time they are in the phase of shaping their beliefs and behaviours and, therefore, are very attracted to everything new and unusual (Arnett, 2002).
Today’s young people are the first generation born in a globalized world of global dependencies. Thanks to the Internet, they feel connected to the whole world and have a global consciousness. Generation Y numbers approximately 1.5 billion. They have great influence on purchasing decisions in the family and are often described as the most powerful group of consumers in the market (Tapscott, 2008). Their characteristic feature is their ease in using modern technologies. Young people in developed countries are constantly connected to the network that they use for contacts with others through social media, to seek information and to shop on-line (AudioTech Inc., 2012). Generation Y is also described as interested in environmental issues. Young people believe that they can change the world and often boycott brands accused of damaging the natural environment (Bucic et al., 2012). In this case, however, differences resulting from the consumer’s
© Faculty of Management University of Warsaw. All rights reserved. DOI: 10.7172/2449-6634.jmcbem.2015.1.4
Journal of Marketing and Consumer Behaviour in Emerging Markets 1(1)2015
Agnieszka Kacprzak, Katarzyna Dziewanowska
49
(47– 61)
country of origin can be observed. This is due to the fact that some of the values depend on the economic situation of a country and change with increasing prosperity (e.g. individualism, power distance and long-term orientation) (Hofstede, 1997).
As the behaviour of various groups of young people becomes more alike despite their country of origin, attempts at global segmentation are made. For example, Ford and Philips (2000) distinguished six youth segments common to several European countries (“Dreamers”, “Big Babies”, “Good Kids”, “Independents”, “Searchers” and “No Hopers”). These categories have similar attitudes, congruent ways of using mass media and choose similar brands. Such an orientation is particularly attractive to multi-national companies that frequently treat this cohort as homogenized and globally-oriented (Askegaard, 2006).
Despite the fact that young consumers are considered to be the prototype example of a global segment, some researchers stress that global meanings are mediated by a local cultural context. An example of this approach is Robertson’s concept of glocalization (Robertson, 1992), who believes that what is global, localizes – and what is local, globalizes. A youth global segment therefore emerges in the dialectical process of glocalization (Kjeldgaard and Askegaard, 2006). Young consumers do not have an established identity and are therefore susceptible to the influence of both global and local practices and values. Global and local values can exist side by side and permeate each other to form a new glocal identity (Strizhakova et al., 2012).
2. YOUNG CONSUMERS IN KOREA
The population of South Korea exceeded 50 million in 2012; however, due to a decreasing growth rate, it is expected to drop to 35 million in 2060 (Statistics Korea 2010). In 2010 young people aged 15–29 constituted 20% of the whole population (KOSIS, 2010). They represent a very attractive consumer group due to their increasing purchasing power, trend-setting and changing tastes (Choi and La Ferle, 2004) as well as growing influence on family buying decisions (Na et al., 1998).
Korea underwent a drastic socio-economic change over a fairly short period of time. Traditional values derived from Confucianism (moderation, simplicity and frugality) have been gradually replaced by a consumerist approach. Rapid expansion of consumerism in Korea seems to be of compensatory nature and results from psychological and cultural desire to catch up with other countries (Kim, 2000: 64–65). Koreans are highly motivated to compensate materially for the perceived emptiness and previous deprivation (before and after the Korean War), Koreans aged 15–24 want to get a decent job, cars, have big apartments, expensive clothing, luxury goods and travel (Statisics Korea 2013).
A popular phenomenon in Korea is conspicuous consumption, expressed by purchasing of imported luxury brands. The dominant group of consumers practicing this kind of behaviour are 20–30-year-olds (Park, 2000:49). Young Koreans focus on material issues: they recognize money as a symbol of success and value luxury which lets them show off among their peers (Park et al., 2008; Yoon, 2003; Gluck, 2002). Another factor contributing to the phenomenon of conspicuous consumption may be derived from Confucian culture: the concept of “face” (Redding and Ng, 1983). Koreans are very concerned with maintaining their status and with other people’s perception of them. If their performance falls below a certain level, “face” can be lost. Therefore, they strongly tend to buy goods whose brands and prices match (or preferably improve) their reputation and social position.
The Korean society is characterized by a high level of virtualization, which is reflected by the fact that three out of four major consumer trends in 2011 were related to technology and the Internet (Lee, 2011). Virtualization is supported by the infrastructure: the world’s highest penetration rate for broadband Internet access (almost 40 broadband subscribers per 100 inhabitants, Internet
© Faculty of Management University of Warsaw. All rights reserved. DOI: 10.7172/2449-6634.jmcbem.2015.1.4
Journal of Marketing and Consumer Behaviour in Emerging Markets 1(1)2015
Agnieszka Kacprzak, Katarzyna Dziewanowska
50
(47– 61)
usage rate at 78%), numerous internet cafes and PC bangs (LAN gaming centres), one of the most dynamic communication services industries and one of the fastest growing online retail sector in Asia (Korea Communications Commission, 2012). Young Koreans are heavy users of the Internet (99.9% of people aged 10–29 use the web), social network systems (SNS) and online stores (Minton et al., 2012; Mansumitrchai et al., 2012; Oh et al., 2009). In 2011 89.7% of people in their 20s and 70.8% 30-year-olds used social network systems, mostly blogs (84%), online communities (74.6%) and mini-homepages (68.3%). They are also dominant users of online shopping and banking – the usage rate for 20-year-olds was 90.4% (Korea Communication Commission, 2011). These statistics show that young Koreans actively take advantage of the achievements of the information technology and strongly value social interactions with their peers (KOSIS, 2011). Korea is a highly collectivist country, scoring only 18 out of 100 on the Individualist dimension of Hofstede’s Model of National Cultures (The Hofstede Center, 2013). This means that Koreans prefer a group-oriented way of life and are more prone to comply with social norms and influence of others (Lee and Green, 1991). This tendency is reflected in their higher usage of social media (Minton et al., 2012), and preference for human-human (not: human-message) interactivity (Ko et al., 2006; Shin, 2010).
Issues of ecology and green growth are very important for Koreans. Since 2009 the country has been adopting an ambitious Green Growth Strategy (OECD, 2012). Research (KOSIS, 2012), however, shows low involvement of young people in greening behaviour. In comparison to other age groups, Koreans aged 20–29 participate to a lesser extent in such activities as: recycling (39.2% make a real effort, against a whole population average of 50%), trying not to use disposable products (10.8%; average: 20.9%), or reducing the amount of chemical detergents (10.5%; average: 18.6%). The exception is the use of public transportation (40.7%; average: 35.3%), although that may well be a consequence of their age and financial means.
3. YOUNG CONSUMERS IN POLAND
The population of Poland reached 38.5 million in 2011, with people aged 15–29 constituting a 22% share of the whole. According to one forecast, in 2035 the population will drop to 36 million, and the share of young people to 16% (GUS, 2013). Despite this trend, young people in Poland are a very attractive consumer group because the drop in number does not mean a decrease of value of this segment: the turnover in the youth market is constantly growing due to frequent changes in the product structure and constant shortening of the product life-cycle (Olejniczuk-Merta, 2007).
Young people in Poland are in many ways the opposite of their parents’ generation, and sometimes even older groups, which stems from the fact that they are the first generation raised in a democratic, capitalist country (Kacprzak-Choińska, 2011). Representatives of the young generation place a higher value on education than their parents (enrolment ratio is 4 times greater than in the case of their parents), value interesting work, high income and an exciting life (Szafraniec, 2011a). They are considered to be hedonists, oriented towards obtaining pleasure out of consumption – people focused on themselves, their needs, and their own career (Szafraniec, 2011b).
Over the past two decades, the increase of the level of materialism is clearly visible in Poland. Material success takes the first place among the general values of the society (ahead of health and family) (Sikorska, 1998). Among young people, 44% are of the opinion that possession of material goods is a measure of success in life, and 40% believe that money is the main condition for a successful and happy life (Czapiński and Panek, 2007).
It should be emphasized that young consumers’ aspirations are vast and relate not only to material goods, but also to a lifestyle that gives products symbolic meaning. Products are often used to manifest the good taste and attitudes of their owner, communicate a message or simply

© Faculty of Management University of Warsaw. All rights reserved. DOI: 10.7172/2449-6634.jmcbem.2015.1.4
Journal of Marketing and Consumer Behaviour in Emerging Markets 1(1)2015
Agnieszka Kacprzak, Katarzyna Dziewanowska
51
(47– 61)
allow one to distinguish oneself from the crowd (Szafraniec 2011a). Shopping plays an important role in adolescents’ lives. Of teenagers, 63% frequent shopping malls for pure entertainment (Olejniczuk-Merta, 2007:138). Young Poles often engage in impulsive consumption – every third person acknowledges that they have a tendency to thoughtless spending, and only 20% of people plan their purchases precisely. Shopping also provides a hedonistic value, as evidenced by the fact that 40% of respondents say that they like every kind of shopping (SMG/KRC, 2007).
Computers and access to the internet are becoming increasingly available in Poland. In the first half of 2013 70.1% of households had a computer and 66.9% internet access. Most households use a broadband connection (53.7%) but the share of mobile connections is growing fast (currently 11.7%) (Czapiński and Panek, 2013: 317–319). Young Poles are a social group that uses the internet and information technology most intensively and expertly. 96.8% of 16–24-year-olds own a computer, 96.6% use the internet and 98.1% have a mobile phone (Czapiński and Panek, 2013: 330). Youngsters aged 15–19 spend on average 23 hours per week online and people aged 20–24 spend 21 hours. For both groups the internet is the most important communication medium (World Internet Project. Poland 2012). The internet satisfies tribal needs to a significant extent, which is reflected in the fact that 82% of 18–24-year-old internet users have a profile at a social networking site (CBOS, 2011a). The network enables young people to have an intensive social life, freely express themselves and co-create new cultural content. Although social contacts in the real world cease to be the point of reference and support for the youth, real life meetings with friends and acquaintances are still one of the most important ways of spending free time (The Gallup Organization, 2007; Kurzępa, 2010).
Compared with the general population, young people are less involved in environmental efforts that can bring financial savings, but more likely than adults to engage in meetings regarding environmental issues (Czapiński and Panek, 2013: 289), which suggests that young consumers are driven by a primarily ideological motivation, not a financial one (The Gallup Organization, 2007; CBOS, 2006). According to TNS Polska (2012) the most common eco-friendly activities involve saving energy (90% of students say they do so) and water (85%), and the use of re-usable shopping bags (77%), while the least frequent are purchases of environmentally-friendly products (20%).
4. RESEARCH METHODS
The research hypothesis that is going to be tested is that there is no significant difference between young people from Korea and Poland in terms of attitudes to recent consumer trends as they all belong to the global Generation Y.
The study was conducted on a sample of 100 young consumers from Poland and 100 coming from South Korea. Respondents were in the age range 19–24 and were students of business schools located in large cities (over 2 million inhabitants). The examined persons are drawn from the better-off social classes, able to meet the costs that they have to bear for such studies. The choice of such a group was dictated by the fact that young and wealthy city dwellers are the first to be subject to the new trends related to consumption and marketing. The research tool was a questionnaire developed by Kacprzak-Choińska (2011) containing 36 statements divided into six indices, measuring consumer attitudes towards such modern socio-cultural trends as: materialism, impulsive consumption, greening, virtualization, virtual tribalism, tribalism in real space (see: Table 1). For comparison of young consumers from two different cultural backgrounds, an independent sample t-test, Mann-Whitney nonparametric test as well as a cluster analysis with k-means procedure were performed.
© Faculty of Management University of Warsaw. All rights reserved. DOI: 10.7172/2449-6634.jmcbem.2015.1.4
Journal of Marketing and Consumer Behaviour in Emerging Markets 1(1)2015
Agnieszka Kacprzak, Katarzyna Dziewanowska
52
(47– 61)
Table 1Questionnaire survey results
Mean for Poland
Mean for Korea
P values for Pearsons
chi square test*
MATERIALISM1.2.3.4.
5.
6.
I like to own things that make a good impression on othersI pay great attention to material things owned by other people The brand of clothes I buy is very important to me I pay attention to the brands of clothing and footwear worn by others Possessing large amounts of material goods is one of the most important achievements in life I like luxury
3.562.893.022.94
2.58
3.92
3.832.932.742.71
2.47
2.83
0.1290.0250.3870.167
0.154
0.000
IMPULSIVE CONSUMPTION
7.8.
9.
10.11.
12.
I buy myself things just to feel better I am used to buying something “as a reward” after a hard day at school It sometimes happens that I buy something with money that I should have spent on something else My parents do not realize how much I spend My feeling is that others would be scared if they learned how much and how I shop Going shopping gives me pleasure
2.912.98
3.22
2.972.15
3.49
3.182.93
2.78
2.691.72
3.65
0.0270.138
0.000
0.0010.027
0.001
GREENING13.
14.
15.
16.
17.
18.
It is important to me that any cosmetic I buy was not tested on animals I pay attention to make sure the packaging of any product I buy is not harmful to the environment I am interested in the conditions under which the goods I buy are produced I avoid buying products from companies which I know exploit their employees I would willingly engage in consumer movements in favour of rational and aware consumption I am happy to buy things when profits from their sale support social campaigns, even if they are a bit more expensive than other similar goods
2.62
2.45
2.72
2.94
2.66
3.43
2.88
3.09
3.38
3.47
3.25
3.59
0.050
0.000
0.000
0.012
0.000
0.015
VIRTUALISATION19.20.21.22.
23.24.
I spend my free time at the computer My parents believe that I spend too much time at the computer I cannot imagine life without the Internet When I go on vacation, I feel that I’m missing access to the Internet I often forget about the passage of time when I use the Internet Before I consider a major purchase, I review and compare deals on the Internet
2.802.453.932.57
3.364.01
3.422.543.502.17
2.933.93
0.0020.5110.0160.081
0.0660.209
* The significant p-values are bolded.
© Faculty of Management University of Warsaw. All rights reserved. DOI: 10.7172/2449-6634.jmcbem.2015.1.4
Journal of Marketing and Consumer Behaviour in Emerging Markets 1(1)2015
Agnieszka Kacprzak, Katarzyna Dziewanowska
53
(47– 61)
VIRTUAL TRIBALISM25.
26.27.
28.29.
30.
The Internet has enabled me to get to know people like me who come from different parts of my country and the world I have a hobby that I share with a group of friends I met online I feel that the people I know in real life do not understand me as well as my friends online I have my favourite online message boards I use the Internet more for making new friends than gaining information There are certain topics that I can only talk about with people I have met online
3.24
2.531.55
2.841.79
1.78
3.66
2.511.68
2.911.86
2.18
0.008
0.0210.228
0.0000.522
0.027
TRIBALISM IN REAL SPACE
31.
32.33.34.35.36.
When buying new clothes, the most important thing for me is my friends’ opinionsI often advise other people which product to choose I often go shopping with friends Belonging to a group is very important to me I try to dress like my peers The youth group I identify with can be identified from my appearance
1.93
3.182.903.442.542.86
2.28
3.233.433.402.582.83
0.046
0.7430.0010.6140.9960.010
N = 200, p = 0.05.
5. RESEARCH RESULTS
It was found that three dimensions differ in a statistically significant way: impulsive consumption, greening and tribalism in real space (see: Table 2). The virtualization index measured the degree of dependence on the new technologies and the Internet. The means of both countries were almost identical for this dimension. A significant difference emerged only in the case of the statement “I spend my free time at the computer”, where the mean was 3.42 for Korea and only 2.80 for Poland. As for the variables associated with consumerism, Polish youth presented a slightly higher level of materialism (M = 3.15 for Poland, M = 2.92 for Korea). The largest difference occurred here in the case of the statement “I like luxury”, where the Polish mean was 3.92 and the Korean 2.83. When it comes to the level of impulsive consumption, young consumers from Poland much more frequently admit having this kind of inclination (M = 2.95 for Poland, M = 2.81 for Korea). In the case of green consumer behaviour far greater commitment to this type of matters was demonstrated by the Korean youth (M = 3.27), while the Polish youth (M = 2.80) does not take this factor into consideration while shopping. As far as tribalism is concerned, a statistically significant difference occurred in real space tribalism (M = 2.85 for Korea, M = 2.69 for Poland). In the case of virtual tribalism Korean young consumers tend to agree more than young Poles with the statements that “The Internet has enabled me to get to know people like me who come from different parts of my country and the world” and “There are certain topics that I can only talk about with people I have met online” (see: Table 1).
© Faculty of Management University of Warsaw. All rights reserved. DOI: 10.7172/2449-6634.jmcbem.2015.1.4
Journal of Marketing and Consumer Behaviour in Emerging Markets 1(1)2015
Agnieszka Kacprzak, Katarzyna Dziewanowska
54
(47– 61)
Table 2Results of independent sample t-test and Mann-Whitney U test for six dimensions
t df Sig. Mean Difference
Std. Error Difference
95% Confidence Interval of the Difference
Lower Upper
Materialism 2.509 198 0.013 0.23333 0.09298 0.04998 0.41669
Impulsive consumption* 0.393*
Greening* 0.000*
Virtualisation 1.088 198 0.278 0.10500 0.09648 -0.08526 0.29526
Virtual Tribalism -1.807 198 0.072 -0.17833 0.09870 -0.37297 0.01630
Tribalism in real space -2.506 198 0.013 -0.18571 0.07410 -0.33185 -0.03958
* Due to the results of Levene’s homogeneity of variance test, the Mann-Whitney U test was conducted for these variables.
N = 200, p = 0.05.
Regarding the results of the k-means cluster analysis, the number of segments and the initial cluster centres were adopted from a study by Kacprzak-Choińska (2011). Table 3 represents the final cluster centres for Poland and Korea.
Table 3Final cluster centres for nonhierarchical cluster analysis
Materialists Ecologists Moderns Traditionals NetizensPL KR PL KR PL KR PL KR PL KR
Materialism 3.6 3.6 2.7 2.8 3.5 3.4 2.7 2.8 2.8 2.7
Impulsive consumption 3.2 3.4 2.5 2.5 3.6 4.0 2.2 2.2 2.5 2.4
Greening 2.6 2.6 3,5 3.4 3.5 3.4 2.3 2.2 2.7 2.6
Virtualization 3.1 3.0 3.0 2.9 3.6 3.7 3.0 3.0 3.8 3.8
Virtual tribalism 2.0 2.0 2.1 2.0 2.9 3.2 1.9 1.8 3.0 3.0
Tribalism in real space 2.7 2.6 2.7 2.8 3.2 3.0 2.4 2.4 2.7 2.7
1 – completely disagree, 5 – completely agree.
The five market segments that were distinguished are:1) Materialists. Representatives of this segment display a high level of conspicuous
consumption, impulsive consumption, and attach great importance to the possession of material things. To the greatest extent of all segments they agree with the statement that they like to have things that make an impression on others. They are not interested in issues related to protecting the environment or social responsibility. They exhibit fairly high level of virtualization and tribalism in real space. Opinions of peers are very important to them when making purchasing decisions. To a lesser extent, they engage in participation in virtual tribes.
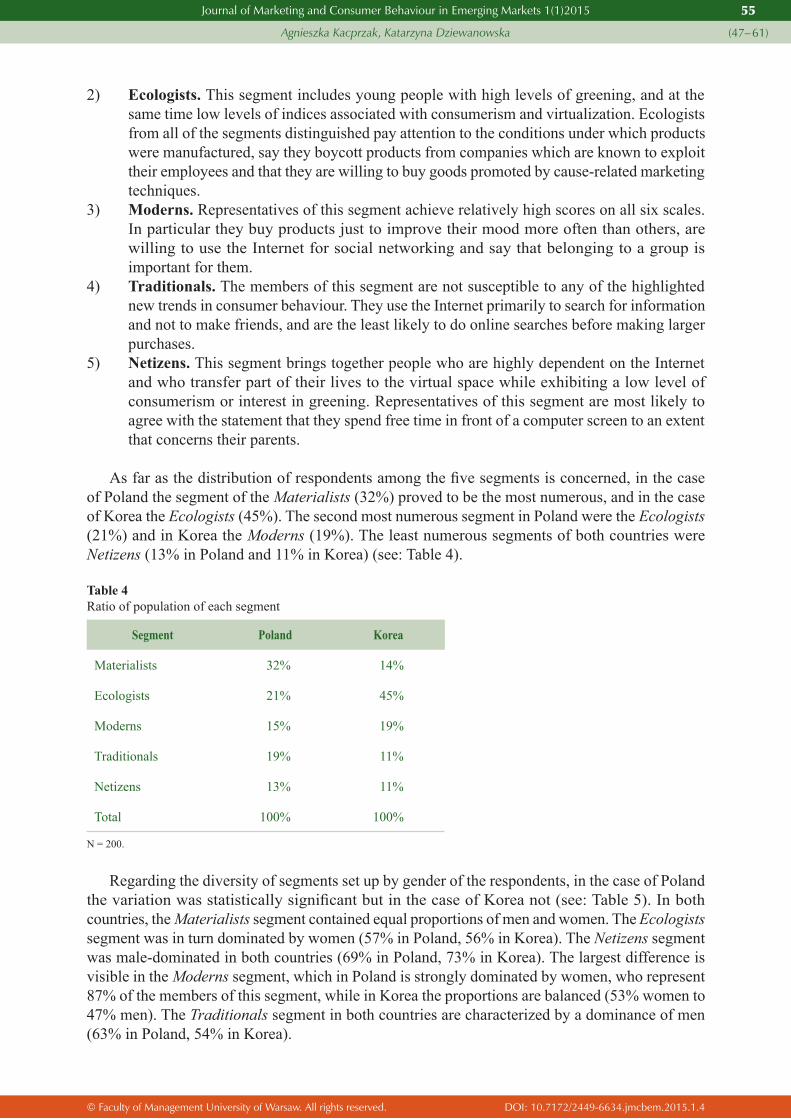
© Faculty of Management University of Warsaw. All rights reserved. DOI: 10.7172/2449-6634.jmcbem.2015.1.4
Journal of Marketing and Consumer Behaviour in Emerging Markets 1(1)2015
Agnieszka Kacprzak, Katarzyna Dziewanowska
55
(47– 61)
2) Ecologists. This segment includes young people with high levels of greening, and at the same time low levels of indices associated with consumerism and virtualization. Ecologists from all of the segments distinguished pay attention to the conditions under which products were manufactured, say they boycott products from companies which are known to exploit their employees and that they are willing to buy goods promoted by cause-related marketing techniques.
3) Moderns. Representatives of this segment achieve relatively high scores on all six scales. In particular they buy products just to improve their mood more often than others, are willing to use the Internet for social networking and say that belonging to a group is important for them.
4) Traditionals. The members of this segment are not susceptible to any of the highlighted new trends in consumer behaviour. They use the Internet primarily to search for information and not to make friends, and are the least likely to do online searches before making larger purchases.
5) Netizens. This segment brings together people who are highly dependent on the Internet and who transfer part of their lives to the virtual space while exhibiting a low level of consumerism or interest in greening. Representatives of this segment are most likely to agree with the statement that they spend free time in front of a computer screen to an extent that concerns their parents.
As far as the distribution of respondents among the five segments is concerned, in the case of Poland the segment of the Materialists (32%) proved to be the most numerous, and in the case of Korea the Ecologists (45%). The second most numerous segment in Poland were the Ecologists (21%) and in Korea the Moderns (19%). The least numerous segments of both countries were Netizens (13% in Poland and 11% in Korea) (see: Table 4).
Table 4Ratio of population of each segment
Segment Poland Korea
Materialists 32% 14%
Ecologists 21% 45%
Moderns 15% 19%
Traditionals 19% 11%
Netizens 13% 11%
Total 100% 100%
N = 200.
Regarding the diversity of segments set up by gender of the respondents, in the case of Poland the variation was statistically significant but in the case of Korea not (see: Table 5). In both countries, the Materialists segment contained equal proportions of men and women. The Ecologists segment was in turn dominated by women (57% in Poland, 56% in Korea). The Netizens segment was male-dominated in both countries (69% in Poland, 73% in Korea). The largest difference is visible in the Moderns segment, which in Poland is strongly dominated by women, who represent 87% of the members of this segment, while in Korea the proportions are balanced (53% women to 47% men). The Traditionals segment in both countries are characterized by a dominance of men (63% in Poland, 54% in Korea).
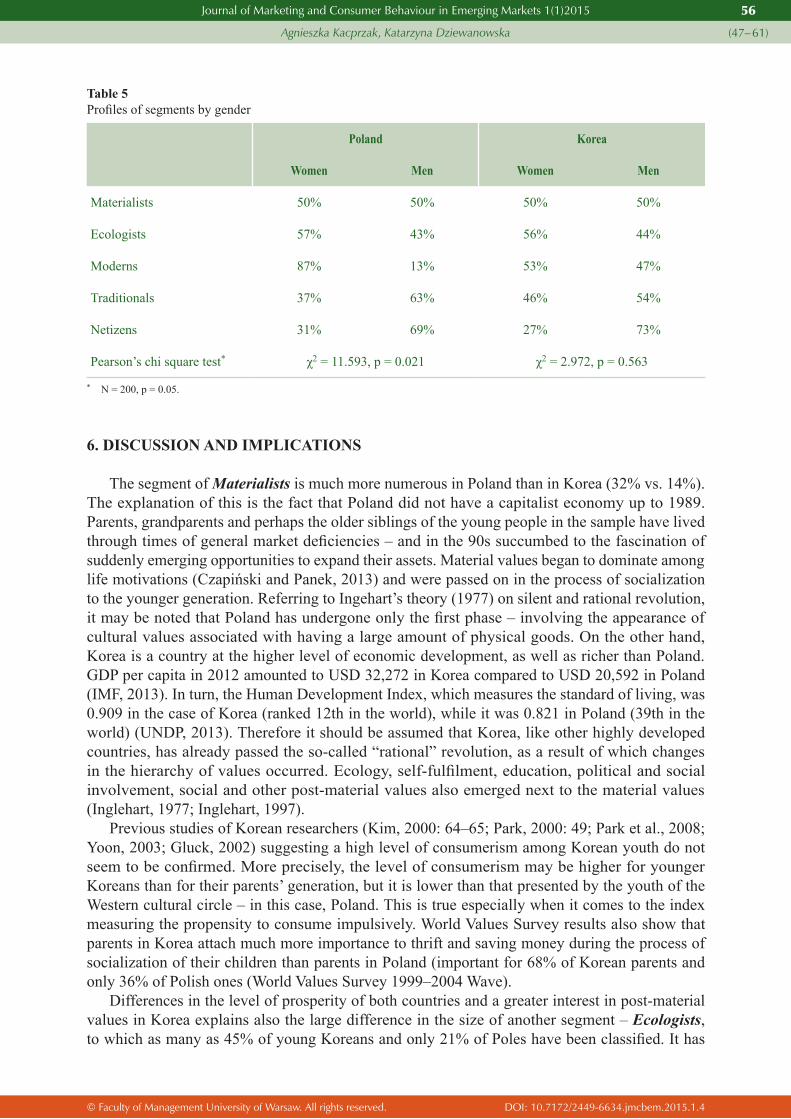
© Faculty of Management University of Warsaw. All rights reserved. DOI: 10.7172/2449-6634.jmcbem.2015.1.4
Journal of Marketing and Consumer Behaviour in Emerging Markets 1(1)2015
Agnieszka Kacprzak, Katarzyna Dziewanowska
56
(47– 61)
Table 5Profiles of segments by gender
Poland Korea
Women Men Women Men
Materialists 50% 50% 50% 50%
Ecologists 57% 43% 56% 44%
Moderns 87% 13% 53% 47%
Traditionals 37% 63% 46% 54%
Netizens 31% 69% 27% 73%
Pearson’s chi square test* χ2 = 11.593, p = 0.021 χ2 = 2.972, p = 0.563
* N = 200, p = 0.05.
6. DISCUSSION AND IMPLICATIONS
The segment of Materialists is much more numerous in Poland than in Korea (32% vs. 14%). The explanation of this is the fact that Poland did not have a capitalist economy up to 1989. Parents, grandparents and perhaps the older siblings of the young people in the sample have lived through times of general market deficiencies – and in the 90s succumbed to the fascination of suddenly emerging opportunities to expand their assets. Material values began to dominate among life motivations (Czapiński and Panek, 2013) and were passed on in the process of socialization to the younger generation. Referring to Ingehart’s theory (1977) on silent and rational revolution, it may be noted that Poland has undergone only the first phase – involving the appearance of cultural values associated with having a large amount of physical goods. On the other hand, Korea is a country at the higher level of economic development, as well as richer than Poland. GDP per capita in 2012 amounted to USD 32,272 in Korea compared to USD 20,592 in Poland (IMF, 2013). In turn, the Human Development Index, which measures the standard of living, was 0.909 in the case of Korea (ranked 12th in the world), while it was 0.821 in Poland (39th in the world) (UNDP, 2013). Therefore it should be assumed that Korea, like other highly developed countries, has already passed the so-called “rational” revolution, as a result of which changes in the hierarchy of values occurred. Ecology, self-fulfilment, education, political and social involvement, social and other post-material values also emerged next to the material values (Inglehart, 1977; Inglehart, 1997).
Previous studies of Korean researchers (Kim, 2000: 64–65; Park, 2000: 49; Park et al., 2008; Yoon, 2003; Gluck, 2002) suggesting a high level of consumerism among Korean youth do not seem to be confirmed. More precisely, the level of consumerism may be higher for younger Koreans than for their parents’ generation, but it is lower than that presented by the youth of the Western cultural circle – in this case, Poland. This is true especially when it comes to the index measuring the propensity to consume impulsively. World Values Survey results also show that parents in Korea attach much more importance to thrift and saving money during the process of socialization of their children than parents in Poland (important for 68% of Korean parents and only 36% of Polish ones (World Values Survey 1999–2004 Wave).
Differences in the level of prosperity of both countries and a greater interest in post-material values in Korea explains also the large difference in the size of another segment – Ecologists, to which as many as 45% of young Koreans and only 21% of Poles have been classified. It has

© Faculty of Management University of Warsaw. All rights reserved. DOI: 10.7172/2449-6634.jmcbem.2015.1.4
Journal of Marketing and Consumer Behaviour in Emerging Markets 1(1)2015
Agnieszka Kacprzak, Katarzyna Dziewanowska
57
(47– 61)
to be mentioned that Korea remains under the influence of Confucianism, Buddhism and Taoism (Scarborough, 1998: 73), which highlight the importance of living in harmony with nature. Poland belongs to a Christian culture, for which the message is rather “subdue the Earth”. According to Hofstede’s research, Korean culture is more feminine than Polish (39 points on a scale of masculinity compared to 69) (The Hofstede Center, 2013), and thus attaches greater importance to caring for others and quality of life than the competition and achieving goals.
Korean studies cited above (KOSIS, 2012; Kim and Choi, 2013) indicate lower interest in environmental issues among young Koreans than older generations. In Poland, the situation is reversed (young consumers are more aware of the problems associated with environmental protection and social responsibility). Even so, the intercultural difference in this case appears to act more strongly than the fact that they belong to the same generation. Young Korean consumers achieve significantly higher scores on a scale measuring green consumer behaviour than their Polish counterparts.
In Poland, a greater number of young consumers belong to the segment of Traditionals than Moderns (19% vs. 15%), while in Korea the situation is reversed and 19% of young people are counted as Moderns and only 11% as Traditionals. This fact is associated with a higher score achieved by young Koreans on scales related to tribalism in virtual and real space. According to Trompenaars’ research (Hampden-Turner and Trompenaars, 1993) Korea has a collectivist culture. This is confirmed by the results of Hofstede, according to which Korea scores only 18 points out of 100 on the individualism scale. Poland’s result is 60, which places this country in the group of cultures where the independence of individuals seems more important (The Hofstede Center, 2013). Collective societies tend in a natural way to be more susceptible to tribal behaviour. While searching for information about products, young Koreans are highly reliant on opinions of their peers, which is consistent with previous studies of Hafstrom et al. (1992) and Choi and La Ferla (2004) which suggested a higher tendency to conform with peers among Koreans than among Western youth. According to Hall’s theory (1976), Korea is classified as a high-context culture. In such a culture, conformism, the common good and deep relations among members of the group are most valued (Kim et al., 1998). Research shows that Poland is characterized by a lower level of social orientation (M = 3.06 on a scale of 1–5) than Korea (M = 3.37), which is the result of different levels of cultural context (Hensel, 2011).
Regarding the last segment – the Netizens – numbers are similar in both of the groups surveyed, which is probably associated with the lack of any statistically significant difference in the level of virtualization. It can be assumed, therefore, that the widespread use of new technologies, ease of following technical innovations and willingness to transfer social life, entertainment, work and shopping to the virtual world are characteristic features that bond Generation Y on a global scale (Tapscott, 2008).
According to Clark (1990), there are two main approaches to international marketing: etic and emic. The former focuses on similarities while the other one concentrates on differences among cultures. It is reflected in the theory of cross-cultural management providing three different approaches towards other cultures, which in turn influence managerial decisions. An ethnocentric approach assumes that cultures of foreign countries are inferior to the culture of a manager’s home country. Therefore, management methods should be exported as products. According to a polycentric approach, all countries are different and difficult to understand and because of that foreign branches of a company should be allowed to adapt their activities and operations to local conditions and consumer preferences. The last approach, global, acknowledges both similarities and differences among cultures and uses the best management practices regardless of their country of origin (Perlmutter and Heenan, 1986).
When it comes to designing products, services and marketing campaigns targeted at young people worldwide, it seems that an ethnocentric approach will operate best mainly in the case of the new technologies sector. In turn, the Internet should be considered as a compulsory
© Faculty of Management University of Warsaw. All rights reserved. DOI: 10.7172/2449-6634.jmcbem.2015.1.4
Journal of Marketing and Consumer Behaviour in Emerging Markets 1(1)2015
Agnieszka Kacprzak, Katarzyna Dziewanowska
58
(47– 61)
communication channel while planning a promotion strategy. Our research shows that except for virtualization the other important values, attitudes, norms and beliefs remain different in countries from various cultural circles represented here by South Korea and Poland. Thus a global or polycentric approach to marketing products and services addressed to young consumers is still needed.
Economic or political unification does not have to imply the standardization of culture. Frequent contacts with representatives of other cultures can foster an appreciation of own culture as an equivalent to the foreign ones. The words of Huntington (1998), who believes that the so-called “global culture” is just a thin layer covering a vast variety of values, norms, traditions and attitudes shaped by history, still seem to remain true.
7. LIMITATIONS AND FUTURE RESEARCH
Although the present study provides some interesting insights for researchers and practitioners, some limitations of the findings should, however, be mentioned. There are three major limitations and implications derived from them for further research. First, during the study, the judgmental sampling method was adopted, thus, the results cannot be generalized to the general youth population. It is suggested, therefore, that a probability-sampling method be used in future research. Secondly, the study is of cross-sectional nature and thus it does not identify customers’ attitudes over time. A longitudinal study could, therefore, further broaden understanding of the research phenomenon and allow observation of changes in the sizes of segments of young consumers. The third limitation results from the nature of psychographic research. Respondents are asked about their personal issues relating to self-image and their answers may be influenced by their need for social acceptance. In order to overcome this limitation, more extended research comparing attitudes and actual actions is recommended.
As for the directions for future research, in looking for an answer to the question of whether a young global consumer exists, it would be interesting to conduct a study with the same tools but in countries with different cultural backgrounds. Finally, behavioural studies should be conducted in order to find product or brand preferences among consumers from a particular segment. This could provide guidance for the marketing decisions of companies targeting their offer at young consumers.
References
Alden, D., Steenkamp, J.-B. and Batra, R. (1999) “Brand Positioning Through Advertising in Asia, North America and Europe: The Role of Global Consumer Culture”, Journal of Marketing, 63 (1), pp. 75–87.
Archrpru Akaka, M. and Alden, D. (2010) “Global brand positioning and perceptions. International advertising ang global consumer culture”, International Journal of Advertising, 29 (1), pp. 37–56.
Arnett, J. (2002) “The Psychology of Globalization”, American Psychologist, 57(10), pp. 774–783.Arnould, E.J. and Thompson, C.J. (2005) “Consumer Culture Theory (CCT): Twenty Years of Research”, Journal
of Consumer Research, 31 (4), pp. 868–882.Askegaard, S. (2006) “Brands as a Global Ideoscape”, in J. Schroeder and M. Salzer-Mörling (Eds.), Brand Culture
(pp. 91–101), London: Routledge Press.AudioTech Inc. (2012) “Understanding the Millennial Consumer”, Trends Magazine, 113, pp. 5–9.Bauman, Z. (1998) Globalizacja, Warszawa: PIW.Bucic, T., Harris, J. and Arli, D. (2012) “Ethical Consumers Among the Millennials: A Cross-National Study”,
Journal of Business Ethics, 110 (1), pp. 113–131.CBOS – Public Opinion Research Center (2006) Postawy wobec środowiska naturalnego. Komunikat z badań,
Warszawa, Poland: CBOS.CBOS – Public Opinion Research Center (2011a) Korzystanie z Internetu. Komunikat z badań, Warszawa, Poland:
CBOS.

© Faculty of Management University of Warsaw. All rights reserved. DOI: 10.7172/2449-6634.jmcbem.2015.1.4
Journal of Marketing and Consumer Behaviour in Emerging Markets 1(1)2015
Agnieszka Kacprzak, Katarzyna Dziewanowska
59
(47– 61)
CBOS – Public Opinion Research Center (2011b) Zachowania proekologiczne Polaków. Komunikat z badań, Warszawa, Poland: CBOS.
Choi, S. and La Ferle, C. (2004) “Convergence across American and Korean young adults:socialisation variables indicate the verdict is still out”, International Journal of Advertising, 23 (4), pp. 479–506.
Clark, T. (1990) “International Marketing and National Character: A Review and Proposal for Integrative Theory”, Journal of Marketing, 54 (4), pp. 66–79.
Czapiński, J. and Panek, T. (2007) Diagnoza społeczna 2007. Warunki i jakość życia Polaków, Warszawa, Poland: Rada Monitoringu Społecznego.
Czapiński, J. and Panek, T. (2013) Diagnoza społeczna 2013. Warunki i jakość życia Polaków, Warszawa, Poland: Rada Monitoringu Społecznego.
Domzal, T. and Kernan, J. (1993) “Mirror, mirror: Some Postmodern Reflections on Global Advertising”, Journal of Advertising, 22 (4), pp. 1–20.
Douglas, S. and Craig, S. (2011) “Covergence and Divergence: Developing a Semiglobal Marketing Strategy”, Journal of International Marketing, 19 (1), pp. 82–101.
Evans, M., Jamal, A. and Foxall, G. (2006) Consumer Behaviour, Chichester: Wiley.Ford, R. and Phillips, A. (2000) “Media may be global, but is youth?”, in J. Jones (Ed.) International Advertising:
Realities and Myths (pp. 117–137), Thousand Oaks, CA: Sage.Gluck, C. (2002) “Asia dances to chic Korea”, The Times, 18 April 2002, p. 54.Guo, X. (2013) “Living in a Global World: Influence of Consumer Global Orientation on Attitudes Toward Global
Brands from Developed versus Emerging Countries”, Journal of International Marketing, 21 (1), pp. 1–22.GUS – Polish Central Statistical Office (2013) Narodowy Spis Powszechny Ludności i Mieszkań 2011, Warszawa:
Główny Urząd Statystyczny.Hafstrom, J., Chae, J. and Chung, Y. (1992) “Consumer decision-making styles: comparison between United States
and Korean young consumers”, Journal of Consumer Affairs, 26 (1), pp. 146–158.Hall, E. (1976) Beyond Culture, New York: Anchor Press.Hampden-Turner, C. and Trompenaars, A. (1993) The Seven Cultures of Capitalism, New York: Doubleday Business.Hensel, P. (2011) “Management in high-and low-context cultures – Poland and Korea in the light of empirical
research”, in A. Nowak, B. Glinka and P. Hensel (Eds.), Economy, society and managing (pp. 32–40), Warszawa: Wydawnictwo Naukowe Wydziału Zarządzania UW.
Hofstede, G. (1997) Cultures and Organizations: Software of the Mind, New York: McGraw-Hill.Holt, D., Quelch, J. and Taylor, E. (2004) “How Global Brands Compete”, Harvard Business Review, 82 (9),
pp. 68–76.Huntington, S. (1998) The Clash of Civilizations and the Remaking of World Order,New York: Simonand Shuster.IMF (2013) World Economic Outlook Database, IMF. Retrieved 05.11.2013 from http://www.imf.org/external/pubs/
ft/weo/2013/01/weodata/weorept.aspx?sy=2012andey=2012andssm=1andssd=1andsort=countryandds=.andbr=1andc=512%2C666%2C914%2C668%2C612%2C672%2C614%2C946%2C311%2C137%2C213%2C962%2C911%2C674%2C193%2C676%2C122%2C548%2C912%2C556%2C313%2C678%2C4.
Inglehart, R. (1977) The silent revolution. Changing values and political styles among western publicis, Princeton: Princeton University Press.
Inglehart, R. (1997) Modernization and Postmodernization: Cultural, Economic and Political Change in 43 Societies, Princeton: Princeton University Press.
Kacprzak-Choińska, A. (2011) “Segmenting the Polish teenager market by sociocultural variables”, Journal of Customer Behaviour, 10 (2), pp. 161–180.
Kim, D., Pan, Y. and Park, H. (1998) “High- Versus Low-Context Culture: A Comparison of Chinese, Korean, and American Cultures”, Psychology and Marketing, 6 (15), pp. 507–521.
Kim, S.-K. (2000) „Changing Lifestyles and Consumption Patterns of South Korean Middle Class and New Generations”, in B.H. Chua (Ed.), Consumption in Asia: Lifestyles and Identities (pp. 61–81), New York: Routledge.
Kjeldgaard, D. and Askegaard, S. (2006) “The Glocalization of Youth Culture: The Global Youth Segment as Structures of Common Differences”, Journal of Consumer Research, 33 (1), pp. 231–247.
Ko, H., Roberts, M. and Cho, C. (2006) “Cross-Cultural Differences in Motivations and Perceived Interactivity: A Comparative Study of American and Korean Internet Users”, Journal of Current Issues on Research in Advertising, 28 (2), pp. 93–104.
Korea Communication Commission (2011) Survey on Internet Usage 2011, Korea: Korea Communication Commission. Retrieved 11.10.2013 from http://isis.kisa.or.kr.
Korea Communications Commission (2012) Annual Report 2012, Korea: Korea Communication Commission. Retrieved 11.10.2013 from http://eng.kcc.go.kr/user.do?mode=viewandpage=E02020000anddc=E02020000andboardId=1053andcp=1andboardSeq=37445.
KOSIS – Korean Statistical Information Service (2010) Population Census, Korea: KOSIS. Retrieved 11.10.2013 from http://kosis.kr/eng/database/database_001000.jsp?listid=Aandsubtitle=Population/Household.

© Faculty of Management University of Warsaw. All rights reserved. DOI: 10.7172/2449-6634.jmcbem.2015.1.4
Journal of Marketing and Consumer Behaviour in Emerging Markets 1(1)2015
Agnieszka Kacprzak, Katarzyna Dziewanowska
60
(47– 61)
KOSIS – Korean Statistical Information Service (2011) Culture and Leisure, Korea: KOSIS. Retrieved 11.10.2013 from http://kosis.kr/eng/database/database_001000.jsp?listid=Z.
KOSIS – Korean Statistical Information Service (2012) Environment, Korea: KOSIS. Retrieved 11.10.2013 from http://kosis.kr/eng/database.
Kurzępa, J. (2010) Raport Fanty Pokolenie nadziei, czyli współczesny nastolatek, sprawy, które są dla niego ważne, i świat, w którym się obraca, Wrocław: SWPS and Coca Cola Poland.
Lee, C. and Green, R. (1991) “Cross-Cultural Examination of the Fishbein Behavioral Intentions Model”, Journal of International Business Studies, 22 (2), pp. 289–305.
Lee, D.-H. (2011) “Smart, Social, Slow, Sell: Four Korean Consumer Trends for 2011”, SERI Quarterly, 4 (1), pp. 98–102.
Mansumitrchai, S., Park, C.-H. and Chiu, C. L. (2012) “Factors underlying the Adoption of Social Network: A Study of Facebook Users in South Korea”, International Journal of Business and Management, 7 (24), pp. 138–153.
Melosik, Z. (2005) „Młodzież a przemiany kultury współczesnej”, in R. Leppert, Z. Melosik and B. Wojtasik (Eds.), Młodzież wobec (nie)gościnnej przyszłości (pp. 13–31), Wrocław: Wydawnictwo Naukowe Dolnośląskiej Szkoły Wyższej Edukacji.
Minton, E., Lee, C., Orth, U., Kim, C. and Kahle, L. (2012) “Sustainable Marketing and Social Media. A Cross Country Analysis of Motives for Sustainable Behaviors”, Journal of Advertising, 41 (4), pp. 69–84.
Na, W., Son, Y. and Marshall, R. (1998) “An empirical study of the purchase role structure in Korean families”, Psychology and Marketing, 15 (6), pp. 563–576.
Nijssen, E. and Douglas, S. (2011) “Consumer World- Mindedness and Attitudes Toward Product Positioning in Advertising: An Examination of Global Versus Foreign Versus Local Positioning”, Journal of International Marketing, 19 (3), pp. 113–133.
OECD (2012) OECD Economic Surveys: Korea 2012, Retrieved 16.11.2013 from http://www.oecd.org/eco/ 50191444.pdf.
Oh, S.H., Kim, Y.M., Lee, C.W., Shim, G.Y., Park, M.S. and Jung, H.S. (2009) “Consumer Adoption of Virtual Stores in Korea: Focusing on the Role of Trust and Playfulness”, Psychology and Marketing, 26 (7), pp. 652–688.
Olejniczuk-Merta, A. (2007) Rynki młodych konsumentów w nowych krajach Unii Europejskiej, Warszawa: PWE.Park, H., Rabolt, N. and Jeon, K. (2008) “Purchasing global luxury brands among young Korean consumers”,
Journal of Fashion Marketing and Management, 12 (2), pp. 244–259.Park, S. (2000) “Consumers in their twenties are the main target of expensive foreign luxury brands”, Chosun-Ilbo,
9 May 2000, p. 49.Perlmutter, H. and Heenan, D. (1986) “Cooperate to Compete Globally”, Harvard Business Review, 64 (2),
pp. 136–152.Redding, S. and Ng, M. (1983) “The role of “face” in the organizational perceptions of Chinese managers”,
International Studies of Management and Organization, 13 (3), pp. 92–123.Robertson, R. (1992) Globalization: Social Theory and Global Culture, London: Sage.Scarborough, J. (1998) The Origin of Cultural Differences and Their Impact on Management, Westport: Quorum
Books.Shin, D. (2010) “Analysis of online social networks: a cross-national study”, Online Information Review, 34 (3),
pp. 473–495.Sikorska, J. (1998) Konsumpcja. Warunki, zróżnicowania, strategie,Warszawa: Wydawnictwo IFiS PAN.SMG/KRC (2007) Target Group Index for consumers born in 1989, Warszawa: SMG/KRC. Solomon, M. (2013) Consumer Behavior. Buying, having, and being, Edinburgh Gate: Pearson Education.Statistics Korea (2013) Statistics on the Youth 2013, Korea: Statistics Korea. Retrieved 11.11.2013 from http://kostat.
go.kr/portal/english/news/1/20/2/index.board.Statistics Korea (2010) Population projections for Korea: 2010-2060, Korea: Statistics Korea. Retrieved 11.11.2013
from http://kostat.go.kr/portal/english/news/1/17/1/index.board?bmode=readandbSeq=andaSeq=273109andpageNo=1androwNum=10andnavCount=10andcurrPg=andsTarget=titleandsTxt=.
Stizhakova, Y., Coulter, R. and Price, L. (2008) “Branded Products as a Passport to Global Citizenship: Perspectives from Developed and Developing Countries”, Journal of International Marketing, 16 (4), pp. 57–85.
Strizhakova, Y., Coulter, R. and Price, L. (2012) “The young adult cohort in emerging markets: Assesing their glocal cultural identity in a global marketplace”, International Journal of Research in Marketing, 29 (1), pp. 43–54.
Szafraniec, K. (2011a) Młodzi 2011, Warszawa: Kancelaria Prezesa Rady Ministrów.Szafraniec, K. (2011b) “Orientacje życiowe uczącej się młodzieży”, in K. Szafraniec (Ed.), Młodzież jako problem
i jako wyzwanie ponowoczesności, Toruń: Wydawnictwo Adam Marszałek.Tapscott, D. (2008) Grown Up Digital: How the Net Generation is Changing Your World, New York: McGraw-Hill.The Gallup Organization (2007) Young Europeans. A survey among young people aged between 15–30 in European
Union, European Commission. Retrieved 20.01.2014 from http://ec.europa.eu/public_opinion/flash/fl_202_en.pdf.
© Faculty of Management University of Warsaw. All rights reserved. DOI: 10.7172/2449-6634.jmcbem.2015.1.4
Journal of Marketing and Consumer Behaviour in Emerging Markets 1(1)2015
Agnieszka Kacprzak, Katarzyna Dziewanowska
61
(47– 61)
The Hofstede Center (2013) Poland, The Hofstede Center. Retrieved 13.11.2013 from http://geert-hofstede.com/poland.html.
TNS Polska (2012) Młodzi 2012 o ekologii i odpowiedzialności społecznej biznesu, Warszawa: TNS Polska.UNDP (2013) Human Development Report 2012, New York: UNDP.UOKiK – Polish Office of Competition and Consumer Protection (2004). Reklama a konsument, Warszawa: UOKiK.Venter, H. and Venter, E. (2010) “Globalization and the Psychology of the New World Citizen: How the New Global
Citizen Comperes to Maslow’s Level of Self-Transcendence”, International Journal of Interdiciplinary Social Sciences, 5 (6), pp. 29–35.
Walker, C. (1996) “Can TV Save the Planet?”, American Demographics, 18 (5), pp. 42–49.Woodward, I., Skrbis, Z. and Bean, C. (2008) “Attitudes Towards Globalization and Cosmpolitanism: Cultural
Diversity, Persoanl Consumption and the National Economy”, The British Journal of Sociology, 59 (2), pp. 207–226.
World Internet Project. Poland (2012) Word Internet Project 2012. Raport wersja polska, Warszawa: Gazeta Wyborcza. Retrieved 15.01.2014 from http://bi.gazeta.pl/im/6/13883/m13883466,WORLD-IINTERNET-PROJECT-2012-RAPORT-WERSJA-POLSKA.pdf.
World Values Survey (2004) World Values Survey 1999–2004 Wave, World Values Survey. Retrieved 12.06.2013 from http://www.wvsevsdb.com/wvs/WVSAnalizeIndex.jsp.
Yoon, K. (2003) The great changes in Korean lifestyle, LG Ad. Retrieved 15.11.2014 from http://www.lgad.co.kr/webzine/030102/study/study3.htm.
© Faculty of Management University of Warsaw. All rights reserved. DOI: 10.7172/2449-6634.jmcbem.2015.1.5
Journal of Marketing and Consumer Behaviour in Emerging Markets 1(1)2015
Michael C. Handrinos, Dimitrios Folinas, Konstantinos Rotsios
62
(62–74)
Using the SERVQUAL model to evaluate the quality of services for a farm school store
Michael C. HandrinosCentre for Business in Society
Coventry University, UKE-mail: [email protected]
Dimitrios FolinasDepartment of Logistics, ATEI Thessaloniki
Thessaloniki, GreeceE-mail: [email protected]
Konstantinos RotsiosPerrotis College
The American Farm School of ThessalonikiE-mail: Greece – [email protected]
Received: 31.01.2014 / Revised: 30.03.2015 / Accepted: 14.04. 2015 / Published online: 30.04.2015
ABSTRACT
The main objective of this paper is to present and analyse the findings of research which aims to measure the services that a locally-based SME (Small-Medium Enterprise) campus store of a farm school provides to its customers. The examined start-up store is operated by the College students in the context of their entrepreneurship, business and marketing classes. After one year of operation students decided to evaluate the quality of the store’s services and measure the customers’ satisfaction by applying the well-known SERVQUAL model. The deployment of the model revealed at first the importance of the store know-how to measure services from the consumers’ perspective so as to better understand their needs. Secondly, the findings of the research highlighted ‘Security’, ‘Reliability’ and ‘Empathy’ as the most significant dimensions. The findings of this research can help small and medium enterprises to improve the services they provide to their customers by focusing on these three important dimensions.
JEL classification: M300, M310, M390, M000
Keywords: Quality of services, SME store, SERVQUAL, farm school, service provision improvement
1. INTRODUCTION
In recent years several models have been applied for evaluating the quality of services provided by companies. One popular approach has been the analysis of gaps (Gaps Analysis), which simply ‘counts’ the distance between the desired level of provided services that customers expect and
© Faculty of Management University of Warsaw. All rights reserved. DOI: 10.7172/2449-6634.jmcbem.2015.1.5
Journal of Marketing and Consumer Behaviour in Emerging Markets 1(1)2015
Michael C. Handrinos, Dimitrios Folinas, Konstantinos Rotsios
63
(62–74)
what they ultimately receive. Based on that model Parasuraman, Zeithaml and Berry (1985 and 1990), presented the SERVQUAL model (abbreviation of the words Service and Quality) for measuring the quality of services. In particular, this model is a gauge of how customers perceive a company’s quality of service when they receive it.
This measurement is achieved through a comparison between customers’ expectations for how they should be provided a service and what they ultimately obtain. Usually, for the description of the five determinants of the model twenty-two variables are used and the respondents are asked to state, usually on a five-class scale from ‘Not Important’ (1) to ‘Very Important’ (5), what they are expecting from a service and how that service is perceived. Based on the variations between the expectations and the experiences of customers for the quality of a service, for these twenty-two variables, a final score is then calculated for the quality of service.
The SERVQUAL model has been characterized by its creators as a simple and comprehensive multi-dimensional measuring scale that has good reliability and validity in its results. The authors argue that it can be applied to a large and diverse number of services and commercial enterprises.
At the same time this model has been criticized by some academics and practitioners (Cronin and Taylor, 1992; Babakus and Boller, 1992; Brown et al., 1993; Rust and Oliver, 1994; Dabholkar, Thorpe and Rentz, 1996). In particular, when the SERVQUAL model is used in various business sectors such as hospitals, fast-food companies and cleaners, its results showed that there may be a span of one to eight dimensions of service, depending on the type of business or industry considered. This indicates that the SERVQUAL model may not always be applicable to companies of different sectors in the same manner. Nevertheless, one could argue that as expectations and perceptions of customers are very important to assess the quality of services, the SERVQUAL model can be used to measure how customers perceive the quality of those services.
The main theme of this work will be to determine the level of service quality provided to its customers by the Perrotis College-American Farm School (AFS) Campus Store (known as the AFS Campus Store). For this reason, a number of its customers were interviewed using a questionnaire which was based on the SERVQUAL model. Research focused on investigating how customers evaluated the services they received. The sample was 84 customers that were given the SERVQUAL questionnaire.
2. LITERATURE REVIEW
Many studies have been focused on the deployment of the SERVQUAL model into key business sectors during the last decade. SERVQUAL seems to be a trustworthy and reliable tool for decision even today. Recent studies in the health (Ajam, 2014; Khamis and Njau, 2014; Papanikolaou and Zygiaris, 2014; Wongrukmit, P. and Thawesaengskulthai, N., 2014; Anbari, Mohammadi and Taheri, 2014), education (Mansori, Vaz and Ismail, 2014; Zareinejad, 2014; May and Viljoen, 2014; van Schalkwyk and Steenkamp, 2014), and banking (Panda, and Kondasani, 2014; Ali et. al, 2014; Choudhury, 2014; Ryglová, Vajčnerová and Šácha, 2013) sectors confirm this.
On the contrary, limited research efforts are concentrated on measuring the quality of services in the agribusiness sector. In general, von Freymann and Cuffe (2010) suggested that store pricing, store formats, and shopping enjoyment may mitigate ongoing choice.
It is widely accepted that quality means different things to different people. In recent years, a lot of attention has been given to service quality and the ways consumer satisfaction and perceived quality of services can be measured. Many models on service quality have been developed and proposed by researchers.
As Grönroos (1984) suggests, it is important to understand how consumers perceive the quality of services in order to successfully design advertising and marketing strategies. Service
© Faculty of Management University of Warsaw. All rights reserved. DOI: 10.7172/2449-6634.jmcbem.2015.1.5
Journal of Marketing and Consumer Behaviour in Emerging Markets 1(1)2015
Michael C. Handrinos, Dimitrios Folinas, Konstantinos Rotsios
64
(62–74)
companies should strive to minimize the gap between the expected service and the perceived service. According to the same researcher, functional quality is a very important component of the perceived service. Functional quality refers to “how” the consumer receives the service whereas “technical quality” refers to “what” the consumer receives.
Brogowicz et al. (1990) have proposed another service quality model with three distinct components: a) company image, b) external influences and c) traditional marketing activities which influence the technical as well as the functional service quality expectations. In addition, Haywood-Farmer’s (1988) model on service quality includes physical facilities, processes and procedures, the personal behaviour of the service providers as well as their professional judgment.
According to the findings of Spreng and Mackoy (1996), service quality and satisfaction are distinct. Meeting customers’ expectations is not enough; what matters is meeting their desires.
The findings should encourage service-focused small businesses not currently doing so to consider putting quality measurements in place to guide the satisfaction-revenue connection. In specific sectors a small number of research efforts have been found (Table 1):
Table 1
Authors Year Business Domain Findings
Evanschitzky, Iyer and Caemmerer
2008 Agribusiness / Retail
• Consumer satisfaction with retail stores has 6 key dimensions
• The dimensions of retail satisfaction have a greater effect on overall satisfaction than SERVQUAL dimensions
Wilson, Hall and Fields
2011 Agribusiness / Local farm cooperative stores
• Younger patrons and homeowners are likely to deem customer service and personal interaction important
• Customers who consider appearance and accessibility as important are college graduates and persons dependent on farming
• Older patrons and wildlife enthusiasts are likely to view the policies and reliability as important factors of service quality
Tey et al. 2014 Agribusiness / Hotel, restaurant, and catering
• While most service quality factors were insignificant, “responsiveness” in terms of providing delivery services had a statistically significant positive impact on HORECA’s contractual arrangement with their current suppliers
• These findings imply that the service quality is being seen as a supplement; economic factors (e.g., prices and their stability, credit term) are likely to be the key drivers affecting buyer-seller relationships
Our work marks a departure from this literature by assessing the SERVQUAL model to evaluate the quality of services of a store. It is a locally-based SME campus store of a farm school providing food products and specific services to its customers. The key research hypothesis is: “H1: For an SME campus store the ‘Security’ and ‘Empathy’ dimensions are the key contributors to the quality evaluation of the provided services”.
3. RESEARCH METHODOLOGY, PLANNING AND FINDINGS
The purpose of this study is to measure the quality of the in-store services provided by the AFS Campus Store. In order to collect the required data a questionnaire was developed based on the SERVQUAL model, which refers to the evaluation of the quality of service. The questionnaire includes a total of eighty (80) questions; out of these, seventy-seven (77) are closed-ended
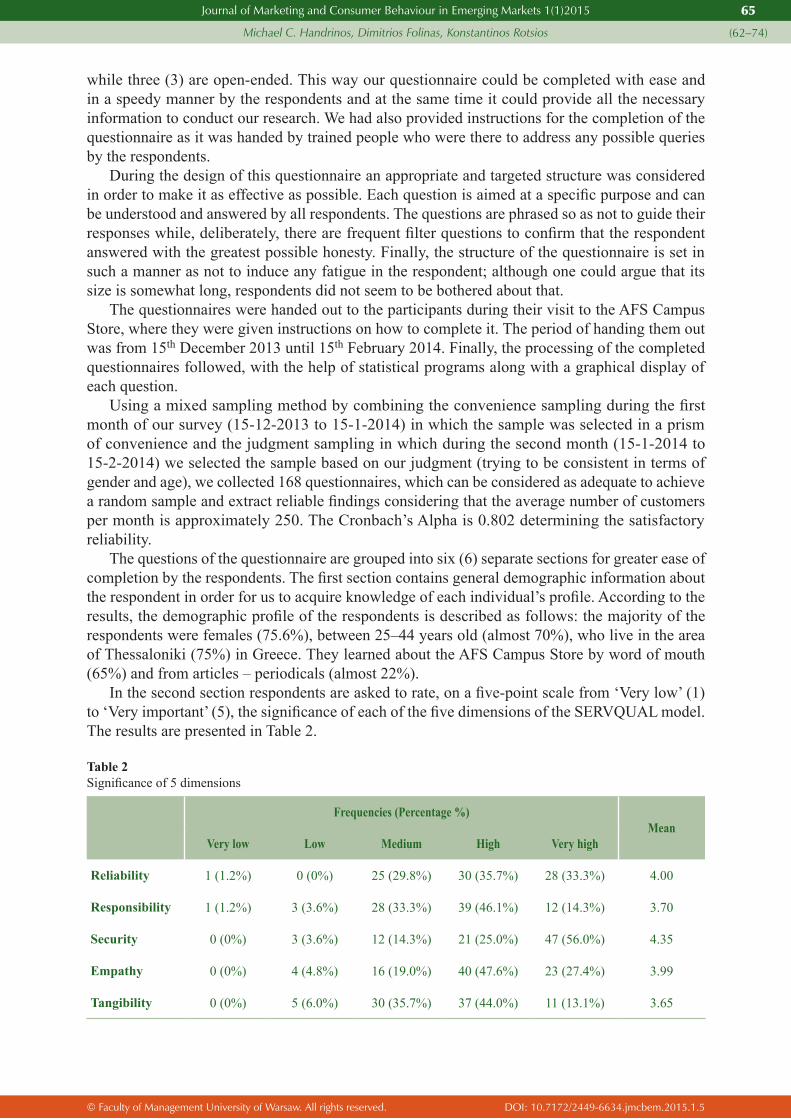
© Faculty of Management University of Warsaw. All rights reserved. DOI: 10.7172/2449-6634.jmcbem.2015.1.5
Journal of Marketing and Consumer Behaviour in Emerging Markets 1(1)2015
Michael C. Handrinos, Dimitrios Folinas, Konstantinos Rotsios
65
(62–74)
while three (3) are open-ended. This way our questionnaire could be completed with ease and in a speedy manner by the respondents and at the same time it could provide all the necessary information to conduct our research. We had also provided instructions for the completion of the questionnaire as it was handed by trained people who were there to address any possible queries by the respondents.
During the design of this questionnaire an appropriate and targeted structure was considered in order to make it as effective as possible. Each question is aimed at a specific purpose and can be understood and answered by all respondents. The questions are phrased so as not to guide their responses while, deliberately, there are frequent filter questions to confirm that the respondent answered with the greatest possible honesty. Finally, the structure of the questionnaire is set in such a manner as not to induce any fatigue in the respondent; although one could argue that its size is somewhat long, respondents did not seem to be bothered about that.
The questionnaires were handed out to the participants during their visit to the AFS Campus Store, where they were given instructions on how to complete it. The period of handing them out was from 15th December 2013 until 15th February 2014. Finally, the processing of the completed questionnaires followed, with the help of statistical programs along with a graphical display of each question.
Using a mixed sampling method by combining the convenience sampling during the first month of our survey (15-12-2013 to 15-1-2014) in which the sample was selected in a prism of convenience and the judgment sampling in which during the second month (15-1-2014 to 15-2-2014) we selected the sample based on our judgment (trying to be consistent in terms of gender and age), we collected 168 questionnaires, which can be considered as adequate to achieve a random sample and extract reliable findings considering that the average number of customers per month is approximately 250. The Cronbach’s Alpha is 0.802 determining the satisfactory reliability.
The questions of the questionnaire are grouped into six (6) separate sections for greater ease of completion by the respondents. The first section contains general demographic information about the respondent in order for us to acquire knowledge of each individual’s profile. According to the results, the demographic profile of the respondents is described as follows: the majority of the respondents were females (75.6%), between 25–44 years old (almost 70%), who live in the area of Thessaloniki (75%) in Greece. They learned about the AFS Campus Store by word of mouth (65%) and from articles – periodicals (almost 22%).
In the second section respondents are asked to rate, on a five-point scale from ‘Very low’ (1) to ‘Very important’ (5), the significance of each of the five dimensions of the SERVQUAL model. The results are presented in Table 2.
Table 2Significance of 5 dimensions
Frequencies (Percentage %)Mean
Very low Low Medium High Very high
Reliability 1 (1.2%) 0 (0%) 25 (29.8%) 30 (35.7%) 28 (33.3%) 4.00
Responsibility 1 (1.2%) 3 (3.6%) 28 (33.3%) 39 (46.1%) 12 (14.3%) 3.70
Security 0 (0%) 3 (3.6%) 12 (14.3%) 21 (25.0%) 47 (56.0%) 4.35
Empathy 0 (0%) 4 (4.8%) 16 (19.0%) 40 (47.6%) 23 (27.4%) 3.99
Tangibility 0 (0%) 5 (6.0%) 30 (35.7%) 37 (44.0%) 11 (13.1%) 3.65
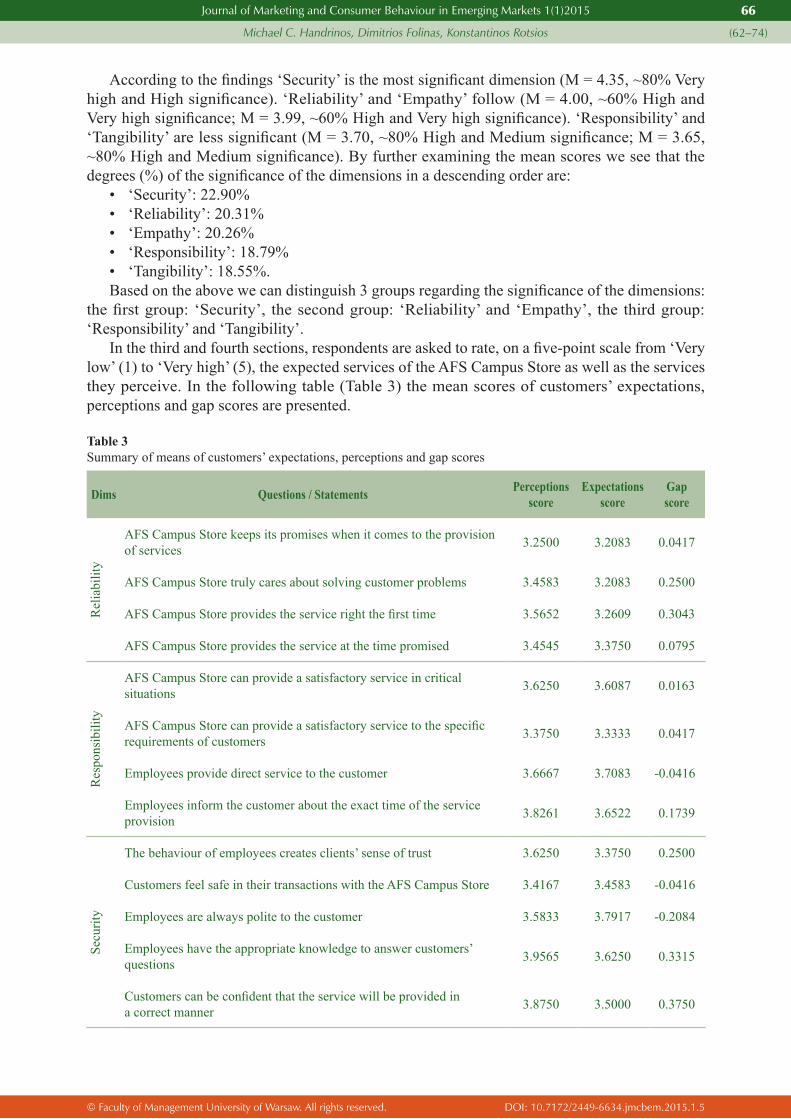
© Faculty of Management University of Warsaw. All rights reserved. DOI: 10.7172/2449-6634.jmcbem.2015.1.5
Journal of Marketing and Consumer Behaviour in Emerging Markets 1(1)2015
Michael C. Handrinos, Dimitrios Folinas, Konstantinos Rotsios
66
(62–74)
According to the findings ‘Security’ is the most significant dimension (M = 4.35, ~80% Very high and High significance). ‘Reliability’ and ‘Empathy’ follow (M = 4.00, ~60% High and Very high significance; M = 3.99, ~60% High and Very high significance). ‘Responsibility’ and ‘Tangibility’ are less significant (M = 3.70, ~80% High and Medium significance; M = 3.65, ~80% High and Medium significance). By further examining the mean scores we see that the degrees (%) of the significance of the dimensions in a descending order are:
• ‘Security’: 22.90%• ‘Reliability’: 20.31%• ‘Empathy’: 20.26%• ‘Responsibility’: 18.79%• ‘Tangibility’: 18.55%.Based on the above we can distinguish 3 groups regarding the significance of the dimensions:
the first group: ‘Security’, the second group: ‘Reliability’ and ‘Empathy’, the third group: ‘Responsibility’ and ‘Tangibility’.
In the third and fourth sections, respondents are asked to rate, on a five-point scale from ‘Very low’ (1) to ‘Very high’ (5), the expected services of the AFS Campus Store as well as the services they perceive. In the following table (Table 3) the mean scores of customers’ expectations, perceptions and gap scores are presented.
Table 3Summary of means of customers’ expectations, perceptions and gap scores
Dims Questions / Statements Perceptionsscore
Expectations score
Gap score
Rel
iabi
lity
AFS Campus Store keeps its promises when it comes to the provision of services 3.2500 3.2083 0.0417
AFS Campus Store truly cares about solving customer problems 3.4583 3.2083 0.2500
AFS Campus Store provides the service right the first time 3.5652 3.2609 0.3043
AFS Campus Store provides the service at the time promised 3.4545 3.3750 0.0795
Res
pons
ibili
ty
AFS Campus Store can provide a satisfactory service in critical situations 3.6250 3.6087 0.0163
AFS Campus Store can provide a satisfactory service to the specific requirements of customers 3.3750 3.3333 0.0417
Employees provide direct service to the customer 3.6667 3.7083 -0.0416
Employees inform the customer about the exact time of the service provision 3.8261 3.6522 0.1739
Secu
rity
The behaviour of employees creates clients’ sense of trust 3.6250 3.3750 0.2500
Customers feel safe in their transactions with the AFS Campus Store 3.4167 3.4583 -0.0416
Employees are always polite to the customer 3.5833 3.7917 -0.2084
Employees have the appropriate knowledge to answer customers’ questions 3.9565 3.6250 0.3315
Customers can be confident that the service will be provided in a correct manner 3.8750 3.5000 0.3750
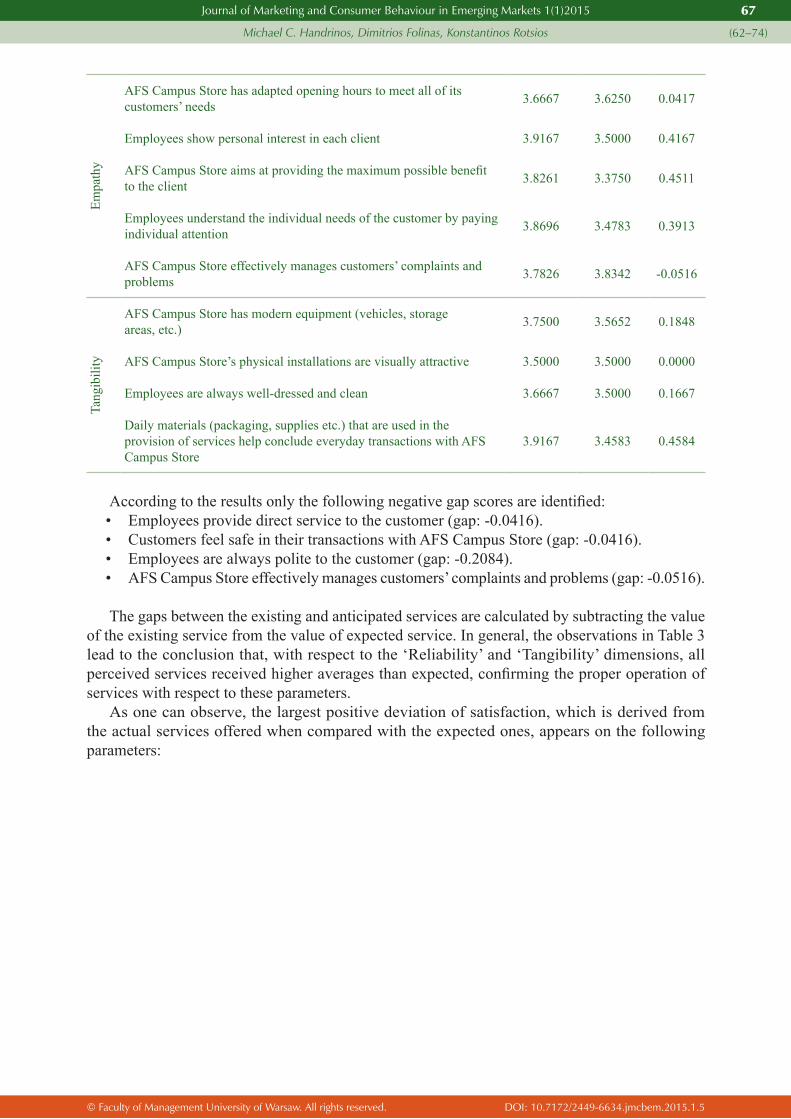
© Faculty of Management University of Warsaw. All rights reserved. DOI: 10.7172/2449-6634.jmcbem.2015.1.5
Journal of Marketing and Consumer Behaviour in Emerging Markets 1(1)2015
Michael C. Handrinos, Dimitrios Folinas, Konstantinos Rotsios
67
(62–74)
Empa
thy
AFS Campus Store has adapted opening hours to meet all of its customers’ needs 3.6667 3.6250 0.0417
Employees show personal interest in each client 3.9167 3.5000 0.4167
AFS Campus Store aims at providing the maximum possible benefit to the client 3.8261 3.3750 0.4511
Employees understand the individual needs of the customer by paying individual attention 3.8696 3.4783 0.3913
AFS Campus Store effectively manages customers’ complaints and problems 3.7826 3.8342 -0.0516
Tang
ibili
ty
AFS Campus Store has modern equipment (vehicles, storage areas, etc.) 3.7500 3.5652 0.1848
AFS Campus Store’s physical installations are visually attractive 3.5000 3.5000 0.0000
Employees are always well-dressed and clean 3.6667 3.5000 0.1667
Daily materials (packaging, supplies etc.) that are used in the provision of services help conclude everyday transactions with AFS Campus Store
3.9167 3.4583 0.4584
According to the results only the following negative gap scores are identified:• Employees provide direct service to the customer (gap: -0.0416).• Customers feel safe in their transactions with AFS Campus Store (gap: -0.0416).• Employees are always polite to the customer (gap: -0.2084).• AFS Campus Store effectively manages customers’ complaints and problems (gap: -0.0516).
The gaps between the existing and anticipated services are calculated by subtracting the value of the existing service from the value of expected service. In general, the observations in Table 3 lead to the conclusion that, with respect to the ‘Reliability’ and ‘Tangibility’ dimensions, all perceived services received higher averages than expected, confirming the proper operation of services with respect to these parameters.
As one can observe, the largest positive deviation of satisfaction, which is derived from the actual services offered when compared with the expected ones, appears on the following parameters:
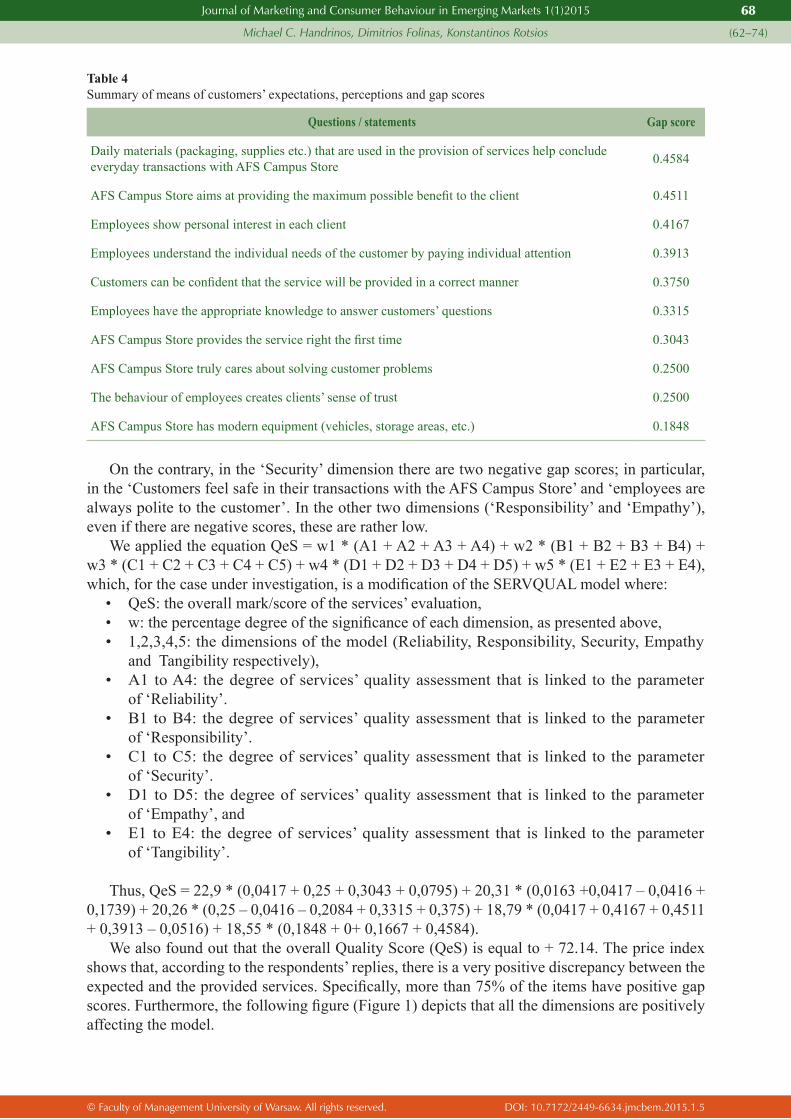
© Faculty of Management University of Warsaw. All rights reserved. DOI: 10.7172/2449-6634.jmcbem.2015.1.5
Journal of Marketing and Consumer Behaviour in Emerging Markets 1(1)2015
Michael C. Handrinos, Dimitrios Folinas, Konstantinos Rotsios
68
(62–74)
Table 4Summary of means of customers’ expectations, perceptions and gap scores
Questions / statements Gap score
Daily materials (packaging, supplies etc.) that are used in the provision of services help conclude everyday transactions with AFS Campus Store 0.4584
AFS Campus Store aims at providing the maximum possible benefit to the client 0.4511
Employees show personal interest in each client 0.4167
Employees understand the individual needs of the customer by paying individual attention 0.3913
Customers can be confident that the service will be provided in a correct manner 0.3750
Employees have the appropriate knowledge to answer customers’ questions 0.3315
AFS Campus Store provides the service right the first time 0.3043
AFS Campus Store truly cares about solving customer problems 0.2500
The behaviour of employees creates clients’ sense of trust 0.2500
AFS Campus Store has modern equipment (vehicles, storage areas, etc.) 0.1848
On the contrary, in the ‘Security’ dimension there are two negative gap scores; in particular, in the ‘Customers feel safe in their transactions with the AFS Campus Store’ and ‘employees are always polite to the customer’. In the other two dimensions (‘Responsibility’ and ‘Empathy’), even if there are negative scores, these are rather low.
We applied the equation QeS = w1 * (A1 + A2 + A3 + A4) + w2 * (B1 + B2 + B3 + B4) + w3 * (C1 + C2 + C3 + C4 + C5) + w4 * (D1 + D2 + D3 + D4 + D5) + w5 * (Ε1 + Ε2 + Ε3 + Ε4), which, for the case under investigation, is a modification of the SERVQUAL model where:
• QeS: the overall mark/score of the services’ evaluation,• w: the percentage degree of the significance of each dimension, as presented above,• 1,2,3,4,5: the dimensions of the model (Reliability, Responsibility, Security, Empathy
and Tangibility respectively),• Α1 to Α4: the degree of services’ quality assessment that is linked to the parameter
of ‘Reliability’.• Β1 to Β4: the degree of services’ quality assessment that is linked to the parameter
of ‘Responsibility’.• C1 to C5: the degree of services’ quality assessment that is linked to the parameter
of ‘Security’.• D1 to D5: the degree of services’ quality assessment that is linked to the parameter
of ‘Empathy’, and• Ε1 to Ε4: the degree of services’ quality assessment that is linked to the parameter
of ‘Tangibility’.
Thus, QeS = 22,9 * (0,0417 + 0,25 + 0,3043 + 0,0795) + 20,31 * (0,0163 +0,0417 – 0,0416 + 0,1739) + 20,26 * (0,25 – 0,0416 – 0,2084 + 0,3315 + 0,375) + 18,79 * (0,0417 + 0,4167 + 0,4511 + 0,3913 – 0,0516) + 18,55 * (0,1848 + 0+ 0,1667 + 0,4584).
We also found out that the overall Quality Score (QeS) is equal to + 72.14. The price index shows that, according to the respondents’ replies, there is a very positive discrepancy between the expected and the provided services. Specifically, more than 75% of the items have positive gap scores. Furthermore, the following figure (Figure 1) depicts that all the dimensions are positively affecting the model.
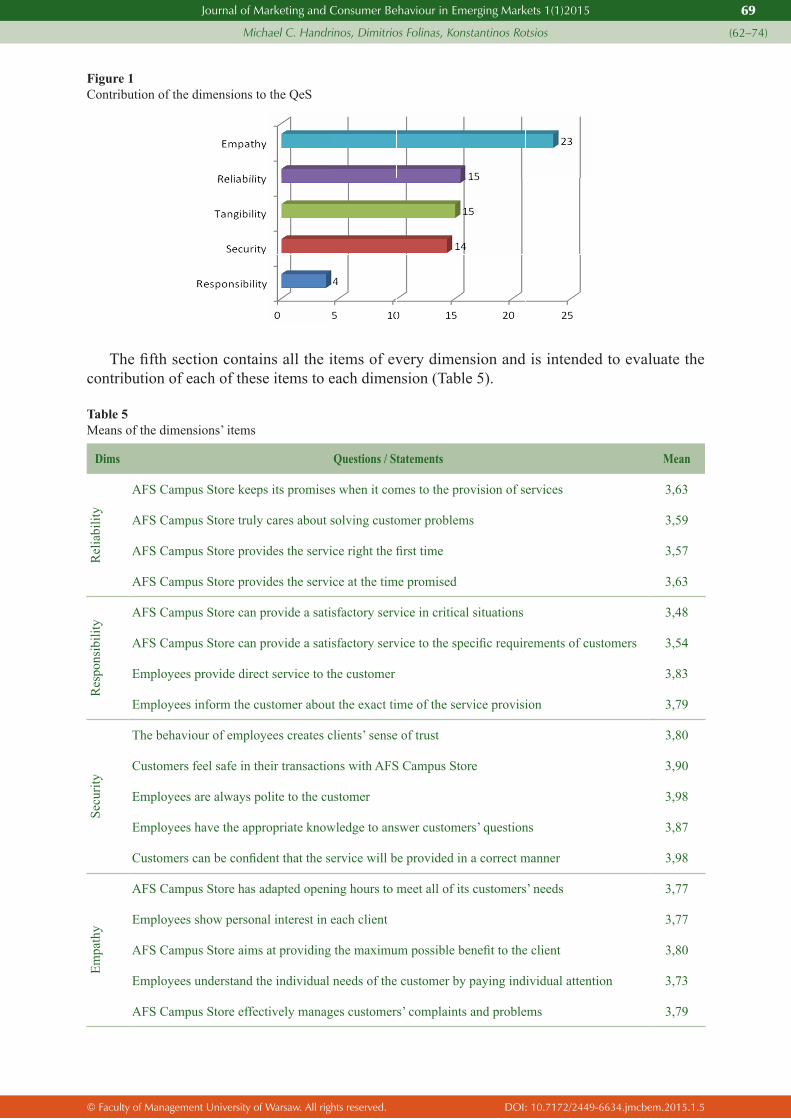
© Faculty of Management University of Warsaw. All rights reserved. DOI: 10.7172/2449-6634.jmcbem.2015.1.5
Journal of Marketing and Consumer Behaviour in Emerging Markets 1(1)2015
Michael C. Handrinos, Dimitrios Folinas, Konstantinos Rotsios
69
(62–74)
Figure 1Contribution of the dimensions to the QeS
The fifth section contains all the each of these Table 4. Dims
Another aspect investigated is the assessment of the the Table 5: Relevant contribution of each dimension to the total evaluation
The fifth section contains all the each of these items
Table 4. Means of the dimensions’ itemsDims Questions / Statements
Rel
iabi
lity
AFS Campus Store
AFS Campus Store
AFS Campus Store
AFS Campus Store
Res
pons
ibili
ty
AFS AFS customers
Employees
Employees inform the customer about the exact time of the service provision
Secu
rity
TheCustomersEmployees areEmployeesCustomers can
Em
path
y
AFS Campus StoreEmployees AFS EmployeesAFS Campus Store
Tan
gibi
lity AFS
AFS Employees are always wellDaily materials (packaging, supplies etc.) that are used in the provision of services help conclude
Another aspect investigated is the assessment of the examined dimensions. The
Table 5: Relevant contribution of each dimension to the total evaluation
The fifth section contains all the items to each dimension (Table 4)
Means of the dimensions’ itemsQuestions / StatementsAFS Campus Store
AFS Campus Store
AFS Campus Store
AFS Campus Store
AFS Campus StoreAFS Campus Storecustomers
Employees provide
Employees inform the customer about the exact time of the service provision
The behaviour Customers feel Employees are Employees have the appropriate knowledgeCustomers can AFS Campus StoreEmployees showAFS Campus StoreEmployees understand theAFS Campus StoreAFS Campus StoreAFS Campus Store’Employees are always wellDaily materials (packaging, supplies etc.) that are used in the provision of services help conclude everyday transactions with
Another aspect investigated is the assessment of the dimensions. The
Table 5: Relevant contribution of each dimension to the total evaluation
The fifth section contains all the itemsto each dimension (Table 4)
Means of the dimensions’ itemsQuestions / Statements AFS Campus Store keeps it
AFS Campus Store truly cares
AFS Campus Store provides the service
AFS Campus Store provides the service
Campus Store can provide Campus Store can provide a satisfactory
provide direct service to the customer
Employees inform the customer about the exact time of the service provision
of employees safe in their always polite
have the appropriate knowledge be confident
AFS Campus Store has adaptedshow personal interest in
Store aims at providing the maximumunderstand the individual
AFS Campus Store effectively managesCampus Store has modern equipment Campus Store’s physical instal
Employees are always well-Daily materials (packaging, supplies etc.) that are used in the provision of services help
everyday transactions with
Another aspect investigated is the assessment of the dimensions. The relevant
Table 5: Relevant contribution of each dimension to the total evaluation
items of every dimension to each dimension (Table 4).
Means of the dimensions’ items
keeps its promises when it comes to the provision of services
cares about solving
provides the service
provides the service
can provide a satisfactorycan provide a satisfactory
service to the customer
Employees inform the customer about the exact time of the service provision
of employees creates clients’ safe in their transactions
polite to the customerhave the appropriate knowledge
be confident that the service will be providedadapted opening hours
personal interest in eachat providing the maximum
individual needseffectively manageshas modern equipment
physical installations are visually attractive-dressed and
Daily materials (packaging, supplies etc.) that are used in the provision of services help everyday transactions with AFS Campus Store
Another aspect investigated is the assessment of the relevant contribution of each
Table 5: Relevant contribution of each dimension to the total evaluation
6
of every dimension
promises when it comes to the provision of services
solving customer problems
provides the service right the first
provides the service at the time promised
satisfactory servicecan provide a satisfactory service
service to the customer
Employees inform the customer about the exact time of the service provision
clients’ sense of trusttransactions with AFS Campus Storeto the customer
have the appropriate knowledge to answerservice will be provided
opening hours to meet alleach client
at providing the maximumneeds of the customer
effectively manages customers’ has modern equipment (vehicles
lations are visually attractivedressed and clean
Daily materials (packaging, supplies etc.) that are used in the provision of services help AFS Campus Store
Another aspect investigated is the assessment of the importance that contribution of each
Table 5: Relevant contribution of each dimension to the total evaluation
of every dimension and is intended to evaluate the contribution of
promises when it comes to the provision of services
customer problems
the first time
promised
service in critical service to the specific
Employees inform the customer about the exact time of the service provision
sense of trust Campus Store
to answer customers’service will be provided in a
to meet all of its customers’ needs
at providing the maximum possible benefit to the clientof the customer by paying individual
customers’ complaints and problems(vehicles, storage areas
lations are visually attractive
Daily materials (packaging, supplies etc.) that are used in the provision of services help AFS Campus Store
importance that respondents contribution of each dimension
Table 5: Relevant contribution of each dimension to the total evaluation
and is intended to evaluate the contribution of
promises when it comes to the provision of services
customer problems
situations to the specific requirements
Employees inform the customer about the exact time of the service provision
Campus Store
customers’ questions in a correct manner
of its customers’ needs
benefit to the clientpaying individualand problems
storage areas, etc.) lations are visually attractive
Daily materials (packaging, supplies etc.) that are used in the provision of services help
respondents were dimension is presented in Table
Table 5: Relevant contribution of each dimension to the total evaluation
and is intended to evaluate the contribution of
promises when it comes to the provision of services
requirements
Employees inform the customer about the exact time of the service provision
correct manner
of its customers’ needs
benefit to the client paying individual attentionand problems
Daily materials (packaging, supplies etc.) that are used in the provision of services help
were giving onpresented in Table 5
and is intended to evaluate the contribution of
Mean 3,63
3,59
3,57
3,63 3,48
of 3,54
3,83
3,79 3,80 3,90 3,98 3,87 3,98 3,77 3,77 3,80
attention 3,73 3,79 3,61 3,63 3,73
Daily materials (packaging, supplies etc.) that are used in the provision of services help 3,70
ing on the items5.
and is intended to evaluate the contribution of
items of
The fifth section contains all the items of every dimension and is intended to evaluate the contribution of each of these items to each dimension (Table 5).
Table 5Means of the dimensions’ items
Dims Questions / Statements Mean
Rel
iabi
lity
AFS Campus Store keeps its promises when it comes to the provision of services 3,63
AFS Campus Store truly cares about solving customer problems 3,59
AFS Campus Store provides the service right the first time 3,57
AFS Campus Store provides the service at the time promised 3,63
Res
pons
ibili
ty
AFS Campus Store can provide a satisfactory service in critical situations 3,48
AFS Campus Store can provide a satisfactory service to the specific requirements of customers 3,54
Employees provide direct service to the customer 3,83
Employees inform the customer about the exact time of the service provision 3,79
Secu
rity
The behaviour of employees creates clients’ sense of trust 3,80
Customers feel safe in their transactions with AFS Campus Store 3,90
Employees are always polite to the customer 3,98
Employees have the appropriate knowledge to answer customers’ questions 3,87
Customers can be confident that the service will be provided in a correct manner 3,98
Empa
thy
AFS Campus Store has adapted opening hours to meet all of its customers’ needs 3,77
Employees show personal interest in each client 3,77
AFS Campus Store aims at providing the maximum possible benefit to the client 3,80
Employees understand the individual needs of the customer by paying individual attention 3,73
AFS Campus Store effectively manages customers’ complaints and problems 3,79

© Faculty of Management University of Warsaw. All rights reserved. DOI: 10.7172/2449-6634.jmcbem.2015.1.5
Journal of Marketing and Consumer Behaviour in Emerging Markets 1(1)2015
Michael C. Handrinos, Dimitrios Folinas, Konstantinos Rotsios
70
(62–74)
Tang
ibili
tyAFS Campus Store has modern equipment (vehicles, storage areas, etc.) 3,61
AFS Campus Store’s physical installations are visually attractive 3,63
Employees are always well-dressed and clean 3,73
Daily materials (packaging, supplies etc.) that are used in the provision of services help conclude everyday transactions with AFS Campus Store 3,70
Another aspect investigated is the assessment of the importance that respondents were giving on the items of the examined dimensions. The relevant contribution of each dimension is presented in Table 6.
Table 6Relevant contribution of each dimension to the total evaluation
Dimension Contribution %
Reliability 18 %
Responsibility 18 %
Security 24 %
Empathy 23 %
Tangibility 18 %
The analysis showed that there is a differentiation between the perceptions of respondents about the importance of the dimensions and in the results obtained from the ServQual evaluation. As shown in Figure 2, although the differences are small, respondents felt that ‘Reliability’, ‘Responsibility’ and ‘Tangibility’ were less important than they actually are; conversely, they overestimate the contribution of the ‘Security’ and ‘Empathy’ dimensions.
Figure 2Differences in the relative contribution between the perception of customers and the ServQual evaluation
DimensionReliabilityResponsibilitySecurityEmpTangibility The analysis showed importance of2, although thwere less importantand Figure 2. Differences in evaluation
Finally, the sixth section is an attempt by respondents to evaluate the significance of the Store’s actions which will further improve the quality of Table 5. Significance of the actions of the management of ActionsFocus on customer needsFocus on staff trainingFocus on bidirectional communication Flexibility in the execution of services that are based on the needs and problems of customers Regarding the significance of the actions of its services 4. ConclusionsBased on the findings of our surveyresearch efforts and the managerial implications. 4.1 Discussion of the A series of(1999)future use of SERSERVQUAL is applicable to contexts close to its original setting. a reliable measure of service quality or, indeed, whether it is measuringcontrary to all opposite claims, providers in the search for consumer data (JiangOne of the most SERVQUAL as an specific companies and industries.
Dimension Reliability Responsibility Security Empathy Tangibility
The analysis showed importance of the
although the were less importantand ‘Empathy’
Figure 2. Differences in evaluation
Finally, the sixth section is an attempt by respondents to evaluate the significance of the Store’s actions which will further improve the quality of
Table 5. Significance of the actions of the management of Actions Focus on customer needsFocus on staff trainingFocus on bidirectional communication Flexibility in the execution of services that are based on the needs and problems of customers
egarding the significance of the actions of its services, respondents felt that
ConclusionsBased on the findings of our surveyresearch efforts and the managerial implications.
4.1 Discussion of the A series of researchers have questioned the reliability and validity of the SERVQUAL scale. Robinson (1999), in his analysis of measuring service quality, believes thatfuture use of SERSERVQUAL is applicable to contexts close to its original setting. a reliable measure of service quality or, indeed, whether it is measuringcontrary to all opposite claims, providers in the search for consumer data (JiangOne of the most SERVQUAL as an specific companies and industries.
The analysis showed that there isthe dimensionse differences are small
were less important than they ’ dimensions
Figure 2. Differences in the relative contribution
Finally, the sixth section is an attempt by respondents to evaluate the significance of the Store’s actions which will further improve the quality of
Table 5. Significance of the actions of the management of
Focus on customer needs Focus on staff training Focus on bidirectional communication Flexibility in the execution of services that are based on the needs and problems of customers
egarding the significance of the actions of respondents felt that
Conclusions Based on the findings of our surveyresearch efforts and the managerial implications.
4.1 Discussion of the Findingsresearchers have questioned the reliability and validity of the SERVQUAL scale. Robinson
in his analysis of measuring service quality, believes thatfuture use of SERVQUAL as a means for measuring service quality. At best it can be argued that SERVQUAL is applicable to contexts close to its original setting. a reliable measure of service quality or, indeed, whether it is measuringcontrary to all opposite claims, providers in the search for consumer data (JiangOne of the most important and SERVQUAL as an “off-thespecific companies and industries.
Contribution % 1818 %24 %23 %18 %
that there is dimensions and in the
differences are smallthey actually
dimensions.
the relative contribution
Finally, the sixth section is an attempt by respondents to evaluate the significance of the Store’s actions which will further improve the quality of
Table 5. Significance of the actions of the management of
Focus on bidirectional communication between theFlexibility in the execution of services that are based on the needs and problems of customers
egarding the significance of the actions of respondents felt that all the above
Based on the findings of our survey, research efforts and the managerial implications.
indings researchers have questioned the reliability and validity of the SERVQUAL scale. Robinson
in his analysis of measuring service quality, believes thatVQUAL as a means for measuring service quality. At best it can be argued that
SERVQUAL is applicable to contexts close to its original setting. a reliable measure of service quality or, indeed, whether it is measuringcontrary to all opposite claims, SERVQUAL has maintained its position as a pioneering tool used by service providers in the search for consumer data (Jiang
important and immediate implicationthe-shelf” measure of perceived service quality. Much refinement is needed for
specific companies and industries. As one could suggest,
Contribution % 18 % 18 % 24 % 23 % 18 %
a differentiationin the results
differences are small, respondents felt actually are; conversely,
the relative contribution
Finally, the sixth section is an attempt by respondents to evaluate the significance of the Store’s actions which will further improve the quality of
Table 5. Significance of the actions of the management of
between the company and customersFlexibility in the execution of services that are based on the needs and problems of customers
egarding the significance of the actions of AFS all the above-mentioned
in this section we discuss the findings by comparing them with similar research efforts and the managerial implications.
researchers have questioned the reliability and validity of the SERVQUAL scale. Robinson in his analysis of measuring service quality, believes that
VQUAL as a means for measuring service quality. At best it can be argued that SERVQUAL is applicable to contexts close to its original setting. a reliable measure of service quality or, indeed, whether it is measuring
SERVQUAL has maintained its position as a pioneering tool used by service providers in the search for consumer data (Jiang
immediate implicationmeasure of perceived service quality. Much refinement is needed for As one could suggest,
7
Contribution %
a differentiation between the perceptions of respondents about the obtained from the
, respondents felt that ‘Reliability’, ‘Responsibility’conversely, they
the relative contribution between
Finally, the sixth section is an attempt by respondents to evaluate the significance of the Store’s actions which will further improve the quality of services provided to them in the future.
Table 5. Significance of the actions of the management of AFS
company and customersFlexibility in the execution of services that are based on the needs and problems of customers
AFS Campus Storementioned ones
in this section we discuss the findings by comparing them with similar research efforts and the managerial implications.
researchers have questioned the reliability and validity of the SERVQUAL scale. Robinson in his analysis of measuring service quality, believes that
VQUAL as a means for measuring service quality. At best it can be argued that SERVQUAL is applicable to contexts close to its original setting. a reliable measure of service quality or, indeed, whether it is measuring
SERVQUAL has maintained its position as a pioneering tool used by service et al., 2000; Lam
immediate implications in our researchmeasure of perceived service quality. Much refinement is needed for As one could suggest,
between the perceptions of respondents about the obtained from the ServQual evaluation
that ‘Reliability’, ‘Responsibility’they overestimate the contribution of
between the perception of customers and the ServQual
Finally, the sixth section is an attempt by respondents to evaluate the significance of the services provided to them in the future.
AFS Campus Store
company and customers Flexibility in the execution of services that are based on the needs and problems of customers
Campus Store that are expected to improve the quality of ones are important
in this section we discuss the findings by comparing them with similar
researchers have questioned the reliability and validity of the SERVQUAL scale. Robinson in his analysis of measuring service quality, believes that “Serious doubt must be raised over the
VQUAL as a means for measuring service quality. At best it can be argued that SERVQUAL is applicable to contexts close to its original setting. It is questionable whether SERVQUAL is a reliable measure of service quality or, indeed, whether it is measuring
SERVQUAL has maintained its position as a pioneering tool used by service 2000; Lam et al.s in our research
measure of perceived service quality. Much refinement is needed for As one could suggest, further rese
between the perceptions of respondents about the ServQual evaluation
that ‘Reliability’, ‘Responsibility’overestimate the contribution of
the perception of customers and the ServQual
Finally, the sixth section is an attempt by respondents to evaluate the significance of the services provided to them in the future.
Campus Store Mean 2.432.642.65
Flexibility in the execution of services that are based on the needs and problems of customers 2.65
that are expected to improve the quality of are important.
in this section we discuss the findings by comparing them with similar
researchers have questioned the reliability and validity of the SERVQUAL scale. Robinson Serious doubt must be raised over the
VQUAL as a means for measuring service quality. At best it can be argued that t is questionable whether SERVQUAL is
a reliable measure of service quality or, indeed, whether it is measuring service quality at allSERVQUAL has maintained its position as a pioneering tool used by service
et al. 1997; Newman 2001).s in our research is that consumer
measure of perceived service quality. Much refinement is needed for further research in retailing and other service
between the perceptions of respondents about the ServQual evaluation. As shown in Figure
that ‘Reliability’, ‘Responsibility’ and overestimate the contribution of
the perception of customers and the ServQual
Finally, the sixth section is an attempt by respondents to evaluate the significance of the services provided to them in the future.
Mean 2.43 2.64 2.65 2.65
that are expected to improve the quality of
in this section we discuss the findings by comparing them with similar
researchers have questioned the reliability and validity of the SERVQUAL scale. Robinson Serious doubt must be raised over the
VQUAL as a means for measuring service quality. At best it can be argued that t is questionable whether SERVQUAL is
service quality at all”SERVQUAL has maintained its position as a pioneering tool used by service
1997; Newman 2001).is that consumers should not treat
measure of perceived service quality. Much refinement is needed for arch in retailing and other service
between the perceptions of respondents about the shown in Figure
and ‘Tangibility’ overestimate the contribution of the ‘Security’
the perception of customers and the ServQual
Finally, the sixth section is an attempt by respondents to evaluate the significance of the AFS Campus services provided to them in the future.
that are expected to improve the quality of
in this section we discuss the findings by comparing them with similar
researchers have questioned the reliability and validity of the SERVQUAL scale. Robinson Serious doubt must be raised over the
VQUAL as a means for measuring service quality. At best it can be argued that t is questionable whether SERVQUAL is
”. However, SERVQUAL has maintained its position as a pioneering tool used by service
1997; Newman 2001). should not treat
measure of perceived service quality. Much refinement is needed for arch in retailing and other service
between the perceptions of respondents about the shown in Figure
‘Tangibility’ ‘Security’
the perception of customers and the ServQual
Campus
that are expected to improve the quality of
in this section we discuss the findings by comparing them with similar
researchers have questioned the reliability and validity of the SERVQUAL scale. Robinson Serious doubt must be raised over the
VQUAL as a means for measuring service quality. At best it can be argued that t is questionable whether SERVQUAL is
, and SERVQUAL has maintained its position as a pioneering tool used by service
should not treat measure of perceived service quality. Much refinement is needed for
arch in retailing and other service
Finally, the sixth section is an attempt by respondents to evaluate the significance of the AFS Campus Store’s actions which will further improve the quality of services provided to them in the future.
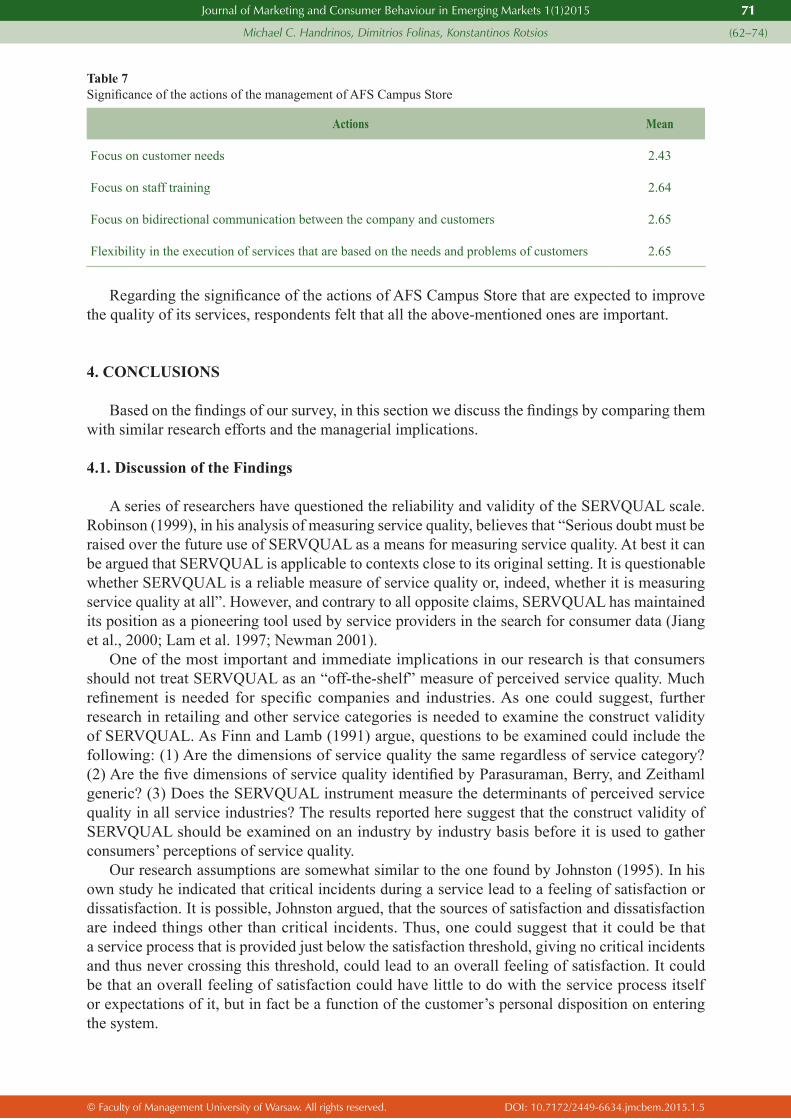
© Faculty of Management University of Warsaw. All rights reserved. DOI: 10.7172/2449-6634.jmcbem.2015.1.5
Journal of Marketing and Consumer Behaviour in Emerging Markets 1(1)2015
Michael C. Handrinos, Dimitrios Folinas, Konstantinos Rotsios
71
(62–74)
Table 7Significance of the actions of the management of AFS Campus Store
Actions Mean
Focus on customer needs 2.43
Focus on staff training 2.64
Focus on bidirectional communication between the company and customers 2.65
Flexibility in the execution of services that are based on the needs and problems of customers 2.65
Regarding the significance of the actions of AFS Campus Store that are expected to improve the quality of its services, respondents felt that all the above-mentioned ones are important.
4. CONCLUSIONS
Based on the findings of our survey, in this section we discuss the findings by comparing them with similar research efforts and the managerial implications.
4.1. Discussion of the Findings
A series of researchers have questioned the reliability and validity of the SERVQUAL scale. Robinson (1999), in his analysis of measuring service quality, believes that “Serious doubt must be raised over the future use of SERVQUAL as a means for measuring service quality. At best it can be argued that SERVQUAL is applicable to contexts close to its original setting. It is questionable whether SERVQUAL is a reliable measure of service quality or, indeed, whether it is measuring service quality at all”. However, and contrary to all opposite claims, SERVQUAL has maintained its position as a pioneering tool used by service providers in the search for consumer data (Jiang et al., 2000; Lam et al. 1997; Newman 2001).
One of the most important and immediate implications in our research is that consumers should not treat SERVQUAL as an “off-the-shelf” measure of perceived service quality. Much refinement is needed for specific companies and industries. As one could suggest, further research in retailing and other service categories is needed to examine the construct validity of SERVQUAL. As Finn and Lamb (1991) argue, questions to be examined could include the following: (1) Are the dimensions of service quality the same regardless of service category? (2) Are the five dimensions of service quality identified by Parasuraman, Berry, and Zeithaml generic? (3) Does the SERVQUAL instrument measure the determinants of perceived service quality in all service industries? The results reported here suggest that the construct validity of SERVQUAL should be examined on an industry by industry basis before it is used to gather consumers’ perceptions of service quality.
Our research assumptions are somewhat similar to the one found by Johnston (1995). In his own study he indicated that critical incidents during a service lead to a feeling of satisfaction or dissatisfaction. It is possible, Johnston argued, that the sources of satisfaction and dissatisfaction are indeed things other than critical incidents. Thus, one could suggest that it could be that a service process that is provided just below the satisfaction threshold, giving no critical incidents and thus never crossing this threshold, could lead to an overall feeling of satisfaction. It could be that an overall feeling of satisfaction could have little to do with the service process itself or expectations of it, but in fact be a function of the customer’s personal disposition on entering the system.
© Faculty of Management University of Warsaw. All rights reserved. DOI: 10.7172/2449-6634.jmcbem.2015.1.5
Journal of Marketing and Consumer Behaviour in Emerging Markets 1(1)2015
Michael C. Handrinos, Dimitrios Folinas, Konstantinos Rotsios
72
(62–74)
4.2 Managerial Implications
In order to focus on the actual findings of our research one would have expected that in such a small-sized store customers would usually indicate responsibility and reliability as being the highest options on their list. However, in our instance, we found out that security, reliability – along with empathy – were the most important dimensions that AFS Campus Store customers indicated. By further examining the mean scores we found out that the degrees (%) of the significance of the dimensions in a descending order were:
• ‘Security’: 22.90%• ‘Reliability’: 20.31%• ‘Empathy’: 20.26%• ‘Responsibility’: 18.79%• ‘Tangibility’: 18.55%.
The overall Quality Score (QeS) was equal to +72.14 and there was a very positive discrepancy between the expected and the provided services. More than 75% of the items have a positive gap score. Respondents felt that ‘Reliability’, ‘Responsibility’ and ‘Tangibility’ were less important than they actually are; conversely, they overestimate the contribution of the ‘Security’ and ‘Empathy’ dimensions.
A number of limitations can be identified in our study. First, the fact that the questionnaires have been collected in a specific time period (2 months) which may not give a holistic view of customers’ perception. Furthermore, we have to take into account the limitations of the SERVQUAL model (e.g. SERVQUAL is process-oriented: it focuses on the process of service delivery, not on the outcomes of the service encounter, and also the fact that five dimensions are not universal).
The findings of this particular study could help SME-sized companies to focus on specific dimensions/attributes that customers consider as most important: security, reliability and empathy; thus, that way they may seek to improve them by implementing the following actions: keeping promises with regard to the provision of their service; the expression of genuine interest in solving the problems of the customers; providing the appropriate level of service and getting it right from the first time and in the right time.
Finally, in order for a particular company to adjust the level of the offered services in critical situations it should address each customer’s specific and unique requirements in a direct manner, and provide information to the customer about the exact time that the service is going to be delivered.
The study of more food stores will be the next steps in order to measure the services that a locally-based SME store provides to its customers. Such an effort could help identify not only more important dimensions of the provided services but also propose specific actions so as to help small and medium enterprises to improve the services they provide to their customers by focusing on these dimensions.
References
Ajam, M., Sadeghifar, J., Anjomshoa, M., Mahmoudi, S., Honarvar, H. and Mousavi, S.M. (2014) ‘Assessing quality of healthcare service by the SERVQUAL model: A case study of a field hospital’, Journal of Military Medicine, 15 (4), pp. 273–279.
Ali, S.S., Kaur, R., Pande, M.J.C. and Ahmad, F. (2014) ‘Service quality gap approach: A case of Indian customer’s satisfaction of private banks’, International Journal of Business Excellence, 7 (4), pp. 429–453.
Anbari, Z., Mohammadi, M. and Taheri, M. (2014) ‘Measurement of quality of hospital services via SERVQUAL model’, Life Science Journal, 11 (6), pp. 51–56.

© Faculty of Management University of Warsaw. All rights reserved. DOI: 10.7172/2449-6634.jmcbem.2015.1.5
Journal of Marketing and Consumer Behaviour in Emerging Markets 1(1)2015
Michael C. Handrinos, Dimitrios Folinas, Konstantinos Rotsios
73
(62–74)
Babakus, E. and Boller, G.W. (1992), ‘An empirical assessment of the SERVQUAL scale’, Journal of Business Research, 26 (6), pp. 253–68.
Brogowicz, A.A., Delene, M.M. and Lyth, D.M. (1990) ‘A Synthesized Service Quality Model with Managerial Implications’, International Journal of Service Industry Management, 1 (1), pp. 27–45.
Brown, T.J., Churchill, G.A. and Peter, J.P. (1993) ‘Research note: improving the measurement of service quality’, Journal of Retailing, 69 (1), pp. 126–39.
Choudhury, K. (2014) ‘Service Quality and Customers’ Complaining Behavior: A Study of the Indian Banking Sector’, Services Marketing Quarterly, 35 (2), pp. 123–137.
Cronin, J.J. and Taylor, S.A. 1992, ‘Measuring service quality: A re-examination and extension’, Journal of Marketing, 56 (3), pp. 55–68.
Dabholkar, P., Thorpe, D.I. and Rentz, J.O. (1996) ‘A Measure of Service Quality for Retail Stores: Scale Development and Validation’, Journal of the Academy of Marketing Science, 24 (1), pp.3–16.
Evanschitzky, H., Iyer, G.R., Caemmerer, B. (2008) ‘Dimensions of satisfaction in retail settings: A research note’, Journal of Relationship Marketing, 7 (3), pp. 275–285.
Finn, D.W. and Lamb, C.W. (1991) ‘An Evaluation of the SERVQUAL Scales in a Retailing Setting’, Advances in Consumer Research, 18, pp. 483–490.
Grönroos, C. (1984) ‘A Service Quality Model and Its Marketing Implications’, European Journal of Marketing, 18 (4), pp. 36–44.
Haywood-Farmer, J. (1988) ‘A Conceptual Model of Service Quality’, International Journal of Operations & Production Management, 8 (6), pp 19–29.
Jiang, J.J., Klein, G. and Crampton, S.M. (2000) ‘A Note on SERVQUAL Reliability and Validity in Information Service Quality Assessment’, Decision Sciences, Summer, pp. 725–744.
Johnston R. (1995) ‘The determinants of service quality: satisfiers and dissatisfiers’, International Journal of Service Industry Management, 6 (5), pp. 53–71.
Khamis, K. and Njau, B. (2014) ‘Patients’ level of satisfaction on quality of health care at Mwananyamala hospital in Dar es Salaam, Tanzania’, BMC Health Services Research, 14 (1), 18 September 2014, Article number 400.
Lam, T., Wong, A. and Yeung, S. (1997) ‘Measuring Service Quality in Clubs: An Application of the SERVQUAL’, Australian Journal of Hospitality Management, 4, pp. 1–8.
Mansori, S., Vaz, A. and Ismail, Z.M.M. (2014) ‘Service quality, satisfaction and student loyalty in Malaysian private education’, Asian Social Science, 10 (7), pp. 57–66.
May, C. and Viljoen, P. (2014) ‘Service quality at a South African university: An exploratory study’, Mediterranean Journal of Social Sciences, 5 (20), pp. 882–887.
Newman, K. (2001) ‘Interrogating SERVQUAL: A Critical Assessment of Service Quality Measurement in a High Street Retail Bank’, International Journal of Bank Marketing, 19 (3), pp. 126–139.
Panda, R.K. and Kondasani, R.K.R. (2014) ‘Assessing customers’ perceived service quality in private sector banks in India’, Serbian Journal of Management, 9, pp. 91–103.
Papanikolaou, V. and Zygiaris, S. (2014) ‘Service quality perceptions in primary health care centres in Greece’, Health Expectations, 17 (2), pp. 197–207.
Parasuraman, A., Berry, L.L. and Zeithaml, V.A. (1985) ‘A Conceptual Model of Service Quality and Its Implications for Future Research’, Journal of Marketing, 49 (4), pp. 41–50.
Robinson, S. (1999) ‘Measuring Service Quality: Current Thinking and Future Requirements’, Marketing Intelligence & Planning, 17, pp. 21–32.
Rust, R.T. and Oliver, R.L. (1994) ‘Service Quality: Insights and Managerial Implications from the Frontier’, in R.T. Rust and R.L. Oliver (eds.), Service Quality: New Directions in Theory and Practice, Thousand Oaks, CA: Sage Publications.
Ryglová, K., Vajčnerová, I. and Šácha, J. (2013) ‘Approaches to quality management in hotel industry’, Acta Universitatis Agriculturae et Silviculturae Mendelianae Brunensis, 61 (7), pp. 2693–2699.
Spreng, R.A. and Mackoy, R.D. (1996) ‘An Empirical Examination of a Model of Perceived Service Quality and Satisfaction’, Journal of Retailing, 72 (2), pp. 201–214.
Tey, Y.S., Brindal, M., Fatimah, M.A., Kusairi, M.N., Ahmad Hanis, I.A. and Suryani, D. (2014) ‘The impact of service quality on business commitment in B2B segment of agribusiness: An exploratory study of HORECA sector in Malaysia’, International Food Research Journal, 21 (3), pp. 883–889.
Tey, Y.S., Brindal, M., Fatimah, M.A., Kusairi, M.N., Ahmad Hanis, I.A. and Suryani, D. (2014) The impact of service quality on business commitment in B2B segment of agribusiness: An exploratory study of HORECA sector in Malaysia, International Food Research Journal, 21 (3), pp. 883–889.
van Schalkwyk, R.D. and Steenkamp, R.J. (2014) ‘Service quality – Cases of private higher education institutions explored’, Corporate Ownership and Control, 11 (2), pp. 402–414.
von Freymann, J. and Cuffe, B. (2010) ‘Consumer service quality assessments and future revenues in small businesses: A case study’, Services Marketing Quarterly, 31 (4), pp. 381–419.
© Faculty of Management University of Warsaw. All rights reserved. DOI: 10.7172/2449-6634.jmcbem.2015.1.5
Journal of Marketing and Consumer Behaviour in Emerging Markets 1(1)2015
Michael C. Handrinos, Dimitrios Folinas, Konstantinos Rotsios
74
(62–74)
Wilson, N., Hall, T. and Fields, D. (2011) ‘Source of the Document International’ Food and Agribusiness Management Review, 14 (1), pp. 1–22.
Wongrukmit, P. and Thawesaengskulthai, N. (2014) ‘Hospital service quality preferences among culture diversity’, Total Quality Management and Business Excellence, 25 (7–8), pp. 908–922.
Zareinejad, M., Kaviani, M.A., Esfahani, M.J. and Masoule, F.T. (2014) ‘Performance evaluation of services quality in higher education institutions using modified SERVQUAL approach with grey analytic hierarchy process (G-AHP) and multilevel grey evaluation’, Decision Science Letters, 3 (2), pp. 143–156.
Zeithaml, V., Parasuraman, A. and Berry, L.L. (1990) Delivering Quality Service; Balancing Customer Perceptions and Expectations, New York: Free Press.