Journal of Marketing and Consumer Behaviour in Emerging ...5)-2017... · Overview The Journal of...
71
ISSN 2449-6634 © Faculty of Management University of Warsaw. All rights reserved. Journal of Marketing and Consumer Behaviour in Emerging Markets 1(5)2017 Journal of Marketing and Consumer Behaviour in Emerging Markets University of Warsaw Faculty of Management JMCBEM 1(5)2017 ISSN 2449-6634
Transcript of Journal of Marketing and Consumer Behaviour in Emerging ...5)-2017... · Overview The Journal of...

ISSN 2449-6634 © Faculty of Management University of Warsaw. All rights reserved.
Journal of Marketing and Consumer Behaviour in Emerging Markets 1(5)2017
Journal of Marketing and Consumer Behaviour
in Emerging Markets
University of Warsaw Faculty of Management
JMCBEM 1(5)2017
ISSN 2449-6634

OverviewThe Journal of Marketing and Consumer Behaviour in Emerging Markets (JMCBEM) is an open access journal. The submission of manuscripts is free of fee payment. This journal follows a double-blind reviewing procedure. The JMCBEM is indexed in ECONPAPERS and IDEAS/RePEC.
Aims and scopeUnderstanding consumer behaviour is crucial for the development of effective marketing strategies. The Journal of Marketing and Consumer Behaviour in Emerging Markets (JMCBEM) is an academic journal which aims at the dissemination of studies from a range of areas including marketing, consumer behaviour, consumer research and consumption, In addition, it intends to include case studies, as well as new concepts and practices refl ecting managerial research. JMCBEM seeks to blend both theory and practice and thus contribute to the advancement of the fi eld. We expect submitted articles to be theoretically sound, provide signifi cant research fi ndings and implications for existing approaches.
Special IssuesJMCBEM welcomes publication of Special Issues, whose aim is to bring together and integrate work on a specifi c theme; open up a previously under-researched area; or bridge the gap between formerly rather separate research communities, who have been focusing on similar or related topics. Thematic issues are strongly preferred to a group of loosely connected papers.Proposals of Special Issues should be submitted to [email protected]. All proposals are being reviewed by the Editorial Team on the basis of certain criteria that include e.g.: the novelty, importance and topicality of the theme; whether the papers will form an integrated whole; and the overall ‹added value› of a Special Issue.
Editorial BoardEditors❖ Editor in-chief: Dr Katarzyna Dziewanowska, University of Warsaw, Warsaw, Poland❖ Co-Editor: Dr Agnieszka Kacprzak, University of Warsaw, Warsaw, Poland❖ Co-Editor: Dr Joanna Chudzian, Warsaw University of Life Sciences, Poland
Editorial Advisory Board❖ Professor Marc Ant, Faculty of Business Administration, Bonn-Rhine-Sieg-University of Applied Sciences, Germany❖ Professor Gül Bayraktaroğlu,Faculty of Business, Dokuz Eylül University, Turkey❖ Professor Seong-Do Cho, College of Business and Administration, Chonnam National University, South Korea❖ Professor Carmen Costea, Spiru Haret University Bucharest, Romania❖ Professor Grzegorz Karasiewicz, Faculty of Management, University of Warsaw, Poland❖ Professor Ilsang Ko, College of Business and Administration, Chonnam National University, South Korea❖ Professor Robert Kozielski, Faculty of Management, University of Łódź, Poland❖ Professor Jan Nowak, Tischner European University, Poland❖ Professor Alison Pearce, Newcastle Business School, Northumbria University, UK❖ Professor Laetitia Radder, Department of Marketing Management, Nelson Mandela Metropolitan University,
Port Elizabeth, South Africa❖ Professor Sanda Renko, Faculty of Economics & Business, University of Zagreb, Croatia❖ Professor Edyta Rudawska, Faculty of Economics and Management, Szczecin University❖ Professor Joanna Szwacka-Mokrzycka, Faculty of Economics, Warsaw University of Life Sciences❖ Professor Andrzej Wiatrak, Faculty of Management, University of Warsaw, Poland❖ Professor Nada Zupan, Faculty of Economics, University of Ljubljana, Slovenia
Associate Editors❖ Dr Iwona Kowalska, Statistical Editor
Assistant Editor❖ Tomasz Rosa
Language Editor❖ Agata Ostrowska
Editorial Offi ce: Faculty of Management, University of Warsaw, Szturmowa Str. 1/3, Postal Code 02-678 Warsaw, Email: [email protected]
Publisher: Faculty of Management Publishing House, University of Warsaw, Szturmowa Str. 1/3, Postal Code 02-678 Warsaw; Telephone: +48 22 55 34 164; Fax: +48 22 55 34 001; [email protected]
© UW Faculty of Management 2015. Copyright by Faculty of Management University of Warsaw Publishing House
Webpage of Journal of Marketing and Consumer Behaviour in Emerging Markets:http://www.wz.uw.edu.pl/portale/journal-of-marketing-and-consumer-behaviour-in-emerging-markets/dzial/view-papers
Journal of Marketing and Consumer Behaviour in Emerging Markets 1(5)2017
ISSN 2449-6634 © Faculty of Management University of Warsaw. All rights reserved.

ISSN 2449-6634 © Faculty of Management University of Warsaw. All rights reserved.
Journal of Marketing and Consumer Behaviour in Emerging Markets 1(5)2017
Contents
Olgun Kitapci, Ömür Tosun, Murat Fatih Tuna, Tarik TurkThe Use of Artifi cial Neural Networks (ANN) in Forecasting Housing Prices
in Ankara, Turkey . . . . . . . . . . . . . . . . . . . . . . . . . . . . . . . . . . . . . . . . . . . . . . . . . 4
Norlia AhmadQuality Attribute and Customer Satisfaction: Using Kano’s Model to Prioritize What
Matters Most to Customers . . . . . . . . . . . . . . . . . . . . . . . . . . . . . . . . . . . . . . . . . . 15
Zubair HassanImpact of Social, Epistemic and Conditional Values on Customer Satisfaction and Loyalty
in Automobile Industry: A Structural Equation Modelling . . . . . . . . . . . . . . . . . . . . 29
Kizito Ogedi Alakwe, Ngozi Okpara PhD.Infl uence of Retail Atmospherics as Nonverbal Communication on Purchase Behaviour
in the Nigerian Retail Environment . . . . . . . . . . . . . . . . . . . . . . . . . . . . . . . . . . . . 45
Anita MatuszewskaThe Infl uence of Adult Children from “Generation Y” on the Shopping Decisions
of their Parents . . . . . . . . . . . . . . . . . . . . . . . . . . . . . . . . . . . . . . . . . . . . . . . . . . . 63

© Faculty of Management University of Warsaw. All rights reserved. DOI: 10.7172/2449-6634.jmcbem.2017.1.1
Journal of Marketing and Consumer Behaviour in Emerging Markets 1(5)2017 4
(4–14)
The Use of Artifi cial Neural Networks (ANN)in Forecasting Housing Prices in Ankara, Turkey
Olgun Kitapci (corresponding author)Associate Professor
Akdeniz University, Uygulamali Bilimler FakultesiDepartment of Marketing
Antalya-Dosemealti/TURKEYPhone: +90 (532) 3617902Faxs: +90 (242) [email protected]
Ömür TosunAssociate Professor
Akdeniz University, Uygulamali Bilimler FakultesiUluslararasi Ticaret ve Lojistik Bolumu
Antalya-Dosemealti/TURKEY
Murat Fatih TunaResearcher Assistant
Cumhuriyet University, Iktisadi ve Idari Bilimler FakultesiYonetim Bilisim Sistemleri Bolumu
Tarik TurkAssociate Professor
Cumhuriyet University, Muhendislik FakultesiGeomatik Muhendisligi
Received: 6 November 2016/ Revised: 12 December 2016/ Accepted: 15 January 2017/Published online: 10 March 2017
ABSTRACT
The purpose of this paper is to forecast housing prices in Ankara, Turkey using the artifi cial neural networks (ANN) approach. The data set was collected from one of the biggest real estate web pages during April 2013. A three-layer (input layer – one hidden layer – output layer) neural network is designed with 15 different inputs to forecast the future housing prices. The proposed model has a success rate of 78%. The results of this paper would help property investors and real estate agents in developing more effective property pricing management in Ankara. We believe that the artifi cial neural networks (ANN) proposed here will serve as a reference for countries that develop artifi cial neural networks (ANN) method-based housing price determination in future. Applying the artifi cial neural networks (ANN) approach for estimation of housing prices
© Faculty of Management University of Warsaw. All rights reserved. DOI: 10.7172/2449-6634.jmcbem.2017.1.1
Journal of Marketing and Consumer Behaviour in Emerging Markets 1(5)2017
Olgun Kitapci, Ömür Tosun, Murat Fatih Tuna, Tarik Turk
5
(4–14)
is relatively new in the fi eld of housing economics. Moreover, this is the fi rst study that uses the artifi cial neural networks (ANN) approach for analyzing the housing market in Ankara/Turkey.
JEL classifi cation: C15, D14, R31
Keywords: Housing, artifi cial neural networks, forecasting, prices, Turkey
1. INTRODUCTION
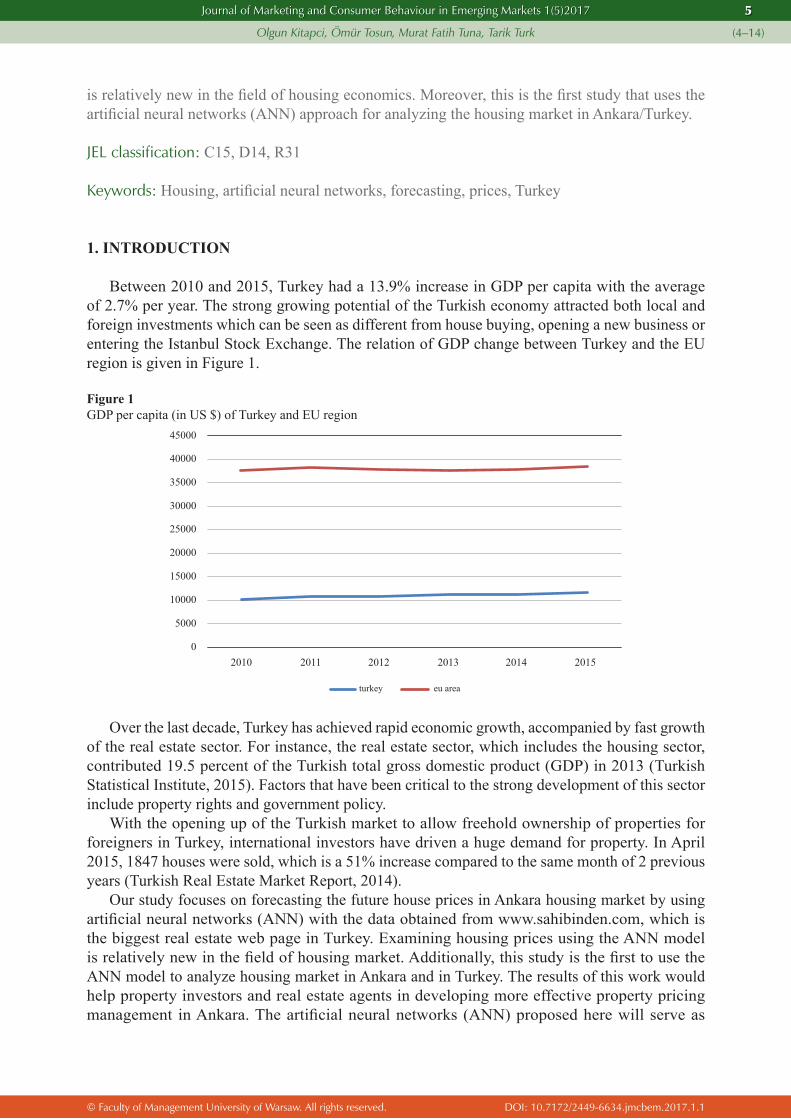
Between 2010 and 2015, Turkey had a 13.9% increase in GDP per capita with the average of 2.7% per year. The strong growing potential of the Turkish economy attracted both local and foreign investments which can be seen as different from house buying, opening a new business or entering the Istanbul Stock Exchange. The relation of GDP change between Turkey and the EU region is given in Figure 1.
Figure 1GDP per capita (in US $) of Turkey and EU region
2010 2011 2012 2013 2014 20150
5000
10000
15000
20000
25000
30000
35000
40000
45000
turkey eu area
Over the last decade, Turkey has achieved rapid economic growth, accompanied by fast growth of the real estate sector. For instance, the real estate sector, which includes the housing sector, contributed 19.5 percent of the Turkish total gross domestic product (GDP) in 2013 (Turkish Statistical Institute, 2015). Factors that have been critical to the strong development of this sector include property rights and government policy.
With the opening up of the Turkish market to allow freehold ownership of properties for foreigners in Turkey, international investors have driven a huge demand for property. In April 2015, 1847 houses were sold, which is a 51% increase compared to the same month of 2 previous years (Turkish Real Estate Market Report, 2014).
Our study focuses on forecasting the future house prices in Ankara housing market by using artifi cial neural networks (ANN) with the data obtained from www.sahibinden.com, which is the biggest real estate web page in Turkey. Examining housing prices using the ANN model is relatively new in the fi eld of housing market. Additionally, this study is the fi rst to use the ANN model to analyze housing market in Ankara and in Turkey. The results of this work would help property investors and real estate agents in developing more effective property pricing management in Ankara. The artifi cial neural networks (ANN) proposed here will serve as

© Faculty of Management University of Warsaw. All rights reserved. DOI: 10.7172/2449-6634.jmcbem.2017.1.1
Journal of Marketing and Consumer Behaviour in Emerging Markets 1(5)2017
Olgun Kitapci, Ömür Tosun, Murat Fatih Tuna, Tarik Turk
6
(4–14)
a reference for countries that develop artifi cial neural networks (ANN) method-based housing price determination in future.
The present paper seeks to contribute to this line of research by examining the issue for Turkey. Turkey is the 17th largest economy in the world and 6th largest economy in Europe with a GDP of approximately USD 786 billion. Between 2002 and 2012, the Turkish economy grew remarkably well at an average rate of 5.17 percent per annum (Turkish Statistical Center, 2014). In parallel, it witnessed a run-up in property market, especially in Ankara metropolitan area, the capital city of Turkey.
We organize the remainder of this paper as follows. The next section includes some information about Ankara housing market; the following section presents a literature review in housing market forecasting models and artifi cial neural networks model. In section 5, some interpretations of the results obtained are offered and in the fi nal section, a summary is presented.
2. TURKISH HOUSING MARKET
Turkey has achieved rapid economic growth, accompanied with rapid development of the real estate sector. As a result of rapid economic growth, demand for urban land and new dwelling has increased swiftly, leading to rapid growth of housing prices.
For instance, the Housing Index in Turkey increased to 178.80 Index points in March 2015 from 175.16 Index points in February 2015. The Housing Index in Turkey averaged 147.71 Index points from 2002 until 2015, reaching an all time high of 1358 Index points in January of 2002 and a record low of 96.92 Index points in January of 2010. Figure 2 shows the Turkish House Price Index from January 2010 to September 2016 (Central Bank of the Republic of Turkey, 2016).
Figure 2Turkish House Price Index from year 2010 to 2016
Jan-
10
May
-10
Sep-
10
Jan-
11
May
-11
Sep-
11
Jan-
12
Sep-
12
Jan-
13
May
-13
Sep-
13
Jan-
14
May
-14
Sep-
14
Jan-
15
May
-15
Sep-
15
Jan-
16
May
-16
Sep-
16
May
-12
230
210
190
170
150
130
110
90
The housing market has increased substantially and also the construction industry has become one of the key elements in the Turkish economy, because of the government policy during the last decade. Figure 3 shows total house sales in Turkey by year. It depicts a signifi cant jump from the 4th quarter of 2012 to 2013. In total, 2013 house sales have exceeded 2012 levels by 65%. And this increase continues in the following periods (Turkish Statistical Institute, 2016).

© Faculty of Management University of Warsaw. All rights reserved. DOI: 10.7172/2449-6634.jmcbem.2017.1.1
Journal of Marketing and Consumer Behaviour in Emerging Markets 1(5)2017
Olgun Kitapci, Ömür Tosun, Murat Fatih Tuna, Tarik Turk
7
(4–14)
Figure 3The total house sales in Turkey by month (thousand units)
2010
-IV
2010
-III
2011
-I20
11-I
I20
11-I
II20
11-I
V20
12-I
2012
-II
2012
-III
2012
-IV
2013
-I20
13-I
I20
13-I
II20
13-I
V20
14-I
2014
-II
2014
-III
2014
-IV
2015
-I20
15-I
I20
15-I
II20
15-I
V20
16-I
2016
-II
2016
-III
2010
-II
2010
-I
400
350
300
250
200
150
100
50
0
In May 2012, the government passed a bill to attract more foreign homebuyers. Since August 2012, the government has allowed nationals from 183 countries to buy properties in Turkey. In addition, the size of land foreigners can buy without needing a special permission increased from 2.5 hectares, to 33 hectares. Since then, tens of thousands of foreigners have successfully acquired properties in Turkey, most notably in the Marmara and Mediterranean regions, Turkey’s major fi nance and tourist hubs. In 2015, Turkey’s Foreign Direct Investment (FDI) infl ow was at US$ 16.5 billion, 24.8% of the total FDI (or US$ 4.1 billion) was for real estate and construction, according to the Investment Support and Promotion Agency of Turkey (ISPAT) (www.globalpropertyguide.com).
Housing loan interest rates fell from about 48.43% in 2002 to just 9.7% in 2013. This led to a sharp rise in outstanding housing loans, despite periods when the economy was weak. Over the past decade, housing loans expanded from around 1.91% of GDP in 2005 to around 6.58% of GDP in 2015. Housing loans increased by an average of 27.9% annually from 2006 to 2015. In 2014, the average interest rate for housing loans rose again, and by September 23, 2016, the average interest rate was 12.07% (www.globalpropertyguide.com).
Ankara is the capital city of Turkey and has become Turkey’s second largest city after Istanbul. Additionally, according to the report made by Turkish Statistical Institute in 2014, 5,150,072 people lived in Ankara in 2014. According to Port Turkey news, the number of large-scale housing projects continues to increase in Ankara. As a consequence of allowing both internal and external migration, forecasting housing prices in Ankara is becoming an important issue for potential property investors. House price and house sales information about Ankara is given in Table 1.

© Faculty of Management University of Warsaw. All rights reserved. DOI: 10.7172/2449-6634.jmcbem.2017.1.1
Journal of Marketing and Consumer Behaviour in Emerging Markets 1(5)2017
Olgun Kitapci, Ömür Tosun, Murat Fatih Tuna, Tarik Turk
8
(4–14)
Table 1House Price Index and sales of houses in Ankara
House Price Index
Salesof
Houses
House Price Index
Salesof
Houses
House Price Index
Salesof
Houses
House Price Index
Salesof
Houses
Jan-13 123.62 11215 Jan-14 137.60 10141 Jan-15 152.16 9570 Jan-16 171.59 9012
Feb-13 125.01 11281 Feb-14 139.11 9386 Feb-15 154.19 11063 Feb-16 172.20 10694
Mar-13 126.81 12291 Mar-14 141.10 10693 Mar-15 157.02 14105 Mar-16 172.59 12730
Apr-13 128.61 11889 Apr-14 141.99 9249 Apr-15 158.80 14001 Apr-16 173.48 11843
May-13 129.93 12638 May-14 143.69 11004 May-15 161.02 12816 May-16 176.26 11408
Jun-13 131.29 11692 Jun-14 144.74 10437 Jun-15 162.31 12869 Jun-16 177.55 11695
Jul-13 132.10 12428 Jul-14 146.68 9426 Jul-15 163.83 10722 Jul-16 178.73 7955
Aug-13 132.64 9636 Aug-14 147.64 11836 Aug-15 165.66 13139 Aug-16 178.74 12300
Sep-13 133.28 12206 Sep-14 148.78 12615 Sep-15 166.69 9810 Sep-16 181.35 11564
Oct-13 134.22 8231 Oct-14 150.53 10549 Oct-15 169.02 11028
Nov-13 135.78 11981 Nov-14 151.39 11695 Nov-15 169.77 11368
Dec-13 136.35 12285 Dec-14 152.07 14794 Dec-15 170.86 16046
Data used in the study have been obtained from the data of the online marketplace “www.sahibinden.com” regarding the residences being sold in the pilot study area for the period between December 11, 2011 and April 23, 2012. This online market platform (www.sahibinden.com) founded in 1999 in Turkey is one of the fi rst websites that provide ad search opportunities via the internet. Since its foundation, this website has been the most frequently visited ad and shopping platform of Turkey. On the other hand, fi ve-year neighborhood- and district-level population data obtained from the Turkish Statistical Institute has been used to observe the population development in the study area.
Ankara is divided into nine districts (Yenimahalle, Cankaya, Kecioren, Sincan, Golbasi, Etimesgut, Mamak, Altindag, Akyurt), which are given in Figure 4. In Yenimahalle, Cankaya and Kecioren districts, house is known as a capital good, so house prices in these districts are high. House prices in Golbasi and Sincan districts are average; house prices in Etimesgut, Mamak, Altindag and Akyurt districts are low.

© Faculty of Management University of Warsaw. All rights reserved. DOI: 10.7172/2449-6634.jmcbem.2017.1.1
Journal of Marketing and Consumer Behaviour in Emerging Markets 1(5)2017
Olgun Kitapci, Ömür Tosun, Murat Fatih Tuna, Tarik Turk
9
(4–14)
Figure 4Ankara’s districts
3. LITERATURE REVIEW
Much research has been conducted on the factors affecting housing prices and relations between them. An analysis of the housing market and housing price valuation literature indicates two principal research trends: the use of the hedonic-based regression approach (Lancaster, 1966; Brown and Rosen, 1982; Rabiega et al., 1984; Stevenson, 2004; Shimizu, 2010) which has been adapted to the housing market by Rosen, and this approach is commonly used as an assessment tool for the market analysis. In recent years, the second trend, artifi cial intelligence techniques, has been used as an alternative tool to model systems of conventional property value (Kuşan et al., 2010). Chen et al. (2007) forecasted housing prices under different submarket assumptions in the city of Knoxville and vicinities. Piazzesi et al. (2007) created a consumption-based asset pricing model where housing is explicitly modeled both as an asset and consumption good. There has been a little amount of literature on the use of artifi cial intelligence techniques to analyze determinants of house prices. Some of these studies include: Yan et al. (2007), Selim (2007), García et al. (2008), He et al. (2010), Kuşan et al. (2010), Tayyebia et al. (2011), Azadeh et al. (2012), Park and Bae (2015) (Table 2). These studies are conducted following artifi cial intelligence techniques like neural network and fuzzy linear regression and employ as many variables as possible to capture the main determinants of housing prices in different countries.
There a few studies related to both Turkish real estate market and its pricing that use econometric models to analyze the effects of house pricing.
Yuksel (2016) analyzed the relation between stock and real estate prices in Turkey by using threshold error-correction model. That author compared the effect of pre-crisis and crisis periods using daily Real Estate Investment Trusts Index, stock market index and interest rate data within the framework of a vector error correction model.
Kaya and Atan (2014) used a hedonic price model on the data of house price index obtained from the Central Bank of Turkey. Their study shows that, for the period between December 2010

© Faculty of Management University of Warsaw. All rights reserved. DOI: 10.7172/2449-6634.jmcbem.2017.1.1
Journal of Marketing and Consumer Behaviour in Emerging Markets 1(5)2017
Olgun Kitapci, Ömür Tosun, Murat Fatih Tuna, Tarik Turk
10
(4–14)
and June 2012, under the constant housing features, hedonic price indexes are calculated as 6.21% for Turkey, 5.93% for İstanbul, and 5.05% and 2.83% for Ankara and İzmir respectively.
Coskun and Ertugrul (2016) analyze volatility properties of the house price returns of Turkey and Istanbul, Ankara and Izmir provinces over the period of July 2007–June 2014 using conditional variance models.
In recent years, the ANN approach has been used as an alternative tool to model systems of housing prices determination. This study will employ the ANN approach to evaluate the major determinations of housing prices in Ankara. Related studies including artifi cial neural networks and house pricing are given in Table 2.
Table 2The studies related to artifi cial intelligence techniques in housing market sector
Author(s) Journal Artifi cial Intelligence Analysis Techniques
Yan et al., 2007 Systems Engineering TEI@I
Garcia et al., 2008 Neurocomputing Artifi cial neural network and geographic information system
Selim, 2009 Expert Systems with Applications Hedonic regression and artifi cial neural network
He et al., 2010 Procedia Environmental Sciences Wavelet transformation, hedonic regression
Kusan et al., 2010 Expert Systems with Applications Fuzzy logic
Tayyebia, et al. 2011 Landscape and Urban Planning Neural networks, geographic information system and radial parameterization
Azadehet, al. 2012 Expert Systems with Applications Fuzzy linear regression
Park and Bae, 2015 Expert Systems with Applications Decision trees, classifi cation
4. ARTIFICIAL NEURAL NETWORKS (ANN)
ANN is a part of machine learning where you can train the user design network to learn a process like forecasting, classifi cation or other rule-based programming. Generally, it is a copy of human brain for information processing and computing. Like our brains, ANN uses artifi cial nerves and links them together to simulate the capability of a biological neural network. The most signifi cant property of ANN systems is that they can learn from sample data sets like brains, and have the ability to make decisions according to this learning process (Tosun, 2012).
ANNs have been applied to different fi elds like linear, nonlinear or even nonparametric problems. The basic element of the ANN is called neuron, which is the processing unit that forms a larger network. In regression or forecasting to train a multilayer network, a back-propagation learning algorithm is widely accepted and used. This learning algorithm is preferred to train the network with gradient search to minimize the square of errors between realized and targeted outputs (Pendharkar and Rodgre, 2003).
Generally, a multi-layer perception type of ANN which has three different layers (input, hidden and output layers) is widely used in literature. This type of ANN is fully connected, which means each node (neuron) is connected to every neuron in the next and previous layer. Each layer has a different number of neurons determined by the decision maker. The input layer is the fi rst stage which allows inputs to enter from environment into the network. The output layer transmits the output to the environment. And the hidden layer occurs between the two outer layers. The hidden layer establishes linkages (with a selected transfer function) between input and output layers and provides the generalization of the network (Özdemir and Tekin, 2009; Örkcü and Bal, 2011).

© Faculty of Management University of Warsaw. All rights reserved. DOI: 10.7172/2449-6634.jmcbem.2017.1.1
Journal of Marketing and Consumer Behaviour in Emerging Markets 1(5)2017
Olgun Kitapci, Ömür Tosun, Murat Fatih Tuna, Tarik Turk
11
(4–14)
The connections between the neurons of consecutive layers create the processing abilities of any ANN. Each layer has neurons linked together with different weights. These weights are calculated by a trial-error process (known as learning) which aims to minimize the error between the output value and the desired value. By selecting a suitable set of connecting weights and transfer functions, an ANN can learn to achieve a given task.
Figure 5A neural network model
…
…
Output Layer
Hidden Layer
Input Layer
Generally, for each input variable in the dataset, there is one corresponding node in the input layer. The number of nodes in the hidden layer determines the complexity of the network model and needs to be empirically determined to best suit the data considered. While larger networks easily overfi t (in other words, memorize) the data, too few hidden layer nodes can hinder learning of an adequate separating region. Although having more than one hidden layer provides no advantage in terms of nature of forecasting accuracy, it can in certain cases provide for faster learning (Pendharkar and Rodgre, 2003).
A back propagation neural network is widely preferred for prediction or classifi cation of problems (Liang and Wu, 2005). Therefore, this algorithm is used in this study.
In the back propagation algorithm, the related input data are repeatedly presented to the neural network. The output of the neural network is compared to the targeted output and an error is calculated for each iteration. This error is then back propagated to the neural network and used to adjust the weights so that the error may decrease with each iteration and the designed model gets closer and closer to produce the desired output. This learning process is known as training (Wu et al., 2006).
Using the learning rules, the weights are iteratively changed to reach the best weight values which provide the most satisfactory outputs. This can depend on min MSE (min squared error) or other user-defi ned performance indicators. The network with the best performance measure is accepted as the best network. For obtaining the best network structure, many trials are needed in order to fi nd the best numbers of hidden layers and the best numbers of neurons in those layers (Tosun, 2012).
ANN provides many advantages to decision makers, especially for complex problem solutions. They not only have ability to learn from sample sets, but their results can also be generalized to other data sets. A learned ANN can do the same tasks for other similar data sets. They can be especially powerful when the underlying data relationship is unknown. Noisy or imprecise data or even complex and non-linear data sets do not prevent the learning process. Hence, ANN is used in a wide range of applications in business management practices (Özdemir and Temur, 2009).
One of the most important features of neural networks is their ability to learn and generalize from a set of training data. After the training phase, a network establishes correlated patterns between input data sets and its corresponding targets. Thus, a well-trained network can be used to predict the outcomes of new independent input data (Jha, 2007).
One major disadvantage of ANN is that it is impossible to know the effect or the relationship between the inputs and the outputs with certainty, where the connection weights in the network do not indicate which input has more or less effect on the outcome of the network. In other words,

© Faculty of Management University of Warsaw. All rights reserved. DOI: 10.7172/2449-6634.jmcbem.2017.1.1
Journal of Marketing and Consumer Behaviour in Emerging Markets 1(5)2017
Olgun Kitapci, Ömür Tosun, Murat Fatih Tuna, Tarik Turk
12
(4–14)
one can consider ANN as a black box that supplies good outcomes without indicating how or why. Apart from defi ning the general architecture of a network and perhaps initially seeding it with a random numbers, the user has no other role than to enter the inputs and watch the network train by itself and await the output. Another limitation of ANN is fi nding the right topology for the network, most importantly choosing the number of the hidden nodes, the initial weights for the connecting paths, and the proper learning algorithm with its parameters (Rao and Ali, 2002).
5. NETWORK DESIGN AND APPLICATION
Generally, before training a neural network, a decision maker must decide on the network properties by specifying the number of neurons in the input layer, the number of hidden layers (one or more layers), the number of neurons in each hidden layer, and the number of neurons in the output layer (Emrouznejad and Shale, 2009).
There are no certain rules to defi ne the right or proper number of hidden layer units. Network design is a trial and error process. The initial values of the weights may also affect the resulting accuracy. Once a network has been trained and its accuracy is not considered acceptable, the training process should be repeated with a different network topology or a different set of initial weights (Emrouznejad and Shale, 2009).
A three-layer (input layer – one hidden layer – output layer) neural network is used for the study. For ANN, a program is written in Matlab by using Neural Network Toolbox. In this study, the output is the price of the houses and inputs are the variables used to forecast the house price. The variables used in the study with their descriptive statistics are given in Table 3. Thus, there are fi fteen neurons in the input layer and one in the output layer. These variables are selected from the database based on the opinions of real estate agencies or marketing specialists. According to these experts, the main criteria refl ecting the buying or renting decision of the customers are selected.
The age of home variable is given in groups on the web site. Therefore, we give numbers for each group: 0 for a new building, 1 if the age is 1–4, 2 if the age is 5–10, 3 if the age is 11–15, 4 if the age is 16–20 years and 5 if the building is 20 years or older.
Table 3Variables, minimum, maximum and mean values
Variables Defi nition of the variables Min Max MeanPrice Value of the home in TL 15,000 1,050,000 129,770.37Size Size of the home in square meters 50 571 126.96Rooms Number of rooms 1 8 4.09Bathroom Number of bathrooms 1 4 127Floor Floor at which the home is located 0 18 4.34Parking 1 if there is a parking place for cars 0 1 0.64Age Age of the home 0 5 1.49Elevator 1 if there is an elevator 0 1 0.32Heating 1 if there is central heating 0 1 0.92Location 1 if the home is in or near the city center 0 1 0.40Site 1 if the house is in an apartment complex 0 1 0.15Insulation 1 if the house/building has an insulation 0 1 0.56Kitchen 1 if the kitchen has kitchen cabinets 0 1 0.14
Home-Floor Floor of the house. 1 if hardwood, 2 if laminateand 0 if vinyl covering 0 2 1.52
Road 1 if near the main city roads 0 1 0.53Subway 1 if near a subway station 0 1 0.08

© Faculty of Management University of Warsaw. All rights reserved. DOI: 10.7172/2449-6634.jmcbem.2017.1.1
Journal of Marketing and Consumer Behaviour in Emerging Markets 1(5)2017
Olgun Kitapci, Ömür Tosun, Murat Fatih Tuna, Tarik Turk
13
(4–14)
For a better classifi cation, the data is normalized to [0, 1] by using the equation below:
XX X
X X
max min
minnormalized =
-
- (1)
There are 1500 observations in the dataset. In the study, the dataset is divided into three parts randomly: 70% is used for training the network and remaining data is divided equally for testing and validation. In order to fi nd the optimum number of neurons in the hidden layer, a simple experimental design is used. First, the training process was started with a network of fi ve neurons in the hidden layer and this network is run 15 times. Then, this process was repeated for an increased number of neurons in the hidden layer of up to 20.
The most effective neuron numbers are chosen according to the performance measure. In this study, the mean square error (MSE) is taken into consideration as a performance measurement. The selection of the best ANN system depends on the value of MSE. The minimum MSE found through the experiment is 0.0023, which occurs in 4 different network structures (number of hidden neurons of 6, 12, 14 and 15). The best network is chosen on the basis of both CPU time and the coeffi cient of regression. The network with 12 hidden neurons has the coeffi cient of regression of 0.7878. The results of the best network after the training process are seen in Table 4.
Table 4Training results
Training Results
Best Network
Network architecture 15 – 12 – 1Activation function logsig/linearTraining algorithm Levenberg-MarquardtMinimum MSE 0.0023
The best network has 15 neurons in the input layer, 12 neurons in the hidden layer and one in the output layer. For hidden layer log sigmoid and for the output layer pure-linear, transfer functions are used. Levenberg-Marquardt algorithm is used for the training.
6. CONCLUSION
In this study, an artifi cial intelligence based decision support method is proposed for estimating housing prices. This method aims to help decision makers to analyze the market structure and compare the recent prices with their fi ndings. In the model, 15 different inputs, from house price to its location, are used for the inputs. The output of the system is the future price of houses.
The aim of this study is to provide a decision tool for decision makers in the very complicated housing market for both real estate fi rms and fi nal consumers. Buying a house or using a mortgage is a very diffi cult opinion for most people. A proper price forecast can be very helpful for future references. Thus, the proposed method can be utilized to ease the decision making process. This utilization is of interest particularly for both property investors and fi nal consumers.
Perhaps the main limitation of this study is the selection of input and output variables. Comprehensive literature research is done for this purpose. But it should be known that selecting different variables can affect the outcome of the forecasts. This effect can be analyzed in further studies.

© Faculty of Management University of Warsaw. All rights reserved. DOI: 10.7172/2449-6634.jmcbem.2017.1.1
Journal of Marketing and Consumer Behaviour in Emerging Markets 1(5)2017
Olgun Kitapci, Ömür Tosun, Murat Fatih Tuna, Tarik Turk
14
(4–14)
References
Azadeh, A., Ziaei, B. and Moghaddam, M. (2012). ‘A hybrid fuzzy regression-fuzzy cognitive map algorithm for forecasting and optimization of housing market fl uctuations’, Expert Systems with Applications, Vol. 39, No. 1, pp. 298–315.
Brown. N.J. and Harvey, R.S. (1982). ‘On the estimation of structural hedonic price model’, Econometrica, Vol. 50, No. 5, pp. 765–768.
Chen, Z., Cho, S.-H., Poudyal, N. and Roberts, R. K. (2007). ‘Forecasting Housing Prices Under Different Submarket Assumptions’, American Agricultural Economics Association Annual Meeting, Portland, OR, July 29–August 1.
Coskun, Y. and Ertugrul, H.M. (2016). ‘House price return volatility patterns in Turkey, İstanbul, Ankara and İzmir’. Journal of European Real Estate Research, Vol. 9, No. 1, pp. 26–51.
García, N., Gámez, M. and Alfaro, E. (2008). ‘ANN+GIS: An automated system for property valuation’, Neurocomputing, Vol. 71, No. 4–6, pp. 733–742.
He, C., Wang, Z., Guo, H., Sheng, H., Zhou, R. and Yang, Y. (2010). ‘Driving Forces Analysis for Residential Housing Price in Beijing’, Procedia Environmental Sciences, 2, 925–936.
Jha, G. K. (2007). ‘Artifi cial Neural Networks’, Indian Agricultural Research Institute, pp. 1–10.Kaya, A. and Atan, M. (2014). ‘Determination of the factors that affect house prices in Turkey by using hedonic
pricing model’, Journal of Business, Economics and Finance, Vol. 3, No. 3, pp. 313–327.Liang, L. and Wu, D. (2005). ‘An application of pattern recognition on scoring Chinese corporations fi nancial
conditions based on back propagation neural network’, Computers and Operational Research, Vol. 32, No. 5, pp. 1115–1129.
Özdemir, D. and Temur, G. T. (2009). ‘DEA ANN approach in supplier evaluation system’, WASET, Vol. 54, pp. 343–348.
Park, B. and Bae, J.K. (2015). ‘Using machine learning algorithms for housing price prediction: The case of Fairfax County, Virginia housing data’, Expert Systems with Applications, Vol. 42, No. 6, pp. 2928–2934.
Pendharkar, P. C. and Rodgre, J. A. (2003). ‘Technical effi ciency-based selection of learning cases to improve forecasting accuracy of neural networks under monotonicity assumption’, Decision Support Systems, Vol. 36, No. 1, pp. 117–136.
Piazzesi, M., Schneider and M., Tuzel, S. (2007). ‘Housing, Consumption and Asset Pricing’, Journal of Financial Economics, Vol. 83, pp. 531–569.
Rabiega, W.A., Lin, T.-W. and Robinson, L.M. (1984). ‘The property value impacts of public housing projects in low and moderate density residential neighborhoods’, Land Economics, Vol. 60, No. 2, pp. 174–179.
Rao, C.P. and Ali, J. (2002). ‘Neural network model for database marketing in the new global economy’, Marketing Intelligence & Planning, Vol. 20, No. 1, pp. 35–43.
Selim, H. (2009). ‘Determinants of house prices in Turkey: hedonic regression versus artifi cial neural network’, Expert Systems with Applications, Vol. 36, No. 2, pp. 2843–2852.
Shimizu, C., Nishimura, K.G. and Karato, K. (2014). ‘Nonlinearity of housing price structure: Assessment of three approaches to nonlinearity in the previously owned condominium market of Tokyo’, International Journal of Housing Markets and Analysis, Vol. 7, No. 4, pp. 459–488.
Stevenson, S. (2004). ‘New Empirical Evidence on Heteroscedasticity in Hedonic Housing Models’, Journal of Housing Economics, Vol. 23, No. 3, pp. 136–153.
Tosun, Ö. (2012). ‘Using data envelopment analysis–neural network model to evaluate hospital effi ciency’, International Journal Productivity and Quality Management, Vol. 9, No. 2, pp. 245–257.
Tayyebia, A., Pijanowskia, B. C. and Tayyebi, A. H. (2011). ‘An urban growth boundary model using neural networks, GIS and radial parameterization: An application to Tehran, Iran’, Landscape and Urban Planning, Vol. 100, No. 1–2, pp. 35–44.
Turkish Real Estate Market Report (2014), Deloitte Turkey.Wu, D.,Yang, Z. and Liang, L. (2006). ‘Using DEA-neural network approach to evaluate branch effi ciency of a large
Canadian bank’, Expert Systems with Applications, Vol. 31, No. 1, pp. 108–111.Yan, Y., Xu, W., Bu, H., Song, Y, Zhang, W., Yuan, H. and Wang, S.-Y. (2007). ‘Method for Housing Price Forecasting
based on Methodology’, Systems Engineering – Theory & Practice, Vol. 27, No. 7, pp. 1–9.Yuksel, A. (2016). ‘The relationship between stock and real estate prices in Turkey: Evidence around the global
fi nancial crisis’, Central Bank Review, Vol. 16, No. 1, pp. 33–40.

© Faculty of Management University of Warsaw. All rights reserved. DOI: 10.7172/2449-6634.jmcbem.2017.1.2
Journal of Marketing and Consumer Behaviour in Emerging Markets 1(5)2017 15
(15–28)
Quality Attribute and Customer Satisfaction:Using Kano’s Model to Prioritize What Matters Most
to Customers
Norlia AhmadAssociate Professor
International Management CourseInstitute of Business and Accounting, Kwansei Gakuin University,
1-155 Uegahara Ichiban-cho, Nishinomiya Hyogo 662-8501, [email protected]
Received: 5 September 2016 / Revised: 5 January 2017 / Accepted: 19 January 2017 / Published online: 10 March 2017
ABSTRACT
Continuous innovations of smartphone attributes and increasing product usage call for better understanding of the attributes that matter most to customers. This study employs Kano’s model for classifying smartphone attributes into various categories and examines the infl uence of those attributes on the satisfaction of smartphone users. Based on consumer evaluation of the latest and general smartphone attributes, the analysis in this study indicates various levels of satisfaction and dissatisfaction with each attribute. Specifi cally, our fi ndings reveal merely three categories of Kano’s classifi cation, and ‘one-dimensional’ or performance attributes have higher infl uence on customer satisfaction as compared with ‘attractive’ ones. These fi ndings provide implications for further product improvement efforts to consider not only technological capabilities but also to prioritize the attributes that are highly expected by customers. The majority of the respondents in this study include the younger consumer segment and heavy smartphone users, thus limiting generalization of the results to other contexts. Further research should consider respondents across segments and/or in a specifi c market, and extend the focus beyond product attributes so as to include user experiences and explicit product benefi ts.
JEL classifi cation: M31, M15, L96
Keywords: quality attribute, customer satisfaction, Kano’s model, convergent product
1. INTRODUCTION
The convergent computer, communications and internet technologies lead to boundless innovations of consumer electronic products. A notable example is the continuous innovation of product and service attributes of smartphones. Smartphone evolved from merely a voice communication tool, known as ‘mobile phone’ in the early 1990s, into a multipurpose personal communications device. Convergent technologies have increased not only the functionalities of smartphone but also users’ dependence on the device in their daily lives. With rapid adoption of smartphone across the world, many companies now understand that providing various
© Faculty of Management University of Warsaw. All rights reserved. DOI: 10.7172/2449-6634.jmcbem.2017.1.2
Journal of Marketing and Consumer Behaviour in Emerging Markets 1(5)2017
Norlia Ahmad
16
(15–28)
attributes or functionalities in a single product can guarantee its market success. However, do the continuously introduced smartphone attributes and its functionalities meet customer expectations or even are they desirable by most customers? Berthon et al. (2005) argue that innovators view technology as an enabler for the development of new products while marketing tends to view technology as ‘a means to an end’. Both views refl ect the importance of technology for product development; however, understanding customers remains a central focus of marketing activities. For a technology-oriented product, it is reasonable for new product development to be ‘feasible’ at the outset, and with the right ‘insights’ of customer requirements, the product is further developed to be more desirable, i.e. by enhancing its attributes and functionalities. In other words, the success of a product is viewed as a function of technological capabilities and a deeper understanding of customer requirements and expectations. From the marketing perspective, meeting customers’ requirements and exceeding their expectations are prerequisites for high customer satisfaction and loyalty.
As the smartphone market has become increasingly saturated, it is becoming more critical for companies to meet customer expectations in product development efforts and identify what attribute matters most to customers. Understanding customers, who they are and what they want is part of the studies known as the voice of customers (VOC). VOC is normally conducted at the start of a new product, process or service design and typically includes identifying a set of detailed customer requirements and summarizing them into a hierarchy where each requirement is prioritized according to its importance to customers (see Griffi n and Hauser, 1993). Customer requirements often include product attributes that satisfy various needs; a product or service is likely to be more desirable when it fulfi lls more than one requirement or ‘need’. Customer requirement is dynamic and context-dependent; for example, new attributes that excite customers today will eventually shift to being merely an expected requirement of the product or service, and the importance of each attribute also tends to vary across customers. Thus, it is important for companies to update their understanding of customer expectations to ensure continuous success of any new and/or enhanced product attribute.
The main purpose of this study is to explore the relationship between the quality attribute and customer satisfaction. It employs Kano method for classifying smartphone attributes into various categories and further examines the infl uence of those attributes on the satisfaction of smartphone users. Kano’s method is commonly used for defi ning new product attributes; however, an analysis of the recently introduced attributes is also valuable for further product enhancement, i.e. to prioritize the importance of each attribute from the customer’s perspective. This analysis would allow future technological capabilities to consider attributes that are highly expected by customers. Although the importance of various smartphone attributes may vary across its users, there is increasing customers’ dependence on smartphone in their daily lives. This necessitates a deeper understanding of what attributes matter most to customers. The remaining parts of this paper are as follows; section two reviews existing literature on Kano’s model; section three discusses data collection and descriptions of Kano’s classifi cation method; section four provides discussions of our fi ndings; and fi nally, section fi ve discusses conclusions of the study and provides directions for further research.
2. LITERATURE REVIEW
Different terminologies of ‘needs’, ‘wants’, ‘features’, ‘requirements’, ‘benefi ts’ or ‘attributes’ are sometimes used interchangeably across marketing, engineering and industrial design literatures (see Bayus, 2008). Krishnan and Ulrich (2001) indicate that a useful representation of a product is a vector of attributes which also include customer needs, requirements, product specifi cations and technical performance metrics. Sanders and Dandavate (1999) indicate that

© Faculty of Management University of Warsaw. All rights reserved. DOI: 10.7172/2449-6634.jmcbem.2017.1.2
Journal of Marketing and Consumer Behaviour in Emerging Markets 1(5)2017
Norlia Ahmad
17
(15–28)
a thorough understanding of customer requirements and expectations requires researchers to learn about customers’ memories as well as their current and ideal usage experiences. In this regard, development of new or enhanced product attributes requires efforts to listen to what customers say, interpret what they express and make inferences about what they think, observe how they use a product or service and ‘uncover’ what they know. These efforts form the basis of VOC studies and information is normally gathered from observations, interviews, focus groups, surveys and questionnaires. Griffi n and Hauser (1993) argue that customer needs or requirements are a description of the benefi ts desired by customers. From a company’s perspective, the focus is often on new and enhanced product attributes; however, from a customer’s perspective, the main concentration is on the explicit benefi ts or the functionalities of those attributes. Thus, new development of smartphone attributes should consider ‘what technology can do’ as well as ‘what matters to customers’. Kano’s model focuses on addressing quality attributes in the perception of customers; thus, it provides insights for the developments of new or enhanced product attributes.
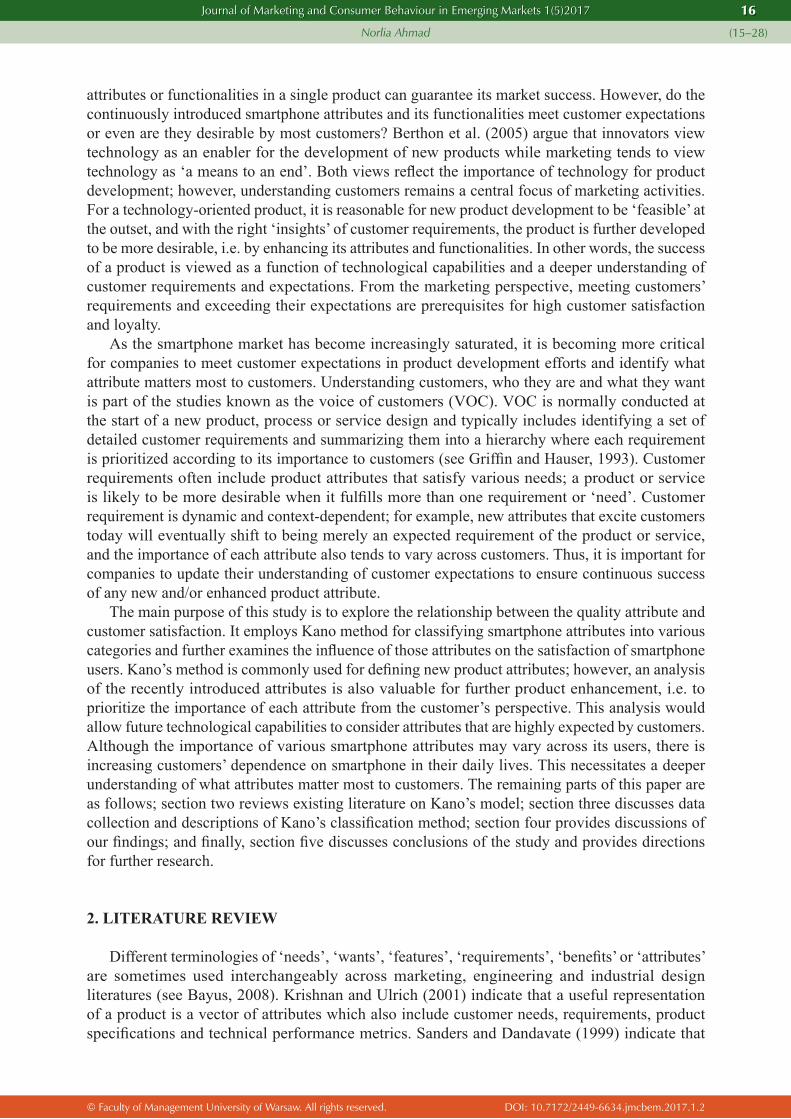
Kano’s model is widely cited in the analysis of the relationship between product attributes (or quality) and customer satisfaction, e.g. Yang (2005), Nilsson-Witell and Fundin (2005), Shahin and Zairi (2009), among others. Figure 1 illustrates Kano’s model; on the horizontal axis, the model shows the degree to which a particular product or service meets quality attributes as expected by customers, ranging from complete fulfi llment to non-fulfi llment of an attribute. The vertical axis indicates the level of customer satisfaction ranging from low to high; it refl ects customer satisfaction levels regarding a specifi c product attribute that meet his or her requirements. Within the two dimensions, Kano proposes four different categories of attribute – must-be, one-dimensional, attractive and indifferent.
Figure 1Kano’s Model of the Relationships between Fulfi llment of Product Attribute and Customer Satisfaction(adapted from Berger et.al, 1993)
High
Low
CustomerSatisfaction
Non-fulfillmentof qualityattribute
Fulfillmentof qualityattribute
Attractive
Indifferent
Must-be
One-dimensional(performance)
The fi rst category (bottom curve) is called must-be or basic attributes; these product attributes must be satisfi ed and must be of high quality as demanded by customers. Complete fulfi llment of these requirements cannot increase customer satisfaction but if they are not fulfi lled, the product or service will be rejected. The second category (middle curve) is known as one-dimensional or performance attributes and represents requirements which have a linear relationship with customer satisfaction. These requirements are normally addressed by considering inputs or requests from customers for product improvement purposes. The third category (upper curve) is

© Faculty of Management University of Warsaw. All rights reserved. DOI: 10.7172/2449-6634.jmcbem.2017.1.2
Journal of Marketing and Consumer Behaviour in Emerging Markets 1(5)2017
Norlia Ahmad
18
(15–28)
called attractive or exciting attributes, and represents requirements that customers do not expect to be satisfi ed. However, if these attributes are addressed, customers are delighted, thus a higher level of satisfaction; if not, it will not cause dissatisfaction. There are also attributes the presence or absence of which does not make a real difference to customer satisfaction. These attributes fall along the middle of satisfaction level (where the horizontal axis intersects it) and are referred to as indifferent attributes. A ‘reverse’ attribute is considered as the opposite of ‘one-dimensional’ attribute; it decreases satisfaction if fulfi lled, and increases satisfaction if not fulfi lled, thus it is not considered in our analysis.
Kano’s model is adopted and modifi ed by researchers in a wide range of industries, for example the applications of the model in the airlines sector by Shahin and Zairi (2009), web-community service attribute by Kuo (2004), teaching attribute by Chien (2007), among others. In the most recent research, Song (2016) focuses on Kano’s wording and its impact on smartphone attributes classifi cation. Advantages of classifying smartphone attributes based on Kano’s model include better understanding of these attributes, i.e. attributes that have the greatest infl uence on customer satisfaction can be identifi ed. Classifi cations of product attributes into must-be, one-dimensional, attractive and indifferent categories are useful for new product development and/or further enhancement of these attributes based on their infl uence on customer satisfaction. Indifferent and must-be attributes do not lead to high customer satisfaction and are more critical during the outset development of a new product as compared with the improvement of its attributes. Lee et al. (2013) note that must-be attributes are basic customer expectations and are often taken for granted in evaluating product performance. Must-be attributes are the minimum product requirements; a product or service that merely satisfi es basic requirements and/or meets standard performance criteria is often perceived as mediocre and cannot lead to high customer satisfaction and loyalty. Given a saturated smartphone market, companies tend to compete by introducing the most advanced attributes enabled by the latest technologies to attract customers and increase product usage. However, not all of new attributes are expected or desirable by customers. As this study focuses on the general and most recent smartphone attributes, we expect the following:
Hypothesis 1: Consumer evaluation of smartphone quality attributes will merely refl ect the three categories of Kano’s classifi cations, i.e. one-dimensional, attractive and indifferent.
One of the commendable features of Kano’s model is that it provides valuable benefi ts in trade-off situations during the product improvement stage. For example, if one-dimensional or attractive attributes cannot be met simultaneously due to technological constraints or fi nancial reasons, the attribute which has the greatest infl uence on customer satisfaction can be identifi ed and prioritized (see Shahin et al., 2012). Moreover, Kano’s model has no technical limitations regarding the number of attributes to be included in any study. This is particularly useful for a technology-oriented product such as smartphone that is used as a multi-purpose communication device and subject to boundless innovations of its attributes. At the maturity stage of a product life cycle, discovering and fulfi lling customer requirements for one-dimensional and attractive attributes of a product or service will create a wide range of possibilities for differentiation strategies. In a highly saturated smartphone market, it is more crucial to focus on one-dimensional and attractive categories as they have greater infl uences on customer satisfaction. Although the importance of smartphone attributes may vary across users, identifying one-dimensional and attractive categories reveals specifi c attributes that guarantee the optimal level of satisfactions. In this study, the quality attributes refl ect the general and latest smartphone attributes which are made possible by technological capabilities such as convergent technology; therefore, we expect the following:

© Faculty of Management University of Warsaw. All rights reserved. DOI: 10.7172/2449-6634.jmcbem.2017.1.2
Journal of Marketing and Consumer Behaviour in Emerging Markets 1(5)2017
Norlia Ahmad
19
(15–28)
Hypothesis 2: Customer evaluation of smartphone attributes will equally refl ect one-dimensional and attractive attributes.
Kano’s model directly deals with customer requirements and acknowledges that customer needs and expectations evolve; an attractive attribute today will eventually shift to being a one-dimensional attribute and over time will become a must-be or basic requirement. For example, short messaging service (SMS) was perceived as an attractive service attribute in the 1990s; in the ‘convergent era’, text message is now considered as merely a basic requirement for many people. Apart from providing useful insights on the evolutionary aspect of customer requirements for a product, Kano’s model also serves as a useful tool for classifying and prioritizing attributes that have greater infl uence on customer satisfaction. It basically stipulates that one-dimensional and attractive categories have greater infl uence on customer satisfaction; it is worth identifying which category has greater infl uence on satisfaction as well as the extent of their infl uence on customer satisfaction. Despite various new smartphone attributes enabled by the latest technologies such as 3D functions and multi-tasking, we presume that attributes that are associated with enhancing user’s productivity and usage experience such as processing speed and internet speed have higher infl uence on customer satisfaction. Thus, we expect the following:
Hypothesis 3: One-dimensional or performance attributes have higher infl uence on customer satisfaction than the attractive smartphone attributes.
To sum up, evolution of technologies and customer needs or product requirements calls for dynamic frameworks such as Kano’s model in order to capture the importance of VOC with regard to product innovations. Specifi c quality attributes and the extent of their infl uence on customer satisfaction can be analyzed through various research methods such as implementing Kano’s survey. To enhance the effectiveness of Kano’s survey, it is important for the respondents to be familiar with the method before the survey is conducted. This is because the questionnaires in the survey normally consist of two sections of functional and dysfunctional forms, i.e. how do you feel if a certain attribute is present in a product or service, and how do you feel if the attribute is not present in a product or service? These two sections concern customer response about including (functional question) or omitting (dysfunctional question) an attribute, and this might be confusing for respondents who have never heard of Kano’s method. In addition, the wording of the questionnaires should be crystal clear and refl ect a specifi c attribute of the product under study. Thus, a brief introduction to Kano’s model and the methodical design of the questionnaires is critical to facilitate more reliable responses. Some researchers such as Nilsson-Witell and Fundin (2005), Mikulic and Prebazac, (2011) and Song (2016) modifi ed the questionnaire design to reduce the interference between functional and dysfunctional questions. This paper employs Kano’s approach for classifi cations of product or quality attributes; our questionnaires are designed to refl ect the general and latest smartphone attributes and customer satisfaction.
3. METHODOLOGY
Kano et al. (1984) classify various product attributes into ‘must be’, ‘one-dimensional’, ‘attractive’, ‘questionable’, ‘reverse’ and ‘indifferent’ categories. Figure 2 shows Kano’s method using a structured questionnaire consisting of pairs of questions for product or service attributes. The example of functional and dysfunctional questions (top left side of the fi gure) refl ects one of the questionnaires used in our survey on smartphone attributes. Following Kano’s method, one question in the pair asks about the customer’s feelings in the case of fulfi llment of an attribute, or a “functional question”, and the other question asks about customer’s feelings for non-fulfi llment

© Faculty of Management University of Warsaw. All rights reserved. DOI: 10.7172/2449-6634.jmcbem.2017.1.2
Journal of Marketing and Consumer Behaviour in Emerging Markets 1(5)2017
Norlia Ahmad
20
(15–28)
of a smartphone attribute, or “dysfunctional question”. For example, if a respondent answers “I like it that way” as regards the functional question of “If the call connections of your smartphone are good, how do you feel?”; and “I dislike it that way” as regards the dysfunctional question of “If the call connections of your smartphone are bad, how do you feel?”, the combination of his or her response will be categorized as ‘O = One-dimensional or performance’ attribute based on Kano’s evaluation table at the bottom of Figure 2. This indicates that call connectivity is a one-dimensional attribute, i.e. more improvement of this attribute performance will lead to higher level of the respondent’s satisfaction. A similar process is repeated for all answers of the respondents. The next step is calculations of frequencies for every response in order to provide the fi nal classifi cation or category of all smartphone attributes. The classifi cation results are discussed in the fi ndings section.
Figure 2Kano’s method, adapted from Berger et al. (1993)
Functionalform of the question
If the call connections of your smartphone are good, how do you feel?
1. I like it that way2. I expect it that way3. I am neutral4. I can tolerate it that way5. I dislike it that way
Dysfunctionalform of the question
If the call connections of your smartphone are bad, how do you feel?
1. I like it that way2. I expect it that way3. I am neutral4. I can tolerate it that way5. I dislike it that way
Customer requirement, i.e.smartphone attributes
Answer to dysfunctional (negative) question
Like Expect Neutral Tolerate Dislike
Answerto functional (positive) question
Like Q A A A O
Expect R I I I M
Neutral R I I I M
Tolerate R I I I M
Dislike R R R R Q
Kano’s Evaluation Table:
Smartphone attributes M O A Q R I Total Category
of Kano’s model
1. 1 1 O
2.
3.
…
(Note: M = Must be; O = One-dimensional or performance; A = Attractive; Q = Questionable; R = Reverse; I = Indifferent)
As mentioned in the previous section, one of the major challenges of implementing Kano’s method is to ensure that target respondents understand the nature of Kano’s survey which includes the functional and dysfunctional parts of questionnaires. In this regard, it is important to provide a brief introduction of Kano’s method to the respondents. As indicated in Ahmad (2014), the young segment of consumers is the heaviest users of mobile communication; they use smartphone for various purposes and are very familiar with its latest attributes. This segment of users is
© Faculty of Management University of Warsaw. All rights reserved. DOI: 10.7172/2449-6634.jmcbem.2017.1.2
Journal of Marketing and Consumer Behaviour in Emerging Markets 1(5)2017
Norlia Ahmad
21
(15–28)
regarded as ‘lead users’; they are normally customers who are ahead of market trends and have communication needs that go far beyond those of the average users. To enhance reliability of the responses, this study ensures that fi rst, target respondents are among the heaviest smartphone users and second, they are briefl y informed about the functional and dysfunctional questions prior to the survey.
The questionnaires of this survey include the latest and general attributes of smartphone derived from product specifi cations of leading smartphone manufacturers and recent articles on smartphone features and convergent products, such as Song (2016), Ganesan and Sridhar (2014) and Lee et al. (2012). Our selected product attributes refl ect the quality attributes commonly used in smartphone research such as in Song (2016); they include memory, battery usage time, screen size, display resolution, depth, weight, camera solution, build, sound quality, crash resistance, water resistance, voice recognition, fi ngerprint sensors, processing speed, wireless charger, battery charging time, multitasking, 3D function, accidental damage warranty, internet speed and call connectivity. Although internet speed used to be regarded as an online related service, and call connectivity as a basic function, they are included as ‘general attributes’ to refl ect the current nature of smartphone as a convergent product (see Lee et al., 2012).
This survey employs the purposive sampling technique in which the author identifi es three graduate students who have experienced or are familiar with Kano’s questionnaires. These students serve as research assistants (RAs) for the data collection purpose and their primary task is to brief target respondents about the nature of Kano’s survey particularly, on the functional and dysfunctional aspects of Kano’s questionnaires prior to participation of the respondents. These RAs were requested to distribute the questionnaires to smartphone users in the university campus as well as outside the campus within the period of six weeks, from October 10th until November 21st, 2016. The reason behind the chosen sampling technique and data collection was to gather a sample of appropriate size within a time constraint and to ensure that respondents had a brief understanding of the unique nature of Kano’s questionnaires before participating in the survey. Table 1 shows the profi les of the respondents in this survey. As shown in the table, about 86% of the respondents are the young segment of smartphone users. Although this survey was conducted in Japan; the respondents included both local and international students or residents from 29 countries; about 74% from Asia, and the remaining 26% included the respondents from Europe, North America and Africa.
Table 1Profi les of Respondents
GenderTotal Percentage
Male 53 44.92%Female 65 55.08%
Age Group20–29 101 86%30–39 13 11%40–49 4 3%Total 118 100%
RegionAsia 87 73.7%Europe 11 9.3%North America 10 8.5%Africa 10 8.5%Total 118 100%

© Faculty of Management University of Warsaw. All rights reserved. DOI: 10.7172/2449-6634.jmcbem.2017.1.2
Journal of Marketing and Consumer Behaviour in Emerging Markets 1(5)2017
Norlia Ahmad
22
(15–28)
4. FINDINGS
Table 2 shows classifi cation results of smartphone attributes ranging from call connectivity to accidental damage warranty. Description of each smartphone attribute employed in this study is included in the appendix. As shown on the right side of Table 2, call connectivity, internet speed, memory, battery usage time, camera resolution, sound quality, crash resistance, fi nger print sensors, processing speed are categorized as performance or ‘one-dimensional’ in Kano’s method of classifi cation. These attributes have a linear relationship with customer satisfaction in which better performance of each attribute will lead to a higher level of customer satisfaction. Display resolution, water resistance, wireless charger, battery charging time, accidental damage warranty are categorized as ‘attractive’ attributes. Attractive or exciting attributes refl ect the requirements that customers do not expect to be satisfi ed, but if they are addressed, the customers will have a high level of satisfaction, and if not satisfi ed, it will not cause their dissatisfaction.
Table 2Classifi cation of Smartphone Attributes Based on Kano’s Method
Smartphone Attributes M O A Q R I Total Category of Kano’s model
1. Call connectivity 41 43 15 18 0 1 118 One-dimensional
2. Internet speed 17 75 17 7 0 2 118 One-dimensional
3. Memory 12 50 31 24 1 0 118 One-dimensional
4. Battery usage time 12 49 33 20 0 4 118 One-dimensional
5. Screen size 10 13 32 37 1 25 118 Indifferent
6. Display resolution 12 22 41 41 1 1 118 Attractive
7. Depth 1 3 8 63 0 43 118 Indifferent
8. Weight 1 73 4 40 0 0 118 One-dimensional
9. Camera resolution 14 45 37 21 0 1 118 One-dimensional
10. Build 16 25 33 41 0 3 118 Indifferent
11. Sound quality 18 41 28 29 0 2 118 One-dimensional
12. Crash resistance 10 51 30 25 1 1 118 One-dimensional
13. Water resistance 2 29 55 32 0 0 118 Attractive
14. Voice recognition 4 27 19 66 1 1 118 Indifferent
15. Fingerprint sensors 22 38 22 34 0 2 118 One-dimensional
16. Processing speed 16 63 24 14 1 0 118 One-dimensional
17. Wireless charger 2 20 58 35 0 3 118 Attractive
18. Battery charging time 6 38 42 30 1 1 118 Attractive
19. Multitasking 10 24 29 52 1 2 118 Indifferent
20. 3D function 1 11 42 58 0 6 118 Indifferent
21. Accidental damage warranty 13 31 45 28 0 1 118 Attractive
(Note: M = Must be; O = One-dimensional or performance; A = Attractive; Q = Questionable; R = Reverse; I = Indifferent)
Screen size, depth, build, voice recognition, multitasking, 3D function are categorized as ‘indifferent’ attributes. This category implies that the presence or absence of those attributes does not make a real difference to the satisfaction of smartphone users included in this survey. As we expected, none of the general attributes are considered as ‘must-be’ attributes; this supports
© Faculty of Management University of Warsaw. All rights reserved. DOI: 10.7172/2449-6634.jmcbem.2017.1.2
Journal of Marketing and Consumer Behaviour in Emerging Markets 1(5)2017
Norlia Ahmad
23
(15–28)
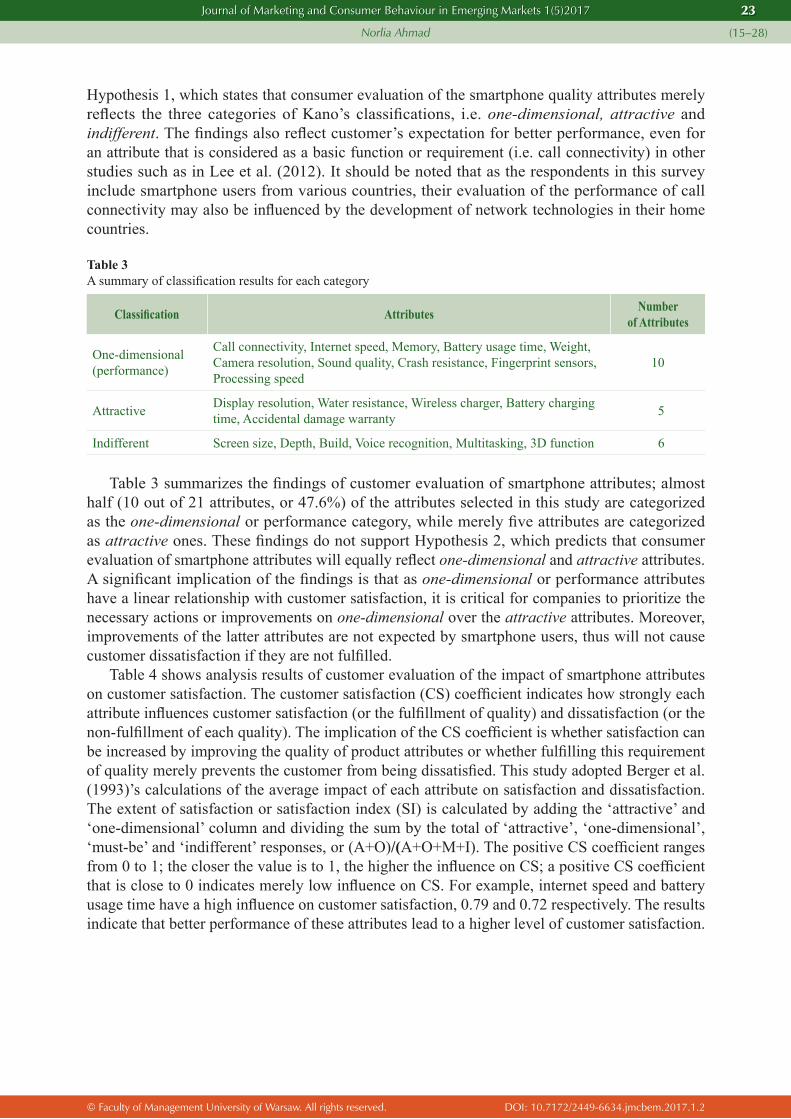
Hypothesis 1, which states that consumer evaluation of the smartphone quality attributes merely refl ects the three categories of Kano’s classifi cations, i.e. one-dimensional, attractive and indifferent. The fi ndings also refl ect customer’s expectation for better performance, even for an attribute that is considered as a basic function or requirement (i.e. call connectivity) in other studies such as in Lee et al. (2012). It should be noted that as the respondents in this survey include smartphone users from various countries, their evaluation of the performance of call connectivity may also be infl uenced by the development of network technologies in their home countries.
Table 3A summary of classifi cation results for each category
Classifi cation Attributes Numberof Attributes
One-dimensional (performance)
Call connectivity, Internet speed, Memory, Battery usage time, Weight, Camera resolution, Sound quality, Crash resistance, Fingerprint sensors, Processing speed
10
Attractive Display resolution, Water resistance, Wireless charger, Battery charging time, Accidental damage warranty 5
Indifferent Screen size, Depth, Build, Voice recognition, Multitasking, 3D function 6
Table 3 summarizes the fi ndings of customer evaluation of smartphone attributes; almost half (10 out of 21 attributes, or 47.6%) of the attributes selected in this study are categorized as the one-dimensional or performance category, while merely fi ve attributes are categorized as attractive ones. These fi ndings do not support Hypothesis 2, which predicts that consumer evaluation of smartphone attributes will equally refl ect one-dimensional and attractive attributes. A signifi cant implication of the fi ndings is that as one-dimensional or performance attributes have a linear relationship with customer satisfaction, it is critical for companies to prioritize the necessary actions or improvements on one-dimensional over the attractive attributes. Moreover, improvements of the latter attributes are not expected by smartphone users, thus will not cause customer dissatisfaction if they are not fulfi lled.
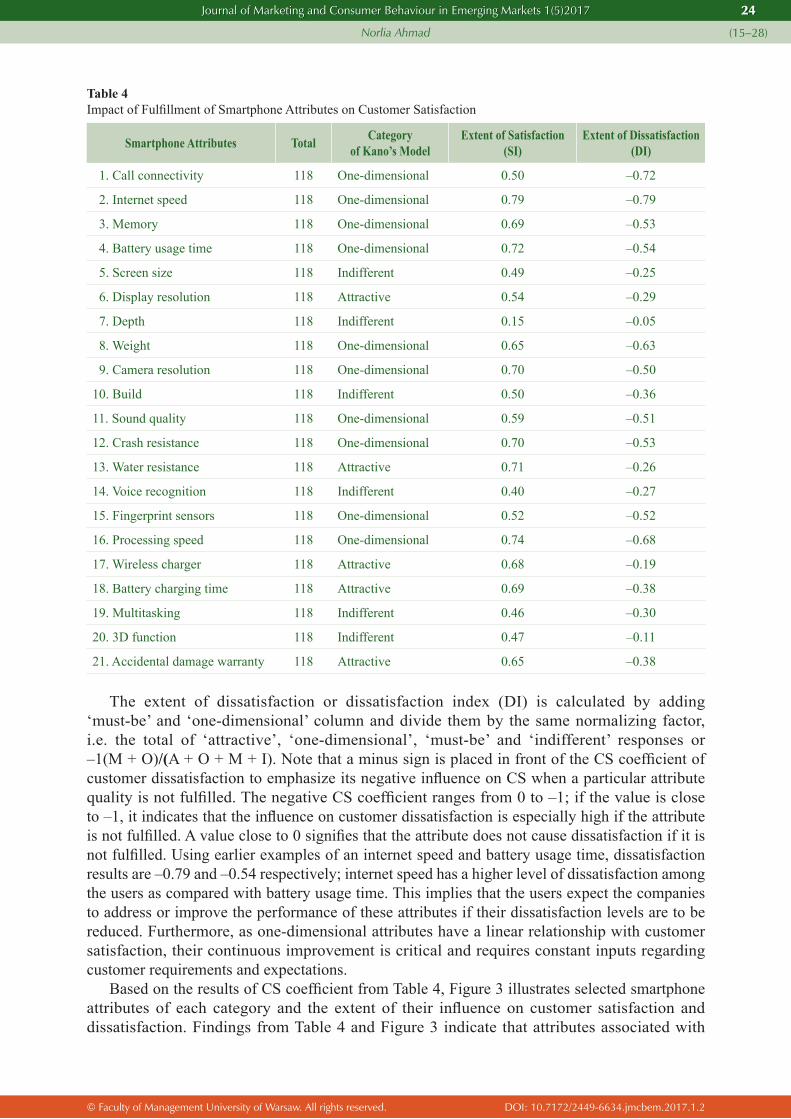
Table 4 shows analysis results of customer evaluation of the impact of smartphone attributes on customer satisfaction. The customer satisfaction (CS) coeffi cient indicates how strongly each attribute infl uences customer satisfaction (or the fulfi llment of quality) and dissatisfaction (or the non-fulfi llment of each quality). The implication of the CS coeffi cient is whether satisfaction can be increased by improving the quality of product attributes or whether fulfi lling this requirement of quality merely prevents the customer from being dissatisfi ed. This study adopted Berger et al. (1993)’s calculations of the average impact of each attribute on satisfaction and dissatisfaction. The extent of satisfaction or satisfaction index (SI) is calculated by adding the ‘attractive’ and ‘one-dimensional’ column and dividing the sum by the total of ‘attractive’, ‘one-dimensional’, ‘must-be’ and ‘indifferent’ responses, or (A+O)/(A+O+M+I). The positive CS coeffi cient ranges from 0 to 1; the closer the value is to 1, the higher the infl uence on CS; a positive CS coeffi cient that is close to 0 indicates merely low infl uence on CS. For example, internet speed and battery usage time have a high infl uence on customer satisfaction, 0.79 and 0.72 respectively. The results indicate that better performance of these attributes lead to a higher level of customer satisfaction.
© Faculty of Management University of Warsaw. All rights reserved. DOI: 10.7172/2449-6634.jmcbem.2017.1.2
Journal of Marketing and Consumer Behaviour in Emerging Markets 1(5)2017
Norlia Ahmad
24
(15–28)
Table 4Impact of Fulfi llment of Smartphone Attributes on Customer Satisfaction
Smartphone Attributes Total Categoryof Kano’s Model
Extent of Satisfaction(SI)
Extent of Dissatisfaction(DI)
1. Call connectivity 118 One-dimensional 0.50 –0.72
2. Internet speed 118 One-dimensional 0.79 –0.79
3. Memory 118 One-dimensional 0.69 –0.53
4. Battery usage time 118 One-dimensional 0.72 –0.54
5. Screen size 118 Indifferent 0.49 –0.25
6. Display resolution 118 Attractive 0.54 –0.29
7. Depth 118 Indifferent 0.15 –0.05
8. Weight 118 One-dimensional 0.65 –0.63
9. Camera resolution 118 One-dimensional 0.70 –0.50
10. Build 118 Indifferent 0.50 –0.36
11. Sound quality 118 One-dimensional 0.59 –0.51
12. Crash resistance 118 One-dimensional 0.70 –0.53
13. Water resistance 118 Attractive 0.71 –0.26
14. Voice recognition 118 Indifferent 0.40 –0.27
15. Fingerprint sensors 118 One-dimensional 0.52 –0.52
16. Processing speed 118 One-dimensional 0.74 –0.68
17. Wireless charger 118 Attractive 0.68 –0.19
18. Battery charging time 118 Attractive 0.69 –0.38
19. Multitasking 118 Indifferent 0.46 –0.30
20. 3D function 118 Indifferent 0.47 –0.11
21. Accidental damage warranty 118 Attractive 0.65 –0.38
The extent of dissatisfaction or dissatisfaction index (DI) is calculated by adding ‘must-be’ and ‘one-dimensional’ column and divide them by the same normalizing factor, i.e. the total of ‘attractive’, ‘one-dimensional’, ‘must-be’ and ‘indifferent’ responses or –1(M + O)/(A + O + M + I). Note that a minus sign is placed in front of the CS coeffi cient of customer dissatisfaction to emphasize its negative infl uence on CS when a particular attribute quality is not fulfi lled. The negative CS coeffi cient ranges from 0 to –1; if the value is close to –1, it indicates that the infl uence on customer dissatisfaction is especially high if the attribute is not fulfi lled. A value close to 0 signifi es that the attribute does not cause dissatisfaction if it is not fulfi lled. Using earlier examples of an internet speed and battery usage time, dissatisfaction results are –0.79 and –0.54 respectively; internet speed has a higher level of dissatisfaction among the users as compared with battery usage time. This implies that the users expect the companies to address or improve the performance of these attributes if their dissatisfaction levels are to be reduced. Furthermore, as one-dimensional attributes have a linear relationship with customer satisfaction, their continuous improvement is critical and requires constant inputs regarding customer requirements and expectations.
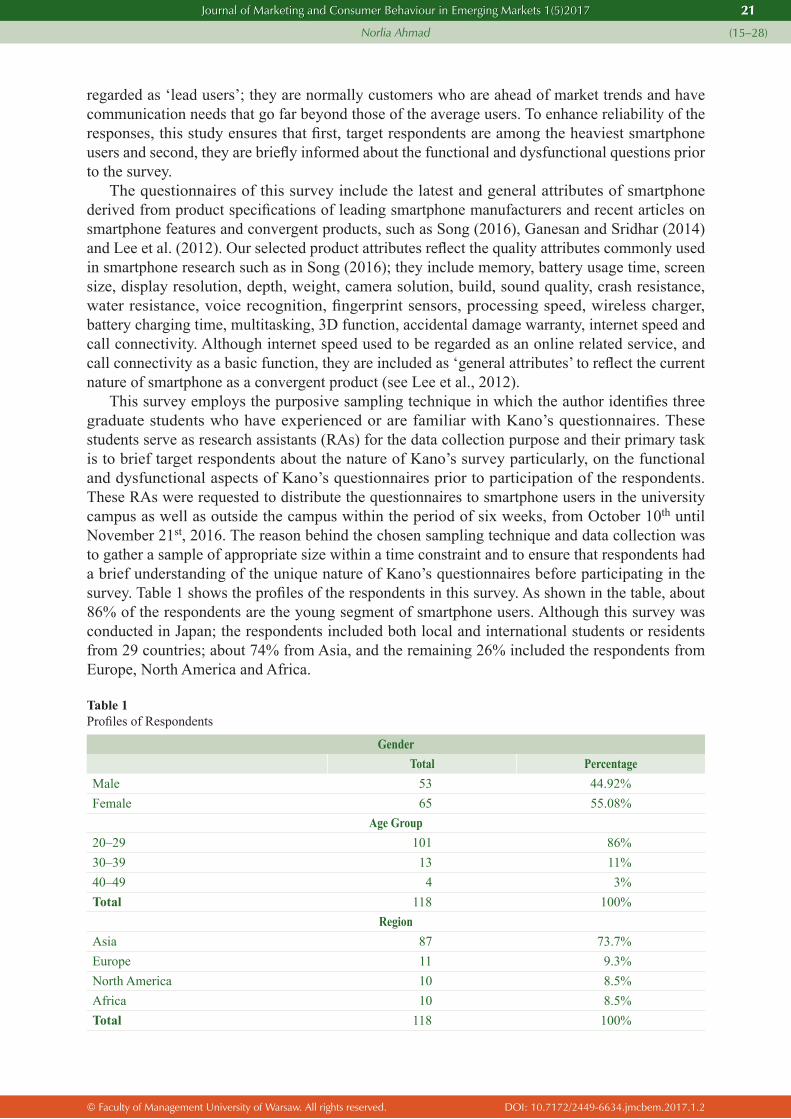
Based on the results of CS coeffi cient from Table 4, Figure 3 illustrates selected smartphone attributes of each category and the extent of their infl uence on customer satisfaction and dissatisfaction. Findings from Table 4 and Figure 3 indicate that attributes associated with

© Faculty of Management University of Warsaw. All rights reserved. DOI: 10.7172/2449-6634.jmcbem.2017.1.2
Journal of Marketing and Consumer Behaviour in Emerging Markets 1(5)2017
Norlia Ahmad
25
(15–28)
enhancing user’s productivity and usage experience such as processing speed and internet speed have higher infl uence on customer satisfaction, SI of 0.79 and 0.74 respectively, while attributes that are associated with the latest convergent technologies such as 3D functions and multi-tasking are 0.47 and 0.46. The fi ndings support Hypothesis 3, which presumes that one-dimensional or performance attributes have higher infl uence on customer satisfaction than the attractive attributes. Notably, attributes of attractive category such as display resolution and wireless charger also have a relatively lower impact of customer satisfaction when compared with battery usage time, internet speed and the processing speed of applications in a smartphone.
Figure 3 also illustrates that ‘one-dimensional’ attributes have a greater impact on customer satisfaction and dissatisfaction as compared with ‘attractive’ and ‘indifferent’ attributes; this is parallel to the general prioritization rule of thumb for the importance of attributes, i.e. Must-be > One-dimensional > Attractive > Indifferent. Thus, improvement of one-dimensional attributes such as internet and processing speed will not only lead to a higher level of customer satisfaction but also reduce dissatisfaction. Further enhancements of ‘attractive’ attributes such as a wireless charger, water resistance and display resolution will lead to a higher level of customer satisfaction than the current satisfaction level. Although these attributes are not expected by the customers, their improvements will delight the smartphone users. ‘Indifferent’ attributes such as depth (thickness or thinness of the device), 3D function and multi-tasking refl ect a low infl uence on customer satisfaction and dissatisfaction, thus, should be the last to be considered for future product enhancement efforts.
Figure 3Selected Smartphone Attributes and the Extent of Their Impact on Customer Satisfaction and Dissatisfaction
Attractive One-dimensional
Indifferent Must-be
Waterresistance
Wirelesscharger
Displayresolution
3D function
Depth
Multi-tasking
Callconnectivity
Processing speed
Batteryusage time
Internetspeed
Satisfaction
Dissatisfaction
0.9
0.7
0.5
0.3
0.1
–0.1 –0.3 –0.5 –0.7 –0.9
Kano’s model holds that ‘one-dimensional’ attributes have a signifi cant impact on customer dissatisfaction. Thus, improvement of these attributes should be prioritized to minimize customer dissatisfaction. The results indicate that attributes associated with productivity and usage experience are critical to increase customer satisfaction and decrease dissatisfaction. Different

© Faculty of Management University of Warsaw. All rights reserved. DOI: 10.7172/2449-6634.jmcbem.2017.1.2
Journal of Marketing and Consumer Behaviour in Emerging Markets 1(5)2017
Norlia Ahmad
26
(15–28)
consumer segments of smartphone tend to have different product or service requirements and expectations. Note that, in this survey, the majority of the respondents are among the heaviest product users, aged 20–29. As smartphone is characterized as a convergent product, many users use the device beyond personal and social communication needs; they heavily depend on smartphone for work or study-related activities. Interestingly, the result indicates that smartphone depth has the lowest impact on customer satisfaction and dissatisfaction; this refl ects indifferent users’ feeling toward the attribute. In a saturated smartphone market, distinctive product features or points of difference (POD) of the ‘hardware’ such as premium design or thickness or thinness of the device among the competing brands are of relatively low importance. Thus, customers tend to expect attributes that are associated with product performance that enhance user’s productivity and usage experience such as processing speed of its applications and internet speed.
5. CONCLUSIONS
Continuous developments of smartphone attributes are to be expected as the product is highly infl uenced by technological advancements and increasing usage among the customers. As smartphone users heavily depend on the product for multi-purpose communication activities, it is critical to examine the impact of each new attribute on customer satisfaction. The analysis of this study reaffi rms that development efforts of product attributes should be directed at not only what a product (technology) can do but also on the attributes that matter to customers. This study employs Kano’s method in classifying various smartphone attributes into ‘one-dimensional’, ‘attractive’, and ‘indifferent’ category and examines the impact of those attributes on customer satisfaction. These classifi cations are useful to prioritize attributes that matter most to customers, and are particularly crucial for a technology-oriented product such as smartphone in which boundless new product attributes are developed. A signifi cant implication of the analysis is that a deeper understanding of the link between existing smartphone attributes and customer satisfaction may lead to better product improvement efforts, and possibly anticipate future attributes that are highly expected by customers.
The fi ndings of this study indicate various levels of satisfaction and dissatisfaction with the general and latest smartphone attributes in the perception of customers. Further product improvement activities follow the general prioritization rule, i.e. ‘Must-be > One-dimensional > Attractive > Indifferent’; our fi ndings provide not only better understanding of customer requirements and satisfaction but also insights on specifi c smartphone attributes that matter most to customers. To strengthen competitive position and ensure high customer satisfaction (and minimize dissatisfaction), development activities can be directed at improving call connectivity, internet speed, memory, battery usage time, weight camera resolution, sound quality, crash resistance, fi ngerprint sensors and processing speed. To gain competitive advantage through differentiation strategies, further enhancement efforts are to be channeled at ‘attractive’ attributes such as display resolution, water resistance, wireless charger, battery charging time and accidental damage warranty. Further investment and improvement of smartphone attributes such as screen size, depth, build, voice recognition, multitasking, and 3D function are to be carefully considered as the results indicate that their presence or absence does not make a real difference to customer satisfaction.
Kano’s model is an instrumental and a dynamic tool for efforts to develop new products and to examine customer satisfaction with its exiting attributes at various stages of the product life cycle. It should be noted that Kano’s model is inherently customer-driven, i.e. focuses exclusively on addressing concerns of customers (see Sireli et al., 2007). As such, from the product development perspective, it disregards the main concern of companies in terms of their capabilities and/or cost constraints to meet customer requirements. It is worth mentioning that to some extent, the quality

© Faculty of Management University of Warsaw. All rights reserved. DOI: 10.7172/2449-6634.jmcbem.2017.1.2
Journal of Marketing and Consumer Behaviour in Emerging Markets 1(5)2017
Norlia Ahmad
27
(15–28)
of the questionnaires, interviewer(s) and target respondents is more crucial for the reliability and validity of research based on Kano’s method as compared with other consumer surveys. Thus, a rewarding application of Kano’s method requires a thoughtful design of the questionnaires, clarity of the functional and dysfunctional questions and respondents’ familiarity with Kano’s method. These are the main challenges in conducting a survey based on the method; this study made utmost efforts in dealing with the challenges in order to enhance the effectiveness of our survey. Finally, as the importance of smartphone attributes differs in various contexts and across segments, generalization of the fi ndings should consider the followings: fi rst, the respondents of this survey include mainly young and heavy users of smartphone and second, although the survey was conducted in Japan, the respondents included smartphone users from 29 different countries. Future research should include a larger sample size across segments and/or in a specifi c market(s) and consider a questionnaire design that focuses on customer benefi ts instead of product attributes.
References
Ahmad, N. (2014) ‘Exploring customer needs and Kano model: A preliminary study of perceived needs of smartphone users in Japan’, Asia Pacifi c Marketing Review, Vol. 3, No. 2, pp. 123–133.
Bayus, B. (2008) Understanding customer needs. In S. Shane (ed.), Handbook of Technology and Innovation Management (pp. 115–141). West Sussex, UK: Wiley.
Berger, C., Blauth, R., Boger, D., Bolster, C., Burchill, G. and DuMouchel, W. (1993) ‘A special issues on Kano’s methods for understanding customer-defi ned attribute’, Center for Attribute Management Journal, Vol. 2, No. 4, pp. 3–35.
Berthon, P., Mac Hulbert, J. and Pitt, L. (2005) ‘Consuming technology: why marketers sometimes get it wrong’, California Management Review, Vol. 48, No. 1, pp. 110–127.
Chien, T.K. (2007) ‘Using the learning satisfaction improving model to enhance the teaching quality’, Quality Assurance in Education, Vol. 15, No. 2, pp.192–203.
Ganesan, P. and Sridhar, M. (2014) ‘Smartphone attribute choice and brand importance for millennial customers’, The Journal of Contemporary Management Research, Vol. 8, No. 2, pp. 71–89.
Griffi n, A. and Hauser, J. (1993) ‘The voice of the customer’, Marketing Science, Vol. 12, No. 1, pp. 1–27.Kano, N., Tsuji, S., Seraku, N. and Takahashi, F. (1984) ‘Attractive attribute and must be attribute’, Hinshitsu: The
Journal of Japanese Society for Attribute Control, Vol. 14, No. 2, pp. 39–48.Kuo, Y.F. (2004) ‘Integrating Kano’s model into web-community service attribute’, Total Attribute Management,
Vol. 15, No. 7, pp. 925–939.Krishnan, V. and Ulrich, K. (2001) ‘Product development decisions: A review of the literature’, Management Science,
Vol. 47, No. 2, pp. 1–21.Lee, S., Lee, J.H. and Garrett, T.C. (2013) ‘A study of the attitude toward convergent products: A focus on the
consumer perception of functionalities’, Journal of Product Innovation Management, Vol. 30, No. 1, pp. 123–135.
Mikulic, J. and Prebezac, D. (2011) ‘A critical review of techniques for classifying quality attributes in the Kano model’, Managing Service Quality, Vol. 21, No. 1, pp. 46–66.
Nilsson-Witell, L. and Fundin, A. (2005) ‘Dynamics of service attributes: a test of Kano theory of attractive attribute’, International Journal of Service Industry Management, Vol. 16, No. 2, pp. 152–168.
Sanders, E. and Dandavate, U. (1999) Design for experiencing: New tools. In C. Overbeeke and P. Hekkert (eds), Proceedings of the First International Conference on Design and Emotion, Delft.
Shain, A. and Zairi, M. (2009) ‘Kano model: a dynamic approach for classifying and prioritizing needs of airline travelers with three case studies on international airlines’, Total Attribute Management and Business Excellence, Vol. 20, No. 9, pp. 103–128.
Sireli, Y., Kauffmann, P. and Ozan, E. (2007) ‘Integrating SERVQUAL and Kano’s model into QFD for service excellence development’, IEEE Transaction on Engineering Management, Vol. 54, No. 2, pp. 380–390.
Song, H. (2016) ‘A critical review of Kano’s wording and its impact on attribute classifi cation: A case study of smartphone in Korea’, Total Quality Management, available at: http://dx.doi.org/10.1080/14783363.2016.1150167 (retrieved on October 2, 2016).
Yang, C.C. (2005) ‘The refi ned Kano’s model and its application’, Total Attribute Management and Business Excellence, Vol. 16, No. 10, pp.1127–37.

© Faculty of Management University of Warsaw. All rights reserved. DOI: 10.7172/2449-6634.jmcbem.2017.1.2
Journal of Marketing and Consumer Behaviour in Emerging Markets 1(5)2017
Norlia Ahmad
28
(15–28)
APPENDIX 1: DESCRIPTION OF SMARTPHONE ATTRIBUTES
No. Attribute Description
1 Call connectivity The degree of call connections without fail
2 Internet speed Network data speed via a smartphone
3 Memory Internal storage capacity for pictures, videos, and applications
4 Battery usage time Battery lifetime after a full charge
5 Screen size The size of smartphone screen
6 Display resolution The resolution of the smartphone screen; the higher the resolution,the better the defi nition
7 Depth Thickness or thinness
8 Weight Heaviness
9 Camera resolution The defi nition of the built-in camera (megapixels)
10 Build Build quality with aluminum unibody design (premium looking)
11 Sound quality Sound quality of voices, audios, or videos
12 Crash resistance The degree of crash or drop resistance
13 Water resistance he degree of water resistance
14 Voice recognition A human interface which enables users to perform tasksby voice commands
15 Fingerprint sensors Touch-based responsive fi nger print sensors
16 Processing speed The processing speed of applications in a smartphone
17 Wireless charger Built-in wireless charging capabilities
18 Battery charging time Quick charging time after the battery is dead to a reasonable state(more than 50% in less than an hour)
19 Multitasking Using multiple functions such as running applications, text messaging, and web surfi ng, simultaneously
20 3D function A function that enables users to watch a 3D movie, or play a 3D game
21 Accidental damage warranty Damage warranty during the fi rst year

© Faculty of Management University of Warsaw. All rights reserved. DOI: 10.7172/2449-6634.jmcbem.2017.1.3
Journal of Marketing and Consumer Behaviour in Emerging Markets 1(5)2017 29
(29–44)
Impact of Social, Epistemic and Conditional Valueson Customer Satisfaction and Loyalty
in Automobile Industry: A Structural Equation Modelling
Zubair HassanPhD Candidate
Faculty of Economics and Management SciencesInternational Islamic University, Malaysia
Received: 26 December 2016/ Revised: 5 March 2017/ Accepted: 28 March 2017/ Published online: 26 April 2017
ABSTRACT
The purpose of this study is to identify the social, epistemic and conditional values associated with automobiles and to examine their impact on customer satisfaction and brand loyalty. A sample size of 198 respondents was chosen from various locations near Jeddah in Saudi Arabia using convenient sampling techniques. A multi-factor customer perceived value questionnaire with a Likert scale from 1 to 5 was used to collect the data to determine the social, epistemic and conditional perceived values associated with automobiles and their impact on customer satisfaction and brand loyalty. AMOS was used to generate the result and to analyse the collected data. 5 items were reduced from the original construct to meet the standard loading during the confi rmatory factor analysis. Then structural modelling was conducted on a full model and satisfaction as a mediator model. The fi ndings were that epistemic value and conditional value have a positive and signifi cant impact on satisfaction. Also epistemic value and satisfaction have a positive and signifi cant impact on loyalty. However, social value has a negative impact on satisfaction and loyalty in the full model and the mediator model as well. Therefore, epistemic value and conditional value are important dimensions or values associated with automobile brands in Saudi Arabia and they affect customer satisfactions and loyalty.
JEL classifi cation: M31, M37, M39
Keywords: customer perceived value, satisfaction, brand loyalty
1. INTRODUCTION
Customer perceived value (CPV) is a popular topic in marketing and is used by many researchers around the world (Zauner, Koller and Hatak, 2015). Recently, much research has been done on developed and developing countries. A body of research has been done on USA, UK, Spain, Italy, Portugal, Norway and France, representing developed countries, and on Pakistan, UAE, Korea, South Korea, China, Indonesia, Malaysia, Taiwan and Saudi Arabia, representing developing countries (Desmet, 2014). Similarly, much research on CPV associated with products and services from various industries such as IT, food, retail, tourism, airline, online, banking and

© Faculty of Management University of Warsaw. All rights reserved. DOI: 10.7172/2449-6634.jmcbem.2017.1.3
Journal of Marketing and Consumer Behaviour in Emerging Markets 1(5)2017
Zubair Hassan
30
(29–44)
automobile industries was done previously. CPV related studies carried out among the Middle East countries seem to pay very little attention to Saudi Arabia in particular (Chang and Tseng, 2013) except the study done by Moosa and Hassan (2015). CPV was measured in terms of quality, price, design, privacy and satisfaction by many researchers and these measures were found to be the most commonly cited variables in the past. Research shows that there was a positive impact of CPV on retention, satisfaction and customer repeat purchase (Yang and Jolly, 2009). Most of the research shows that CPV has a positive impact on brand loyalty. Also, CPV has a positive impact on retention, satisfaction and repeat purchase (Yang and Jolly, 2009; Vera and Trujillo, 2013; Wu, Chen, Chen and Cheng, 2014).
There are many elements of CPV which impact positively brand loyalty such as price, which is considered the most powerful factor in customer retention for an organisation. Price is an important factor which infl uences customer decision-making for a product or service. Customers are willing to purchase a new product or service and take purchasing decisions faster when there is a reduction in price (Wu at al., 2014). If the price of a product is not appropriate, then customers might switch to another organisation because they get value for their money (Wu at al., 2014). Emotional value is also considered one of the factors which have high impact on CPV. When it comes to the decision-making, it is important to satisfy consumers psychologically, because emotions play an important role in terms of consumer purchase decision for a product or service (Xiucheng and Yunlai, 2006). Customers emotionally satisfi ed with a service or product are likely to repeat their purchase. One of the major variables to measure customer perceived value is functional value which meets consumers’ requirements for product functions and quality (Peng and Liang, 2013). As some of the authors argued, switching cost is an important variable which has a signifi cant impact on customer loyalty through CPV and satisfaction (Parasuraman and Grewal, 2000). Most research shows that quality has a positive impact on CPV, whereby the customer becomes more loyal toward the organisation. Some research in the past established an association between purchase intension and CPV (Calabuig, Núñez-Pomar, Prado-Gascó and Ano, 2014; Yusof, Singh and Razak, 2013). If the requirements of customers are not fulfi lled, there are many negative impacts such as risk of having bad word of mouth from customers, and the image of an organisation will be affected negatively (Loureiro et al., 2012). Oliver and Swan (1989) pointed out that customer loyalty is an important factor which can play an important role in increasing revenue of an organisation.
This paper is organised as follows: the fi rst part is research background and research rationale. The second part is the theoretical framework and research hypothesis development. The third part discusses the research design and methodology, data collection procedures and process. The fourth part presents the results and discussion. The fi nal part is conclusion and recommendations, and implications for further research.
2. LITERATURE REVIEW
The most commonly cited defi nition of CPV proposed by Ziethmal (1988) is overall economic benefi ts of a product effectiveness. Another defi nition from the uni-dimensional perspective argued that CPV is overall assessment of the utility of a product in terms of what is obtained and what is paid (Ulaga and Chacour, 2001). One of the most frequently cited multi-dimensional defi nitions of CPV is proposed by Sheth, Newman and Gross (1991), who argued that CPV is about computation of values that needs to explain why a consumer chooses to buy or not to buy a particular product.
Examining the available literature regarding CPV associated with automobiles around the world, it appears that very little or only a handful of research has been done such as Hur, Kim and Park (2013), Tu, Lin and Hsu (2013), Jalilvand and Samiei (2012), Haq (2012), Leelakulthanit

© Faculty of Management University of Warsaw. All rights reserved. DOI: 10.7172/2449-6634.jmcbem.2017.1.3
Journal of Marketing and Consumer Behaviour in Emerging Markets 1(5)2017
Zubair Hassan
31
(29–44)
and Hongcharu (2012), Yee and San (2011), Yusuf et al. (2013) and Moosa and Hassan (2015). The CPV elements covered in these studies are summarised in Table 1.
Table 1Elements of CPV associated with automobiles
Source Customer perceived value variables
Yee and San (2011) Perceived quality, perceived value, perceived risk, purchasing decision
Leelakulthanit and Hongcharu (2012)
Economic value, functional values, well-being value, nature lover value,self-effi ciency value, self-expressive value
Jalilvand and Samiei (2012). Word of mouth, brand image
Haq (2012) Perceived quality, perceived value, customer trust, loyalty, satisfaction
Hur, Kim and Park (2013) Functional value, emotional value, social value, price consciousness
Tu, Lin and Hsu (2013) Corporate brand image, customer commitment
Yusuf et al. (2013) Responsibility feeling, environmental values, environmental knowledge, environmental advertisement, environmental friendly product, purchasing intension
Moosa and Hassan(2015) Functional values, social values, emotional values, epistemic values, conditional values, loyalty and customer satisfaction
Table 2CPV studies done on Saudi Arabia
Source Industry Customer perceived value variables
Eid (2011) Commerce (Online) Quality, privacy, satisfaction, perceived security
Abu Bakar, Al Ruwaisand Othman (2013) Retail/shopping mall Physical aspects, reliability, professionalism, helpful,
problem solving, and policy
Abu Bakar (2014) Retail Design, privacy
Alsheikh and Bojei (2014) Mobile bankingMobile phone experience, awareness of service, performance expectancy, effort expectancy, perceived cost, perceived risk
Moosa and Hassan (2015) Automobiles Functional, social, emotional, epistemic,and conditional values
The studies done to examine the CPV associated with automobiles in Saudi Arabia or Middle East are far fewer or it seems that no research has been done except Moosa and Hassan (2015), who carried out the research on examining the impact of CPV using Seth et al.’s (1991) consumption value framework from multidimensional perspective in Saudi Arabia.
The study done by Moosa and Hassan(2015) used customer satisfaction as a mediator between CPV and loyalty, although it used regression values generated to establish the relationship between CPV and brand loyalty using satisfaction as a mediator. The method used to analyse the mediator factor seems not appropriate or accepted by many scholars in the relevant fi eld. Therefore, it is important to review more relevant research before proceeding to conclude with a conceptual framework and analysis. This study discussed the key limitations of Moosa and Hassan (2015) and the reason for using Structural Equation Modelling to establish the original path diagram or conceptual framework used by Moosa and Hassan (2015). The study done by Bakon and Hassan (2013) was considered as the fi rst empirical research conducted using the fi ve consumption values originally established by Seth et al. (1991). For this reason, this study adopted the three key elements of the same theoretical framework: the three CPVs of social (SV), epistemic (EPV) and conditional values (CV), where the fi rst two values were found insignifi cant
© Faculty of Management University of Warsaw. All rights reserved. DOI: 10.7172/2449-6634.jmcbem.2017.1.3
Journal of Marketing and Consumer Behaviour in Emerging Markets 1(5)2017
Zubair Hassan
32
(29–44)
in infl uencing both satisfaction and loyalty (Moosa and Hassan, 2015). Therefore, in this study only social and epistemic values are considered as there were various studies done elsewhere that found that these two values have a signifi cant infl uence on customer satisfaction and loyalty. The third value of conditional value is also considered as in Saudi Arabia, only men are allowed to drive automobiles, which may have some infl uence on the level of loyalty or satisfaction. Each multi-dimensional value in relation with customer satisfaction and loyalty is reviewed below.
2.1. Social Value and Customer Satisfaction
Social value has a direct relation with social status. This dimension has a wide concept which includes social capital and citizens’ well-being as well. This can be the ability to take part in decision making that affects them. Perceived social values have a signifi cant positive effect on customer satisfaction with respect to green innovation as a key attribute of the automobile (Hur et al., 2013). Further, customer satisfaction leads to customer loyalty, while lowering price consciousness. Researchers tend to relate social values as social interactions, sociability and hospitality (Payne and Holt, 2001). Personality and own self-image were evaluated during the process of decision making as it is believed that both personality and self-image alignment creates more acceptance in the society (Chon, 1992; Tabassum, Zafar, Ali, Alam and Ali, 2013). Celebrity status associated with a particular product attracts many people’s attention (Lee et al., 2008). Buying socially recommended products through media or friends is a usual practice to obtain satisfaction (Miguens et al., 2008). Popular or socially more accepted automobiles create a better image and greater acceptance among people (Mahika, 2011; Tabassum et al., 2013). Social relationships are a motivating factor for many people to create satisfaction and loyalty (Vuuren and Slabbert, 2011). Meanwhile, Sheth et al. (1991) argued that social value is the acceptability of consumers’ relationship with the social environment. Social values are considered to be the most important multi-dimensional variables which infl uence consumers and their purchasing intentions, which has a direct impact on customer satisfaction. In the past, a handful of research was done to explore the impact of these variables on brand loyalty, especially among automobile manufacturers (Eid, 2011; Abu Bakar, 2013; Alsheikh and Bojei, 2014). However, Moosa and Hassan (2015) found that social values do not have any signifi cant impact on customer satisfaction and loyalty. Since the past research brought mixed results, it is important to consider this value and test it to examine whether social values have a positive and signifi cant impact on customer satisfaction and loyalty.
2.2. Epistemic Value and Customer Satisfaction
Sheth et al. (1991) defi ned epistemic value as “capacity of the product or service to satisfy the desire for knowledge”. Epistemic value refers to novelty value as well as value gained from learning a new way of doings things such as experience or knowledge gained through testing or exploring new services. Epistemic values can infl uence the customer intension, which has a direct impact on customer satisfaction and loyalty (Cheng et al., 2009). Similarly, Chang et al. (2013) found that epistemic values have a positive infl uence on customer satisfaction and loyalty. In their study, epistemic value associated with e-store is translated to utilitarian and hedonic values where perceived value and utilitarian value exert a bigger infl uence than hedonic value resulting in more brand loyalty. In terms of measuring CPV associated with automobiles, variables such as epistemic values seem quite applicable to measure CPV of a car (Ehsani and Hashim 2015). However, recent studies have found that epistemic value does not have a signifi cant infl uence on customer satisfaction and loyalty in the automobile industry (Moosa and Hassan, 2015).
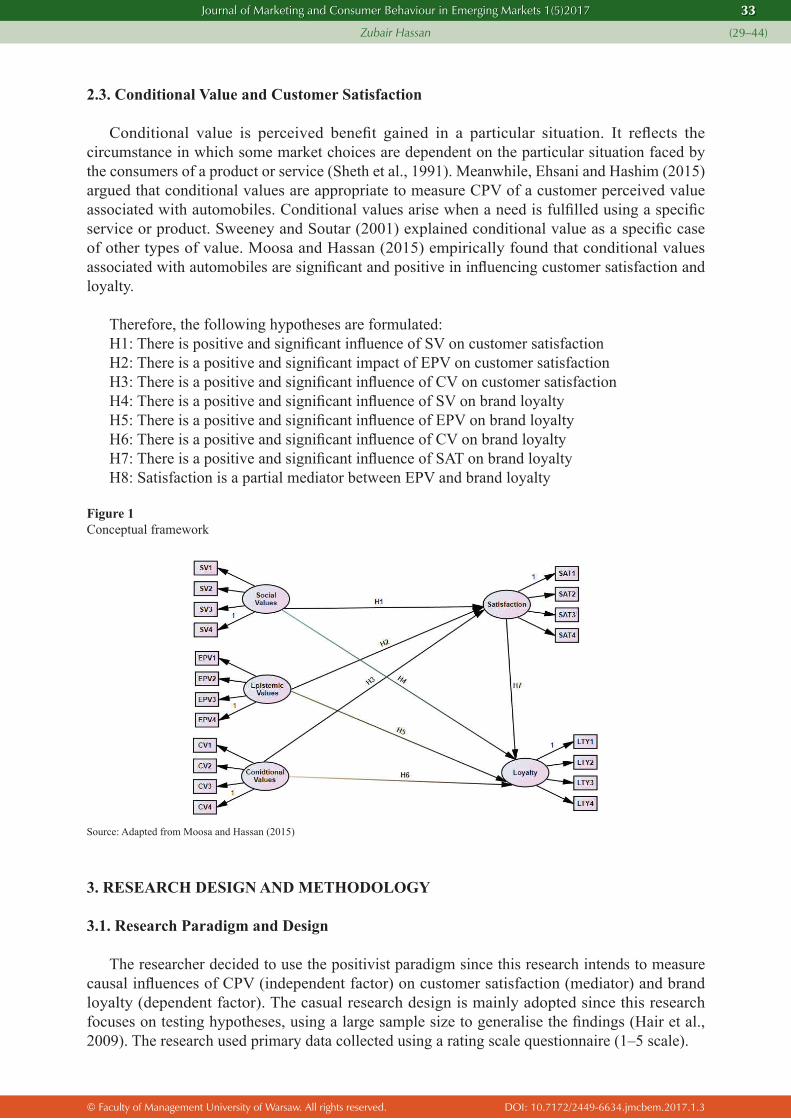
© Faculty of Management University of Warsaw. All rights reserved. DOI: 10.7172/2449-6634.jmcbem.2017.1.3
Journal of Marketing and Consumer Behaviour in Emerging Markets 1(5)2017
Zubair Hassan
33
(29–44)
2.3. Conditional Value and Customer Satisfaction
Conditional value is perceived benefi t gained in a particular situation. It refl ects the circumstance in which some market choices are dependent on the particular situation faced by the consumers of a product or service (Sheth et al., 1991). Meanwhile, Ehsani and Hashim (2015) argued that conditional values are appropriate to measure CPV of a customer perceived value associated with automobiles. Conditional values arise when a need is fulfi lled using a specifi c service or product. Sweeney and Soutar (2001) explained conditional value as a specifi c case of other types of value. Moosa and Hassan (2015) empirically found that conditional values associated with automobiles are signifi cant and positive in infl uencing customer satisfaction and loyalty.
Therefore, the following hypotheses are formulated:H1: There is positive and signifi cant infl uence of SV on customer satisfactionH2: There is a positive and signifi cant impact of EPV on customer satisfactionH3: There is a positive and signifi cant infl uence of CV on customer satisfactionH4: There is a positive and signifi cant infl uence of SV on brand loyaltyH5: There is a positive and signifi cant infl uence of EPV on brand loyaltyH6: There is a positive and signifi cant infl uence of CV on brand loyaltyH7: There is a positive and signifi cant infl uence of SAT on brand loyaltyH8: Satisfaction is a partial mediator between EPV and brand loyalty
Figure 1Conceptual framework
Source: Adapted from Moosa and Hassan (2015)
3. RESEARCH DESIGN AND METHODOLOGY
3.1. Research Paradigm and Design
The researcher decided to use the positivist paradigm since this research intends to measure causal infl uences of CPV (independent factor) on customer satisfaction (mediator) and brand loyalty (dependent factor). The casual research design is mainly adopted since this research focuses on testing hypotheses, using a large sample size to generalise the fi ndings (Hair et al., 2009). The research used primary data collected using a rating scale questionnaire (1–5 scale).
© Faculty of Management University of Warsaw. All rights reserved. DOI: 10.7172/2449-6634.jmcbem.2017.1.3
Journal of Marketing and Consumer Behaviour in Emerging Markets 1(5)2017
Zubair Hassan
34
(29–44)
3.2. Questionnaire
The questionnaire is designed to gather the data. It consists of three parts. Part 1 deals with personal details such as sex, education, age, etc. Part 2 consists of 12 statements to measure the 3 dimensions of customer perceived value (CPV) such as social value (SV), epistemic value (EPV), and conditional values (CV). Part 3 consists of 8 statements which are divided into two main variables. Four (4) statements were used to measure customer satisfaction and four (4) statements to measure customer brand loyalty. To generate these fi nal 20 items, the following procedures were followed. At fi rst, a total of 12 experts (academicians, marketing and sales managers, and car owners residing in Jeddah) were asked to: Write actual statements that represented the values and items; Clarify the defi nitions of each value items when it was necessary; Add additional items to the existing value dimensions if it was deemed constructive.
As a result of these procedures, an initial pool of 35 items (representing 7 sub-dimensions) was generated. These items were then incorporated as statements into a measurement instrument utilising a fi ve-point Likert-type scale (1 “strongly disagree” to 5 “strongly agree”) (Dolnicar, Grun, Leisch and Rossiter, 2011). A panel of four (4) experts in the automobile industry assessed content validity by assessing items on the basis of their relevance and clarity of wording. Items that were endorsed by four (4) experts were retained, whereas items that were deemed to be unclear, irrelevant, or redundant were eliminated. As a result of these procedures, 10 items were eliminated. The remaining 25 items were included in a questionnaire for a pilot field test. The pilot test involved 30 car owners driving the car from their homes to the workplace in Jeddah, Saudi Arabia. The respondents were asked to rate the items to examine the relevance and validity of each item. As a result of this test, none of the items was deleted as these items were found non-ambiguous and reliable.
3.3. Sampling Method
A convenience sample of 250 car owners or drivers was recruited to assess internal consistency. Five (5) further items that had been corrected based on factor loading using AMOS, which has a loading less than 0.4, were deleted. After these items had been deleted, Cronbach’s alpha coefficients for all factors were greater than 0.70. Following these scale-purification procedures, the final version of the instrument had a total of 20 items representing 5 sub-dimensions of customer perceived value along with customer satisfaction and brand loyalty (with each sub-dimension having four items). A total of 211 questionnaires were received (response rate 84%). However, some of these questionnaires were excluded from the sample as some respondents did not complete the questionnaire. This means that the study only used 198 completed questionnaires (sample size).
3.4. Ethical Consideration
Prior to the collection of data, respondents were requested to complete the consent form which was attached to the questionnaire to obtain the permission from each respondent. Participant Information Sheet (PIS) was given to respondents to inform them of the purpose and the importance of this research. The completed questionnaires were collected by the researchers and reminded the respondents to inform the researcher if they wished to withdraw from this study before the data were processed (7 days).

© Faculty of Management University of Warsaw. All rights reserved. DOI: 10.7172/2449-6634.jmcbem.2017.1.3
Journal of Marketing and Consumer Behaviour in Emerging Markets 1(5)2017
Zubair Hassan
35
(29–44)
3.5. Data Analysis
Data were analysed using SPSS 21.0 (Field, 2005) and AMOS 22. The goodness of fi t of the measurement and structural models was tested using AMOS with the maximum likelihood (ML) method. Goodness of fi t of the model to the data was assessed with the comparative fi t index (CFI), root mean square error of approximation (RMSEA), and X²/df and normed chi-square (Anderson and Gerbing, 1988). The convergent validity of the measures was assessed by factor loadings, AVE values, and reliability coeffi cients (Hair et al., 2009). Discriminant validity was established when the estimated correlations between the factors or dimensions were found not to be excessively high (Kline, 1998) and when the squared correlations between a construct and any others were found to be less than the AVE for each construct (Fornell and Larcker, 1981).
4. RESULTS AND DISCUSSION
4.1. Descriptive Statistical Analysis
Descriptive statistics for the 5 dimensions ranged (on a scale of 1–5) from 3.48 (Social Values – SV) to 4.08 (Satisfaction). The standard deviation (SD) ranged from 0.96 to 1.48. Because ML statistics are very sensitive to non-normality (Bentler, 2004), the skewness and kurtosis were examined to ensure that dataset is acceptable in terms of normality. Since many scholars argue if kurtosis and skewness fall between -1 to 1 or if skewness (SK/SE is equal to or less than 2), the dataset can be acceptable for a multivariate analysis. Since the dataset meets the required set of rules, the dataset is considered as normally distributed. All the skewness of the dataset is less than 2.
4.2. First Order Analysis
CFA (measurement model) of CPV and Brand Loyalty
To assess the measurement model, two analyses were carried out. First, a fi rst-order CFA was carried out to analyse the measurement model using AMOS 22. The main reason for conducting this analysis is to confi rm the latent variables really refl ect the intended measures in the instrument. Second, the squared correlation was examined to measure each indicator and to examine whether each item measures a construct (Holmes-Smith, 2001; Hair et al., 2009). The fi rst analysis shows that most of the items in the construct loaded more than 0.5, which shows a good reliability of the model. The fi rst run of squared multiple correlation showed that the majority of the model is suitable and appropriate (Holmes-Smith, 2001).
To test the reliability of the CPV and its infl uence on customer satisfaction and brand loyalty instruments, the Cronbach’s alpha coeffi cient was calculated using SPSS 22. Table 1 below shows that Cronbach’s alpha exceeds the minimum requirement of 0.70. (Nunnally and Bernstein, 1994). It shows that there is good internal consistency among the variables or elements. The coeffi cients obtained range from 0.704 to 0.824 (Table 1). The estimates of the standard factor loading were used to determine the validity of CPV dimensions (as shown in Figure 2). The factor loadings in the confi rmatory factor analysis ranged from 0.30 to 0.79 for the CPV dimensions. Those which are less than 0.5 are removed from the latent variables since the general rule is to maintain those items that load more than 0.7 (preferred) (Hair et al., 2009) but can include the values that loaded close to 0.5 since the AMOS22 requires minimum four items per construct.

© Faculty of Management University of Warsaw. All rights reserved. DOI: 10.7172/2449-6634.jmcbem.2017.1.3
Journal of Marketing and Consumer Behaviour in Emerging Markets 1(5)2017
Zubair Hassan
36
(29–44)
Figure 2First measurement model of latent variables
A re-run of CFA carried out, the measurement model result showed that the model was a good fi t. Since each construct should have minimum 3 elements (Hair et al., 2009), modifi cation was made using modifi cation indices to ensure that each construct has more than 3 elements as the AMOS 22 requires minimum 4 variables/elements in each construct to successfully run (Figure 2). Table 1 below shows that each element under each construct satisfi es the model.
The overall model fi t of the measurement model was found to be good. Fit statistics showed that the normed chi-square ratio was below the suggested threshold of 3.0 (Kline, 1998). The RMSEA value of 0.061 was below the recommended threshold of 0.08 (Hu and Bentler, 1999). The CFI of 0.906 was, as recommended, greater than the threshold of 0.9 (Hair et al., 2009). Also the divergent validity of the model was established and justifi ed to ensure model fi t shown in Table 3. This means that all the 20 elements used to measure CPV, SAT and LY are acceptable.
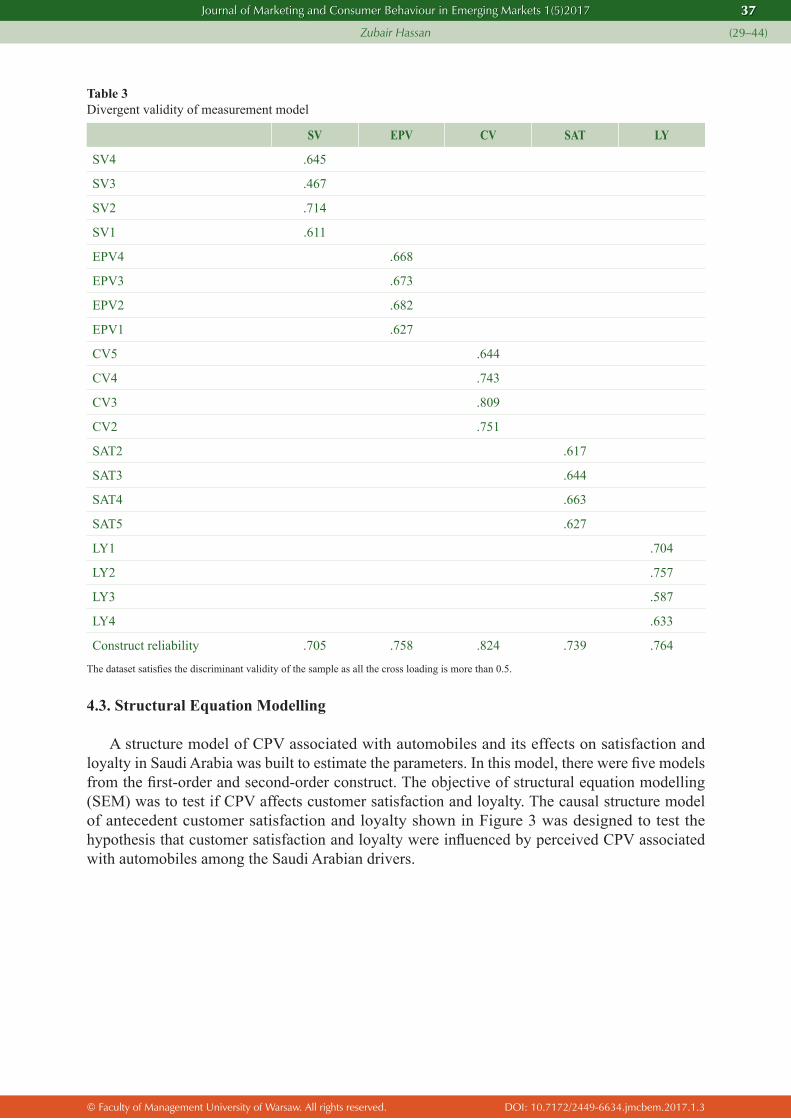
© Faculty of Management University of Warsaw. All rights reserved. DOI: 10.7172/2449-6634.jmcbem.2017.1.3
Journal of Marketing and Consumer Behaviour in Emerging Markets 1(5)2017
Zubair Hassan
37
(29–44)
Table 3Divergent validity of measurement model
SV EPV CV SAT LY
SV4 .645
SV3 .467
SV2 .714
SV1 .611
EPV4 .668
EPV3 .673
EPV2 .682
EPV1 .627
CV5 .644
CV4 .743
CV3 .809
CV2 .751
SAT2 .617
SAT3 .644
SAT4 .663
SAT5 .627
LY1 .704
LY2 .757
LY3 .587
LY4 .633
Construct reliability .705 .758 .824 .739 .764
The dataset satisfi es the discriminant validity of the sample as all the cross loading is more than 0.5.
4.3. Structural Equation Modelling
A structure model of CPV associated with automobiles and its effects on satisfaction and loyalty in Saudi Arabia was built to estimate the parameters. In this model, there were fi ve models from the fi rst-order and second-order construct. The objective of structural equation modelling (SEM) was to test if CPV affects customer satisfaction and loyalty. The causal structure model of antecedent customer satisfaction and loyalty shown in Figure 3 was designed to test the hypothesis that customer satisfaction and loyalty were infl uenced by perceived CPV associated with automobiles among the Saudi Arabian drivers.

© Faculty of Management University of Warsaw. All rights reserved. DOI: 10.7172/2449-6634.jmcbem.2017.1.3
Journal of Marketing and Consumer Behaviour in Emerging Markets 1(5)2017
Zubair Hassan
38
(29–44)
Table 4Discriminant validity
SV EPV CV SAT LY
SV 1 .38 .36 .01 .10
EPV .62*** 1 .12 .21 .10
CV .60*** .35*** 1 .06 .21
SAT .12 .46*** .25** 1 .41
LY .32** .23* .46*** .64*** 1
Signifi cance level: *=0.05, **=0.01, ***=0.001. The values below the diagonal are correlation estimates among constructs. Diagonal elements are construct variance and the values above the diagonal are squared correlations.
There are many ways in which validity of the structural model can be examined One of the ways is indices such as chi-square, normed chi-square, CFI, RMSEA (Hair et al., 2009). Figure 4 shown below indicates that chi-square is signifi cant with p=0.000 (chi-square is 271.434, df=159). Normed chi-square of less than 3 is considered good fi t (Hair et al., 2009). CFI should be more than 0.9. The structural model with modifi cation indices (e7 to e26) indicates that it has a value of more than 0.910, suggesting a good fi t. According to Hair et al. (2009), RMSEA should be less than 0.08. In this case, RMSEA is 0.060, which is considered as a good fi t.
The second way of measuring the validity of the SEM is factor loadings obtained from the measurement model and the full-fl edged model that should be very close (Hair et al., 2009). In this case, Table 5 suggests that loadings of the measurement model and structural model are very similar and close to each other. This indicates that the model is validated as a good fi t model. The third way of measuring the validity of the structural model is path analysis and its signifi cance. Table 6 shows that in both models the relationships are signifi cant except for SV not signifi cantly associated with SAT (satisfaction). Also SV is negatively associated with satisfaction, indicating that there are some minor issues, but it does not deter the good fi t of the construct or model since other path estimates are signifi cant.
Figure 3Second run and modifi ed measurement model
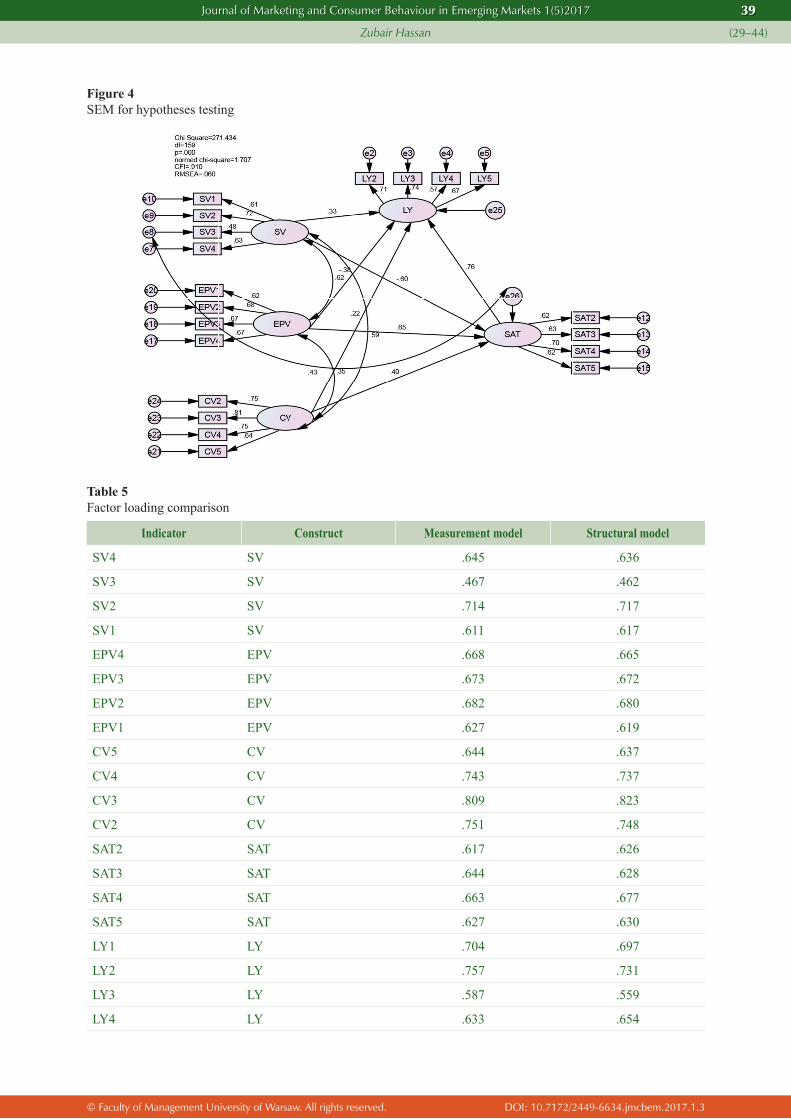
© Faculty of Management University of Warsaw. All rights reserved. DOI: 10.7172/2449-6634.jmcbem.2017.1.3
Journal of Marketing and Consumer Behaviour in Emerging Markets 1(5)2017
Zubair Hassan
39
(29–44)
Figure 4SEM for hypotheses testing
Table 5Factor loading comparison
Indicator Construct Measurement model Structural model
SV4 SV .645 .636
SV3 SV .467 .462
SV2 SV .714 .717
SV1 SV .611 .617
EPV4 EPV .668 .665
EPV3 EPV .673 .672
EPV2 EPV .682 .680
EPV1 EPV .627 .619
CV5 CV .644 .637
CV4 CV .743 .737
CV3 CV .809 .823
CV2 CV .751 .748
SAT2 SAT .617 .626
SAT3 SAT .644 .628
SAT4 SAT .663 .677
SAT5 SAT .627 .630
LY1 LY .704 .697
LY2 LY .757 .731
LY3 LY .587 .559
LY4 LY .633 .654

© Faculty of Management University of Warsaw. All rights reserved. DOI: 10.7172/2449-6634.jmcbem.2017.1.3
Journal of Marketing and Consumer Behaviour in Emerging Markets 1(5)2017
Zubair Hassan
40
(29–44)
The overall model indicated that each dimension of the perception of CPV had a positive relationship with customer satisfaction and loyalty. It means that the CPV model is an acceptable and useful instrument to measure CPV dimensions in Saudi Arabia’s automobile industry (foreign brands).
The CPV dimension was found to contribute to customer satisfaction and loyalty, and may be a critical aspect for customers in judging the CPV and satisfaction along with loyalty. The standardised parameter estimates and signifi cant values for the hypothesis relationships are presented in Table 6. The fi ndings suggest that the standard structural model of CPV associated with automobiles in Saudi Arabia is a good determinant of satisfaction and loyalty. The standardised regression weight of SV, EPV and CV to customer satisfaction was signifi cant with parameter estimates (-0.60, 0.65 and 0.40). These regression weights explain the degree of association between the construct and the manifesting variables. In other words, if EPV increased by 1 standard deviation, the standard deviation of customer satisfaction would have increased by 0.65. Furthermore, the signifi cant path coeffi cient showed that the CV dimension had a positive impact on satisfaction. However, SV had a signifi cant but negative infl uence on customer satisfaction, which was similar to some past studies done in other parts of the world as well.
Table 6Path analysis comparison
Measurement model Structural model
Relationship Parameter estimates Relationship Parameter estimates
CV correlates with SAT .25 H1: CV → SAT .40
EPV correlates with SAT .46 H2: EPV → SAT .65
SV does not correlate with SAT .12 H3: SV → SAT -.60
CV correlates with LY .46 H4: CV → LY .22
EPV correlates with LY .23 H5: EPV → LY -.39
SV correlates with LY .32 H6: SV → LY .33
SAT correlates with LY .64 H7: SAT → LY .76
SV correlates with EPV .35 SV correlates with EPV .34
C correlates with SV .60 C correlates with SV .60
SV correlates with EPV .62 SV correlates with EPV .43
Since EPV is the only variable that has a positive and signifi cant impact on customer satisfaction and loyalty, the other two Hypotheses were rejected (CV has a positive impact on loyalty, SV has a signifi cant and positive impact on loyalty) as shown in Table 7. To analyse further whether SAT is a mediator between EPV and loyalty, a mediator analysis was performed.

© Faculty of Management University of Warsaw. All rights reserved. DOI: 10.7172/2449-6634.jmcbem.2017.1.3
Journal of Marketing and Consumer Behaviour in Emerging Markets 1(5)2017
Zubair Hassan
41
(29–44)
Table 7Hypotheses
Hypotheses Estimate S.E. C.R. P Accepted or rejected
SAT <--- SV -.599 .135 -2.927 .003 Rejected
SAT <--- EPV .651 .133 3.920 *** Accepted
SAT <--- CV .403 .096 2.907 .004 Accepted
LY <--- SAT .764 .167 5.002 *** Accepted
LY <--- SV .329 .129 1.837 .066 Rejected
LY <--- EPV -.385 .141 -2.378 .017 Accepted
LY <--- CV .218 .094 1.764 .078 Rejected
Figure 6 shows the mediator effect using constrained model.
Figure 6Mediator analysis using SAT
Table 8Mediator analysis =Satisfaction
Estimate S.E. C.R. P Label
SAT <--- SV -.245 .125 -1.961 .050
SAT <--- EPV .444 .128 3.477 ***
SAT <--- CV .190 .093 2.051 .040
LY <--- SAT .575 .112 5.122 *** b
LY <--- SV .004 .073 .048 .962
LY <--- EPV .000
LY <--- CV .247 .082 3.011 .003
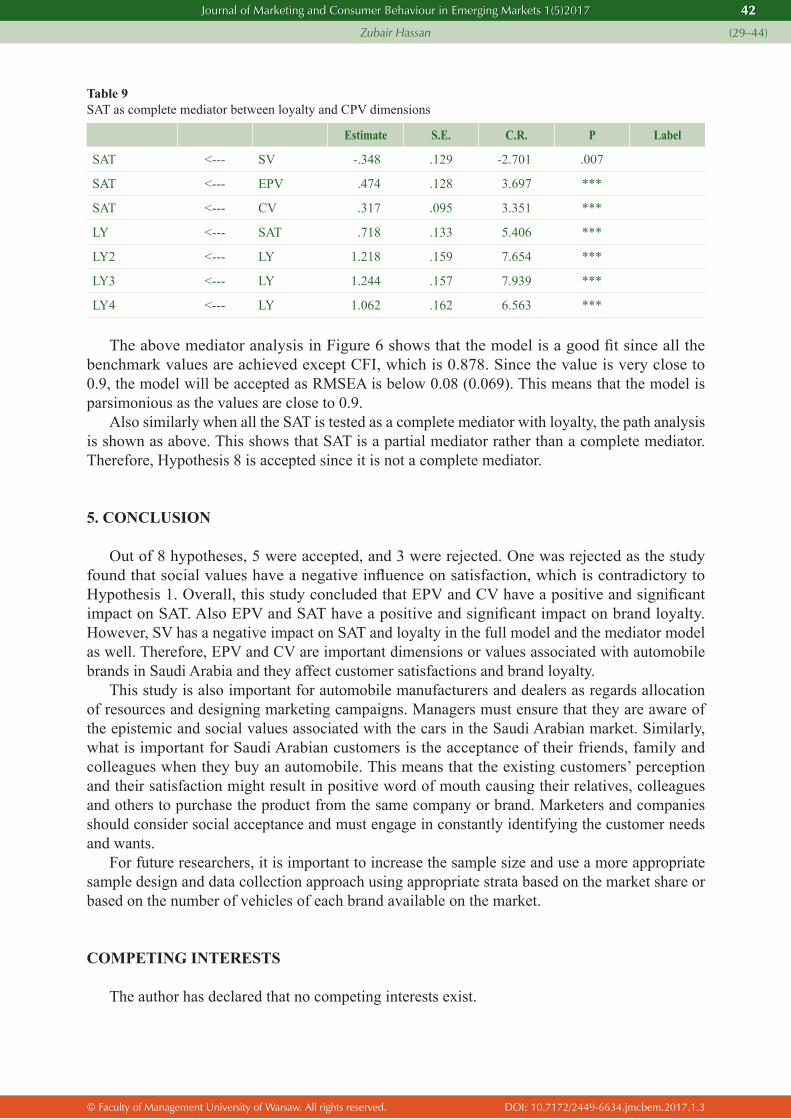
© Faculty of Management University of Warsaw. All rights reserved. DOI: 10.7172/2449-6634.jmcbem.2017.1.3
Journal of Marketing and Consumer Behaviour in Emerging Markets 1(5)2017
Zubair Hassan
42
(29–44)
Table 9SAT as complete mediator between loyalty and CPV dimensions
Estimate S.E. C.R. P Label
SAT <--- SV -.348 .129 -2.701 .007
SAT <--- EPV .474 .128 3.697 ***
SAT <--- CV .317 .095 3.351 ***
LY <--- SAT .718 .133 5.406 ***
LY2 <--- LY 1.218 .159 7.654 ***
LY3 <--- LY 1.244 .157 7.939 ***
LY4 <--- LY 1.062 .162 6.563 ***
The above mediator analysis in Figure 6 shows that the model is a good fi t since all the benchmark values are achieved except CFI, which is 0.878. Since the value is very close to 0.9, the model will be accepted as RMSEA is below 0.08 (0.069). This means that the model is parsimonious as the values are close to 0.9.
Also similarly when all the SAT is tested as a complete mediator with loyalty, the path analysis is shown as above. This shows that SAT is a partial mediator rather than a complete mediator. Therefore, Hypothesis 8 is accepted since it is not a complete mediator.
5. CONCLUSION
Out of 8 hypotheses, 5 were accepted, and 3 were rejected. One was rejected as the study found that social values have a negative infl uence on satisfaction, which is contradictory to Hypothesis 1. Overall, this study concluded that EPV and CV have a positive and signifi cant impact on SAT. Also EPV and SAT have a positive and signifi cant impact on brand loyalty. However, SV has a negative impact on SAT and loyalty in the full model and the mediator model as well. Therefore, EPV and CV are important dimensions or values associated with automobile brands in Saudi Arabia and they affect customer satisfactions and brand loyalty.
This study is also important for automobile manufacturers and dealers as regards allocation of resources and designing marketing campaigns. Managers must ensure that they are aware of the epistemic and social values associated with the cars in the Saudi Arabian market. Similarly, what is important for Saudi Arabian customers is the acceptance of their friends, family and colleagues when they buy an automobile. This means that the existing customers’ perception and their satisfaction might result in positive word of mouth causing their relatives, colleagues and others to purchase the product from the same company or brand. Marketers and companies should consider social acceptance and must engage in constantly identifying the customer needs and wants.
For future researchers, it is important to increase the sample size and use a more appropriate sample design and data collection approach using appropriate strata based on the market share or based on the number of vehicles of each brand available on the market.
COMPETING INTERESTS
The author has declared that no competing interests exist.

© Faculty of Management University of Warsaw. All rights reserved. DOI: 10.7172/2449-6634.jmcbem.2017.1.3
Journal of Marketing and Consumer Behaviour in Emerging Markets 1(5)2017
Zubair Hassan
43
(29–44)
References
Abu Bakar, A.R, Al Ruwais, N.M. and Othman, A. R. (2013) ‘Customer Net Value: a Service Gap Perspective from Saudi Arabia’, Global Journal of Business Research, Vol. 7 No. 4, pp. 19–33, (e-journal). Retrieved 24.10.2016 from https://papers.ssrn.com/sol3/papers.cfm?abstract_id=2239239.
Abu Bakar, A.R. (2014) ‘Customer store loyalty in the context of customer perceived value in Saudi Arabia’, Journal of Contemporary Research in Business, Vol. 5 No. 12, pp. 442–460, (e-journal). Retrieved 16.03.2016 from http://journal-archieves36.webs.com/442-460apr14.pdf.
Alsheikh, L. and Bojei, J. (2014) ‘Determinants affecting customer’s intention to adopt mobile banking in Saudi Arabia’, International Arab Journal of e-Technology, Vol. 3 No. 4, pp. 210–219, (e-journal). Retrieved 29.10.2014 from http://www.iajet.org/iajet_fi les/vol.3/no.%204/2-58519.pdf.
Anderson, J.C. and Gerbing, D.W. (1988) ‘Structural equation modeling in practice: a review and recommended two-step approach’, Psychological Bulletin, Vol. 103, pp. 411–23.
Bakon, K.A. and Hassan, Z. (2013) ‘Perceived value of smartphone and its impact on deviant behaviour: An investigation on higher education students in Malaysia’, International Journal of Information System and Engineering (IJISE), Vol. 2 No. 1, pp. 38–55.
Bentler, P.M. (2004) EQS 6 Structural Equations Program Manual, Multivariate Software, Encino, CA.Calabuig, F., Núñez-Pomar, J., Prado-Gascó, V. and Ano, V. (2014) ‘Effect of price increases on future intentions of
sport consumers’, Journal of Business Research, Vol. 67 No. 5, pp. 729–733.Chang, E.C. and Tseng, Y.F. (2013) ‘Research note: E-store image, perceived value and perceived risk’, Journal of
Business Research, Vol. 66 No. 7, pp. 864–870.Cheng, M.S., Wang, S.T., Lin, Y.C. and Vivek, S.D. (2009) ‘Why Do Customers Utilize the Internet as a Retailing
Platform?’, Asia Pacifi c Journal of Marketing, Vol. 21 No. 1, pp. 144–160.Chon, K.-S. (1992) ‘Self-Image/Destination Image Congruity’, Annals of Tourism Research, Vol. 19 No. 2,
pp. 360–363.Desmet, P. (2014) ‘How retailer money-back guarantees infl uence consumer preferences for retailer versus national
brands’, Journal of Business Research, Vol. 67 No. 9, pp. 1971–1978.Dolnicar, S., Grun, B., Leisch, F. and Rossiter, J. (2011) Three good reasons NOT to use fi ve and seven point Likert
items. CAUTHE 2011: 21st CAUTHE National Conference, Adelaide, Australia, 8–11 February. Retrieved 25.03.2016 from http://ro.uow.edu.au/cgi/viewcontent.cgi?article=1821&context=commpapers.
Ehsani, Z. and Hashim, N. (2015) ‘Effect of customer perceived value on customer relationship management performance’, International Journal of Science, Commerce and Humanities, Vol. 3 No. 1, pp. 139–146.
Eid, M.I. (2011) ‘Determinants of e-commerce customer satisfaction, trust, and loyalty in Saudi Arabia’, Journal of electronic commerce research, Vol. 12 No. 1, pp. 78–93, (e- journal). Retrieved 29.10.2014 from http://www.csulb.edu/journals/jecr/issues/20111/Paper5.pdf.
Field, A.P. (2005) Discovering Statistics Using SPSS for Windows. London: Sage Publications.Fornell, C. and Larcker, D. (1981) ‘Evaluating structural equation models with unobservable variables and
measurement error’, Journal of Marketing Research, Vol. 18 No. 1, pp. 39–50.Hair, J.F., Black, W.C., Babin, B.J and Anderson, R.E. (2009) Multivariate data analysis: A global perspective, 7th
Ed. New Jersey: Pearson Education Inc.Haq, A.U. (2012) ‘Satisfaction towards customer loyalty in auto-mobile industry of Pakistan’, International Journal
of Management and Business Research, Vol. 2 No. 4, pp. 363–371.Holmes-Smith, P. (2001) Introduction to Structural Equation Modeling Using LISREAL, ACSPRI-Winter Training
Program, Perth.Hu, L.T. and Bentler, P.M. (1999) ‘Cutoff Criteria for Fit Indexes in Covariance Structure Analysis: Conventional
Criteria Versus New Alternatives’, Structural Equation Modeling, Vol. 6 No. 1, pp. 1–55.Hur, W.M., Kim, Y. and Park, K. (2013) ‘Assessing the effects of perceived value and satisfaction on customer
loyalty: A ‘Green’ perspective’, Corporate social responsibility and environmental management, Vol. 20 No. 3, pp. 146–156.
Jalilvand, M, R. and Samiei, N. (2012) ‘The effect of electronic word of mouth on brand image and purchase intention: An empirical study in the automobile industry in Iran’, Marketing Intelligence & Planning, Vol. 30 No. 4, pp. 460–476.
Kline, R.B. (1998) Principles and Practice of Structural Equation Modeling. New York, NY: Guilford.Lee, S., Scott, D. and Kim, H. (2008) ‘Celebrity fan involvement and destination perceptions’, Annals of Tourism
Research, Vol. 35 No. 3, pp. 809–832.Leelakulthanit, O. and Hongcharu, B. (2012) ‘Perceived customer value regarding eco-cars’, Journal of Global
Business Management, Vol. 8 No. 1, p. 74.Loureiro, S.M., Sardinha, I.M.D. and Reijnders, L. (2012). The effect of corporate social responsibility on consumer
satisfaction and perceived value: The case of the automobile industry sector in Portugal. Journal of Cleaner Production, Vol. 37, pp. 172–178.

© Faculty of Management University of Warsaw. All rights reserved. DOI: 10.7172/2449-6634.jmcbem.2017.1.3
Journal of Marketing and Consumer Behaviour in Emerging Markets 1(5)2017
Zubair Hassan
44
(29–44)
Mahika, E.-C. (2011) ‘Current trends in tourist motivation’, Cactus Tourism Journal, Vol. 2 No. 2, pp. 15–24.Miguens, J., Baggio, R. and Costa, C. (2008) Social media and Tourism Destinations: Trip Advisor Case Study,
Aveiro, s.n., pp. 26–28.Moosa, M.Y. and Hassan, Z. (2015) ‘Customer Perceived associated with Automobiles and Brand Loyalty’,
International Journal of Accounting and Business Management, Vol. 3 No. 1, pp. 1–16.Nunnally, J.C. and Bernstein, I.H. (1994) Psychometric Theory, 3rd ed. New York, NY: McGraw-Hill.Oliver, R.L. and Swan, J.E. (1989) ‘Consumer perceptions of interpersonal equity and satisfaction in transactions:
a fi eld survey approach’, The Journal of Marketing, Vol. 53 No. 2, pp. 21–35.Parasuraman, A. and Grewal, D. (2000) ‘The impact of technology on the quality – Value loyalty chain: A research
agenda’, Journal of Academy of Marketing Science, Vol. 28 No. 1, pp. 168–174.Payne, A. and Holt, S. (2001) ‘Diagnosing customer value: integrating the value process and relationship marketing’,
British Journal of Management, Vol. 12 No. 2, pp. 159–182.Peng, L. and Liang, S. (2013) ‘Purchase intention in e-commerce platform: A time limited promotion perspective’,
Proceedings of the Thirteen International Conferences on Electronic Business, 1–4 December, p. 56.Sheth, J.N., Newman, B.I. and Gross, B.L. (1991) ‘Why we buy what we buy: A theory of consumption values’,
Journal of Business Research, Vol. 22 No. 2, pp. 159–170.Sweeney, J.C. and Soutar, G.N. (2001) ‘The Development of a Multiple Item Scale’, Journal of Retailing, Vol. 77
No. 2, pp. 203–220.Tabassum N., Zafar, Z., Ali, A., Alam, A. and Ali, M. (2013) ‘The Effect of Value Perception on Customer Loyalty and
Satisfaction’, IOSR Journal of Business and Management, Vol. 12 No. 6, pp. 62–69, (e-journal). Retrieved from http://iosrjournals.org/iosr-jbm/papers/Vol12-issue6/G01266269.pdf.
Tu, Y.T., Lin, S.Y. and Hsu, T.K. (2013) ‘The Impact of Brand Image and Customer Commitment on Loyalty: An Empirical Study of Automobile Sector’, Information Management and Business Review, Vol. 5 No. 4, p. 181.
Ulaga, W. and Chacour, S. (2001) ‘Measuring customer perceived value in business markets. A Prerequisite for Marketing Strategy Development and Implementation’, Industrial Marketing Management, Vol. 30 No. 6, pp. 525–540.
Vera, J. and Trujillo, A. (2013) ‘Service quality dimensions and superior customer perceived value in retail banks: An empirical study on Mexican consumers’, Journal of Retailing and Consumer Services, Vol. 20 No. 6, pp. 579–586.
Vuuren, C.V. and Slabbert, E.(2011) Travel Motivations and Behaviour of tourists to a South African. Algarve, s.nWu, L.Y., Chen, K.Y., Chen, P.Y. and Cheng, S.L. (2014) ‘Perceived value, transaction cost, and repurchase-intention
in online shopping: A relational exchange perspective’, Journal of Business Research, Vol. 67 No. 1, pp. 2768–2776.
Xiucheng, F. and Yunlai, Z. (2006) ‘A study on emotional impact mechanism of impulsive purchase’, Social Scientist, Vol. 118 No. 2, pp. 148–151.
Yang, K. and Jolly, L.D. (2009) ‘The effects of consumer perceived value and subjective norm on mobile data service adoption between American and Korean consumers’, Journal of Retailing and Consumer Services, Vol. 16 No. 6, pp. 502–508.
Yee, C.J. and San, N.C. (2011) ‘Consumers’ perceived quality, perceived value and perceived risk towards purchase decision on automobile’, American Journal of Economics and Business Administration, Vol. 3 No. 1, pp. 47–57.
Yusof, J.M., Singh, G.K.B. and Razak, R.A. (2013) ‘Purchase intention of environment-friendly automobile’, Procedia-Social and Behavioral Sciences, Vol. 85, pp. 400-410. Elsevier.
Zauner, A., Koller, M. and Hatak, I. (2015). ‘Customer perceived value—Conceptualization and avenues for future research’, Applied Psychology, Vol. 2, pp. 1–17, (e-journal). Retrieved from http://doc.utwente.nl/99534/1/ZaunerKollerHatak2015_CogentPsychology.pdf.
Ziethaml, V.A. (1988) ‘Consumer perception of price, quality, and value: a means-end model and synthesis of evidence’, Journal of Marketing, Vol. 52 No. 3, pp. 2–22.

© Faculty of Management University of Warsaw. All rights reserved. DOI: 10.7172/2449-6634.jmcbem.2017.1.4
Journal of Marketing and Consumer Behaviour in Emerging Markets 1(5)2017 45
(45–62)
Infl uence of Retail Atmosphericsas Nonverbal Communication on Purchase Behaviour
in the Nigerian Retail Environment
Kizito Ogedi AlakweSchool of Media and Communication (SMC)
Pan-Atlantic UniversityKm 52 Ajah/Epe Express Road, Ibeju-Lekki, Lagos.
[email protected]+234-802-304-2156
Ngozi Okpara PhD.School of Media and Communication (SMC)
Pan-Atlantic UniversityKm 52 Ajah/Epe Express Road, Ibeju-Lekki, Lagos.
[email protected]+234-802-303-4916
Received 18 March 2017/ Revised: 21 April 2017/ Accepted: 10 May 2017/ Published online: 9 June 2017
ABSTRACT
This paper focuses on unravelling the impact of atmospherics on shopper purchase behaviour in emerging markets like Nigeria and attempts to isolate the atmospheric cue that is the most signifi cant predictor of shopper purchase decisions. The paper seeks to establish a correlation between the design, ambient and social cues in big shopping malls and buyer purchase behaviour. A quantitative and deductive approach is adopted. Data collection is through a survey, and the principal research instrument is the questionnaire. Results reveal that retail atmospherics exert some signifi cant infl uence on shopper purchase behaviour. Empirical analysis indicates that retail atmospherics account for 34% of shopper purchase behaviour and that design cues are the most signifi cant predictor of shopper purchase decision followed by ambient cues. Social cues do not exert any infl uence on purchase decisions. A ‘moderation’ and ‘mediation’ analysis revealed that though design and ambient cues infl uence purchase decisions independently, the interaction effect on each other is not signifi cant. Consequently, there is a need to understand why social factors do not play a role in purchase behaviour. More importantly, there is the need to identify and understand other factors that account for the balance of 66% in shoppers’ buying behaviour. Such a study might focus on factors such as pricing, sales promotion, loyalty programmes and other psycho-social factors which may work as key infl uencers in customers purchase decisions. For practical purposes, the focus should be on the design and ambient cues in the conceptualisation, development, and management of large retail stores.
JEL classifi cation: M30, M300
Keywords: retail atmospherics, ambience, shopper behaviour, shopper purchase decision, retail store environment, nonverbal communication

© Faculty of Management University of Warsaw. All rights reserved. DOI: 10.7172/2449-6634.jmcbem.2017.1.4
Journal of Marketing and Consumer Behaviour in Emerging Markets 1(5)2017
Kizito Ogedi Alakwe, Ngozi Okpara PhD.
46
(45–62)
1. INTRODUCTION
1.1. Background
The primary focus of communication is on the how, why, and with what effects people communicate through spoken language and associated nonverbal messages (Association of Communication Administration, 1981). According to Lasswell (1948), one of the essential functions of communications is the surveillance of the environment and responding to stimuli inherent in such environment. Such responses could be either psychological, physiological or in some cases behavioural. Consequently, the environment where we fi nd ourselves plays a signifi cant role in the way humans interpret both verbal and nonverbal cues emanating from such environment. Communication has two central components: verbal and nonverbal. The verbal part refers to spoken words we use during communication while the nonverbal one often refers to communication that is produced by some means other than words (Knapp and Hall, 2002). Recently, there has been an exponential growth in interest and consequent research in the role of nonverbal behaviour in communication in relation to a broad range of behaviours (Buck and VanLear, 2002). Of great interest are atmospheric elements inherent in retail store environments and the role they play in the shopper purchase decisions.
Over the years, scholars and practitioners in the fi eld of marketing and psychology have been interested in the reason why people buy and have made giant strides in understanding the key drivers of purchase decisions. The need for this study arose out of the shift in attention to the Nigerian market by major global retail chains, the increasing sophistication of the Nigerian shopper, and the limited resources available to satisfy human needs. Other factors include the advent of online retail stores like Jumia, Konga, Yudala, Kaymu and many others in Nigeria. With the malls came the promise of quality, convenience, after-sales service and total shopper satisfaction. These malls leverage on both verbal and nonverbal communication to achieve their business objectives. The structure and size of the shops, lighting, colours, merchandising, air-conditioning, and music are examples of atmospheric cues utilised to communicate nonverbally to shoppers.
While vast fi nancial resources are invested by the management of these malls in Nigeria, there is a need to drill further down to unearth the level of infl uence of these atmospheric cues on purchase behaviour, especially in the Nigerian retail space. Though the general perception is that they do exert some infl uence, there is a need to identify which atmospheric cues exert the most signifi cant infl uence on customer purchase behaviour. A clear understanding of shopper purchase behaviour in response to the myriads of atmospheric cues that exist in modern trade outlets will be critical to customer satisfaction and loyalty. It is, therefore, imperative to understand the effectiveness of this shopper attraction and retention strategy.
Globally, some studies have been carried out on retail atmospherics and customer behaviour. However, only a few focus on emerging markets such as Nigeria and none has approached the subject from a broad perspective that incorporates the categorisation of store atmospherics by Baker et. al. (1986) and their infl uence on shopper purchase behaviour. Attempts within the Nigerian space to study atmospherics focused on ‘store layout and customer loyalty’ (Onuoha and Nnennaya, 2017); ‘atmospherics and patronage in the banking sector’ (Adiele and Nwaeke, 2015); and ‘store atmosphere and impulse buying’ (Ukpabi et al., 2015). Consequently, this paper is unique in its originality as it adopts a holistic approach to understanding retail atmospherics as it affects shopper purchase behaviour. The study promises to add to scholarly knowledge by dissecting the infl uence of atmospheric cues on purchase behaviour and isolating the atmospheric cues that exert the most signifi cant infl uence on shopper purchase behaviour.

© Faculty of Management University of Warsaw. All rights reserved. DOI: 10.7172/2449-6634.jmcbem.2017.1.4
Journal of Marketing and Consumer Behaviour in Emerging Markets 1(5)2017
Kizito Ogedi Alakwe, Ngozi Okpara PhD.
47
(45–62)
1.2. The Place of Retail Space in the Marketing Mix
A crucial and vital component of the marketing mix is ‘place’ which is the point of interface between a business organisation with other elements of the marketing mix (product, price, and promotion) and the consumers. The centrality of ‘place’ is evident because the physical environment of retail outlets infl uences how customers feel (Baker et al., 2002). Place refers to the channels used to get an organisation’s product to its clients. In response to competition and the need to elicit customer loyalty, ‘place’ has become an arena that attracts a high level of creativity and innovation in the marketing value chain. The overarching objective is to create the right environment for sales to thrive. An appropriate place strategy will result in making goods available to consumers at the right location and time.
Aside from developing the right product, deploying customer-friendly price and educating both existing and potential customers on the key benefi ts of the product, ‘place’ is gradually becoming a key component of all marketing strategies. Most manufacturers and service providers have long acknowledged the centrality of the business environment – be it a mall, a retail shop, a banking hall or the reception area of a multinational organisation – as playing a key role in creating the right stimulus to attract and retain desired customers. In malls, manufacturers and supplier of goods go the extra mile to assist in creating the right ambience using various atmospheric cues that will make for a positive shopping experience. This is because the products on display at competing stores are often perceived as similar – hence the need for differentiation, leveraging on the environment.
1.3. Evolution of Retail Atmospherics as Nonverbal Communication
One of the mixed blessings of human history is that humans increasingly live, work, and play in an artifi cial environment (Kotler, 1973). The physical retail environment has provided the setting for consumer engagement and has become the focus of retailers and brand owners (Ogden-Barnes and Barclay, 2011). Fundamental advances in business processes include the recognition that people, in their purchase decision-making, respond to more than only a tangible product or service on offer (Kotler, 1973). Mulhern (1997) argues that retail business has experienced a shift in focus from traditional merchandising with its attendant attention to the marketing mix elements, to more active customer engagement and management through a more integrated approach. The emphasis, therefore, has now been placed on customer relationships, motivating and rewarding loyal customers and, at the same time, maintaining a cordial relationship with manufacturers.
Place design and management have been identifi ed as an essential marketing tool in building and sustaining brand equity. Trade channels are seen as points of consumer contact and engagement. The business of selecting and managing retailers for a specifi c brand is taken seriously by manufacturers as it can lead to customer satisfaction. Dodds, Kent and Dhruv (1991) identify signifi cant positive effects of store image on the perceived quality of merchandise. In some cases, the name of the retail outlet is a strong pointer to perceived quality, and this is why the quality of a given brand is seen differently depending on where it is on offer. Customer traffi c may likely be greater in a store with a positive atmosphere than in one with a negative atmosphere. Also, such stores provide greater customer satisfaction which leads to good will, loyalty and also stimulates word of mouth recommendations (Rao and Monroe, 1989; Zeithaml, 1988).
With the traditional retail channels in Nigeria giving way to modern malls (Shoprite, Game, Spar, Mega Plaza, and others), there is an increasing desire among these modern trade channels to compete favourably with the aim of increasing their bottom line. This remarkable increase in competition within the modern trade channels, in turn, stimulates the need to devise ways of achieving differentiation in the retail offering (Morrison et al., 2011). Aside from offering good quality products in line with consumer demands, malls now consider other factors like shelf

© Faculty of Management University of Warsaw. All rights reserved. DOI: 10.7172/2449-6634.jmcbem.2017.1.4
Journal of Marketing and Consumer Behaviour in Emerging Markets 1(5)2017
Kizito Ogedi Alakwe, Ngozi Okpara PhD.
48
(45–62)
design, lighting, colour, merchandising, music, sampling as forms of nonverbal communication in their aim to create an optimal shopping environment.
Research has identifi ed three primary sets of atmospheric cues utilised in many retail environments. These are design, ambient, and social factors (Baker, 1986).
Table 1Classifi cation of atmospheric cues
COMPONENTS OF THE PHYSICAL STORE ENVIRONMENT
Ambient Factors Represented by background conditions that exist below the level of our immediate awareness
Air quality• (Temperature/humidity/circulation/ventilation)Noise (Level & pitch)ScentCleanliness
Design Factors Represent stimuli that existat the forefrontof our awareness
Aesthetics• Architecture• Colour / style• Materials / décor• Scale / shape• Texture / pattern
Functional• Layout• Comfort• Shelf design• Signage• Accessories
Social Factors Refer to peoplein the environment
Audience (Customers)• Number• Appearance• Behaviour
Service personnel• Number• Appearance• Behaviour
Source: Baker et al. (1986)
1.4. Emergence of Modern Trade in Nigeria
It is obvious that the recession in Europe and North America at the dawn of the new millennium has led to a shift in attention towards the African market. The focus is largely on the Nigerian market probably because of the perceived large consumer population. Consequently, the Nigerian economy has witnessed an infl ux of foreign enterprises, multinationals, and mega retail chains which has led many economic analysts to predict a phenomenal growth in the Nigerian economy within the next fi ve years. This was boosted by the rebasing of the economy in 2014, which resulted in Nigeria evolving to be the biggest economy in Africa (The Economist, 2014), even though the dwindling oil revenue and current recession have caused Nigeria to drop to the second position in 2016.
This trend has led to the entry into the Nigerian market of big names in the global retail industry such as Spar, Shoprite, Mr Price, Woolworths and Game with more on the way. These retail chains came with promises of convenience, quality assurance, and after-sales service. As shoppers get more health conscious and more sophisticated, the perception that products sold in these malls are healthier and offer better quality than those sold in the open markets increases. Observation has revealed that products that require storage in particular environmental conditions are seen lying under the hot sun in the traditional open markets as is evident in the popular Alaba, Idumota, Oke-Arin and Ojuwoye markets in Lagos. Today, shoppers view these practices as health risks and thus will queue for fresh bread from the oven at Shoprite rather than buy from roadside shops and open markets.
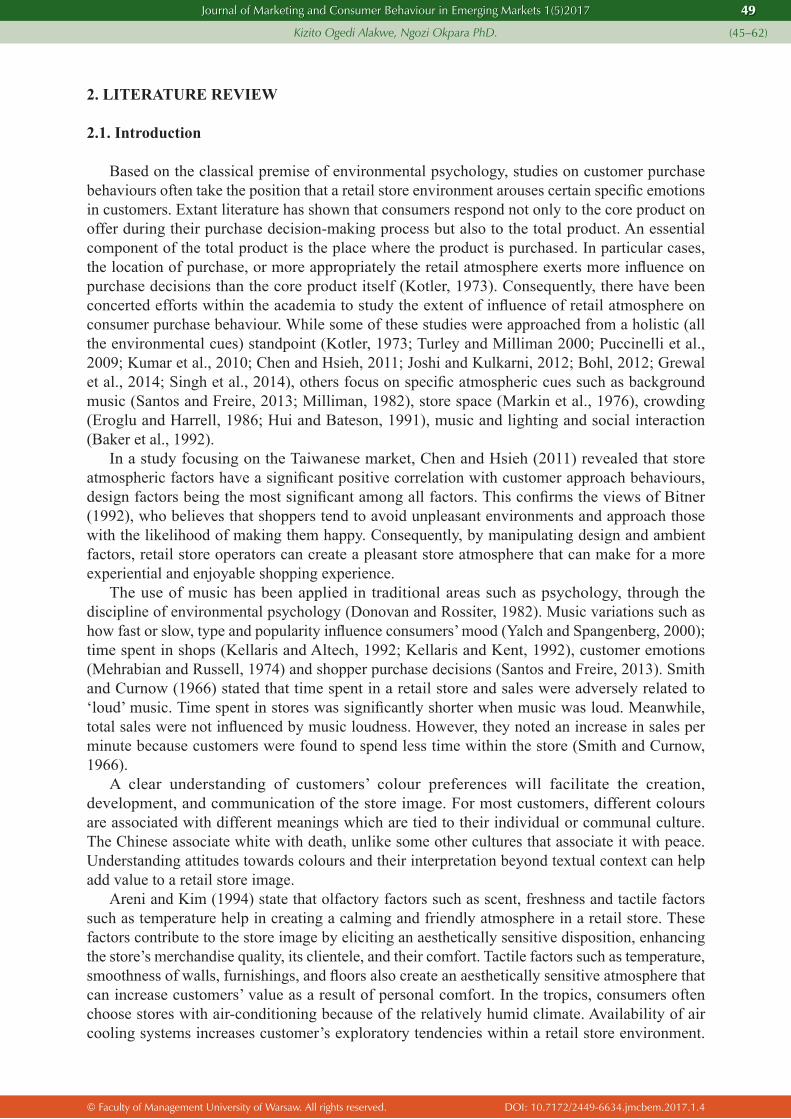
© Faculty of Management University of Warsaw. All rights reserved. DOI: 10.7172/2449-6634.jmcbem.2017.1.4
Journal of Marketing and Consumer Behaviour in Emerging Markets 1(5)2017
Kizito Ogedi Alakwe, Ngozi Okpara PhD.
49
(45–62)
2. LITERATURE REVIEW
2.1. Introduction
Based on the classical premise of environmental psychology, studies on customer purchase behaviours often take the position that a retail store environment arouses certain specifi c emotions in customers. Extant literature has shown that consumers respond not only to the core product on offer during their purchase decision-making process but also to the total product. An essential component of the total product is the place where the product is purchased. In particular cases, the location of purchase, or more appropriately the retail atmosphere exerts more infl uence on purchase decisions than the core product itself (Kotler, 1973). Consequently, there have been concerted efforts within the academia to study the extent of infl uence of retail atmosphere on consumer purchase behaviour. While some of these studies were approached from a holistic (all the environmental cues) standpoint (Kotler, 1973; Turley and Milliman 2000; Puccinelli et al., 2009; Kumar et al., 2010; Chen and Hsieh, 2011; Joshi and Kulkarni, 2012; Bohl, 2012; Grewal et al., 2014; Singh et al., 2014), others focus on specifi c atmospheric cues such as background music (Santos and Freire, 2013; Milliman, 1982), store space (Markin et al., 1976), crowding (Eroglu and Harrell, 1986; Hui and Bateson, 1991), music and lighting and social interaction (Baker et al., 1992).
In a study focusing on the Taiwanese market, Chen and Hsieh (2011) revealed that store atmospheric factors have a signifi cant positive correlation with customer approach behaviours, design factors being the most signifi cant among all factors. This confi rms the views of Bitner (1992), who believes that shoppers tend to avoid unpleasant environments and approach those with the likelihood of making them happy. Consequently, by manipulating design and ambient factors, retail store operators can create a pleasant store atmosphere that can make for a more experiential and enjoyable shopping experience.
The use of music has been applied in traditional areas such as psychology, through the discipline of environmental psychology (Donovan and Rossiter, 1982). Music variations such as how fast or slow, type and popularity infl uence consumers’ mood (Yalch and Spangenberg, 2000); time spent in shops (Kellaris and Altech, 1992; Kellaris and Kent, 1992), customer emotions (Mehrabian and Russell, 1974) and shopper purchase decisions (Santos and Freire, 2013). Smith and Curnow (1966) stated that time spent in a retail store and sales were adversely related to ‘loud’ music. Time spent in stores was signifi cantly shorter when music was loud. Meanwhile, total sales were not infl uenced by music loudness. However, they noted an increase in sales per minute because customers were found to spend less time within the store (Smith and Curnow, 1966).
A clear understanding of customers’ colour preferences will facilitate the creation, development, and communication of the store image. For most customers, different colours are associated with different meanings which are tied to their individual or communal culture. The Chinese associate white with death, unlike some other cultures that associate it with peace. Understanding attitudes towards colours and their interpretation beyond textual context can help add value to a retail store image.
Areni and Kim (1994) state that olfactory factors such as scent, freshness and tactile factors such as temperature help in creating a calming and friendly atmosphere in a retail store. These factors contribute to the store image by eliciting an aesthetically sensitive disposition, enhancing the store’s merchandise quality, its clientele, and their comfort. Tactile factors such as temperature, smoothness of walls, furnishings, and fl oors also create an aesthetically sensitive atmosphere that can increase customers’ value as a result of personal comfort. In the tropics, consumers often choose stores with air-conditioning because of the relatively humid climate. Availability of air cooling systems increases customer’s exploratory tendencies within a retail store environment.
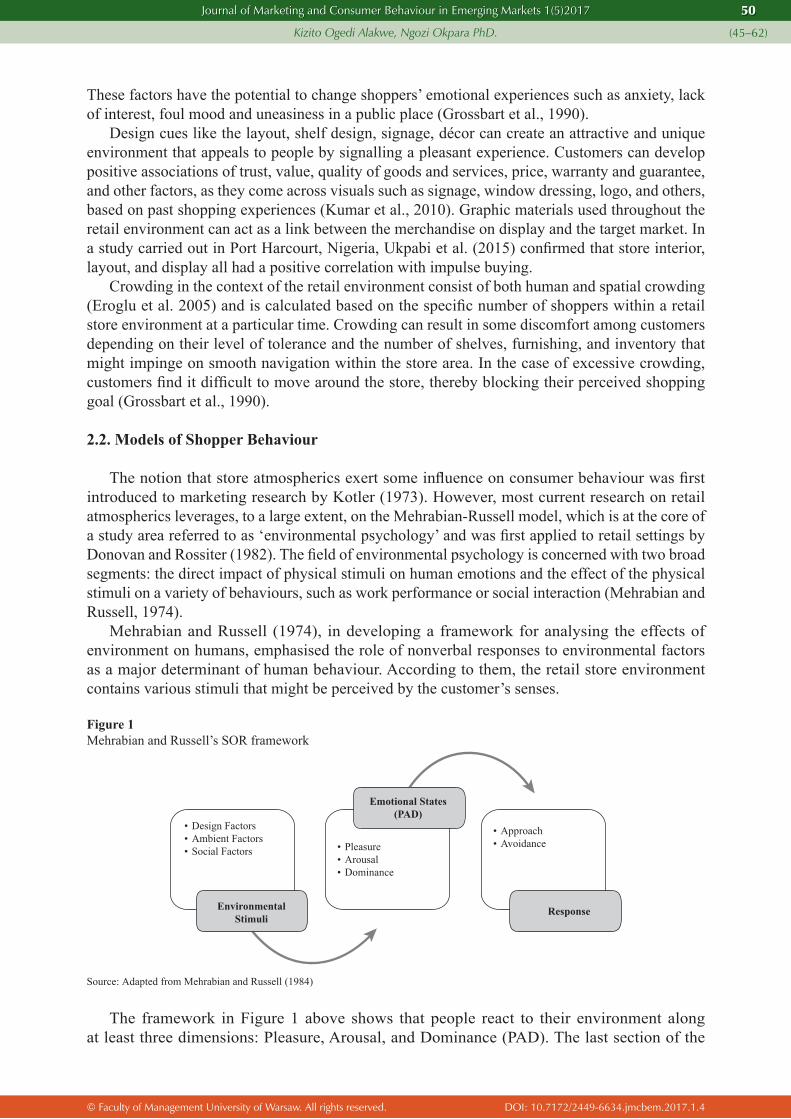
© Faculty of Management University of Warsaw. All rights reserved. DOI: 10.7172/2449-6634.jmcbem.2017.1.4
Journal of Marketing and Consumer Behaviour in Emerging Markets 1(5)2017
Kizito Ogedi Alakwe, Ngozi Okpara PhD.
50
(45–62)
These factors have the potential to change shoppers’ emotional experiences such as anxiety, lack of interest, foul mood and uneasiness in a public place (Grossbart et al., 1990).
Design cues like the layout, shelf design, signage, décor can create an attractive and unique environment that appeals to people by signalling a pleasant experience. Customers can develop positive associations of trust, value, quality of goods and services, price, warranty and guarantee, and other factors, as they come across visuals such as signage, window dressing, logo, and others, based on past shopping experiences (Kumar et al., 2010). Graphic materials used throughout the retail environment can act as a link between the merchandise on display and the target market. In a study carried out in Port Harcourt, Nigeria, Ukpabi et al. (2015) confi rmed that store interior, layout, and display all had a positive correlation with impulse buying.
Crowding in the context of the retail environment consist of both human and spatial crowding (Eroglu et al. 2005) and is calculated based on the specifi c number of shoppers within a retail store environment at a particular time. Crowding can result in some discomfort among customers depending on their level of tolerance and the number of shelves, furnishing, and inventory that might impinge on smooth navigation within the store area. In the case of excessive crowding, customers fi nd it diffi cult to move around the store, thereby blocking their perceived shopping goal (Grossbart et al., 1990).
2.2. Models of Shopper Behaviour
The notion that store atmospherics exert some infl uence on consumer behaviour was fi rst introduced to marketing research by Kotler (1973). However, most current research on retail atmospherics leverages, to a large extent, on the Mehrabian-Russell model, which is at the core of a study area referred to as ‘environmental psychology’ and was fi rst applied to retail settings by Donovan and Rossiter (1982). The fi eld of environmental psychology is concerned with two broad segments: the direct impact of physical stimuli on human emotions and the effect of the physical stimuli on a variety of behaviours, such as work performance or social interaction (Mehrabian and Russell, 1974).
Mehrabian and Russell (1974), in developing a framework for analysing the effects of environment on humans, emphasised the role of nonverbal responses to environmental factors as a major determinant of human behaviour. According to them, the retail store environment contains various stimuli that might be perceived by the customer’s senses.
Figure 1Mehrabian and Russell’s SOR framework
• Design Factors• Ambient Factors• Social Factors • Pleasure
• Arousal• Dominance
• Approach• Avoidance
Emotional States(PAD)
EnvironmentalStimuli
Response
Source: Adapted from Mehrabian and Russell (1984)
The framework in Figure 1 above shows that people react to their environment along at least three dimensions: Pleasure, Arousal, and Dominance (PAD). The last section of the

© Faculty of Management University of Warsaw. All rights reserved. DOI: 10.7172/2449-6634.jmcbem.2017.1.4
Journal of Marketing and Consumer Behaviour in Emerging Markets 1(5)2017
Kizito Ogedi Alakwe, Ngozi Okpara PhD.
51
(45–62)
Mehrabian-Russell framework is a list of possible behavioural reactions to the environment. Even though some shopping behaviours can be affected in different ways by environmental factors, Mehrabian and Russell (1974) classify the effects along the line of approach or avoidance. Consequently, retail environments could be constructed or designed to encourage shoppers to approach a shop or discourage them from entering. Thus, within the retail store environment, it is confi rmed that stimuli that elicit positive emotional responses almost always lead to approach behaviours, whereas those that elicit negative emotional responses result in avoidance (de Farias et al., 2014).
3. METHODS AND PROCEDURE
3.1. Research Design
Based on the Mehrabian-Russell S-O-R framework, this study sought to create an understanding of how retail atmospherics infl uence customers’ purchase behaviour given the shift from shopping in traditional shops to malls in Lagos, Nigeria. The research design is shown in Figure 2 below.
Figure 2Framework for research methodology
RESEARCHMETHOD• Survey
SAMPLINGTECHNIQUE• Non-probability
RESEARCHDESIGN• Quantitative• Correlational
DATA ANALYSIS• Correlation• Multiple Linear regression
RESEARCHINSTRUMENT• Questionnaire• (5-point Likert scale)
Source: authors
3.2. Research questions
A clear understanding of shopper purchase behaviour in response to the myriads of atmospheric cues that exist in modern trade outlets (malls) is crucial to customer satisfaction and loyalty. An enormous amount of fi nancial and material resources is always spent on creating the ‘right’ ambience and an environment that promises to impact positively on shoppers’ purchase decisions. It is, therefore, imperative to understand the effectiveness of this shopper attraction and retention strategy. The key research questions, therefore, include:1. What atmospheric cues are mostly utilised at shopping malls?2. In what way does an atmospheric cue relate with shopper purchase behaviour?3. Which category of atmospheric cues signifi cantly predicts a purchase decision?4. What form of relationship exists between predictors of purchase behaviour?
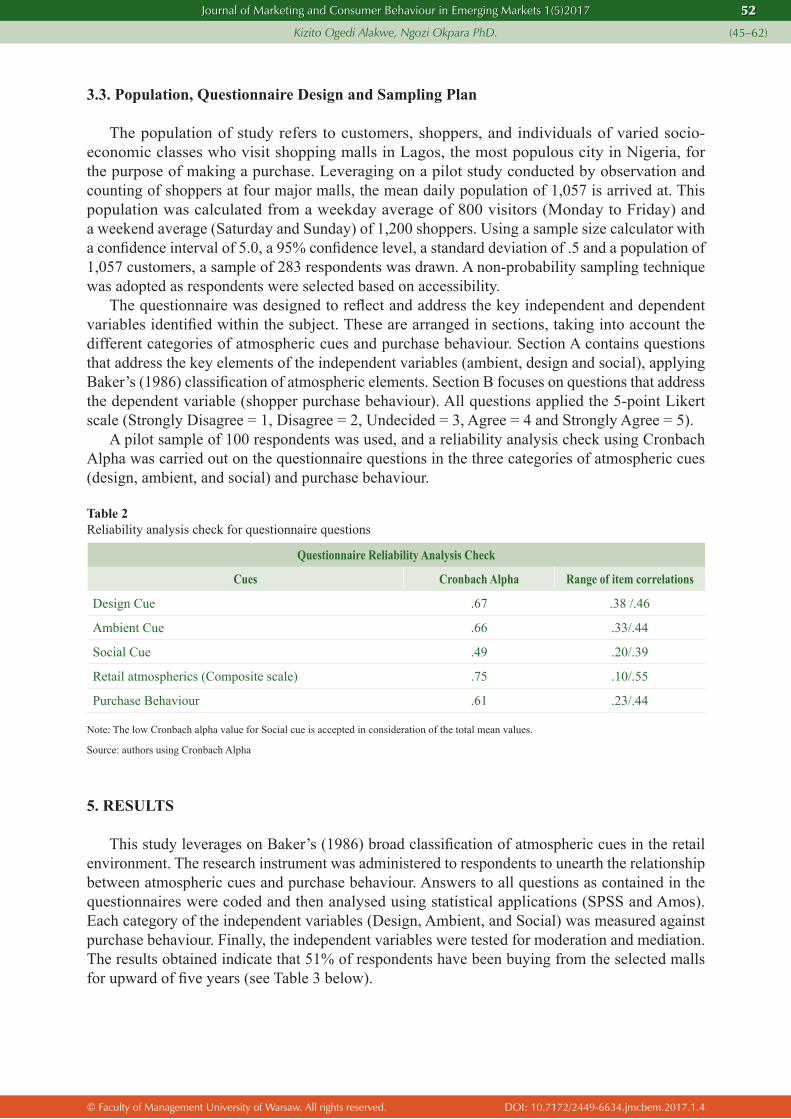
© Faculty of Management University of Warsaw. All rights reserved. DOI: 10.7172/2449-6634.jmcbem.2017.1.4
Journal of Marketing and Consumer Behaviour in Emerging Markets 1(5)2017
Kizito Ogedi Alakwe, Ngozi Okpara PhD.
52
(45–62)
3.3. Population, Questionnaire Design and Sampling Plan
The population of study refers to customers, shoppers, and individuals of varied socio-economic classes who visit shopping malls in Lagos, the most populous city in Nigeria, for the purpose of making a purchase. Leveraging on a pilot study conducted by observation and counting of shoppers at four major malls, the mean daily population of 1,057 is arrived at. This population was calculated from a weekday average of 800 visitors (Monday to Friday) and a weekend average (Saturday and Sunday) of 1,200 shoppers. Using a sample size calculator with a confi dence interval of 5.0, a 95% confi dence level, a standard deviation of .5 and a population of 1,057 customers, a sample of 283 respondents was drawn. A non-probability sampling technique was adopted as respondents were selected based on accessibility.
The questionnaire was designed to refl ect and address the key independent and dependent variables identifi ed within the subject. These are arranged in sections, taking into account the different categories of atmospheric cues and purchase behaviour. Section A contains questions that address the key elements of the independent variables (ambient, design and social), applying Baker’s (1986) classifi cation of atmospheric elements. Section B focuses on questions that address the dependent variable (shopper purchase behaviour). All questions applied the 5-point Likert scale (Strongly Disagree = 1, Disagree = 2, Undecided = 3, Agree = 4 and Strongly Agree = 5).
A pilot sample of 100 respondents was used, and a reliability analysis check using Cronbach Alpha was carried out on the questionnaire questions in the three categories of atmospheric cues (design, ambient, and social) and purchase behaviour.
Table 2Reliability analysis check for questionnaire questions
Questionnaire Reliability Analysis Check
Cues Cronbach Alpha Range of item correlations
Design Cue .67 .38 /.46
Ambient Cue .66 .33/.44
Social Cue .49 .20/.39
Retail atmospherics (Composite scale) .75 .10/.55
Purchase Behaviour .61 .23/.44
Note: The low Cronbach alpha value for Social cue is accepted in consideration of the total mean values.
Source: authors using Cronbach Alpha
5. RESULTS
This study leverages on Baker’s (1986) broad classifi cation of atmospheric cues in the retail environment. The research instrument was administered to respondents to unearth the relationship between atmospheric cues and purchase behaviour. Answers to all questions as contained in the questionnaires were coded and then analysed using statistical applications (SPSS and Amos). Each category of the independent variables (Design, Ambient, and Social) was measured against purchase behaviour. Finally, the independent variables were tested for moderation and mediation. The results obtained indicate that 51% of respondents have been buying from the selected malls for upward of fi ve years (see Table 3 below).

© Faculty of Management University of Warsaw. All rights reserved. DOI: 10.7172/2449-6634.jmcbem.2017.1.4
Journal of Marketing and Consumer Behaviour in Emerging Markets 1(5)2017
Kizito Ogedi Alakwe, Ngozi Okpara PhD.
53
(45–62)
Table 3Length of time as customer
Number of Years as a Customer
Frequency Percent Valid Percent Cumulative Percent
Valid
Less than a month 34 12.0 12.1 12.1
Up to 6 months 38 13.4 13.5 25.5
Up to a year 65 22.9 23.0 48.6
Up to 5 years 145 51.1 51.4 100.0
Total 282 99.3 100.0
Missing System 2 .7
Total 284 100.0
Source: authors using SPSS
This is an indication that these malls enjoy a high level of loyalty from their patrons. Those shoppers who have visited the mall for less than a month represent just 12% of the total shoppers at the mall.
Frequency of visit
Table 4Frequency of visits
Frequency of Visit
Frequency Percent Valid Percent Cumulative Percent
Valid
Once a day 44 15.5 15.6 15.6
Once in 2 days 33 11.6 11.7 27.3
Once in a week 89 31.3 31.6 58.9
Twice a month 57 20.1 20.2 79.1
Once in a month 59 20.8 20.9 100.0
Total 282 99.3 100.0
Missing System 2 .7
Total 284 100.0
Source: authors using SPSS
The result here shows that 32% of the shoppers visit the mall at least once in a week. This, to a large extent, supports the notion that most families shop weekly for household items. The result also supports the high percentage of loyal customers seen in the result from general question number two above.
Key Atmospheric Cues in Retail Space
A frequency count of the positive responses (strongly agree and agree alone) from respondents while discounting the negative responses (strongly disagree, disagree and undecided) shows that the atmospheric cue most important to shoppers is the location (a design cue) followed by lighting (an ambient cue). Queues are the least attractive to most customers.

© Faculty of Management University of Warsaw. All rights reserved. DOI: 10.7172/2449-6634.jmcbem.2017.1.4
Journal of Marketing and Consumer Behaviour in Emerging Markets 1(5)2017
Kizito Ogedi Alakwe, Ngozi Okpara PhD.
54
(45–62)
Table 5Key atmospheric cues
Key Atmospheric Cues in Retail Space
S/NO Categories Variables Percentage
1
Design Factors
Location 87.4
2 General structure 80.3
3 Shelves 80.6
4 Ease of browsing 73.5
5 Product arrangement 84.1
6
Ambient Factors
Colour 70.8
7 Lighting 86.7
8 Scent / fragrance 61.6
9 Sound 66.9
10 Music 54.9
11 Temperature 66.9
12
Social Factors
Product demo 59.5
13 Queues 36.6
14 Crowding 37.1
15 Noise 41.3
16 Staff 78.2
17 Mall attendants 48.2
Source: authors using SPSS
However, using the mean values of all data from respondents which link the atmospheric variables to the purchase behaviour variables, it was observed that ambient cues account for a higher proportion of atmospheric cues deployed and utilised at the malls.
Table 6Mean value of key atmospherics
Mean Value of Key Atmospherics
Atmospheric Cue Mean Standard Deviation Ranking
Design 19.31 2.98 2
Ambient 21.90 3.50 1
Social 18.99 3.45 3
Source: authors using SPSS
Using statistical tools and based on the average values, ambient cue (21.90) is deployed more and attracts more attention from the management of malls compared to other cues: design cue (19.31) and social cue (18.99).

© Faculty of Management University of Warsaw. All rights reserved. DOI: 10.7172/2449-6634.jmcbem.2017.1.4
Journal of Marketing and Consumer Behaviour in Emerging Markets 1(5)2017
Kizito Ogedi Alakwe, Ngozi Okpara PhD.
55
(45–62)
Relationship Between Retail Atmospherics and Purchase Behaviour
Table 7Correlation between atmospherics and purchase behaviour
Correlation Between Atmospherics and Purchase Behaviour
Atmospheric Cue Purchase Behaviour
Atmospheric Cue
Pearson Correlation 1 .335**
Sig. (2-tailed) .000
N 282 282
Purchase Behaviour
Pearson Correlation .335** 1
Sig. (2-tailed) .000
N 282 284
**. Correlation is signifi cant at the 0.01 level (2-tailed).
Purchase Behaviour Signifi cance
Atmospheric Cue .34** P<.01
N (282)
**P<.01 at 2-tailed
Source: authors using SPSS
The table above shows that there is a positive correlation between the atmospheric cues at the malls and customers’ purchase behaviour since correlation is signifi cant at the 0.01 level with P<.01. The result above confi rms that purchase behaviour in malls is positively infl uenced by atmospherics.
Key Predictor of Purchase Behaviour
Table 8Key predictor of purchase behaviour
Coeffi cientsa
ModelUnstandardised Coeffi cients Standardised
Coeffi cients t Sig.Collinearity
Statistics
B Std. Error Beta Tolerance
1
(Constant) 10.982 1.345 8.165 .000
Design cue .278 .067 .277 4.167 .000 .700
Ambient cue .113 .057 .132 1.973 .049 .690
Social cue .019 .051 .021 .364 .716 .898
B SEB βConstant 10.98 1.35Design cues .28 .07 .28**Ambient cues .11 .06 .13*Social cues .02 .05 .71
**P<.01 *P<.05 Dependent variable Purchase decision
Source: authors using SPSS

© Faculty of Management University of Warsaw. All rights reserved. DOI: 10.7172/2449-6634.jmcbem.2017.1.4
Journal of Marketing and Consumer Behaviour in Emerging Markets 1(5)2017
Kizito Ogedi Alakwe, Ngozi Okpara PhD.
56
(45–62)
Y = a + B1x1 + B2X2
The result above shows that for every one unit increase in design cues, a shopper’s purchase decision increases by a value of .28 of a standard deviation at P<.01. This value confi rms that design cues are signifi cant positive predictors of shopper purchase behaviour, and proves that the positive prediction of purchase behaviour by design cues does not arise out of error. Furthermore, the results also show that for every one unit increase in ambient cues, a shopper’s purchase decision increases by a value of .13 of a standard deviation at P<.05. Thus, the ambient cue is a signifi cant predictor of shopper purchase decisions. With a value of P>.05, social cues do not predict a purchase decision.
Test for Moderation Effect of Key Predictors of Purchase Behaviour
A test for moderation between ambient and design cues showed non-signifi cance and thus does not tell any different story. However, design and ambience cues independently continue to exhibit a signifi cant relationship with purchase behaviour. Consequently, the variables are not moderators by themselves for purchase behaviour (see table below).
Table 9Test for moderation
Tests of Between-Subjects Effects
Dependent Variable: Purchase Behaviour
Source Type III Sum of Squares df Mean Square F Sig. Partial Eta Squared
Corrected Model 275.705a 3 91.902 11.307 .000 .108
Intercept 89613.371 1 89613.371 11025.193 .000 .975
Design 98.506 1 98.506 12.119 .001 .041
Ambient 107.850 1 107.850 13.269 .000 .045
Design * Ambient 7.483 1 7.483 .921 .338 .003
Error 2275.855 280 8.128
Total 107253.000 284
Corrected Total 2551.560 283
a. R Squared = .108 (Adjusted R Squared = .098)b. The design and ambient data were split into two by the mean values to achieve the categories
Source: authors using SPSS
Testing for the Mediation Effect of AmbienceA test for the mediation effect of ambient cues on design cues also showed non-signifi cance
even though they independently exhibit a signifi cant relationship with purchase behaviour. Since the previous statistical analysis indicates that the design cue is the most important predictor of purchase behaviour, a test was carried out to investigate the mediating effect of ambience on design cues. The key assumptions for Mediation is that the mediator (Ambience) must have a signifi cant relationship with the dependent variable (Purchase Behaviour) and the predictor (Design). However, in the results below, the mediator has a signifi cant association with the independent variable, but no relationship with the dependent variable. Thus, the assumptions for mediation are violated.
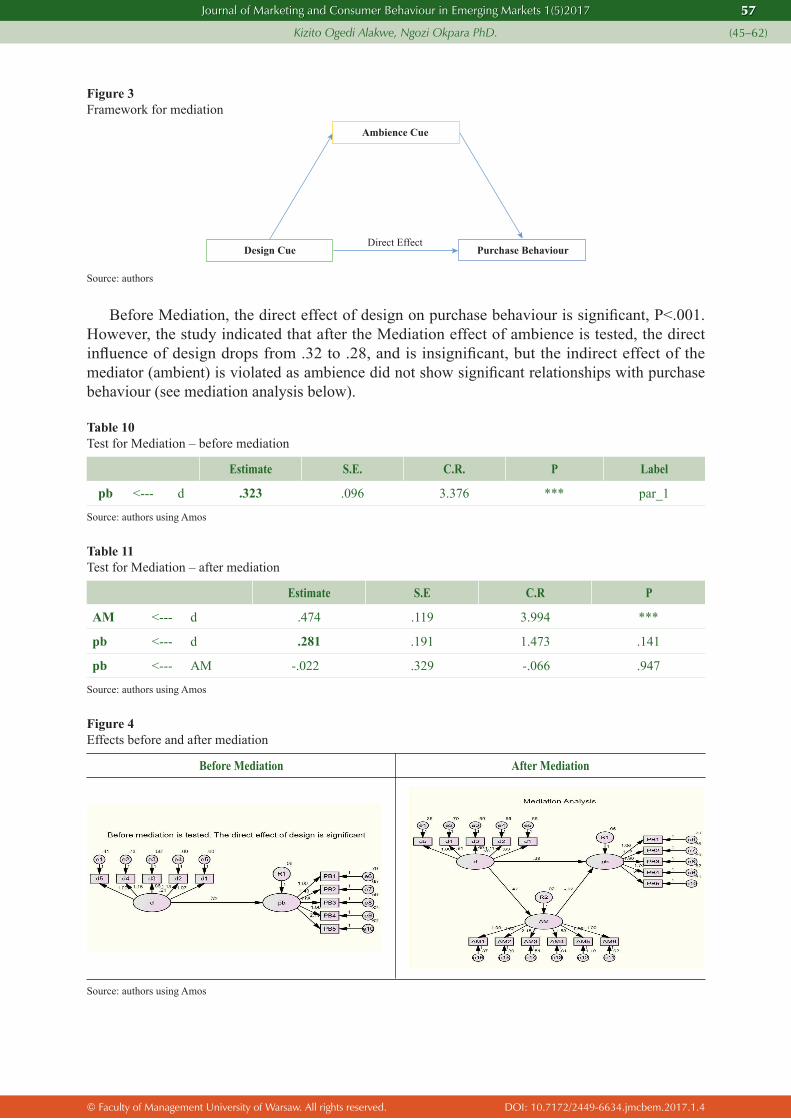
© Faculty of Management University of Warsaw. All rights reserved. DOI: 10.7172/2449-6634.jmcbem.2017.1.4
Journal of Marketing and Consumer Behaviour in Emerging Markets 1(5)2017
Kizito Ogedi Alakwe, Ngozi Okpara PhD.
57
(45–62)
Figure 3Framework for mediation
Ambience Cue
Design CueDirect Effect
Purchase Behaviour
Source: authors
Before Mediation, the direct effect of design on purchase behaviour is signifi cant, P<.001. However, the study indicated that after the Mediation effect of ambience is tested, the direct infl uence of design drops from .32 to .28, and is insignifi cant, but the indirect effect of the mediator (ambient) is violated as ambience did not show signifi cant relationships with purchase behaviour (see mediation analysis below).
Table 10Test for Mediation – before mediation
Estimate S.E. C.R. P Label
pb <--- d .323 .096 3.376 *** par_1
Source: authors using Amos
Table 11Test for Mediation – after mediation
Estimate S.E C.R P
AM <--- d .474 .119 3.994 ***
pb <--- d .281 .191 1.473 .141
pb <--- AM -.022 .329 -.066 .947
Source: authors using Amos
Figure 4Effects before and after mediation
Before Mediation After Mediation
Source: authors using Amos
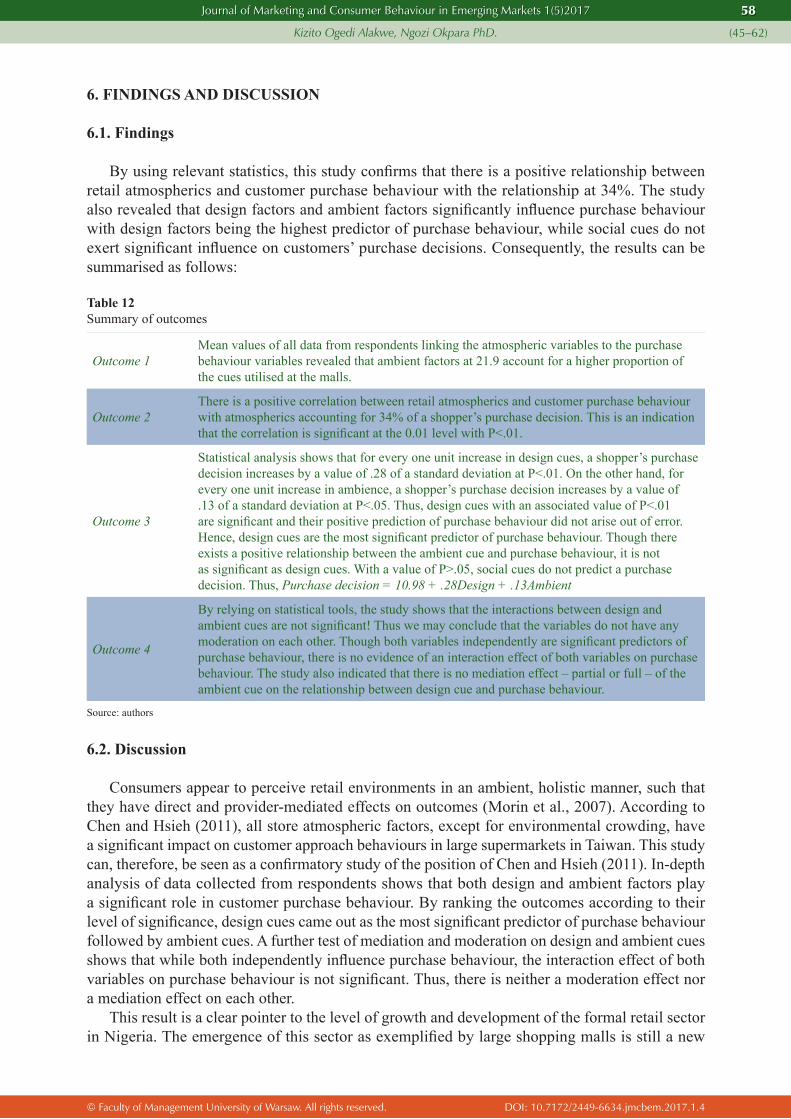
© Faculty of Management University of Warsaw. All rights reserved. DOI: 10.7172/2449-6634.jmcbem.2017.1.4
Journal of Marketing and Consumer Behaviour in Emerging Markets 1(5)2017
Kizito Ogedi Alakwe, Ngozi Okpara PhD.
58
(45–62)
6. FINDINGS AND DISCUSSION
6.1. Findings
By using relevant statistics, this study confi rms that there is a positive relationship between retail atmospherics and customer purchase behaviour with the relationship at 34%. The study also revealed that design factors and ambient factors signifi cantly infl uence purchase behaviour with design factors being the highest predictor of purchase behaviour, while social cues do not exert signifi cant infl uence on customers’ purchase decisions. Consequently, the results can be summarised as follows:
Table 12Summary of outcomes
Outcome 1Mean values of all data from respondents linking the atmospheric variables to the purchase behaviour variables revealed that ambient factors at 21.9 account for a higher proportion of the cues utilised at the malls.
Outcome 2There is a positive correlation between retail atmospherics and customer purchase behaviour with atmospherics accounting for 34% of a shopper’s purchase decision. This is an indication that the correlation is signifi cant at the 0.01 level with P<.01.
Outcome 3
Statistical analysis shows that for every one unit increase in design cues, a shopper’s purchase decision increases by a value of .28 of a standard deviation at P<.01. On the other hand, for every one unit increase in ambience, a shopper’s purchase decision increases by a value of .13 of a standard deviation at P<.05. Thus, design cues with an associated value of P<.01 are signifi cant and their positive prediction of purchase behaviour did not arise out of error. Hence, design cues are the most signifi cant predictor of purchase behaviour. Though there exists a positive relationship between the ambient cue and purchase behaviour, it is not as signifi cant as design cues. With a value of P>.05, social cues do not predict a purchase decision. Thus, Purchase decision = 10.98 + .28Design + .13Ambient
Outcome 4
By relying on statistical tools, the study shows that the interactions between design and ambient cues are not signifi cant! Thus we may conclude that the variables do not have any moderation on each other. Though both variables independently are signifi cant predictors of purchase behaviour, there is no evidence of an interaction effect of both variables on purchase behaviour. The study also indicated that there is no mediation effect – partial or full – of the ambient cue on the relationship between design cue and purchase behaviour.
Source: authors
6.2. Discussion
Consumers appear to perceive retail environments in an ambient, holistic manner, such that they have direct and provider-mediated effects on outcomes (Morin et al., 2007). According to Chen and Hsieh (2011), all store atmospheric factors, except for environmental crowding, have a signifi cant impact on customer approach behaviours in large supermarkets in Taiwan. This study can, therefore, be seen as a confi rmatory study of the position of Chen and Hsieh (2011). In-depth analysis of data collected from respondents shows that both design and ambient factors play a signifi cant role in customer purchase behaviour. By ranking the outcomes according to their level of signifi cance, design cues came out as the most signifi cant predictor of purchase behaviour followed by ambient cues. A further test of mediation and moderation on design and ambient cues shows that while both independently infl uence purchase behaviour, the interaction effect of both variables on purchase behaviour is not signifi cant. Thus, there is neither a moderation effect nor a mediation effect on each other.
This result is a clear pointer to the level of growth and development of the formal retail sector in Nigeria. The emergence of this sector as exemplifi ed by large shopping malls is still a new
© Faculty of Management University of Warsaw. All rights reserved. DOI: 10.7172/2449-6634.jmcbem.2017.1.4
Journal of Marketing and Consumer Behaviour in Emerging Markets 1(5)2017
Kizito Ogedi Alakwe, Ngozi Okpara PhD.
59
(45–62)
phenomenon as a majority of the populace still patronise the informal, open market for shopping. Consequently, the design aspects of retail stores have been seen as an ideal convergence of artistic ideas, instinct, and business in a planned and profi table manner (Kumar et al., 2010). Customers fi nd the general layout of the malls, the positioning of shelves, signage, and arrangement of products on the shelves very attractive. Thus, there is a need for retailers to consistently create or identify new locations where space, cost, and fl exibility are designed in such a way that they effectively communicate brand value and attract consumers (Din, 2000). The general layout of a retail store, therefore, can communicate value by increasing comfort, product quality, price, the size of inventory and effi ciency in browsing through the shelves. These shoppers are willing to pay more for a product seen in a big shopping mall than in traffi c or open markets in Lagos. One can assert that favourable environment facilitates the development of positive associations of trust, value, and quality.
The effect of ambient cues on shopper behaviour supports man’s innate attraction to a relaxed environment. The combination of fragrance, lighting, air-conditioning, the colour of painting creates a relaxed and welcoming atmosphere at malls. Areni and Kim (1994) were able to relate in-store illumination, shopper’s cognition, the perception of value and consumption patterns to consumers’ arousal and vision. At variance with the results of this study, earlier studies on retail atmospherics tend to support the view that crowding has a negative infl uence on consumer evaluations of the shopping experience (Turley and Milliman, 2000). Crowding has a negative impact on browsing and comparison shopping, some purchases, postponed shopping, going to another shop (Grossbart et al., 1990) and quality perceptions (Wakefi eld and Blodgett, 2002) seen in Turley and Milliman (2000). This view is supported by Chen and Hsieh (2011) and Graa et al. (2014). Conversely, Joshi and Kulkarni (2012) and Singh et al. (2014) arrived at the conclusion that social cues do indeed exert a positive infl uence on shopper behaviour. However, the results here indicate that malls represent a signifi cant improvement with regard to crowding when compared with the huge crowds that characterise the open markets in Nigeria. Hence, crowding, a social cue, does not have a signifi cant infl uence on shopper purchase behaviour.
The non-signifi cance of social cues on shopper purchase behaviour can be attributed to the fact that unlike clubs and bars, most malls in Nigeria are not designed with socialisation in mind. Again, because they are located in the major cities as against rural areas, the probability of meeting an acquaintance within the mall is little. For most shoppers, a visit to the mall is primarily to shop and not to socialise. Through direct observation, it was noticed that most shoppers were in a hurry to leave after shopping and had little or no time for socialisation.
Testing for mediation and moderation between design and ambient cues reveals some fascinating facts. The results for both tests turned out to be insignifi cant. The non-signifi cance is not surprising in an environment where the primary touch point for shoppers are the open markets and neighbourhood shops where both design and ambient factors are relegated to the background. The emergence of modern trade (malls) in Nigeria is a recent phenomenon, and it will take a while for shoppers to get used to the positive atmosphere promised by these malls and see them as standard in their shopping experience.
In summary, even though design and ambient cues signifi cantly infl uence shopper behaviour, customers will still buy in unsophisticated ambient and design.
7. CONCLUSION
This research has further proven the relevance of the Stimulus – Organism – Response (SOR) model of Mehrabian and Russell in shopper purchase behaviour. The study revealed that store-induced pleasure is robust enough to attract customers to a retail environment. Thus, people will
© Faculty of Management University of Warsaw. All rights reserved. DOI: 10.7172/2449-6634.jmcbem.2017.1.4
Journal of Marketing and Consumer Behaviour in Emerging Markets 1(5)2017
Kizito Ogedi Alakwe, Ngozi Okpara PhD.
60
(45–62)
likely visit those shops that elicit pleasurable experience. Using the research objectives as spelt out for this study, the study concludes as follows:• Malls deploy a variety of atmospheric elements in their bid towards attracting and retaining
customers, but the most obvious are the ambient factors.• There is a positive correlation between retail atmospherics and customer purchase behaviour
with atmospherics accounting for 34%.• Though ambient cues were found to infl uence buying behaviour, the most signifi cant
predictor of purchase behaviour is designed cues. Social cues do not play any signifi cant role in customer purchase behaviour. Furthermore, there is no evidence of a moderating and mediating effect between the predictors of purchase behaviour. While design cues and ambient cues independently infl uence shopper purchase behaviour, there is no moderation or mediating effect of ambient cues on design cues.There is a need to understand why social factors do not play a role in purchase behaviour and
explore ways to incorporate socialisation in the purchase decision process of customers. Focus at this stage of development in modern trade should be on achieving conversion from shopping in the open markets and neighbourhood stores to large malls. This is because of the no moderation and mediation between the signifi cant predictors of purchase behaviour. More importantly, there is the need to identify and understand other factors that account for the balance of 66% since this study has shown that atmospherics account for just 34% of shoppers’ purchase behaviour. Such research might focus on factors such as pricing, sales promotion, loyalty programmes and other psycho-social factors which may work as key infl uencers in customers purchase decisions.
The Nigerian retailer needs to consistently create or identify new locations where space, cost, and fl exibility are designed in such a way that they effectively communicate brand value and attract consumers (Din, 2000). This is because the general layout of a retail store can communicate value by increasing comfort, product quality, price, the size of inventory and effi ciency in browsing through the shelves. The effect of ambient cues on shopper behaviour supports man’s innate attraction to a relaxed environment. The combination of lighting, air-conditioning and the colour of painting creates a relaxed and welcoming atmosphere and facilitates a smooth and stress-free shopping experience.
References
Adiele, K.C. and Nwaeke, L.I. (2015) ‘Effect of atmospherics on bank patronage behaviour: Lessons from Nigeria retail banks’, Review of Communication and Media Studies, Vol. 1 No. 2, pp. 153–163.
Areni, C.S. and Kim, D. (1994) ‘The infl uence of in-store lighting on consumers’ examination of merchandise in a wine store’, International Journal of Research in Marketing, Vol. 11, pp. 117–125.
Association of Communication Administration (1981) Careers in communication arts and science. Falls Church, VA.Baker, J. (1986) ‘The role of environment in marketing services: The consumer perspective’, in: Czpeil, J.A.,
Congram, C. and Shanahan, J. (Eds.), The services marketing challenge: Integrated for competitive advantage, American Marketing Association, Chicago, pp. 79–84.
Baker, J., Levy, M. and Grewal, D. (1992) ‘An experimental approach to making retail store environmental decisions’, Journal of Retailing, Vol. 68 No. 4, pp. 445–461.
Baker, J.A., Parasuraman, A., Grewal, D. and Voss, G.B. (2002) ‘The infl uence of multiple store environment cues on perceived merchandise value and patronage intentions’, Journal of Marketing, Vol. 66 No. 2, pp. 120–141.
Bitner, M.J. (1992) ‘Servicescapes: The impact of physical surroundings on customers and employees’, Journal of Marketing, Vol. 56, pp. 57–71.
Bohl, P. (2012) ‘The effects of store atmosphere on shopping behaviour – A literature review’, Corvinus Marketing Tanulmanyok, Vol. 1, pp. 1–23.
Buck, R. and VanLear, A.C. (2002) ‘Verbal and nonverbal communications: Distinguishing symbolic, spontaneous, and pseudo-spontaneous nonverbal behavior’, Journal of Communications, pp. 522–541.
Chen, H.-S. and Hsieh, T. (2011) ‘The effect of atmosphere on customer perceptions and customer behaviour responses in chain store supermarkets’, African Journal of Business Management (Academic Journals), Vol. 5 No. 24.

© Faculty of Management University of Warsaw. All rights reserved. DOI: 10.7172/2449-6634.jmcbem.2017.1.4
Journal of Marketing and Consumer Behaviour in Emerging Markets 1(5)2017
Kizito Ogedi Alakwe, Ngozi Okpara PhD.
61
(45–62)
Din, R. (2000) New Retail. London: Conran Octopus.Dodds, W.B, Monroe, K.B. and Grewal, D. (1991) ‘Effects of price, brand, and store information on buyers’ product
evaluation’, Journal of Marketing Research, Vol. 28, pp. 307–319.Donovan, R.J. and Rossiter, J.R. (1982) ‘Store Atmosphere: An environmental psychology approach’, Journal of
Retailing, Vol. 58, pp. 34–57.Eroglu, S.A., Machleit, K.A. and Chebat, J. (2005) ‘The Interaction of Retail Density and Music Tempo: Effects
on Shopper Responses’, Psychology & Marketing, Vol. 22 No. 7, pp. 577–589. http://dx.doi.org/10.1002/mar.20074.
Eroglu, S.A. and Harrell, G.D. (1986) ‘Retail crowding: Theoretical and strategic implications’, Journal of Retailing, Vol. 62 (Winter), pp. 346–363.
de Farias, S.A., Aguiar, E.C. and Melo, F.V. (2014) ‘Store atmospherics and experiential marketing: A conceptual framework and research propositions for an extraordinary customer experience’, International Business Research, Vol. 7 No. 2, pp. 87–99.
Grewal, D., Roggeveen, A.L., Puccinelli, N.M. and Spence, C. (2014) ‘Retail atmospherics and in-store nonverbal cues: An introduction’, Psychology and Marketing (Wiley Periodicals), Vol. 31 No. 7, pp. 469–471. doi:10.1002/mar.20708.
Grossbart, S., Hampton, R., Rammohan, B. and Lapidus, R.S. (1990) ‘Environmental dispositions and customer response to store atmospherics’, Journal of Business Research, Vol. 21, pp. 225–241.
Hui, M.J. and Bateson, J.G. (1991) ‘Perceived control and the effects of crowding and consumer choice on the service encounter’, Journal of Consumer Research, Vol. 18 (September), pp. 174–184.
Joshi, J.V. and Kulkarni, V.R. (2012) ‘A factorial study of impact of store atmospherics in organized retail chain stores on consumers shopping experience’, Management Insight. Vol. VIII No. 2, pp. 89–98.
Kellaris, J.J. and Altsech, M.B. (1992) ‘The experience of time as a function of musical loudness and gender listener’, Advances in Consumer Research, pp. 725–729.
Kellaris, J.J. and Kent, R. (1992) ‘The infl uence of music on consumers’ temporal perceptions: Does time fl y when you’re having fun? ’ Journal of Consumer Psychology, Vol. 1, pp. 365–376.
Knapp, M.L. and Hall, J.A. (2002) Nonverbal communication in human interaction (5th). Wadsworth: Thomson Learning, Inc.
Kotler, P. (1973) ‘Atmospherics as a marketing tool’, Journal of Retailing, Vol. 49 No. 4, pp. 48–64.Kumar, I., Garg, R. and Rahman, Z. (2010) ‘Infl uence of retail atmospherics on consumer value in an emerging
market condition’, Great Lakes Herald, Vol. 4 No. 1, pp. 1–13.Lasswell, H.D. (1948) ‘The structure and function of communication in society’, in: Byon, L. (Ed), The communication
of ideas, Harper & Row, New York.Markin, R.J., Lullis, C.M. and Narayana, C.L. (1976) ‘Social-psychological signifi cance of store space’, Journal of
Retailing, Vol. 52 (Spring), pp. 43–55.Meenakumari, S. (2013) ‘Store interior atmospherics and impulsive buying behaviour’, Journal of Management,
Vol. 1 No. 1, pp. 87–92.Mehrabian, A. and Russell, J.A. (1974) An approach to environmental psychology. Cambridge, Massachusetts: MIT
Press.Milliman, R.E. (1982) ‘Using Background Music to Affect the Behavior of Supermarket Shoppers’, Journal of
Marketing, Vol. 46, pp. 86–91.Morin, S., Dube, L. and Chebat, J.-C. (2007) ‘The role of pleasant music in servicescapes: A test of the dual of
environmental perception’, Journal of Retailing, Vol. 83 No. 1, pp. 115–130.Morrison, M., Gan, S., Dubelaar, C. and Oppewal, H. (2011) ‘In-store music and aroma infl uences on shopper
behaviour and satisfaction’, Journal of Business Research, Vol. 64, pp. 558–564.Mulhern, F.J. (1997) ‘Retail marketing: From distribution to integration’, International Journal of Research in
Marketing, Vol. 14 No. 2, pp. 439–450.Ogden-Barnes, S. and Barclay, D. (2011) Store sense: Reclaiming the four walls with sensory engagement. Retrieved
02.02.2015 from http://www.biaa.com.au/resources/Library/store-sense.pdf.Onuoha, O.A. and Nnennaya, D. (2017) ‘Store layout and customer loyalty of supermarkets in Port Harcourt,
Nigeria’, International Journal of Managerial Studies and Research, Vol. 5 No. 3, pp. 34–39. doi:10.20431/2349-0349.0503005.
Puccinelli, N.M., Goodstein, R. C., Grewal, D., Price, R., Raghubir, P. and Stewart, D. (2009) ‘Customer experience management in retailing: Understanding the buying process’, Journal of Retailing, Vol. 85, pp. 15-30.
Santos, E. B. and Freire, O.B. (2013, 9) ‘The infl uence of music on consumer purchase behaviour in retail environment’, Independent Journal of Management and Production, Vol. 4 No. 2, pp. 537–548. doi:10.14807/ijmp.v4i2.111
Singh, P., Katiyar, N. and Verma, G. (2014) ‘Retail shoppability: The impact of store atmospherics and store layout on consumer buying patterns’, International Journal of Scientifi c and Technology Research, Vol. 3 No. 8, pp. 15–23.

© Faculty of Management University of Warsaw. All rights reserved. DOI: 10.7172/2449-6634.jmcbem.2017.1.4
Journal of Marketing and Consumer Behaviour in Emerging Markets 1(5)2017
Kizito Ogedi Alakwe, Ngozi Okpara PhD.
62
(45–62)
Smith, P.C. and Curnow, R. (1966) ‘Arousal hypotheses and the effects of music on purchase behaviour’, Journal of Applied Psychology, Vol. 50 No. 3, pp. 255–256.
The Economist (12.04.2014) Africa’s new number one. Retrieved from: http://www.economist.com/news/leaders/21600685-nigerias-suddenly-supersized-economy-indeed-wonder-so-are-its-still-huge.
Turley, L.W. and Milliman, R.E. (2000) ‘Atmospheric Effects on Shopping Behaviour: A Review of the Experimental Evidence’, Journal of Business Research, Vol. 49 No. 2, pp. 193–211.
Ukpabi, D.C., Enyindah, C.W., Gwere, P.J. and Ejire, S. (2015) ‘Store atmosphere and impulse buying: An empirical study of shoppers in Port Harcourt’, The International Academic Conference for Sub-Sahara African Transformation and Development. Ilorin.
Wakefi eld, K.L. and Blodgett, J.G. (2002) ‘Customer response to intangible and tangible service factors’, Psychology and Marketing, Vol. 16 No. 1, pp. 51–68.
Yalch, R.F. and Spangenberg, E.R. (2000) ‘The effects of music in a retail setting on real and perceived shopping times’, Journal of Business Research (Elsevier Science Inc), Vol. 49, pp. 139–147.
Zeithaml, V.A. (1998) ‘Consumer perceptions of price, quality and value: A means-end model and synthesis of evidence’, Journal of Marketing, Vol. 52, pp. 2–22.

© Faculty of Management University of Warsaw. All rights reserved. DOI: 10.7172/2449-6634.jmcbem.2017.1.5
Journal of Marketing and Consumer Behaviour in Emerging Markets 1(5)2017 63
(63–71)
The Infl uence of Adult Children from “Generation Y”on the Shopping Decisions of their Parents
Anita MatuszewskaFaculty of Management, University of Warsaw
Email: [email protected]
Received: 13 October 2016 / Revised: 19 April 2017 / Accepted: 25 April 2017 / Published online: 26 May 2017
ABSTRACT
Family is one of the most important socio-cultural factors which refl ects on a man’s behavior. Contemporarily, young people demonstrate much more market activity. Except for doing shopping, they also play roles of advisors who infl uence choices of individual members of households. Most often, in spite of coming of age and leaving family home, they still have an impact on the behavior of family members. The aim of this paper is to examine the infl uence of children over 18 (generation “Y”) on parents’ consumer decisions (generation “X” and Baby-Boomers). As a research method a quantitative survey analysis was applied which showed that children have a relevant infl uence on shopping decisions of adults. Moreover, there are differences in the assessment of this infl uence between children and parents. The degree of young people’s impact on the shopping process of their parents is, among others, determined by age and sex of a child and a parent, the category of the product and its purpose. The limitation of the conducted analysis is the unrepresentative sample of respondents. The achieved results may be used by marketing specialists to deepen their understanding of consumer behavior of adult children and their parents and to properly address promotion messages.
JEL classifi cation: M00, D10, D70
Keywords: family, generation Y, consumer behaviour, young consumers, pester power
1. INTRODUCTION
The topic of this article is the infl uence of children over 18 years old on consumer behavior of their parents. Nowadays, young people, except for being active on the primary market, where they do autonomous shopping, also function on the secondary market. This market is characterized by the infl uence of children on consumer behavior of their parents who, as a result of their children’s pressure, fulfi ll their wishes.
Children are characterized by a quality called ‘a syndrome of an easy prey’. As a consequence of possessing it, they are more prone to the infl uence of promotion activities because they are not fully aware of the ways advertisements function. The level of their psychological development makes them prone to manipulations as their process of decision making is less rational than in case of adults (Acuff and Reiher, 2005). As a result, it is easier to infl uence parents’ consumer behavior through the advertisements addressed to their children who later will use their pester power vis-à-vis them.

© Faculty of Management University of Warsaw. All rights reserved. DOI: 10.7172/2449-6634.jmcbem.2017.1.5
Journal of Marketing and Consumer Behaviour in Emerging Markets 1(5)2017
Anita Matuszewska
64
(63–71)
According to Ipsos research (2010), an average allowance of Polish children aged from 4 to 18 was PLN 56 a month, which is PLN 18 more than in 2004. Children used to receive money in a form of gifts from parents, grandparents or other relatives (56%), regular payments made by a father or a mother in order to fulfi ll their children’s everyday needs (53%) or as a prize for receiving positive marks at school (13%). The oldest children aged 15–18 received higher allowance than younger ones. The results of the cited research show that children usually spend their money on sweets, while the least interest was shown in buying tickets to theatres, philharmonic halls and other cultural events.
The reason why the infl uence of adult children on their parents’ shopping activities was chosen as the topic of this research is the fact that, so far, only the impact of children under 18 has been examined. In spite of the fact that grown up children have their own sources of income, they notoriously infl uence their parents’ consumer behavior. That is why, it is not enough to consider their infl uence only in their early years of life. Besides, the decision making process of households is one of the most important topics analyzed in the consumer behavior science. The previous research concerns, among others, administering monetary means in households, the amount and the purpose of the allowance or the infl uence of young children on their parents’ shopping decisions.
The main research problem of this paper is how and to what extant adult children infl uence the shopping process of their parents. In order to fi nd an answer to this question, quantitative research on the sample of 100 children (over 18) and 100 parents was conducted. Both children and parents were included into the research sample to investigate the differences in the assessment of the level children’s infl uence on consumer decisions of their parents between both groups.
2. THE INFLUENCE OF CHILDREN ON THEIR PARENTS’ SHOPPING DECISIONS
The infl uence on parents takes place in a situation when at the request and under pressure of a child parents indulge their whims by purchasing the goods the child indicates. Marketers are aware of the importance of the infl uence of children when parents choose a product, so in many cases they address their promotion messages directly to them. As a result, children who are more prone to their manipulations than parents start to demand certain goods (Solomon, 2015).
Children have a signifi cant infl uence on their parents’ consumer decisions. Their role is noticeable while proposing certain products or services to buy, doing shopping or using the acquired products. The main factor indicating why children reach their goals does not depend on their persistence and pressure but on the type of the proposal, parents’ characteristics, age of children and the course of the decision making process. The infl uence of children is not limited to the products meant directly for them such as sweets, snacks or cereals. They participate in choosing holidays, cars or electronic appliances (Hoyer and MacInnis, 2001, p. 382).
Attention should be paid to the fact that children often overestimate their impact on parents’ decisions. In a situation when a mother or a father is particularly involved in the decision making process or is characterized by conservatism and traditionalism, the infl uence of the young is limited to incidental cases. The opposite situation is common among overworked or single parents who, under the pressure of time, are more prone to give in the pester power of their children. Moreover, when parents introduce a limitation on the time spent by their children on watching television, children’s infl uence on parents gets lower (Hoyer and MacInnis, 2001, p. 382).
Blythe (2013, p. 250) distinguished eight methods in which children infl uence their parents: the pressure method (making threats by children); the reference to the Mighty (statement that others agreed to the request); the exchange method (a promise to do something in exchange for getting some benefi ts); the coalition method (looking for support among the closest people); the fl attering method (making a parent happy); the rational suggestion (using logical arguments and

© Faculty of Management University of Warsaw. All rights reserved. DOI: 10.7172/2449-6634.jmcbem.2017.1.5
Journal of Marketing and Consumer Behaviour in Emerging Markets 1(5)2017
Anita Matuszewska
65
(63–71)
real evidence); the inspiring references (making references to parents’ values and standards); the consultation method (a child’s participation in a discussion).
According to the research conducted by Polish Program of the Service Quality (2013), 96% of Poles confi rm that their children have an essential infl uence on their shopping decisions. Nearly one-third of them (31.2%) describe this impact as “large” and 43,6% as “average”. This research shows that children’s infl uence is dependent on their age. The older the children are, the larger the infl uence they have on their parents’ shopping decisions. It may be caused by the fact of getting more knowledge during the years concerning available goods on the market, mainly telephones and domestic electronics. Children have an infl uence not only on purchasing toys but also on the choice of goods for the household, such as cars or holidays. Sixty percent of Poles declare that the choice of holidays is always consulted with their children. Children have also a great infl uence on the type of recreation of the whole family. They play a role in the decision process concerning such goods as furniture or clothes for parents. Besides, over 20% of the interviewees admitted that their children’s suggestions have an impact on choosing a fl at and 16.7% on buying a car. The reason why parents are prone to their children’s suggestions is the happiness of their children. However, it may lead to making rash decisions.
The young systematically participate in making consumer decisions concerning everyday goods that may be used by the whole family. It is especially true for groceries that are often purchased a few times a week. According to the research conducted by Olejniczuk-Merta (2001, pp. 70–71), the participation of children in the decision process is not limited to the goods they will use, but their opinions are taken into consideration and they are allowed to make a fi nal decision in many other product categories. Children’s gender has an essential importance while investigating the impact they have on their parents decisions. Girls more often suggest, advise and purchase apparel, cosmetics and magazines by themselves. Boys, however, more often participate in buying sports and electronic products.
Investor Watch (2016) published a report concerning the ways in which the family and fi nances are seen by Generation Y and Baby Boomers. The results show the differences between the two generations’ attitudes towards these topics. The Baby Boomers generation treats parents as an authority, while Generation Y regards them as friends or even peers. The representatives of Generation Y may count on fi nancial support from their parents in many ways: health insurance (29%), buying or renting some property (29%), car insurance (26%), media (23%), holidays (19%) and funds (21%). Moreover, Generation Y is twice as much prone to come back to their family home after fi nishing studies. The main reason why it happens is the desire to save money. In the case of Generation Y, 73% of its representatives tend to fulfi ll short-term needs. They are more prone to invest in a house or buy holidays than care about their retirement and pension.
Based on the conducted review of literature, the following research hypotheses have been stated:H1: There are differences in the assessment of the infl uence on the shopping decisions in
a family between parents and children.H2: The strength of the child’s impact is age-related: the older the child is, the less infl uence
she/he has.H3: Parents from Generation X are more prone to their children’s infl uence than parents from
the Baby Boomers generation.H4: The better the relation the parent and the child have, the bigger the child’s infl uence on the
parent’s shopping decisions is.H5: The intensity of children’s infl uence is connected with parents’ gender: children have
a bigger infl uence on mothers than fathers.H6: Children have an essential infl uence on the purchase of products destined for them and for
the whole family, but they have a little impact on buying products designed only for their mothers or fathers.

© Faculty of Management University of Warsaw. All rights reserved. DOI: 10.7172/2449-6634.jmcbem.2017.1.5
Journal of Marketing and Consumer Behaviour in Emerging Markets 1(5)2017
Anita Matuszewska
66
(63–71)
3. DATA AND METHODS
In order to verify the above research hypotheses, a quantitative study was conducted. The invitations to the survey were sent to potentially defi ned respondents by e-mail. In order to gather the data effectively, the social networking sites, e-mails and Internet message boards were used. The fi rst part of the questionnaire was directed to children aged from 19 to 39 (generation Y representatives) and consisted of 9 indices concerning the issues regarding: their general infl uence on parents’ shopping decisions and their infl uence on purchasing certain categories of products. The second part of the questionnaire was directed to parents (aged from 40 to 70) and consisted of 11 indices concerning the same issues which were in the questionnaire for children.
The age of parents was intentionally adjusted to the aims of the research to include parents of Generation X and the Baby Boomers generation. In both samples (children and parents), 100 respondents were found. The characteristics of them in terms of gender and age are shown in Table 1. In order to analyze the collected data, the test of Pearson’s chi-squared statistic and t-student test were used.
Table 1Demographic characteristics of the respondents
Children Parents
GenderAge
Gender Age (generation)
Women Men Women Men Generation X Baby Boom Generation
57% 43%
19–21 years old 33%
55% 45% 62% 38%22–24 years old 37%
25–32 years old 30%
Source: own research, N = 200
4. RESEARCH RESULTS
Beginning with the differences in the assessment of the infl uence on shopping decisions between children and parents, the results show that children evaluate their own infl uence higher than their parents. Nearly half of the children assess their infl uence as “high” (31%) or “very high” (15%). Moreover, only a small number of children regard their infl uence as minor (1%). In the case of parents, only a few assess children’s infl uence as “very high” (2%). Most of them chose the answer “low” (30%) or “average” (28%) (see: Table 2).
Table 2The differences in impact assessment between children and parents
Children Parents Pearson’s chi-squared test
Very high 15% 2%
Χ2 = 46.165df = 4
p = 0.0001
High 31% 27%
Average 48% 28%
Low 5% 30%
Very low 1% 13%
Source: own research, N = 200

© Faculty of Management University of Warsaw. All rights reserved. DOI: 10.7172/2449-6634.jmcbem.2017.1.5
Journal of Marketing and Consumer Behaviour in Emerging Markets 1(5)2017
Anita Matuszewska
67
(63–71)
Comparing the results of children and parents, a signifi cant asymmetry in their assessment can be noticed. Children evaluate their infl uence much higher than it is assessed by their parents. This confi rms the fi rst research hypothesis (H1), which stated that there are differences in the assessment of infl uence between children and parents.
The analysis of the relation between intensity of a child’s infl uence and his/her age shows that the percentage (30%) of children describing their infl uence as “very high” is the largest in the youngest age group (19 to 21 years old). The shares of older children belonging to the age groups 22–24 and 25–32 who described their infl uence as “very high” are only 8% and 7% respectively (see: Table 3). It means that younger children much more often than older ones regard their infl uence as a signifi cant one. It is a very interesting result because in the case of younger children (aged from 9 to 19) quite an opposite phenomenon is observed, where the infl uence increases the older the child is (Hoyer and MacInnis, 2001, p. 383).
Table 3Age of children and their infl uence on parents’ consumer decisions (assessment of children)
The overallimpact
of children
Age Pearson’s chi-squared test
19–21 years old 22–24 years old 25–32 years old
Χ2 = 22.034df = 8
p = 0.005
Very low 0% 2,7% 13%
Low 3% 0% 0%
Average 33.33% 48.65% 63%
High 33.33% 40.54% 17%
Very high 30.3% 8.11% 7%
Source: own research, N = 200
The conducted analyses confi rmed the second research hypothesis (H2) indicating the infl uence of a child’s age on parents’ consumer decisions. The age of a child is negatively correlated with the child’s infl uence, which means that the older the child is, the less infl uence he or she has. The cause of the obtained result might be the fact that older children from Generation Y are independent and live outside the family home. They often have their own families to which they devote more their free time than to parents. The contact between children and parents weakens with the child’s age, which causes an incidental infl uence of older children on consumer shopping decisions of their parents.
The analysis of the data concerning the differences in estimating the infl uence of children on the shopping decision making between parents from generation X and Baby Boomers shows that the highest percentage of the respondents from the Baby Boom generation described the infl uence of a child as “low” (34%) or even “very low” (32%), while the responders from Generation X assessed it as “average” (34%) or “high” (34%). A small percentage of younger parents (2%) describe the infl uence of a child as “very low”. Yet, none of the parents from the Baby Boom generation regarded the children’s infl uence as “very high” (see: Table 4).

© Faculty of Management University of Warsaw. All rights reserved. DOI: 10.7172/2449-6634.jmcbem.2017.1.5
Journal of Marketing and Consumer Behaviour in Emerging Markets 1(5)2017
Anita Matuszewska
68
(63–71)
Table 4The relation between parent’s generation and children’s impact assessment
The overall impactof children
GenerationPearson’s chi-squared test
Generation X Generation Baby Boom
Very low 2% 32%
Χ2 = 22.723df = 4
p = 0.0001
Low 27% 34%
Average 34% 18%
High 34% 16%
Very high 3% 0%
Source: own research, N = 200
The conducted analysis confi rmed the third research hypothesis(H3), concerning the existence of differences in the assessment of the infl uence of children made by parents from Generation X and the Baby Boom generation. Children whose parents belong to Generation X have more infl uence on their shopping decisions than children whose parents belong to the Baby Boom generation.
Regarding the impact of the quality of child-parent relation on a child’s infl uence on parents’ shopping decision, the average quality of family relations was 3.45 (on the 1 to 5 scale) for parents from Generation X and 2.82 for parents from the Baby Boom generation. The research results show a positive correlation between this index and the intensity of a child’s infl uence (see: Table 5).
Table 5Generation of parents and the index of family relations
t df P
Generation/ index of the quality of family relations 4.663 98 0.0001
Source: own research, N = 200
It appears that more liberal relations between a child and a parent cause a bigger child’s infl uence on the parent’s shopping decision making process. Nowadays, the distance between parents and children is narrowing. A child is more often treated by parents as a friend than a child who has to be brought up. The consequence is that a child has more autonomy in making shopping decisions. The reason for this phenomenon might be that parents continuously want to make their child happy even at the expense of a fi nancial loss. The conducted analyses showed that relations in a family where a parent belongs to Generation X are friendlier than in the case of the Baby Boom generation. Parents of Generation X represent a much liberal and democratic model of the family, while parents of the Baby Boom generation are more autocratic. Comparing the characteristics of the generations, it can be clearly stated that the quality of family relations affects children’s infl uence on parents’ consumer behavior. Based on the presented data, it may be stated that the fourth research hypothesis (H4) was confi rmed.
Another hypothesis (H5) concerned the relations between a parent’s gender and the intensity of a child’s infl uence. The analysis of the gathered data showed that the highest percentage of mothers estimated a child’s infl uence as average (40%) and another 29% of women admitted that children have a high infl uence on their shopping decisions. Contrary to this, the biggest percentage of men declared that a child’s infl uence is “low” (42%) and only 24% of fathers estimated it as “high”. What is interesting, none of the women indicate that a child has a “very high” impact on her shopping decisions, while this option was chosen by 4% of men (see: Table 6).

© Faculty of Management University of Warsaw. All rights reserved. DOI: 10.7172/2449-6634.jmcbem.2017.1.5
Journal of Marketing and Consumer Behaviour in Emerging Markets 1(5)2017
Anita Matuszewska
69
(63–71)
Table 6The relation between parent’s gender and the impact of a child on shopping decisions
Women Men Pearson chi square test
Very high 0% 4.4%
Χ2 = 13.413df = 4
p = 0.009
High 29.1% 24.4%
Average 40.0% 13.3%
Low 20.0% 42.2%
Very low 10.9% 15.6%
Source: own research, N = 200
The fi fth research hypothesis (|H5) was confi rmed as the existence of statistically signifi cant differences in the assessment of a general child’s infl uence by mother and father was proved.
The last hypothesis (H6) concerned the relation between the intensity of a child’s infl uence and the type of a purchased product. Four product categories were analyzed: destined for children, mother, father and the whole family. Over half of the young people indicated that they have a “very high” infl uence on the choice of a product addressed to them (52%) and about one-third described it as “high” (30%). It means that a signifi cant majority of young people are convinced that their infl uence on the choice of the product addressed to them is signifi cant (see: Table 7).
Table 7Product categories and the impact of children on the shopping decision
Product category
For children For mother For father For family
Very high 52% 11% 8% 20%
High 30% 29% 25% 37%
Average 10% 40% 32% 37%
Low 6% 11% 26% 4%
Very low 2% 9% 9% 2%
Source: own research, N = 200
As far as products designed for mothers are concerned, a signifi cant majority of young people described their infl uence as “average” (40%) or “high” (29%), and in the case of the products for fathers, the biggest percentage of young people estimated their infl uence as “average” (32%) or “low” (26%). The last product category is the one intended for the whole family. In this case, children estimated their infl uence as “average” (37%) or “high” (37%). Summing up all the above results, the last research hypothesis (H6) was confi rmed. Children have the biggest infl uence on buying products addressed to them or the whole family and the child’s infl uence on purchasing products for mothers is bigger than on purchasing products for fathers.
5. DISCUSSION
The aim of the conducted research was to examine the infl uence of children from Generation Y on the consumer decision making process of their parents.
The research hypothesis about the existence of differences in the assessment of the infl uence made by parents and children was confi rmed. Children consider their infl uence as more

© Faculty of Management University of Warsaw. All rights reserved. DOI: 10.7172/2449-6634.jmcbem.2017.1.5
Journal of Marketing and Consumer Behaviour in Emerging Markets 1(5)2017
Anita Matuszewska
70
(63–71)
considerable than parents. On the one hand, a lot of parents make their children believe that they have a large infl uence on their shopping decisions because they do not want the child to feel rejected (Hoyer and MacInnis, 2001, p. 382). That may be a reason why children overestimate their real infl uence. On the other hand, parents may underestimate their children’s infl uence for fear of losing authority in a child’s eyes.
Another hypothesis concerned the relation between a child’s age and his or her infl uence. It was confi rmed that the infl uence of a child under 19 is negatively correlated with age. The reason why this phenomenon appears is that older children are more independent and live outside the family home. Thus, their contact with parents weakens and only occasionally do they have a chance to infl uence their parents’ consumer decisions.
The hypothesis stating that parents representing Generation X are more prone to the infl uence of their children than parents from the Baby Boom generation was confi rmed. It should be noticed that children of the representatives of the Baby Boom generation are older and exert less infl uence on parents than it happens in the case of children of parents from Generation X. The older a child is, the more occasional infl uence he or she exerts on parents. The differences in the assessment of children’s infl uence may also derive from the characteristics of these two generations. The representatives of the Baby Boom generation are traditionalists. According to them, the family household is based on the traditional splitting of roles where a woman is a mother and a wife. Similarly interpreted is the role of a child, whose main duty is the execution of orders imposed by parents. Therefore, parents do not let children make individual decisions and often ignore their opinions (Dziewanowska and Kacprzak, 2013, p. 54). It is quite opposite in the case of parents from Generation X. The representatives of this cohort experienced a certain revolution, which made them give up the conservatism and the traditionalism of the previous generation. That is why, their relations with children have become friendlier. Those parents regard their children as the most important members of the family and allow children to decide in many aspects concerning not only their own lives but also the ones of their parents (Van Den Bergh and Behrer, 2011, pp. 22–24).
The analysis of the research results also shows that the better the quality of the relations between children and parents is, the bigger infl uence on parents’ shopping decision a child has. Nowadays, the distance between an adult and a child is reduced, which is why children have more autonomy and the happiness of their child is the most important to parents (Tapscott, 2008).
The hypothesis regarding the infl uence of a parent’s gender on the assessment of the infl uence of a child was confi rmed. Mothers declared higher children’s impact on their shopping decisions than fathers. The reason may be that mothers are more submissive to the instigation of children. Children also more often accompany their mothers than fathers during the shopping and thanks to that they have more opportunity to infl uence them.
The analysis of the respondents’ answers also confi rmed the last hypothesis stating that children have the biggest infl uence on purchasing products designed for them and for the whole family. Their limited knowledge restricts their infl uence on purchasing products for other members of family.
6. LIMITATIONS AND FURTHER RESEARCH
The fi rst limitations of the study that should be taken under consideration is undoubtedly the unrepresentative sample of respondents. The research was conducted on a relatively small and not randomly chosen sample of 100 parents and 100 children, which is why it should be treated as exploratory and repeated on a larger and representative group of respondents. Another limitation of the study is of psychological nature. Parents unwillingly admit that their children are brought up in a liberal way and they co-decide in all aspects of the family life. The children might also

© Faculty of Management University of Warsaw. All rights reserved. DOI: 10.7172/2449-6634.jmcbem.2017.1.5
Journal of Marketing and Consumer Behaviour in Emerging Markets 1(5)2017
Anita Matuszewska
71
(63–71)
have inaccurately defi ned the level of their infl uence. It is the parent who fi nally makes consumer decisions and it is hard to estimate the real infl uence of a child.
The subject of a child’s infl uence on parents’ consumer decisions was mostly researched on the group of children up to 18 years old. Yet, it must be remembered that nowadays children leave their family home later than before and still even after leaving home they affect their parents’ decisions. Currently, young people make up a meaningful market activity group. Not only do they administer their own funds, purchase goods for themselves but also infl uence the family shopping. Deepening the knowledge about these phenomena may contribute to more accurate advertising.
REFERENCES
Acuff, D.S. and Reiher, R.H. (2005) Kidnapped: How Irresponsible Marketers Are Stealing the Minds of Your Children. Chicago: Dearborn Trade.
Blythe, J. (2013) Consumer behavior. Los Angeles: SAGE.Dziewanowska, K. and Kacprzak, A. (2013) Marketing doświadczeń. Warszawa: PWN.Hoyer, W. and MacInnis, D. (2001). Consumer Behavior. Boston: Houghton Miffl in Company.Ipsos (2010) Dzieci i pieniądze: kieszonkowe nie poddaje się kryzysowi. Retrieved from: http://www.ipsos.pl/
kieszonkowe-dzieci-2010Olejniczuk-Merta, A. (2001) Rynek młodych konsumentów. Warszawa: Difi n.Polish Program of the Service Quality (2013) Raport specjalny: Miliardy złotych w rękach dzieci. Retrieved from: http://
www.jakoscobslugi.pl/UserFiles/File/Raport%20Polskiego%20Programu%20Jako%C5%9B%C4%87%20Obs%C5%82ugi%20Miliardy%20w%20r%C4%99kach%20dzieci.pdf
Solomon, M. (2015). Consumer Behavior: Buying, Having, and Being. Upper Saddle River: Pearson.Tapscott, D. (2008) Grown Up Digital: How the Net Generation is Changing Your World. New York: McGrew – Hill.Van den Bergh, J. and Behrer, M. (2011) How Cool Brands Stay Hot: Branding to Generation Y. London: KoganPage.Watch, U.I. (2016) The ties that binds. How Boomers and their Millennial children are redefi ning family and fi nances.
Retrieved from: http://view.ceros.com/ubs/iw2q16/p/1