Journal of Fluid Mechanics Density ratio effects on ...mpj1001/papers/JFM_Emerson_2012.pdf ·...
33
Journal of Fluid Mechanics http://journals.cambridge.org/FLM Additional services for Journal of Fluid Mechanics: Email alerts: Click here Subscriptions: Click here Commercial reprints: Click here Terms of use : Click here Density ratio effects on reacting bluffbody flow field characteristics Benjamin Emerson, Jacqueline O’Connor, Matthew Juniper and Tim Lieuwen Journal of Fluid Mechanics / Volume 706 / September 2012, pp 219 250 DOI: 10.1017/jfm.2012.248, Published online: Link to this article: http://journals.cambridge.org/abstract_S0022112012002480 How to cite this article: Benjamin Emerson, Jacqueline O’Connor, Matthew Juniper and Tim Lieuwen (2012). Density ratio effects on reacting bluffbody flow field characteristics. Journal of Fluid Mechanics,706, pp 219250 doi:10.1017/jfm.2012.248 Request Permissions : Click here Downloaded from http://journals.cambridge.org/FLM, IP address: 129.169.125.66 on 30 Aug 2012
-
Upload
vuongnguyet -
Category
Documents
-
view
221 -
download
0
Transcript of Journal of Fluid Mechanics Density ratio effects on ...mpj1001/papers/JFM_Emerson_2012.pdf ·...

Journal of Fluid Mechanicshttp://journals.cambridge.org/FLM
Additional services for Journal of Fluid Mechanics:
Email alerts: Click hereSubscriptions: Click hereCommercial reprints: Click hereTerms of use : Click here
Density ratio effects on reacting bluffbody flow field characteristics
Benjamin Emerson, Jacqueline O’Connor, Matthew Juniper and Tim Lieuwen
Journal of Fluid Mechanics / Volume 706 / September 2012, pp 219 250DOI: 10.1017/jfm.2012.248, Published online:
Link to this article: http://journals.cambridge.org/abstract_S0022112012002480
How to cite this article:Benjamin Emerson, Jacqueline O’Connor, Matthew Juniper and Tim Lieuwen (2012). Density ratio effects on reacting bluffbody flow field characteristics. Journal of Fluid Mechanics,706, pp 219250 doi:10.1017/jfm.2012.248
Request Permissions : Click here
Downloaded from http://journals.cambridge.org/FLM, IP address: 129.169.125.66 on 30 Aug 2012

J. Fluid Mech. (2012), vol. 706, pp. 219–250. c© Cambridge University Press 2012 219doi:10.1017/jfm.2012.248
Density ratio effects on reacting bluff-body flowfield characteristics
Benjamin Emerson1†, Jacqueline O’Connor1‡, Matthew Juniper2
and Tim Lieuwen1
1 Georgia Institute of Technology, School of Aerospace Engineering, 270 Ferst Dr, Atlanta,GA 30332, USA
2 Cambridge University Engineering Department, Trumpington Street, Cambridge CB2 1PZ, UK
(Received 26 October 2011; revised 22 March 2012; accepted 23 May 2012;first published online 11 July 2012)
The wake characteristics of bluff-body-stabilized flames are a strong function of thedensity ratio across the flame and the relative offset between the flame and shear layer.This paper describes systematic experimental measurements and stability calculationsof the dependence of the flow field characteristics and flame sheet dynamics uponflame density ratio, ρu/ρb, over the Reynolds number range of 1000–3300. We showthat two fundamentally different flame/flow behaviours are observed at high and lowρu/ρb values: a stable, noise-driven fixed point and limit-cycle oscillations, respectively.These results are interpreted as a transition from convective to global instability andare captured well by stability calculations that used the measured velocity and densityprofiles as inputs. However, in this high-Reynolds-number flow, the measurementsshow that no abrupt bifurcation in flow/flame behaviour occurs at a given ρu/ρb value.Rather, the flow field is highly intermittent in a transitional ρu/ρb range, with therelative fraction of the two different flow/flame behaviours monotonically varying withρu/ρb. This intermittent behaviour is a result of parametric excitation of the globalmode growth rate in the vicinity of a supercritical Hopf bifurcation. It is shown thatthis parametric excitation is due to random fluctuations in relative locations of theflame and shear layer.
Key words: absolute/convective instability, combustion, wakes
1. BackgroundThe unsteady flow fields in reacting bluff-body flows are often dominated by
large-scale coherent structures, embedded in a background of acoustic waves andbroadband fine-scale turbulence. These large-scale structures play important roles insuch processes as combustion instabilities (Smith & Zukoski 1985; Crump et al. 1986;Yang & Culick 1986; Poinsot et al. 1987; Soteriou & Ghoniem 1994), mixing andentrainment, flashback, and blowoff (Shanbhogue, Husain & Lieuwen 2009a). Thesestructures arise because of underlying hydrodynamic instabilities of the flow field(Criminale, Jackson & Joslin 2003). The objective of this study is to characterizethe effects of the flame upon the absolute and convective instability characteristics
† Email address for correspondence: [email protected]‡ Present address: Sandia National Laboratories, Engine Combustion Department, PO Box
969 MS 9053, Livermore, CA 94551-0969, USA.

220 B. Emerson, J. O’Connor, M. Juniper and T. Lieuwen
of the flow (Huerre & Monkewitz 1990; Anderson, Hertzberg & Mahalingam 1996;Godreche & Manneville, 1998; Schmid & Henningson, 2001).
There are two key flow features downstream of the bluff body in high-Reynolds-number flows; these are the separating free shear layers (Cardell 1993) and thewake, both of which strongly influence the flame. The separated shear layer isconvectively unstable due to the Kelvin–Helmholtz mechanism for ReD > ∼1200(Prasad & Williamson 1997), where ReD is the Reynolds number based on velocityat the lip (Ulip) and bluff-body diameter (D), leading to shear layer rollup into tightlyconcentrated vorticity. In most practical configurations, the flame lies nearly parallelto the flow and, thus, almost directly in the bluff-body shear layer for high-velocityflows. Small perturbations in convectively unstable flows are amplified as they convectdownstream, but not locally at their source locations. In other words, convectivelyunstable flows have positive growth rates for some disturbance wavelengths with non-zero group velocity, but all disturbances of zero group velocity are damped. Theseflows are disturbance amplifiers (Briggs 1964; Bers 1983; Huerre & Monkewitz 1985).
The separating vorticity sheets on both sides of the bluff body roll up, whichinduces a flow field that wraps the flame around these regions of concentrated vorticity.This wake region may be globally unstable, given the presence of a large enoughpocket of absolute instability. The key distinction from the convectively unstable flowis that absolutely unstable profiles lead to amplification of some disturbances of zerogroup velocity. Therefore, these flows exhibit intrinsic oscillations at a global modefrequency (Briggs 1964; Bers 1983; Huerre & Monkewitz 1985).
In non-reacting flows, the bluff-body wake is absolutely unstable, and characterizedby large-scale, asymmetric rollup of the wake into staggered vortical structures (Perry,Chong & Lim 1982), often referred to as the von Karman vortex street. This instabilityhas a characteristic frequency of (Prasad & Williamson 1997)
fBVK = StDUlip
D(1.1)
where StD is the Strouhal number. For circular cylinders, StD is independent ofReynolds number (StD = 0.21) in the turbulent-shear-layer laminar-boundary-layerregime, ∼1000 < ReD < ∼200 000 (Cantwell & Coles 1983). Above ReD∼200 000,the boundary layer starts to transition to turbulence and there are some indicationsthat this Strouhal number value changes (Roshko 1961; Bearman 1969). Bluff-bodyshape also influences the Strouhal number for the von Karman vortex street (Blevins1977). In particular, StD is lower for ‘bluffer’ bodies, i.e. those with higher drag andwider wakes (Roshko 1955). For example, StD ∼ 0.18 for a 90 ‘v-gutter’ and drops to0.13 for a sharp-edge, vertical flat plate (Huang & Chang 2004). Roshko (1954, 1955)suggests that StD fundamentally scales with the wake width and, therefore, care mustbe applied in inferring Strouhal numbers from one bluff-body shape to another. Forexample, flow separation is retarded for circular bluff bodies when the boundary layertransitions to turbulence, implying a reduction in wake width and turbulent vortexrollup (Zdravkovich 1997). In contrast, the flow separation point does not move inbluff bodies with sharp separation points.
These baseline flow stability characteristics are altered by heating the fluid inthe wake (Roshko 1954; Yu & Monkewitz 1990; Cardell 1993; Zdravkovich 1997;Erickson & Soteriou 2011), and through base bleeding/blowing, to name a couple ofexamples. Of most interest to this study are wake density ratio effects (due to heating,for example). It has been shown that a sufficiently hot wake relative to the free streameliminates the absolute instability of the wake, so that the flow’s dynamics are then

Density ratio effects on reacting bluff-body flow field characteristics 221
Stability limit
3.0
2.5
2.0
1.5
1.00.1 0.2 0.3 0.40 0.5
(a) (b)
FIGURE 1. (a) Flow geometry used for the local parallel stability analysis, and (b) testedconditions overlaid onto a stability map obtained from a local parallel stability analysis for thewake’s sinuous mode (Yu & Monkewitz 1990).
controlled by the convectively unstable shear layers. For example, Yu & Monkewitz(1990) performed parallel stability analyses of variable-density wakes, characterizedby an outer flow with a density, ρu, and time-averaged velocity, Uu, and wake regionwith density ρb and velocity Ub (see figure 1). For an inviscid flow with a step jumpin properties between the two fluids, they show that the absolute stability boundarydepends upon density ratio between the outer flow and the wake, as well as the ratioof reverse flow velocity in the wake to outer flow velocity, β, defined as
β (x)=−Ub (x)
Uu (x), (1.2)
where subscripts u and b denote unburned and burned respectively.The convective/absolute stability boundary predicted by their analysis is plotted
in figure 1. For the purpose of this study, only the sinuous (asymmetric) modestability boundary is plotted, as it is more easily destabilized in wakes than thevaricose (symmetric) mode. This plot shows that absolute instability is promoted withlower density ratios, ρu/ρb, and higher wake reverse flow velocities. For the reactingmixtures considered in this study, the density ratios plotted in the figure are alsoessentially identical to the flame temperature ratio, Tb/Tu. Similar stability calculationshave also been performed using more realistic velocity and density ratio profiles, suchas hyperbolic tangent profiles, and incorporating viscous effects (Monkewitz 1988).
In the rest of this introduction focus is shifted from the general hydrodynamicstability literature to the more specific reacting-flow literature. A variety of priorstudies have noted fundamental differences in the dynamic character of the flameand/or flow field at different velocity and fuel/air ratio conditions (Beer & Chigier1972; Bill & Tarabanis 1986), particularly under near-blowoff conditions (Thurston1958; Williams 1966; Yamaguchi, Ohiwa & Hasegawa 1985; Nair & Lieuwen 2005;Kiel et al. 2006; Nair 2006; Kiel et al. 2007) or in flames utilizing highly preheatedreactants (Kiel et al. 2006; Cross et al. 2010; Erickson & Soteriou 2011). Nearblowoff, the flame exhibits substantially increased levels of fluctuations in position,due to local extinction on the flame (Karlovitz et al. 1953; Yamaguchi et al. 1985;Hertzberg, Shepherd & Talbot 1991; Yang, Yen & Tsai 1994; Kim et al. 2006), as

222 B. Emerson, J. O’Connor, M. Juniper and T. Lieuwen
1.0
0.5
0
–0.5
–1.0
0 1 2 3 4 5 6 7 8
0 1 2 3 4 5 6 7 8 9
1.0
0.5
0
–0.5
–1.0
10
5
0
–5
–10
5
0
–5
1.5
–1.5
1.5
–1.5
(a)
(b)
FIGURE 2. Computationally predicted vorticity field and instantaneous flame edge for twoflame temperature ratios: (a) Tb/Tu = 1.25, (b) Tb/Tu = 2. Reproduced with kind permissionfrom Erickson & Soteriou (2011).
well as large-amplitude sinuous motions of the flow field which resemble the vonKarman vortex street. Hertzberg et al. (1991) and Anderson et al. (1996) appear tohave first used convective and absolute instability notions to explain various structuralfeatures in the flame/flow field, such as vortex shedding and near-blowoff flamedynamics.
The first systematic demonstration showing the effects of flame density ratio incombusting flows was presented by Erickson & Soteriou (2011) and is reproducedin figure 2. Their results show that a large sinuous flow feature gradually growsin prominence as density ratio across the flame is decreased below values ofapproximately 2–3. This observation is quite significant as it shows that the dominantfluid mechanics in a lab-scale burner with non-preheated reactants, which has a ‘high’density ratio, can be very different from those of a facility with highly preheatedreactants, such as many combustion applications. For example, stoichiometric methaneair flames with reactant temperatures of 300 and 1000 K have density ratios of 7.5 and2.6, respectively.
There have been no parallel experimental studies that have systematically studiedflame density ratio effects on unsteady flow/flame features. The reason for this isthat obtaining a stable (i.e. one that is not near blowoff) flame over a range ofdensity ratios, particularly low density ratios, is quite difficult. Flames propagating intoroom-temperature reactants will blow off at density ratios much higher than where thephenomenon of interest occurs. For example, a methane/air flame at an equivalenceratio of ϕ = 0.6 and T = 300 K has a density ratio of ρu/ρb = 5.6. Increasing theequivalence ratio to ϕ = 1.0 leads to a density ratio of 7.5. This density ratio variationof ∼25 % is all that is possible over the typical range of experimentally accessiblefuel/air ratios for which a stable flame can be achieved when fuelled with reactantsat standard temperature and pressure. In contrast, in a gas turbine combustor with acombustor inlet temperature of 800 K (Lovett et al. 2004) and equivalence ratio of 0.6,the flame temperature ratio is 2.6 for a methane–air flame. Similarly, high-efficiency

Density ratio effects on reacting bluff-body flow field characteristics 223
recuperated cycles or reheat cycles may have inlet temperatures of 1000–1100 K(Lovett et al. 2004; Aquaro & Pieve 2007), leading to temperature ratios of ∼2.
The implications of this absolute/convective instability distinction are particularlysignificant in thermoacoustic instability problems, where vortical structures excited byacoustic waves play important roles in the feedback mechanism (Lieuwen & Yang2005). The ‘convectively unstable’ system is quite sensitive to acoustic excitation(Huerre & Monkewitz 1990). In contrast, the absolutely unstable system is anoscillator – it exhibits intrinsic, self-excited oscillations and does not require externaldisturbances to persist. In such a self-excited system, the limit-cycle behaviour mayremain independent of the external forcing, unless the amplitude is high enough thatthe phenomenon of ‘lock-in’ occurs (Blevins 1977; Masselin & Ho 1985). In onecase, low-amplitude acoustic excitation will induce a proportional response while inthe other it may not. In turn, this has important implications for which type of flowinstabilities can be involved in linear combustion instability mechanisms. For example,it suggests that simulating combustion instabilities in simplified lab combustors withhigh density ratios will lead to completely different acoustic–hydrodynamic stabilitycoupling processes from what may be actually occurring in the low-flame-density-ratioapplication of interest.
The objectives of this study are two-fold. First, we experimentally characterize theunsteady flow evolution as the flame density ratio is monotonically varied across thisbifurcation in flow structure. To do this, it is necessary to highly preheat the reactantsto obtain flames that are stable (i.e. well removed from blowoff), yet of low densityratio. This was done by developing a facility capable of vitiating the flow, withindependent control of the fuel/air ratio of the two burners. Such a facility is able toachieve broad ranges of flame density ratio. In order for these density ratio sweepsto be conducted at a fixed bluff-body lip velocity requires a second, independentlycontrolled air injection source. The ability to control two independent air flows andtwo independent fuel/air ratios leads to substantial flexibility in operating conditions.Furthermore, great care was taken to stay well away from blowoff boundaries, whereadditional flame dynamics can occur (Shanbhogue et al. 2009a; Chaudhuri et al.2010).
The second study objective is to compare the empirical results to the results ofparallel stability theory and determine whether the transition in flow structure can beparameterized in the way suggested by theory; in particular, to determine if the densityand backflow ratios have the same measured effect as theory would suggest they do.We will show that they that do, but that the relative offset between the temperature andvelocity gradients also has a very significant influence on the results.
2. Experimental facility, diagnostics, and testing proceduresThe experimental rig, shown in figures 3 and 4, consists of two premixed,
methane–air combustors in series. The first combustor is used to vitiate the flow.The second, bluff-body-stabilized, combustor consists of a rectangular section with abluff body spanning the width of the combustor, creating a nominally two-dimensionalflow. The aspect ratio of bluff-body height to chamber width is 0.15. This combustorhas quartz windows for optical access from all four sides. Two different bluff bodieswere used in the test section: a two-dimensional ballistic shape (shown in figure 5a),and a v-gutter (shown in figure 5b). From here on, the two-dimensional ballistic shapewill be referred to as the ballistic bluff body.
224 B. Emerson, J. O’Connor, M. Juniper and T. Lieuwen
VitiatorSecondary air inlet
Secondary fuel inlet
Test section
Flow direction
FIGURE 3. (Colour online) Schematic of the atmospheric pressure, vitiated, bluff-body rig.
FIGURE 4. (Colour online) Schematic of test section with ballistic bluff body installed.
(a) (b) 1.6 mm
FIGURE 5. Schematics of bluff bodies: (a) ballistic; (b) v-gutter.
Primary air and fuel were premixed upstream of the vitiator. Secondary air and fuelwere plumbed into the rig and premixed in a 1.4 m long settling section aft of thevitiator, and upstream of the test section. Fuel is inserted from a manifold of eightinjectors, each of which penetrates 2.5 cm into the flow; three injectors pass throughthe top wall, three through the bottom wall, and one injector passes through eachsidewall. The natural gas concentration entering the test section was analysed as afunction of position on the plane at this axial position, and was uniform within ±10 %;uniform equivalence ratio was assumed and the effects of non-uniform equivalenceratio (Anselmo-Filho et al. 2009; Chaudhuri & Cetegen 2009; Kim & Hochgreb 2011)were not considered. The primary and secondary air and fuel each have their flowrates adjusted individually. This design allows the flame density ratio and bluff-bodylip velocity to be varied independently in the test section, by adjusting the air flowrates and stoichiometries in the vitiator and test section separately. The test matrix wasdeveloped such that primary and secondary air flow rates and primary and secondaryequivalence ratios could be adjusted to achieve a variety of density ratios at a fixedvelocity.
Mass flow rates for the primary and secondary air and fuel were measuredacross calibrated knife-edge orifice plates using the static upstream pressure and thedifferential pressure across the plate, measured with Omega PX209 solid-state pressuretransducers and Omega PX771A differential pressure transmitters, respectively. Thetemperature just upstream of the test section (after addition of secondary air and fuel)

Density ratio effects on reacting bluff-body flow field characteristics 225
was measured by a type K thermocouple and an Omega TX13 transmitter. Values wererecorded once every second for ten seconds, and then averaged.
It will be helpful now to define several reference velocities which will be usedthroughout this paper. Bluff-body lip velocities quoted in this paper are calculatedusing the formula Ulip = mlip/(ρlipAlip) (where mlip is the mass flow rate), which isan average axial flow velocity. The density for the lip velocity calculation (ρlip) wasdetermined from the temperature measured just before the test section and the gascomposition of the secondary air and fuel adiabatically mixed with the equilibriumvitiated gas. An equilibrium gas solver was then used to calculate the adiabatic densityratio across the test-section flame. The area, Alip, is the cross-sectional area of theflow at the plane of the bluff-body trailing edge. Another velocity, which will be usedas a reference in the stability analysis in later sections, is the average velocity. Thisis defined as the average velocity between the inner stream and an outer stream (seefigure 1a), Uav = (Uu + Ub)/2, and is a function of axial position. Finally, a velocitydifference will be defined as 1U = Uu − Ub.
For the 50 m s−1 cases, the uncertainty in measured gas flow rates and theresulting temperature and density ratios was ∼2 %. For the 20 m s−1 cases, uncertaintywas ∼4 % for the measured gas flow rates, and ∼10 % for the temperature anddensity ratios. Uncertainties are bounded by worst-case combinations of maximumand minimum flow rates and thermocouple readings for a given test. Uncertainty inthermocouple readings was less than 1 %.
Test matrix design was motivated by figure 1(b). Actual conditions tested areoverlaid on the stability map in the figure, where the backflow ratio βmax wasdetermined from the maximum value of β (which itself varies axially). Note thatthe ballistic bluff body provides a lower maximum backflow ratio than the v-gutter.Contours of constant ω0,iD/(2Uav), corresponding to the absolute spatio-temporalgrowth rate as computed from temperature and velocity measurements in conjunctionwith linear stability theory, are provided as well. These theoretical values arecalculated assuming top-hat density and velocity profiles, parallel flow, and highReynolds number. While the simplified, parallel stability analysis was useful forparameterizing the stability problem and designing the test matrix, a numerical localstability analysis was performed to compare stability theory results to experimentalobservations. This analysis is discussed later in the section on comparisons with localstability analysis.
Experimental diagnostics consisted of high-speed, line-of-sight imaging of flamechemiluminescence, high-speed particle image velocimetry (PIV), and laser Dopplervelocimetry (LDV). High-speed chemiluminescence imaging was performed witha Photron Fastcam SA3 camera at a 3000 Hz frame rate and 512 × 256 pixelresolution. This CMOS camera operates nearly continuously at 3000 Hz. The flamewas imaged through a BG-28 filter for chemiluminescence imaging. This filtertransmission exceeds 10 % for wavelengths between 340 and 630 nm, and peaks at82 % transmission at 450 nm. The flame was imaged from the bluff-body trailing edgeto approximately nine bluff-body diameters downstream. A total of 8029 images werestored in each run.
High-speed PIV measurements were obtained with a LaVision Flowmaster PlanarTime Resolved system. The laser is a Litron LDY303He Nd:YLF laser with awavelength of 527 nm and a 5 mJ pulse−1 pulse energy at a 10 kHz repetition rate.The Photron HighSpeed Star 6 camera was operated with a pixel resolution of640 × 448 at a frame rate of 10 kHz. A BG-28 optical filter was placed in frontof the camera for removal of red and infrared radiation during reacting tests. The flow

226 B. Emerson, J. O’Connor, M. Juniper and T. Lieuwen
was seeded with 5 µm Al2O3 particles. This ceramic material was chosen due to itsdurability in reacting flows and its high refractive index (Melling 1997). This particlesize was chosen because it is large enough to resist accumulation on and cloudingof the test-section windows. Simultaneously, this particle size has a sufficiently smallStokes number to accurately track the flow. Following the work by Mei (1996), theStokes number calculated for this flow and seed particle combination was 0.006. ThisStokes number is based on 5 µm seeding particles, with environmental kinematicviscosity of 3× 10⁻⁴ m2 s−1, and oscillation frequency of 600 Hz (roughly the highestglobal mode frequency encountered). The high temperature and corresponding highviscosity in the test section facilitate the use of such a particle. This Stokes numberis comfortably below the cutoff Stokes number for solid particles in air (Mei 1996),which is in the range of 0.02–0.04 and would correspond to a frequency of 13.8 kHz.
The DaVis 7.2 software from LaVision was used to process the PIV data,performing background subtraction and then calculating the velocity fields. All velocitycalculations were performed using the LaVision multi-pass method; this consisted ofa single pass with 64 × 64 pixel interrogation windows and 50 % overlap betweeninterrogation windows, followed by two passes with 32 × 32 pixel interrogationwindows and 50 % overlap between the interrogation windows. Post-processing onthe velocity vectors was also performed as follows. For 50 m s−1 cases, any velocityvector with an axial component outside of the ±90 m s−1 range or a transversecomponent outside of the ±45 m s−1 range was discarded. For 20 m s−1 cases, theaccepted range of axial velocities was ±36 m s−1 and for transverse velocities was±18 m s−1. Furthermore, velocity vectors whose velocimetry calculation had a peakcorrelation coefficient less than 0.2 were discarded, as were neighbouring vectorswhose ratio of difference to average velocity magnitude was greater than 20 % of ther.m.s. of the nearest neighbours.
Studies were performed with two fields of view and corresponding resolutions. Thelarger field of view was nominally 250 mm long in the axial direction and 80 mmwide in the transverse direction, leading to a velocity field resolution of 4.8 mm usinga 50 mm lens. The smaller field of view was 100 mm × 80 mm with a velocity fieldresolution of 3.0 mm using an 85 mm lens. A total of 2000 PIV image pairs was takenat a frame rate of 10 kHz with 12 µs between images for a given pair.
The flame density ratio was estimated from an equilibrium solution for theadiabatic flame temperature, using the measured approach-flow temperature and usinga gas composition determined from an adiabatic mixing calculation of the secondaryair, fuel, and equilibrium vitiated gas. In addition, the time-averaged density fielddistribution was determined from Mie scattering images (taken from the raw PIVimages). From these images, an instantaneous flame sheet position can be readilyextracted because of the sharp jump in seed particle density. The instantaneous densitywas then specified as a binary field having either the burned or unburned value. Theseinstantaneous values were then averaged at each location to obtain the temporallyaveraged density field. The key assumption behind this procedure is that the flame isvery thin relative to bluff-body diameter, which is well satisfied for this problem, asverified by detailed chemical kinetic calculations of an unstretched, premixed flame(using GRI 3.0) showing that the estimated flame thickness is roughly 2 % of thebluff-body diameter.
Two-component LDV was used to measure the boundary layer thickness at thetrailing edge of the bluff body. Seeding material consisted of 5 µm aluminiumoxide, whose frequency response characteristics were discussed previously. For eachmeasurement volume, data acquisition was limited to either 30 s or 5000 counts,

Density ratio effects on reacting bluff-body flow field characteristics 227
1.2
0.8
0.4
1.6
1.2
0.8
0.4
0.4 0.6 1.0 0.4 0.6 1.0
1.6y
(mm
)
00 0.2 0.8 0.2 0.8
(a) (b)
FIGURE 6. Boundary layer profiles for the v-gutter at Ulip = 50 m s−1, and a density ratio of(a) ρu/ρb = 1.7 and (b) ρu/ρb = 2.5, showing point of inflection.
whichever came first. The acquisition channel used for axial velocity measurementsused a laser wavelength of 514.5 nm, a fringe spacing of 7.9196 µm, a beam waist of70.19 µm, and a Bragg cell frequency of 40 MHz. The resulting low and high velocitylimits were −24 m s−1 and 119 m s−1, respectively. The acquisition channel used tomeasure the transverse velocity used a laser wavelength of 488 nm, a fringe spacingof 7.5117 µm, a beam waist of 66.57 µm, and a Bragg cell frequency of 40 MHz. Forthis channel, the low and high velocity limits were −68 and 68 m s−1. Both channelshad a focal length of 300 mm, a beam separation of 19.5 mm, a beam diameter of2.8 mm, and used a 20 MHz high-pass filter.
3. Results: time-averaged flow featuresThis section summarizes the time-averaged flow characteristics and inflow
conditions. These data are useful as inputs for flow stability or computationalpredictions. We first present high-resolution, LDV-based measurements of the inflowconditions. Then, we present PIV-based measurements of the time-averaged andfluctuating root-mean-square (r.m.s.) velocity field characteristics. Several importantflow parameters are then extracted from these data, including recirculation zone length,location and value of peak reverse flow velocity in the wake, and the dependence ofthese quantities upon density ratio. All of these parameters have important implicationsfor flow stability characteristics.
Consider first the inflow conditions. Two-dimensional LDV measurements wereobtained at the bluff-body trailing edge by scanning the flow transversely in stepsof 0.1 mm, as shown in figure 6. The velocity components measured were theaxial velocity, u, and the transverse velocity, v. These data show that the separatingboundary layer approaches the free-stream velocity at a distance of ∼1 mm from theflameholder. The momentum thickness was calculated with the relation:
θ =∫ y/D=2
y/D=0
[14−(
U − Uav
|1U|)2]
dy (3.1)
yielding θ = 0.14 and θ = 0.09 mm for ρu/ρb = 1.7 and ρu/ρb = 2.5, respectively,for the v-gutter at Ulip = 50 m s−1. This leads to a most-amplified frequency for theKelvin–Helmholtz instability in the shear layers of fKH = 11 kHz and fKH = 18 kHz

228 B. Emerson, J. O’Connor, M. Juniper and T. Lieuwen
Bluff body Ulip (m s−1) ρu/ρb u′rms/Ulip θ (mm) fKH (Hz)
V-gutter 50 1.7 0.08 0.14 11 000V-gutter 50 2.5 0.10 0.09 18 000V-gutter 20 1.9 0.15 0.15 4 300V-gutter 20 3.2 0.15 0.20 3 200Ballistic 50 1.7 0.16 0.25 6 400Ballistic 50 2.5 0.13 0.17 9 400Ballistic 20 1.9 0.22 0.26 2 500Ballistic 20 3.2 0.23 0.16 4 000
TABLE 1. Measured momentum thickness and estimated Kelvin–Helmholtz frequency, aswell as outer flow turbulence intensity, for several bluff bodies and flow conditions.
respectively using the relation (Ho & Huerre 1984)
fKH = 0.032Ulip
θ. (3.2)
The lower temperature ratio case has a thicker boundary layer since the reactanttemperature (and therefore viscosity) for low temperature ratio cases is higher thanthat for high temperature ratio cases. In comparison to the v-gutter, the momentumthickness at the ballistic-bluff-body trailing edge was somewhat higher, as would beexpected because of the boundary layer’s longer development length in this case. Formost cases, the momentum thickness at the trailing edge of the ballistic bluff body was1.7 times that of the v-gutter. Measured momentum thickness values and estimated fKH
values are presented in table 1 for both bluff bodies at the conditions tested with LDV.Returning to figure 6, note the differences in the near-wall velocity profile in the
high and low temperature ratio cases. This is due to heat transfer from the hot bluffbody to the boundary layer. In the high temperature ratio case, the v-gutter becomesvery hot with respect to the much cooler reactant temperature; therefore there is heatconduction from the flame holder to the reactant gas. This is a destabilizing effect(Schlichting & Gersten 2000), and leads to a point-of-inflection profile (as evidencedby the data in figure 6b). However, no boundary layer separation was observed, asshown by the data in the figure. The profiles for the high temperature ratio caseare ‘clipped’ at 1 mm because of thermal expansion of the v-gutter in the transversedirection (again, because the flameholder becomes very hot for this case), whichobscured the first 1/2 mm of the transverse scan. The rig is restrained such that axialthermal expansion is not a concern.
The measured r.m.s. axial velocity u′rms is plotted as a function of transverse positionin figure 7. Inflow turbulence intensity, u′rms(y)/Ulip, was ∼9 % in the outer flowand ranged from roughly 15 % to 25 % in the boundary layers for the v-gutter atUlip = 50 m s−1.
Consider next the time-averaged flow features downstream of the bluff body.Figure 8 plots the dependence of the time-averaged axial flow field along both axialand transverse cuts. These results were produced from the higher resolution PIVmeasurements. Start with figure 8(a), which plots the axial variation of the velocityat two transverse locations, corresponding to the bluff-body centreline and one half-diameter beyond the bluff-body lip. The figure illustrates how the reverse flow inthe recirculation zone evolves with axial position, reaching a maximum reverse flowvelocity at a location denoted as Lmax which is typically ∼1.5 bluff-body diameters

Density ratio effects on reacting bluff-body flow field characteristics 229
0.8
0.6
0.4
0.2
0.2 0.3 0.5
1.0
0
y (m
m)
0.1 0.4
FIGURE 7. LDV measurement of the turbulence intensity at the bluff-body trailing edge, as afunction of transverse position, for the v-gutter at Ulip = 50 m s−1.
1.5
1.0
0.5
0
0 1 2 3 4
2.0
1.5
1.0
0.6
0.2
–0.2
–1.0 –0.5 1.00.50
1.4
1.0
2.6
2.2
1.8
2.5
1.0
Lmax
Lr
1.5–1.5
(a) (b)
FIGURE 8. Mean axial velocity (symbols) and density profiles (lines), showing (a) axialprofiles and (b) transverse profiles for the ballistic bluff body at Ulip = 50 m s−1, ρu/ρb = 2.5.Arrows indicate which axis of ordinates belongs to which dataset.
downstream. The recirculation zone length, Lr, is also indicated on the figure. Thetransverse profiles of axial velocity are shown in figure 8(b). These transverseprofiles of axial velocity, taken at fixed axial positions, illustrate the recirculationzone and wake profile characteristics. The corresponding mean density profiles areoverlaid. Note that the thickness of the density gradient is slightly less than, althoughcomparable to, that of the shear layer at a given axial position. Note also that thepoint of inflection of the average density profile is located near that for the velocity.In general, near the bluff body the flame tends to sit closer to the flow centrelinethan the shear layer point of inflection (‘inboard’ of the shear layer), whereas fartherdownstream the flame tends to sit farther from the flow centreline (‘outboard’ of theshear layer).
The effect of density ratio on the recirculation zone characteristics is illustratedin figures 9 and 10. These plots show that the recirculation zone length generallyincreases with density ratio. This seems to be consistent with the idea thatrecirculation zone length increases as large-scale vortex shedding is suppressed(Pan, Vangsness & Ballal 1992; Cardell 1993; Shanbhogue 2008). Furthermore, themagnitude and location of peak reverse velocity also increase with density ratio.

230 B. Emerson, J. O’Connor, M. Juniper and T. Lieuwen
0.4
0.2
0
–0.2
1 2 3 4
0.6
–0.40 5
FIGURE 9. Centerline time-averaged velocity for the v-gutter at various density ratios andUlip = 50 m s−1.
–0.1
–0.2
–0.3
3.5
3.0
2.5
2.0
1.0 1.5 2.0 2.5 3.0
1.0 1.5 2.0 2.5 3.0
1.0 1.5 2.0 2.5 3.0
2.0
1.5
1.0
0.5
0.5 3.5
2.5
0
0
–0.4
(a) (b)
(c)
4.0
1.50.5 3.5 0.5 3.5
FIGURE 10. Dependence of the recirculation zone geometry on the density ratio, showing(a) the recirculation zone length, (b) the peak backflow velocity and (c) the axial location ofpeak backflow velocity.

Density ratio effects on reacting bluff-body flow field characteristics 231
(a)
(b)
(c)
(d )
FIGURE 11. Typical instantaneous visualizations of flame and flow structure for the ballisticbluff body with Ulip = 50 m s−1 at two density ratios, showing (a) streamlines at ρu/ρb = 1.7,(b) streamlines at ρu/ρb = 2.4; (c) flame with edge tracking at ρu/ρb = 1.7 and (d) flame withedge tracking at ρu/ρb = 2.4.
Both of these latter parameters have important implications for convective/absoluteinstability of the flow, as well as locations of pockets of absolute instability. Itis important to remember, however, that these data are obtained under ‘limit-cycle’conditions and that the reverse flow velocities are presumably affected by the globalinstability of the flow under the lower density ratio conditions. Finally, the data showa much weaker dependence of recirculation zone characteristics on velocity, consistentwith previous observations (Potter & Wong 1958).
4. Results and analysis: flame and flow dynamics4.1. Spectral and correlation analysis
This section describes key dynamical characteristics of the flame and flow dynamics.Results are primarily presented for the ballistic bluff body at a lip velocity of50 m s−1, which are quite representative of results observed at other conditions.Discussion is included where qualitatively different results are observed at otherconditions. In order to present a qualitative picture of the flow first, figure 11illustrates typical instantaneous streamlines and flame images from low and highdensity ratio flames. The flame images show clear, spatially sinuous undulations at lowdensity ratios which largely disappear at higher density ratios. These observations arein agreement with previous experiments (Kiel et al. 2007) and computations (Erickson& Soteriou 2011) reviewed in § 1.
Flame dynamics were quantified using the transverse positions of the top and bottomflame branch edges, ζU (x, t) and ζL (x, t), as functions of axial position and time, asshown in figure 11(c). This resulted in time series for edge positions along both flamebranches at each axial position. These time series are Fourier transformed to determinetheir temporal spectra, given by ζU (x, f ) and ζL (x, f ).
PIV data were used for corresponding analysis of flow-field dynamics. PIV datashown in this section were taken from the transverse velocity along the combustorcentreline, v(x, y= 0, t) whose Fourier transform is given by v(x, y= 0, f ). The rest ofthis section summarizes the key results obtained from analysis of the time series andspectra of both flame and flow dynamics as functions of flame density ratio.

232 B. Emerson, J. O’Connor, M. Juniper and T. Lieuwen
0.12
0.10
0.08
0.06
0.04
0.02
0 0.1 0.2 0.3 0.4 0.5
StD
0.16
0.08
0.1 0.2 0.3 0.4
StD
0.50
0.12
0.04
(a) (b)
FIGURE 12. Spectra for the ballistic bluff body at Ulip = 50 m s−1 at the axial positionof peak response for (a) upper flame edge position and (b) centreline transverse unsteadyvelocity magnitude.
Figure 12 presents the flame and flow spectra at their axial positions of peakmagnitude, for three density ratios, as functions of Strouhal number, StD = fD/Ulip.Figure 12(a) shows this result for the upper flame edge. At the highest density ratioshown, ρu/ρb = 2.4, spectral energy is broadly distributed across all frequencies, witha small bump at StD ∼ 0.24. As the density ratio is decreased to 2.0, a clear featureappears centred near StD = 0.24. As the density ratio is further decreased to 1.7,the response at StD = 0.24 becomes narrowband and quite prominent. Figure 12(b)shows spectra of the unsteady transverse velocity for the same flow conditions, anddemonstrates that the flow similarly exhibits a growing narrowband spectral feature atStD = 0.24.
Figure 13 overlays the axial development of the above spectra at StD = 0.24. Theseplots emphasize the growth, peak and decay of the flame and the flow responses.These non-monotonic flame spectra envelope results are typical of those measured inflames forced by narrowband disturbances and reflect the additional effect of flameanchoring and kinematic restoration (Shanbhogue et al. 2009b). Notice that the flameresponse and the flow response are related, as would be expected. The peak flameresponse occurs a few bluff-body diameters downstream of the peak flow response,and a stronger flow response results in a stronger flame response.
In order to focus on the characteristics near the frequency of peak response, theintegrated power under the spectral peak between Strouhal numbers of 0.20 and 0.28is computed as a function of density ratio. This energy is converted to an r.m.s. of thesignal at the response frequency by use of Parseval’s theorem, using the relation belowthat relates the r.m.s. of the time series s (t) of duration T and spectrum s (f ),
srms =√
1T
∫ f+
f−
∣∣s(f )∣∣2 df . (4.1)
These r.m.s. values are presented in figure 14 for both the flame and the fluctuatingvelocity. The flame data in figure 14 show that the normalized fluctuation in flameposition has a value of roughly 4 % over the 2.4 < ρu/ρb < 3.4 range. Below avalue of ρu/ρb = 2.4, the response gradually increases to 18 % at ρu/ρb = 1.7. Similarbehaviour is shown by the velocity data. This plot also indicates that the transition inflow and flame characteristics is not an abrupt bifurcation with change in density ratio,but a more gradual increase in narrowband response as the density ratio decreases.

Density ratio effects on reacting bluff-body flow field characteristics 233
0.14
0.10
0.08
0.06
0.04
2 4 6 8 2 3 4 6
0.20
0.10
100 0
0.12
0.02
0.15
0.05
(a) (b)
1 5
FIGURE 13. Axial profiles of (a) the flame and (b) the flow, showing the response atStD = 0.24 for the ballistic bluff body at Ulip = 50 m s−1.
2.0 2.5 3.0 3.5
0.15
0.10
0.05
2.0 2.5 3.0 3.5
0.20
0.15
0.10
0.05
0
0.20
0
(a) (b)Flame edgeCentreline transverse velocity
FIGURE 14. Dependence of narrowband spectral energy (0.2 < StD < 0.28) upon densityratio for ballistic bluff body at Ulip = 50 m s−1, expressed as r.m.s. flame edge fluctuationaveraged over both flame branches, and r.m.s. centreline transverse velocity. Measurementwas taken at (a) the axial position of peak response and (b) x/D= 3.5.
The correlation coefficient between the two flame branches, rU,L, defined
rU,L(x)= 〈ζU(x, t)ζL(x, t)〉√⟨(ζU(x, t))2
⟩ ⟨(ζL(x, t))2
⟩ , (4.2)
provides important information on the scale and/or correlation between the underlyingflow structures perturbing them.
Note that negative and positive correlation coefficients imply asymmetric andsymmetric flame wrinkling, respectively. Furthermore, a nearly zero correlationcoefficient implies that the flame branches are disturbed by uncorrelated structureswith a scale much smaller than their transverse separation distance. The dependenceof the correlation coefficient upon ρu/ρb is plotted in figure 15, showing thatthe correlation coefficients are near zero, but slightly positive, for ρu/ρb >∼ 2.5.The correlation coefficient monotonically decreases towards values of rU,L ∼ −0.6,

234 B. Emerson, J. O’Connor, M. Juniper and T. Lieuwen
0
–0.2
–0.4
2.0 2.4 2.81.6 3.2
0.2
–0.6
Symmetricwrinkling
Asymmetricwrinkling
FIGURE 15. Correlation coefficient between top and bottom flame edge position for theballistic bluff body at Ulip = 50 m s−1. Measurement was taken at the axial position of peakflame response.
indicative of growing correlation and asymmetric motion with decreasing flame densityratio.
To summarize these data, figure 14 shows that there is a gradual increase in spectralenergy at the asymmetric vortex shedding frequency as density ratio is decreased.Figure 15 shows a gradual increase in asymmetry and coherence between the twoflame branches for decreasing ρu/ρb, suggesting the appearance of large structuresin the wake. The very narrowband spectral nature of the flow in figure 12 suggeststhat the flow evolves to a limit-cycling, globally unstable flow at low density ratios.Simultaneously, the limit-cycle amplitude of the global mode grows monotonically inamplitude with decreases in density ratio for ρu/ρb < 2.4. The next section comparesthese results to those derived from parallel stability analyses.
4.2. Comparisons with local stability analysisThis section compares and correlates several of the above described data characteristicsto predictions from a locally parallel stability analysis with top-hat velocity anddensity profiles as sketched out in § 1. In order to plot the experimental tests onthe stability map shown in figure 1(b), knowledge of the backflow ratio and densityratio was required for each condition. The centreline and free-stream axial velocityfields obtained from PIV data were used to calculate the velocities needed to quantifythe backflow ratio, β (x). The measured local backflow ratio (corresponding to aflow profile at a given axial position) and density ratio were then inserted into thehigh-Reynolds-number dispersion relation from Yu & Monkewitz (1990) in order tomap temporal growth rates onto the complex k-plane. Saddle points were locatedand verified to be valid k+/k− pinch points. The growth rate at such a saddle pointcorresponded to a local, predicted absolute spatio-temporal growth rate, ω0,i; thisprocess was then repeated at each axial position, for each test condition.
In addition to this simplified analysis, a numerical analysis was performed whichtook the measured mean velocity and density profiles as inputs. The absolute growthrate, ω0, and absolute wavenumber, k0, were calculated at each axial station byperforming a spatio-temporal stability analysis on the time-averaged velocity anddensity profiles. The linearized, low-Mach-number Navier–Stokes equations werereduced to four ordinary differential equations in four primitive variables (u, v,w, p),which were solved using Chebyshev spectral methods on Gauss–Lobatto spaced

Density ratio effects on reacting bluff-body flow field characteristics 235
gridpoints. The procedure is described in previous work performed at CambridgeUniversity (Rees 2009; Rees & Juniper 2010; Juniper, Tammisola & Lundell 2011).Saddle points were found in the complex k-plane and verified to be valid k+/k− pinchpoints (Huerre & Monkewitz 1990). The valid saddle point with the highest absolutegrowth rate was labelled the dominant saddle point. If the absolute growth rate ofthis saddle point is greater than zero then this slice of the flow is absolutely unstable.These data are somewhat noisier than those that would be obtained from assuminga top-hat velocity profile but are preferred because they use the actual velocity anddensity profiles. This noisiness stems from the strong sensitivity of the growth rate tothe small, but highly significant, transverse shifts in relative locations of gradients inthe density and velocity profiles.
Isocontours of the non-dimensional absolute growth rate, ω0,iD/ (2Uav), arepresented in figure 16. This figure plots calculated absolute growth rate contoursas functions of axial position and density ratio for both bluff bodies at lip velocities of50 and 20 m s−1. Each of these plots was compiled from the measured velocity fieldsfor a given bluff body, lip velocity, and tests at several density ratios. The plots showthat regions of largest local absolute instability, ω0,iD/(2Uav) > 0, occur at low densityratios and at axial positions of roughly x/D∼ 3/2 near where the reverse flow velocityis highest. The spatial extent of these predicted absolute instability pockets growswith decreasing density ratio. Note that the absolute instability region does not startimmediately aft of the bluff body, because of the low backflow velocities immediatelydownstream of the bluff body.
Note that the predictions obtained from the model profile shown in figure 1(a) andthe calculations obtained from the actual measured profiles are qualitatively similar.However, a key quantitative difference between the two is the larger growth rates,and the prediction of absolute instability for a much broader range of density ratios,obtained from the computed results that used the measured profiles. For example,consider figure 16(c,d), showing local absolute stability results for the ballistic bluffbody at 20 m s−1. At a density ratio of ρu/ρb = 2.6, the analytical solution predictsthe flow to be convectively unstable at all spatial positions using the simple profile,while the flow is predicted to have a pocket of absolute instability with the numericalcomputation.
This difference is due to two important simplifications of the model density andvelocity profiles used for the simplified calculation: (i) collocated density and velocityjumps and (ii) an infinite domain. For Reynolds numbers larger than around 102,confinement destabilizes the sinuous mode in wake flows such as these, as discussedby Rees & Juniper (2010). Further effects which influence the stability prediction andare not accounted for by the simplified analysis, such as no-slip boundary conditionsand global versus local results, are detailed by Juniper et al. (2011). In addition, theabsolute-instability growth rate is a very sensitive function of the relative locationsof the gradients in density and velocity. In order to illustrate this point, the modelprofile shown in figure 1(a) was generalized to include confinement and non-collocateddensity and velocity jumps. This analysis is summarized in the Appendix, whichprovides the generalized dispersion relation for the sinuous mode. Figure 17 plots thedependence of the density ratio of the absolute/convective instability transition uponthe density–velocity jump offset, δρ − δu. These results are shown at a fixed backflowof β = 0.25 and both with and without confinement. The velocity jump is located ata distance (from the centreline) corresponding to the bluff-body half-width, and theconfinement was chosen to match the experimental facility. The plot shows the strongdestabilizing effects of non-collocated density and shear layers, as well as confinement.

236 B. Emerson, J. O’Connor, M. Juniper and T. Lieuwen
2.8
2.6
2.4
2.2
2.0
1.8
0 1 2 3 4 5
3.0
2.8
2.6
2.4
2.2
2.0
1.8
1.60 1 2 3 4 5
2.8
2.6
2.4
2.2
2.0
1.8
0 1 2 3 4 5
3.0
2.8
2.6
2.4
2.2
2.0
1.8
1.60 1 2 3 4 5
2.8
2.6
2.4
2.2
2.0
1.8
0 1 2 3 4 5
3.0
2.8
2.6
2.4
2.2
2.0
1.8
1.60 1 2 3 4 5
3.0
1.6
3.0
1.6
3.0
1.6
(a) (b)
(c) (d )
(e) ( f )
2.8
2.6
2.4
2.2
2.0
1.8
1 2 3 4
3.0
2.8
2.6
2.4
2.2
2.0
1.8
1.61 2 3 40 5 0 5
3.0
1.6
(g) (h)
FIGURE 16. ω0,iD/(2Uav) contour maps versus axial position and density ratio, for: (a,b)ballistic bluff body at 50 m s−1; (c,d) ballistic bluff body at 20 m s−1; (e,f ) v-gutter at50 m s−1; (g,h) v-gutter at 20 m s−1. Column (a,c,e,g) shows numerical results from smootheddata, column (b,d,f,h) shows analytical results from top-hat profiles. Contour levels arelabeled on the plots.

Density ratio effects on reacting bluff-body flow field characteristics 237
2.5
2.0
1.5
–0.05 0 0.05
3.0
1.0–0.10 0.10
Convectively unstable
Absolutely unstable
ConfinedUnconfined
FIGURE 17. Stability limit as a function of the density–velocity jump offset, for a constantbackflow ratio of β = 0.25, a velocity jump located at the bluff-body half-width (δu/D= 0.5),and for the confined case a geometry of H/D= 2.
For example, begin with collocated velocity and density jumps for the unconfined case.If the velocity jump location is held fixed, and the density jump is shifted away from(outside of) the flow centreline by 10 % of its original position, then the density ratiofor the absolute/convective (AI/CI) transition increases by 50 %, from about 1.6 to2.4. Adding confinement on top of this further shifts the density ratio for the AI/CItransition to ∼2.7.
The basic trends in figure 17 (i.e. that a shift in the relative positions of velocity anddensity gradients away from one another, in either direction, is destabilizing), can beunderstood from the two limiting cases. If the density layers are moved far outboard ofthe shear layers, the wake and its shear layers essentially sit in a uniform-density fluid,and the stability boundary tends toward that of the iso-density case. The same resultmay be expected if the density layers are moved inboard to the flow centreline; inthis case, the density ratio becomes an increasingly irrelevant quantity since the innerdensity region becomes pinched into a progressively smaller slab along the centreline,and again the wake effectively sits in a uniform-density fluid. Indeed, it can be shownthat the dispersion relation in the Appendix limits to the uniform-density case in thesetwo extremes.
Having shown that the basic trends in figure 17 can be understood from limitingcases, we next discuss the significant sensitivity of the stability boundary to even verysmall changes in relative locations of the gradients. This point is both predicted bythe analysis and borne out by the comparisons between the measurements and the twodifferent stability calculations. The strongly stabilizing effect of non-collocated densityand shear layers on flow stability has been observed previously in direct numericalsimulations (DNS) of a variable-density jet flow by Nichols, Schmid & Riley (2007),who showed that a small degree of misalignment materially changes the flow stabilitycharacteristics. It should be noted that because they studied low-density-ratio jets, thismisalignment was a stabilizing effect, in contrast to the destabilizing effect it has inour low-density-ratio wakes.
For both two-dimensional jets and wakes, the global stability of the system iscrucially affected by the nature of the interactions between the two shear layers. Inparticular, the two shear layers which would be nominally convectively unstable inisolation, interact with each other to cause global instability for the wake problem. The

238 B. Emerson, J. O’Connor, M. Juniper and T. Lieuwen
spatial variations in density influence these interactions through two processes whichare shown in the following vorticity equation, baroclinic torque and gas expansion:
DΩ
Dt=− (∇ ·u)Ω︸ ︷︷ ︸
gas expansion
+ (Ω ·∇)u︸ ︷︷ ︸vortex stretching and bending
+ ∇ρ ×∇p
ρ2︸ ︷︷ ︸baroclinic torque
+∇ ×(∇ · τ
ρ
)︸ ︷︷ ︸
viscous diffusion
. (4.3)
Gas expansion reduces vorticity magnitudes, and consequently weakens the degreeof interactions between the two shear layers. Therefore, it has a stabilizing effecton the system. In addition, vorticity is created through baroclinic torque, which alsomodifies the strength of the vorticity in the two shear layers. Moreover, the baroclinicmechanism is only active in regions with simultaneous pressure and density gradients;for the linearized analysis presented in the Appendix, this is due to the mean densitygradient in the transverse direction interacting with the fluctuating pressure gradient inthe axial direction. Small misalignments in the relative locations of the density andvelocity gradients have a significant influence on baroclinic vorticity.
In reacting flows, this degree of misalignment between the time-averaged densityand velocity gradients will be a strong function of the turbulent burning velocity,which controls the time-averaged speed at which the flame propagates into theunburned mixture and, thus, moves out of the velocity shear layer. For example,increasing laminar burning velocity or turbulence intensity will act to increaseturbulent burning velocity and, hence, alter the relative locations of velocity anddensity gradients. The importance of this effect as a result of varying preheattemperature has been observed by Erickson & Soteriou (2011), who suggested thatthe resulting variations in wake structure that were observed were due in part to theflame moving away from the shear layer. This observation also suggests an explanationfor why the transition in wake structure has been observed at different density ratioranges in different experimental facilities. For example, wake transition has beenobserved within the density ratio range 3.2 6 ρu/ρb 6 5.6 (Baudoin et al. 2009),1.25 6 ρu/ρb 6 2.0 (Erickson & Soteriou 2011), and 1.7 6 ρu/ρb 6 2.4 for the currentstudy. Each of these facilities has different operating conditions, fuels and Reynoldsnumber conditions, and as a result is likely to have significantly different offsetsbetween the density and shear layers. Even for a single backflow ratio, figure 17 showsthe wide range of values that the stability limit could have in terms of density ratio,if the mean flame position moves only a tenth of the bluff-body diameter. In addition,with different bluff-body geometries, these facilities may have different maximumbackflow ratios.
We next reinterpret the measured axial dependence of the centreline velocityfluctuations at StD = 0.24 using the stability calculations. The axial coordinate isreferenced to the location of maximum absolute growth rate, xAI (obtained fromfigure 16), which for the simple top-hat profile corresponds to the location ofmaximum backflow ratio. These results are presented in figure 18.
Both plots show that, for a range of conditions, growth of the narrowbandStD ∼ 0.24 fluctuations begins at approximately the same location, within roughly ahalf of the bluff-body diameter of one another, and that this location is centred nearthe numerically predicted peak in absolute growth rate at x − xAI ∼ 0. The analyticalpeak occurs slightly farther upstream, such that narrowband velocity fluctuations beginto grow at (x − xAI)/D ∼ −0.5. Once the oscillations are initiated in the pocket ofabsolute instability, the structure associated with this mode continues to grow spatiallyas it passes through the downstream convectively unstable regime.

Density ratio effects on reacting bluff-body flow field characteristics 239
0.15
0.10
0.05
1.5–0.5 0.5
0.20
0.15
0.10
0.05
0
0.20
02.5–1.5
(a) (b)
1.5–0.5 0.5 2.5–1.5
FIGURE 18. v′rms at StD ∼ 0.24 versus distance downstream from the predicted location ofmaximum absolute growth rate for several test conditions showing: (a) numerical result fromsmoothed data; (b) analytical result from top-hat profiles.
It should be emphasized that the parallel stability analysis assumes a ‘quiescent’base state, i.e. one without coherent or turbulent fluctuations. When the system isglobally unstable, large vortices are alternately shed from the bluff body, which alterthe time-averaged profiles. Therefore, while quantitative variations between this typeof stability analysis and these data should be expected, the general agreement betweenmodel and data shown above illustrates that the key physical processes are nonethelesscaptured.
5. IntermittencyThe spectral and correlation analysis section (§ 4.1) showed that there is a gradual
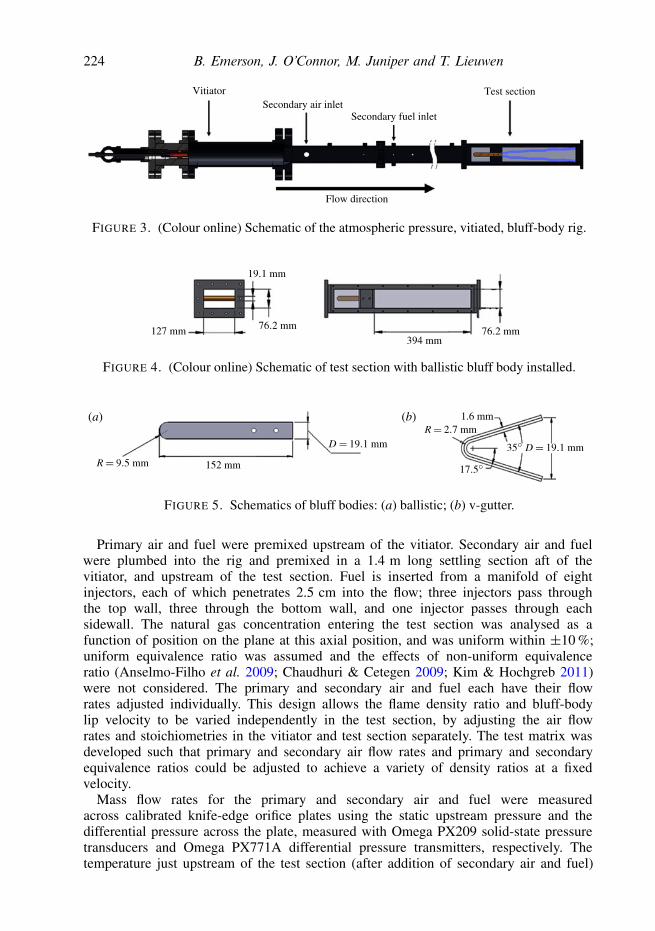
increase in spectral energy at the asymmetric vortex shedding frequency as densityratio is decreased. In other words, the flow does not abruptly bifurcate to a globallyunstable mode below some threshold density ratio. However, the measures of theflame and flow response illustrated above are averaged temporal attributes and do notillustrate that the flame dynamics are actually highly intermittent in time. As willbe shown next, it appears that rather than characterizing the limit-cycle amplitudeas monotonically growing in amplitude with ρu/ρb, a better description is that theflow has two possible states (a stable, noise-driven fixed point and a limit-cyclingoscillation) and intermittently varies between them. This intermittency is an importantfinding of this work, as it suggests that the flow does not bifurcate suddenly whencrossing the stability boundary; rather, the flow characteristics shift gradually due tointermittency as stability parameters are varied. The relative fraction of time the flowspends in each state monotonically varies with density ratio. This intermittent characteris evident from figure 19, which shows a short sequence of flame images at the sameoperating condition; the flame has a generally symmetric structure at the beginning
240 B. Emerson, J. O’Connor, M. Juniper and T. Lieuwen
1
0
–1
0 1 2 3 4 5 6 7 8 9
1
0
–1
0 1 2 3 4 5 6 7 8 9
1
0
–1
0 1 2 3 4 5 6 7 8 9
1
0
–1
0 1 2 3 4 5 6 7 8 9
(a)
(b)
(c)
(d )
FIGURE 19. Sequence of flame images with edge tracking, demonstrating intermittent flamestructure for ballistic bluff body at Ulip = 50 m s−1 and ρu/ρb = 2.0. (a) t = 0 ms; (b)t = 1.33 ms; (c) t = 2.67 ms; (d) t = 4.00 ms.
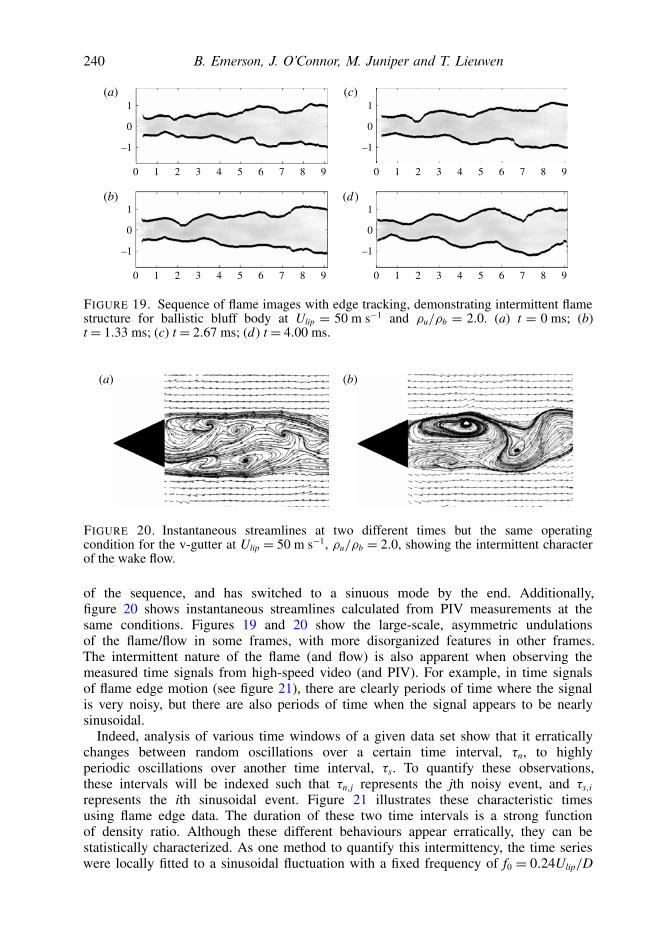
(a) (b)
FIGURE 20. Instantaneous streamlines at two different times but the same operatingcondition for the v-gutter at Ulip = 50 m s−1, ρu/ρb = 2.0, showing the intermittent characterof the wake flow.
of the sequence, and has switched to a sinuous mode by the end. Additionally,figure 20 shows instantaneous streamlines calculated from PIV measurements at thesame conditions. Figures 19 and 20 show the large-scale, asymmetric undulationsof the flame/flow in some frames, with more disorganized features in other frames.The intermittent nature of the flame (and flow) is also apparent when observing themeasured time signals from high-speed video (and PIV). For example, in time signalsof flame edge motion (see figure 21), there are clearly periods of time where the signalis very noisy, but there are also periods of time when the signal appears to be nearlysinusoidal.
Indeed, analysis of various time windows of a given data set show that it erraticallychanges between random oscillations over a certain time interval, τn, to highlyperiodic oscillations over another time interval, τs. To quantify these observations,these intervals will be indexed such that τn,j represents the jth noisy event, and τs,i
represents the ith sinusoidal event. Figure 21 illustrates these characteristic timesusing flame edge data. The duration of these two time intervals is a strong functionof density ratio. Although these different behaviours appear erratically, they can bestatistically characterized. As one method to quantify this intermittency, the time serieswere locally fitted to a sinusoidal fluctuation with a fixed frequency of f0 = 0.24Ulip/D

Density ratio effects on reacting bluff-body flow field characteristics 241
0
0 5 10 15 20 25 30 35
10 15 20 25 35
0.5
0.5
–0.5
0 5 30
1.0
(a)
(b)
FIGURE 21. (a) Time signal of flame edge motion for Ulip = 50 m s−1, ρu/ρb = 2.0,partitioned (and labelled accordingly) into sinusoidal times and noisy times; (b) rf , definingwhen each time signal is approximately sinusoidal according to a threshold value, rt.
over a two-period window, providing an amplitude Z (x) and phase ψ (x). Within eachtwo-period window, a correlation coefficient, rf , was calculated between the sine fitand the actual data, providing a measure of the goodness of fit:
rf (x)= 〈ζU (x, t)Z (x) sin (2πf0t + ψ (x))〉√⟨(ζU (x, t))2
⟩ ⟨(Z (x) sin (2πf0t + ψ (x)))2⟩ . (5.1)
A sample plot of the temporal dependence of rf at ρu/ρb = 2.0 is plotted infigure 21(b), illustrating that it spends a significant fraction of time between 0.8and 1.0 for flame edge position (slightly less for the unsteady transverse velocity), butalso has certain periods of time where it drops to values well below 0.5. In contrast,the results at ρu/ρb = 2.4 would show substantially more time with low correlationcoefficients.
The fraction of time that this correlation coefficient exceeds a specified thresholdvalue, rt (shown on figure 21b), was computed at each spatial location and densityratio. Figure 22(a) plots a typical result at two threshold values, rt = 0.5 and0.8. Notice the similarities between the spectral energy plot, figure 14, and theintermittency plot, figure 22(a). Figure 22(b) shows a similar result plotted as afunction of axial position for several density ratios.
These data clearly show that the rise in narrowband energy is associated with anincreased fraction of time that the flow spends in a limit-cycling state, manifestedby asymmetric structures with length scales of the order of the bluff-body diameter.However, the growth in amplitude with decreasing density ratio shown in figure 12is not only due to intermittency effects, but also to a rise in limit-cycle amplitudeduring the time instants when the flow exhibits a highly periodic character. In orderto quantify this point, we calculated the conditional amplitude of the sinusoidal fitsaveraged over the time intervals where rf > rt, denoted by ζ ′rms(rf > rt) in figure 23.The figure shows that the monotonic increase in narrowband spectral energy is not

242 B. Emerson, J. O’Connor, M. Juniper and T. Lieuwen
2.0 2.5 3.0 3.5
1.0
0.8
0.6
0.4
0.2
2 31 4 5 6 7 80
(b)
0.8
0.6
0.4
0.2
1.0
0
(a)
FIGURE 22. Fraction of time that upper flame edge sine-fit correlation coefficient is greaterthan the threshold value for the ballistic bluff body at Ulip = 50 m s−1, plotted against: (a)density ratio at x/D= 3.5 and (b) axial position for rt = 0.8.
0.15
0.10
0.05
2.0 2.5 3.0 3.5
0.20
0
FIGURE 23. Effect of density ratio and intermittency on flame limit-cycle amplitude for theballistic bluff body at Ulip = 50 m s−1, x/D= 3.5.
only due to changes in intermittency characteristics, but also because of a rise inlimit-cycle amplitude of the sinusoidal configuration as density ratio decreases.
As introduced previously, the time intervals of the ‘sinusoidal’ and ‘random’bursts in the flame edge time series were determined, and were named τs and τn,respectively. These were obtained by traversing through the correlation coefficienttime series (shown in figure 21b), and recording the time between crossings of thecorrelation coefficient threshold. Time spent above the threshold was associated withsinusoidal bursts, and time below the threshold was associated with random bursts.Thus, event durations were accumulated for both sinusoidal and random bursts. Theprobability density functions (p.d.f.s) of these event durations, τs and τn, very closelyresemble exponential distributions, p.d.f.(τ > 0, λ) = λe−λτ , where λ is a constantoften referred to as the ‘rate parameter’. Qualitatively, the p.d.f.s of τs reveal that asdensity ratio decreases, longer duration sinuous events become increasingly common(an increasingly large fraction of events have large τs). Although an exponentialdistribution provided the best fit to these p.d.f.s, τs and τn were also distributedvery nearly log-normally. Log-normal behaviour of intermittent fluid phenomena is

Density ratio effects on reacting bluff-body flow field characteristics 243
7
6
5
4
3
2.0 2.5 3.0 3.5
8
2
FIGURE 24. Density ratio dependence of 〈τs,i〉 based on ρt = 0.8 and two-period shiftingwindows, at x/D = 3.5. Data are from the upper flame edge signal for the ballistic bluff bodyat Ulip = 50 m s−1.
0.3
0.2
0.1
1 2 3 4
0.4
0 8765
FIGURE 25. Smoothed distributions of the sinusoidal event arrival rate for several densityratios. Data are from the upper flame edge signal for the ballistic bluff body at Ulip =50 m s−1.
not uncommon; Kolmogorov (1962) suggested that the interval between intermittent‘bursts’ in a turbulent boundary layer is distributed log-normally, a prediction thathas also been experimentally observed (Rao, Narasimha & Badri Narayanan 1971).Likewise, turbulence intensity in atmospheric boundary layers is distributed log-normally (Kholmyansky, Moriconi & Tsinober 2007). Intermittency is also presentin other aspects of bluff-body flows, such as Rai’s (2010) observations of shear layeramplification rates.
The average durations of these ‘sinusoidal’ time intervals,⟨τs,i
⟩, normalized by the
limit-cycle period, are plotted against density ratio in figure 24 using a two-periodwindow size. This result shows that
⟨τs,i
⟩increases monotonically with decreasing
density ratio. The figure shows that at the lowest density ratios, the average duration ofthe limit-cycling behaviour occupies as many as 7 periods of the oscillation, whereasat higher density ratios this behaviour persists, on average, for only 2 or 3 periods.This result shows that as density ratio is decreased, the sinuous, narrowband statebecomes present for increased durations of time, i.e. the monotonic dependence on

244 B. Emerson, J. O’Connor, M. Juniper and T. Lieuwen
density ratio shown in figure 22 is not due to an increased event rate, but an increasedevent duration. This becomes evident from figure 25, which presents the p.d.f.s of theevent arrival rates; notice that the mean arrival rate first increases and then decreasesas density ratio is decreased. In fact, the event rate for sinusoidal intervals becomesvery low at low density ratios; this makes sense, because as density ratio decreasesand the signal dwells in a sinusoidal configuration for much longer intervals, the eventrate necessarily becomes low. The p.d.f.s shown in figure 25 correlate very well with aPoisson distribution.
Intermittent behaviours have been discussed extensively in nonlinear dynamicalsystems, and may arise from either deterministic or stochastic processes. Hilborn(1994) discusses several deterministic sources of intermittency, which include tangentbifurcation intermittency (Type I), Hopf-bifurcation intermittency (Type II), period-doubling intermittency (Type III), and on–off intermittency. For example, thePomeau–Manneville scenario (Pomeau & Manneville 1980) is a deterministic route tochaos through intermittency; such an intermittency may be present even in a noiselesssystem.
Stochastic processes associated with either additive or parametric noise may alsocause intermittency (Horsthemke & Lefever 1984). For example, consider a bi-stabledynamical system, such as a system in the vicinity of a subcritical bifurcation with astable fixed point and limit cycle. In the presence of additive noise, the system maybe bumped back and forth between the two stable solutions; the stationary probabilitydensity of such a system would have local maxima at values consistent with thelocations of the potential wells. For example, Waugh & Juniper (2011) demonstratedthis phenomenon in the context of the Rijke tube.
Parametric noise can also lead to intermittency in systems with supercriticalbifurcations (Horsthemke & Lefever 1984). For example, consider a dynamical systemwith a single stable fixed point in the unforced system. Parametric noise can shift thestability boundary, as well as change the number or location of the maxima in thestationary probability density. A qualitative shift in the stationary p.d.f. is thus possiblein the context of parametric noise.
The viscous, iso-density bluff-body wake undergoes a supercritical Hopf bifurcationat ReD ≈ 35 (White 2006). While we are not aware of theoretical studies that haveexplored the nature of this bifurcation for non-constant-density wakes, analysis ofthese data suggests that the bifurcation remains supercritical. For example, figure 26plots the p.d.f. of the amplitude of the flame front oscillations, ζ ′, obtained from itsHilbert transform.
This figure does not show any behaviour indicative of multiple peaks in theamplitude p.d.f., which would be suggestive of a bi-stable system. Rather it showsa gradual shift in the peak amplitude to higher values as density ratio is reduced.Thus, these results suggest that the system undergoes a supercritical bifurcation in thepresence of parametric background noise. An important remaining question, then, iswhat is the source of the parametric noise that leads to this intermittent behaviour? Wewill next show that this is due to random fluctuations in relative location of the shearlayer and flame front. In the comparisons with local stability analysis section (§ 4.2),the large sensitivity of the flow stability to the degree of non-collocation between thedensity and shear layers was emphasized. Thus, relative motion of the shear layerand flame edge within the wave-maker region can lead to stochastic modulation ofthe global mode amplification rate. In order to illustrate this point, figure 27 plotsa p.d.f. of the moving average (over a time interval of 3/f0) of the offset betweenthe flame and the shear layer. The flame edge was obtained by edge-tracking the

Density ratio effects on reacting bluff-body flow field characteristics 245
5
4
3
2
1
0.2 0.4 0.6 0.8 1.0 1.2
6
1.40
FIGURE 26. P.d.f. of the envelope of flame edge displacement, shown for several densityratios at x/D= 4.
12
10
8
6
4
2
–0.2 0
ColocatedFlameinboard
Flameoutboard
0.5
14
0
UnconditionalConditioned on
–0.4 0.2
FIGURE 27. P.d.f. of the unconditioned and conditioned offset between the flame edge andthe shear layer.
abrupt change in density in the Mie scattering images, and the shear layer pointof inflection was obtained from the PIV measurement. The data for this plot weretaken at x/D = 2.0, near the peak in absolute instability growth rate (see figure 16).Two p.d.f.s are presented, one unconditional, and the other conditioned on the valueof rf > 0.5 (indicative of periodicity of the flame measurement at the global modefrequency). At this axial position, the mean flame sits inboard of the shear layers(farther downstream, the mean flame propagates outboard of the shear layers). Whena high degree of periodicity at the global mode frequency is observed, the flame ispreferentially located even farther inboard, i.e. the peak in the p.d.f. of the conditionedoffset is more than 50 % larger than the unconditioned value. Thus, the most probableoffset between the flame and the shear layer is greater when periodic oscillations areobserved than the most probable, unconditional offset between these layers.
We conclude this section by revisiting the local stability theory. As alluded topreviously, such a comparison is complicated by the fact that no clearcut bifurcation inflow stability occurs. In order to compare the stability characteristics of the differentgeometries and velocities, figure 28 summarizes the data by plotting the maximum

246 B. Emerson, J. O’Connor, M. Juniper and T. Lieuwen
1.2
1.0
0.8
0.6
0.4
0.2
20 40 60 80 20 40 60 80
1.0
0.5
0
–0.5
–1.0
–1.5
1.4
(a) (b)
100
Intermittency factor (%)0 0 100
Intermittency factor (%)
FIGURE 28. Dependence of predicted absolute growth rate upon measured intermittencyfactor, showing: (a) numerical result from smoothed data; (b) analytical result from top-hatprofiles.
ω0,iD/ (2Uav) for a given test (corresponding to the location of maximum reverse flowvelocity) as a function of the intermittency factor. Intermittency is quantified by thefraction of time that rf > rt = 0.5. The figure shows that there is a good correlationbetween absolute growth rate and intermittency. Moreover, the slopes of all four datasets are comparable. It is also evident that predicted absolute growth rate values aresystematically lower with the ballistic shape than the v-gutter (consistent with thelower backflow ratio for the ballistic shape).
These results show that the variation in intermittent characteristics of the flow iswell correlated with the absolute stability characteristics of a quiescent base state flowwith similar mean flow properties.
6. Concluding remarksThese results clearly show that the bluff-body wake structure is a strong function
of density ratio and relative location of flame and velocity gradients. Results fromparallel flow stability analysis were used to correlate various measured features of areacting bluff-body wake. This information was used to show that the wake’s large-scale sinuous motion, if it exists, is spawned at a location near the maximum absolutegrowth rate.
An important observation from this flow is that no sharp bifurcation occurs withvariations in ρu/ρb. Rather, at intermediate density ratios the wake exhibits twobehaviours intermittently. This intermittency is due to parametric noise associatedwith random fluctuations in relative offsets of the flame location and shear layer, whichcauses a stochastic modulation of the global mode growth rate. Additionally, this studyshows that the wake mode intermittency is correlated with the maximum growth rateof absolute instability in the wake.
These results emphasize that the convective/absolute instability transition does notoccur abruptly at a certain ρu/ρb value for the high-Reynolds-number flow consideredhere. This has significant implications for many important combustor applicationswhich operate in the transitional, highly intermittent density range. This suggeststhat such flows intrinsically exhibit two co-existing dynamical states, intermittentlyjumping between the two. An important future study is to characterize the effectsof narrowband acoustic excitation on these flow structures. While the effect of such

Density ratio effects on reacting bluff-body flow field characteristics 247
H
FIGURE 29. Geometry governing the dispersion relations in (A 1) and (A 3), for the sinuouswake mode with non-collocated density and shear layers.
excitation on a convectively or absolutely unstable flow is reasonably well understood(see § 1), its effects in this highly intermittent flow will require clarification.
AppendixThe dispersion relation for the confined, sinuous wake mode with non-collocated
density and shear layers and rigid walls at y=±H, when the density layer is closer tothe flow centreline than the shear layer, is
ρb
ρu
ek(δρ−δu)
[1+ α (Uu − c)2
(Ub − c)2
]+ ek(δu−δρ)
[1− α (Uu − c)2
(Ub − c)2
]ek(δρ−δu)
[1+ α (Uu − c)2
(Ub − c)2
]− ek(δu−δρ)
[1− α (Uu − c)2
(Ub − c)2
]=
ekδρ + e−kδρ
ekδρ − e−kδρ(A 1)
where c is modal wave phase speed, and α is a confinement parameter defined by
α = ekδu + e2kHe−kδu
ekδu − e2kHe−kδu. (A 2)
The dispersion relation for when the shear layer is closer to the flow centreline thanthe density layer is
(Uu − c)2
(Ub − c)2
(ρb
ρu+ α
)ek(δu−δρ) −
(ρb
ρu− α
)ek(δρ−δu)(
ρb
ρu+ α
)ek(δu−δρ) +
(ρb
ρu− α
)ek(δρ−δu)
= ekδu − e−kδu
ekδu + e−kδu(A 3)
where α is defined by
α = ekδρ + e2kHe−kδρ
ekδρ − e2kHe−kδρ. (A 4)
The geometry used in these equations is provided in figure 29. This geometry wasassumed symmetric about the bluff-body centreline, which is shown at the bottom ofthe figure. In the limiting case of H→∞ (α→−1) and δu = δρ , these dispersionrelations simplify to the unconfined result of Huerre & Monkewitz (1990) and Yu &Monkewitz (1990) as presented in § 1.

248 B. Emerson, J. O’Connor, M. Juniper and T. Lieuwen
R E F E R E N C E S
ANDERSON, K. R., HERTZBERG, J. & MAHALINGAM, S. 1996 Classification of absolute and con-vective instabilities in premixed bluff body stabilized flames. Combust. Sci. Technol. 112 (1),257–269.
ANSELMO-FILHO, P., HOCHGREB, S., BARLOW, R. S. & CANT, R. S. 2009 Experimentalmeasurements of geometric properties of turbulent stratified flames. Proc. Combust. Inst. 32,1763–1770.
AQUARO, D. & PIEVE, M. 2007 High temperature heat exchangers for power plants: performance ofadvanced metallic recuperators. Appl. Therm. Engng 27 (2–3), 389–400.
BAUDOIN, E., YU, R., NOGENMYR, K. J., BAI, X. S. & FUREBY, C. 2009 Comparison ofLES models applied to a bluff body stabilized flame. In 47th AIAA Aerospace SciencesMeeting Including the New Horizons Forum and Aerospace Exposition, Orlando, FL. AIAA.AIAA-2009-1178.
BEARMAN, P. 1969 On vortex shedding from a circular cylinder in the critical Reynolds numberregime. J. Fluid Mech. 37 (3), 577–585.
BEER, J. & CHIGIER, N. 1972 Combustion Aerodynamics. John Wiley and Sons.BERS, A. 1983 Handbook of Plasma Physics I: Basic Plasma Physics. North-Holland.BILL, R. G. JR. & TARABANIS, K. 1986 The effect of premixed combustion on the recirculation
zone of circular cylinders. Combust. Sci. Technol. 47, 39–53.BLEVINS, R. D. 1977 Flow-Induced Vibration. Van Nostrand Reinhold Co.BRIGGS, R. J. 1964 Electron-stream Interaction with Plasmas. MIT.CANTWELL, B. & COLES, D. 1983 An experimental study of entrainment and transport in the
turbulent near wake of a circular cylinder. J. Fluid Mech. 136, 321–374.CARDELL, G. S. 1993 Flow past a circular cylinder with a permeable wake splitter plate. PhD thesis,
California Insititute of Technology, Pasadena.CHAUDHURI, S. & CETEGEN, B. M. 2009 Response dynamics of bluff-body stabilized conical
premixed turbulent flames with spatial mixture gradients. Combust. Flame 156 (3), 706–720.CHAUDHURI, S., KOSTKA, S., RENFRO, M. W. & CETEGEN, B. M. 2010 Blowoff dynamics of
bluff body stabilized turbulent premixed flames. Combust. Flame 157 (4), 790–802.CRIMINALE, W. O., JACKSON, T. L. & JOSLIN, R. D. 2003 Theory and Computation in
Hydrodynamic Stability. Cambridge University Press.CROSS, C., FRICKER, A., SHCHERBIK, D., LUBARSKY, E., ZINN, B. T. & LOVETT, J. A. 2010
Dynamics of non-premixed bluff body-stabilized flames in heated air flow. In ASME TurboExpo, Glasgow, UK. GT2010-23059.
CRUMP, J. E., SCHADOW, K. C., YANG, V. & CULICK, F. E. C. 1986 Longitudinal combustioninstabilities in Ramjet engines: identification of acoustic modes. J. Propul. Power 2 (2),105–109.
ERICKSON, R. R. & SOTERIOU, M. C. 2011 The influence of reactant temperature on the dynamicsof bluff body stabilized premixed flames. Combust. Flame 158 (12), 2441–2457.
HERTZBERG, J. R., SHEPHERD, I. G. & TALBOT, L. 1991 Vortex shedding behind rod stabilizedflames. Combust. Flame 86, 1–11.
HILBORN, R. C. 1994 Chaos and Nonlinear Dynamics. Oxford University Press.HO, C.-M. & HUERRE, P. 1984 Perturbed Free Shear Layers. University of Southern California.HORSTHEMKE, W. & LEFEVER, R. 1984 Noise Induced Transitions. Springer.HUANG, R. F. & CHANG, K. T. 2004 Oscillation frequency in wake of a vee gutter. J. Propul.
Power 20 (5), 871–878.HUERRE, P. & MONKEWITZ, P. A. 1985 Absolute and convective instabilities in free shear layers.
J. Fluid Mech. 159, 151–168.HUERRE, P. & MONKEWITZ, P. A. 1990 Local and global instabilities in spatially developing flows.
Annu. Rev. Fluid Mech. 22 (1), 473–537.JUNIPER, M. P., TAMMISOLA, O. & LUNDELL, F. 2011 The local and global stability of confined
planar wakes at intermediate Reynolds number. J. Fluid Mech. 686, 218–238.KARLOVITZ, B., DENNISTON, D. W., KNAPSCHAEFER, D. H. & WELLS, F. E. 1953 Studies on
turbulent flames. Proc. Combust. Inst. 4, 613–620.

Density ratio effects on reacting bluff-body flow field characteristics 249
KHOLMYANSKY, M., MORICONI, L. & TSINOBER, A. 2007 Large-scale intermittency in theatmospheric boundary layer. Phys. Rev. E 76 (2).
KIEL, B., GARWICK, K., LYNCH, A., GORD, J. R. & MEYER, T. 2006 Non-reacting andcombusting flow investigation of bluff bodies in cross flow. In 42nd AIAA/ASME/SAE/ASEEJoint Propulsion Conference & Exhibit, Sacramento, California. AIAA-2006-5234.
KIEL, B., GARWICK, K., LYNCH, A. & GORD, A. 2007 A detailed investigation of bluff bodystabilized flames. In 45th AIAA Aerospace Sciences Meeting & Exhibit, Reno, Nevada.AIAA-2007-168.
KIM, K. T. & HOCHGREB, S. 2011 The nonlinear heat release response of stratified lean-premixedflames to acoustic velocity oscillations. Combust. Flame 158, 2482–2499.
KIM, W., LIENAU, J., VAN SLOOTEN, P., COLKET, M., MALECKI, R. & SYED, S. 2006 Towardsmodelling lean blowout in gas turbine flameholder applications. Trans. ASME: J. Engng GasTurbines Power 128, 40–48.
KOLMOGOROV, A. N. 1962 A refinement of previous hypotheses concerning the local structure ofturbulence in a viscous incompressible fluid at high Reynolds number. J. Fluid Mech. 13 (1),82–85.
LIEUWEN, T. C. & YANG, V. (ED.) 2005 Combustion instabilities in gas turbine engines:operational experience, fundamental mechanisms, and modeling. Prog. Astronaut. Aeronaut.210.
LOVETT, J. A., BROGAN, T. P., PHILIPPONA, D. S., KEIL, B. V. & THOMPSON, T. V. 2004Development needs for advanced afterburner designs. 40th AIAA/ASME/SAE/ASEE JointPropulsion Conference and Exhibit, Fort Lauderdale, FL. AIAA-2004-4192.
MASSELIN, M. & HO, C.-M. 1985 Lock-on and instability in a flat plate wake. In AIAA ShearFlow Control Conference, Boulder, CO. AIAA-1985-571.
MEI, R. 1996 Velocity fidelity of flow tracer particles. Exp. Fluids 22, 1–13.MELLING, A. 1997 Tracer particles and seeding for particle image velocimetry. Meas. Sci. Technol.
8, 1406–1416.MONKEWITZ, P. A. 1988 The absolute and convective nature of instability in two-dimensional wakes
at low Reynolds numbers. Phys. Fluids 31 (5).NAIR, S. 2006 Acoustic detection of blowout phenomenon. PhD thesis, Georgia Institute of
Technology, Atlanta, GA.NAIR, S. & LIEUWEN, T. 2005 Acoustic detection of blowout in premixed flames. J. Propul. Power
21, 32–39.NICHOLS, J. W., SCHMID, P. J. & RILEY, J. J. 2007 Self-sustained oscillations in variable-density
round jets. J. Fluid Mech. 582, 341–376.PAN, J. C., VANGSNESS, M. D. & BALLAL, D. R. 1992 Aerodynamics of bluff-body stabilized
confined turbulent premixed flames. Trans. ASME: J. Engng Gas Turbines Power 114,783–789.
PERRY, A. E., CHONG, M. S. & LIM, T. T. 1982 The vortex shedding process behindtwo-dimensional bluff bodies. J. Fluid Mech. 116, 77–90.
POINSOT, T. J., TROUVE, A. C., VEYNANTE, D. P., CANDEL, S. M. & ESPOSITO, E. J. 1987Vortex-driven acoustically coupled combustion instabilities. J. Fluid Mech. 177, 265–292.
POMEAU, Y. & MANNEVILLE, P. 1980 Intermittent transition to turbulence in dissipative dynamicalsystems. Commun. Math. Phys. 74, 189–197.
POTTER, A. E. JR. & WONG, E. L. 1958 Effect of pressure and duct geometry on bluff-body flamestabilization. National Advisory Committee on Aeronautics, Cleveland, OH.
PRASAD, A. & WILLIAMSON, C. H. K. 1997 The instability of the shear layer separating from abluff body. J. Fluid Mech. 333, 375–402.
RAI, M. M. 2010 A computational investigation of the instability of the detached shear layers in thewake of a circular cylinder. J. Fluid Mech. 659, 375–404.
RAO, K. N., NARASIMHA, R. & BADRI NARAYANAN, M. A. 1971 The ‘bursting’ phenomenon in aturbulent boundary layer. J. Fluid Mech. 48 (2), 339–352.
REES, S. J. 2009 Hydrodynamic instability of confined jets & wakes and implications for gas turbinefuel injectors. PhD thesis, University of Cambridge.
REES, S. J. & JUNIPER, M. 2010 The effect of confinement on the stability of viscous planar jetsand wakes. J. Fluid Mech. 656, 309–336.

250 B. Emerson, J. O’Connor, M. Juniper and T. Lieuwen
ROSHKO, A. 1954 On the drag and shedding frequency of two-dimensional bluff bodies. NationalAdvisory Committee on Aeronautics.
ROSHKO, A. 1955 On the wake and drag of bluff bodies. J. Aeronaut. Sci. 22 (2), 124–132.ROSHKO, A. 1961 Experiments on the flow past a cylinder at very high Reynolds numbers. J. Fluid
Mech. 10, 345–356.SCHLICHTING, H. & GERSTEN, K. 2000 Boundary-Layer Theory. Springer.SCHMID, P. J. & HENNINGSON, D. S. 2001 Stability and Transition in Shear Flows. Springer.SHANBHOGUE, S. 2008 Dynamics of perturbed exothermic bluff-body flow-fields. PhD thesis, School
of Aerospace Engineering, Georgia Institute of Technology, Atlanta, GA.SHANBHOGUE, S. J., HUSAIN, S. & LIEUWEN, T. 2009a Lean blowoff of bluff body stabilized
flames: scaling and dynamics. Prog. Energy Combust. Sci. 35 (1), 98–120.SHANBHOGUE, S. J., SHIN, D.-H., HEMCHANDRA, S., PLAKS, D. & LIEUWEN, T. 2009b
Flame-sheet dynamics of bluff-body stabilized flames during longitudinal acoustic forcing.Proc. Combust. Inst. 32 (2), 1787–1794.
SMITH, D. A. & ZUKOSKI, E. E. 1985 Combustion instability sustained by unsteady vortexcombustion. In AIAA/SAE/ASME/ASEE Joint Propulsion Conference, Monterey, CA.AIAA-1985-1248.
SOTERIOU, M. C. & GHONIEM, A. F. 1994 The vorticity dynamics of an exothermic, spatiallydeveloping, forced reacting shear layer. Proc. Combust. Inst. 25 (1), 1265–1272.
THURSTON, D. W. 1958 An experimental investigation of flame spreading from bluff bodyflameholders. Engineer’s thesis, California Institute of Technology, Pasadena.
WAUGH, I. C. & JUNIPER, M. P. 2011 Triggering in a thermoacoustic system with stochastic noise.Int. J. Spray Combust. Dyn. 3 (3), 225–242.
WHITE, F. M. 2006 Viscous Fluid Flow. McGraw-Hill.WILLIAMS, F. A. 1966 Flame stabilization of premixed turbulent gases. Appl. Mech. Surveys
1157–1170.YAMAGUCHI, S., OHIWA, N. & HASEGAWA, T. 1985 Structure and blow-off mechanism of
rod-stabilized premixed flame. Combust. Flame 62, 31–41.YANG, J. T., YEN, C. W. & TSAI, G. L. 1994 Flame stabilization in the wake flow behind a slit
v-gutter. Combust. Flame 99, 288–294.YANG, V. & CULICK, F. E. C. 1986 Analysis of low frequency combustion instabilities in a
laboratory Ramjet combustor. Combust. Sci. Technol. 45, 1–25.YU, M.-H. & MONKEWITZ, P. A. 1990 The effect of non-uniform density on the absolute
instability of two-dimensional inertial jets and wakes. Phys. Fluids A 2 (7), 1175–1181.ZDRAVKOVICH, M. M. 1997 Flow Around Circular Cylinders: A Comprehensive Guide Through
Flow Phenomena, Experiments, Applications, Mathematical Models, and Computer Simulations.Oxford University Press.