Jonathon Peros, NEFMC Staff - Amazon S3...Jonathon Peros, NEFMC Staff Scallop Advisory Panel Meeting...
46
Jonathon Peros, NEFMC Staff Scallop Advisory Panel Meeting September 18, 2019 Scallop Committee Meeting September 19, 2019 1
Transcript of Jonathon Peros, NEFMC Staff - Amazon S3...Jonathon Peros, NEFMC Staff Scallop Advisory Panel Meeting...
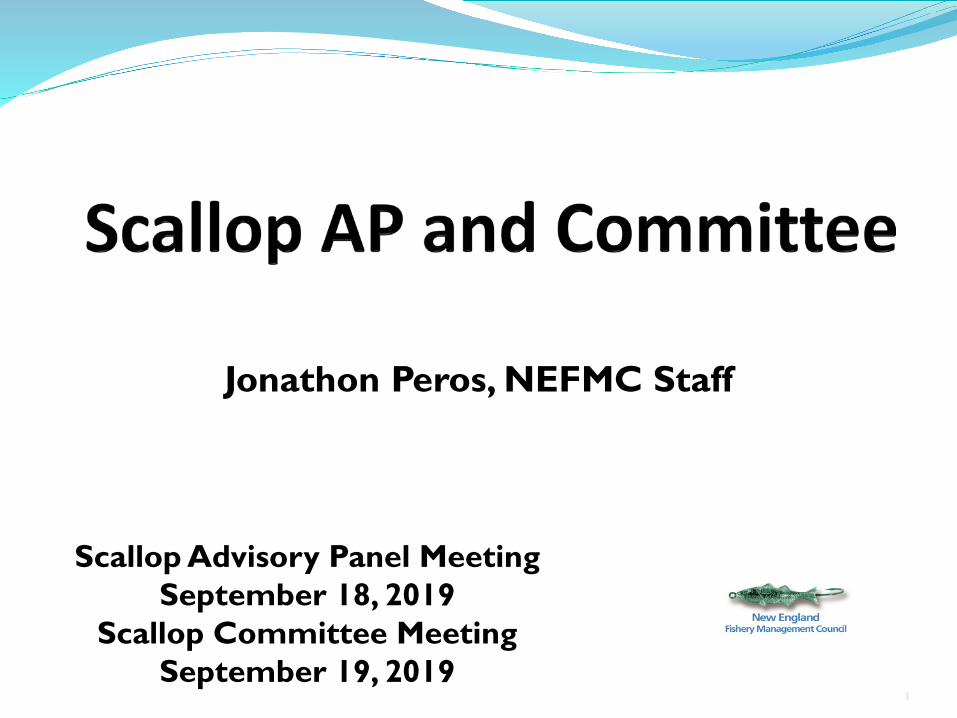
Jonathon Peros, NEFMC Staff
Scallop Advisory Panel MeetingSeptember 18, 2019
Scallop Committee MeetingSeptember 19, 2019
1

Upcoming Meetings (2019) September 26 – Scallop Report – NEFMC
(Gloucester, MA)October 1 – PDT (Braintree, MA)October TBD – PDT (Conference Call)October 17 – SSC Meeting (Boston, MA)October 23/24 – PDT/AP & CTE (New Bedford, MA) Framework 32 Final Action – December Council Amendment 21: Vote on range of alternatives in Jan?April 1 –Target Implementation
2
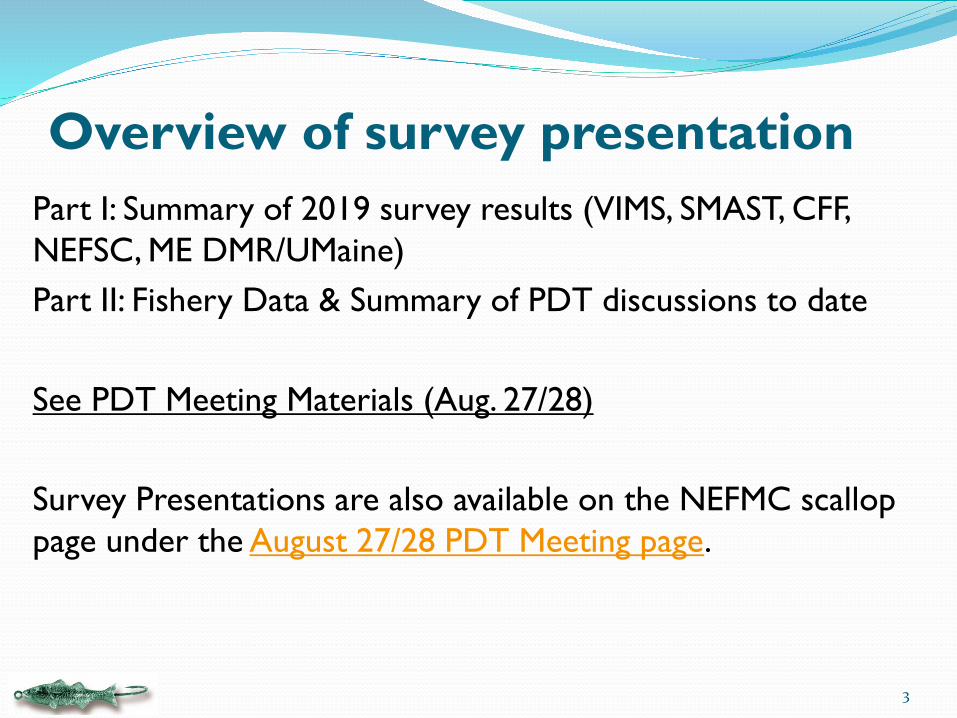
Overview of survey presentation Part I: Summary of 2019 survey results (VIMS, SMAST, CFF, NEFSC, ME DMR/UMaine)Part II: Fishery Data & Summary of PDT discussions to date
See PDT Meeting Materials (Aug. 27/28)
Survey Presentations are also available on the NEFMC scallop page under the August 27/28 PDT Meeting page.
3
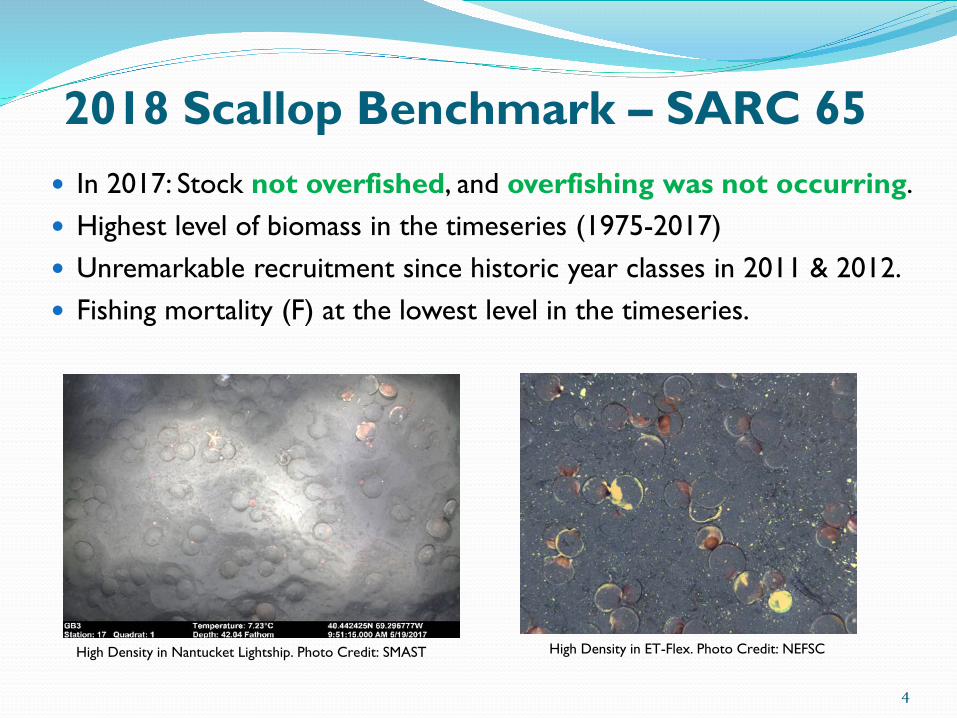
2018 Scallop Benchmark – SARC 65 In 2017: Stock not overfished, and overfishing was not occurring. Highest level of biomass in the timeseries (1975-2017) Unremarkable recruitment since historic year classes in 2011 & 2012. Fishing mortality (F) at the lowest level in the timeseries.
4
High Density in ET-Flex. Photo Credit: NEFSCHigh Density in Nantucket Lightship. Photo Credit: SMAST

5

VIMS surveys – Mid-Atlantic 2 cruises in May
Leg 1: 5/4 – 5/13 (VB HC) Leg 2: 5/19 – 5/29 (ET BI)
Continued use of stratified random sampling design to increase precision, automated data collection
450 dredge tows (stations) Sampling intensity of SH:MW
~5,500 samples in MA One dominate cohort (7yo) in
MAAA No strong signals of incoming
recruitment some in the “Gully” around Hudson Canyon 6

VIMS surveys – NLS, CAI, CAII
2 Cruises: NLS - 7/24 – 7/31 CAI & CAII - 6/7 – 6/14
335 dredge tows (135 in NLS and 200 in CA I and CA II)
Sampling intensity of SH:MW 2,350 samples for CAI & CAII II ~2,000 samples for NLS
Slower growth rates in NLS. Clappers in the NLS-West. Recruitment on GB some in
CAII, CAII-ext, and SF
7

SMAST survey High-res surveys of CAI, NLS, ET, HC,
CAII-N 2,728 total stations Imperx DSC camera Web-based image sharing Reduction in scallop density in the
NLS-S-deep between 2017 and 2018 Steep decline in biomass and density
in NLS-W. Some growth in the NLS-S-deep. Coverage on NF and CAII-N added
this summer.
8

CFF – CAII, SF HabCam v3 June 27 – July 4 F/V Kathy Marie 540 miles of transects ~9,700 annotated images
(~1/250) 2 cohorts across southeast
parts (Closed Area II, Ext, Southern Flank)
9

CFF – NLS & ET NLS:
July 9-15, 2019 610 miles of transects ~6,500 annotated images (~1/400) Tracking 2012 cohort
Elephant Trunk: July 25-30, 2019 360 miles of transects ~3,700 annotated images (~1/400)
Pre-recruits along northern boundary of ET-Flex (<20mm)
10
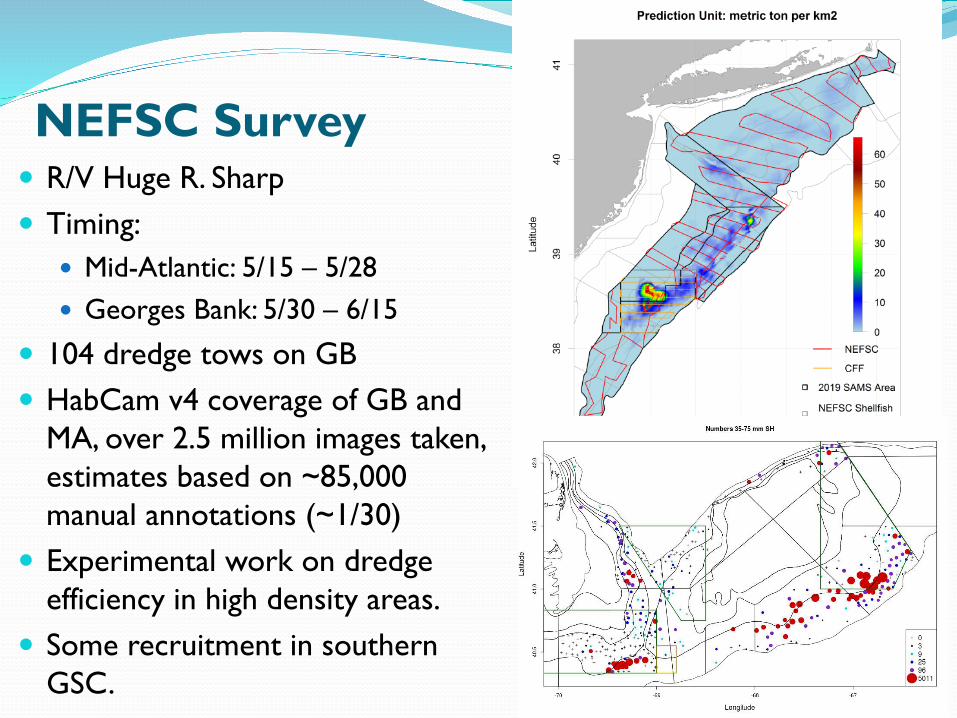
NEFSC Survey R/V Huge R. Sharp Timing:
Mid-Atlantic: 5/15 – 5/28 Georges Bank: 5/30 – 6/15
104 dredge tows on GB HabCam v4 coverage of GB and
MA, over 2.5 million images taken, estimates based on ~85,000 manual annotations (~1/30)
Experimental work on dredge efficiency in high density areas.
Some recruitment in southern GSC. 11

ME DMR/UMaine F/V Clean Sweep Timing:
Survey: 5/27/19 – 6/24/19 NGOM Fishery open 4/1 – 4/25
323 dredge tows (5 min) across 6 areas
Random stratified survey design Strong recruitment on
Stellwagen Bank. Exploitable scallops in 2020 on
Jeffreys and in Ipswich Bay
12
Machias Seal Island (MSI)
Platts Bank (PB)
Ipswich Bay (IB)
Southern Jeffreys (SJ)
Northern Stellwagen Bank (NSB)
Southern Stellwagen Bank (SSB)

13

14

2019 NGOM Survey & Outlook Strong recruitment event on Stellwagen Bank (N & S). Jeffrey’s Ledge: Highest density per meter squared (2.53).
2020/2021 TAC: Projection method used in FW29 and FW30. (Reviewed in SAW/SARC 65)
15
AreaNumber of
Scallops (mil.)Biomass (mt) Mean meat
weight (g)Average Shell height (mm)
Machias Seal Isl. 24 288 11.9 113.5Ipswich Bay (Fed Waters) ~7 135 18.0 107.1
Jeffrey’s Ledge ~25 682 19.4 108.3Northern Stellwagen Bank ~54 622 2.2 53.6

2019 NGOM Survey & Outlook Very strong recruitment detected on Stellwagen Bank
16
Northern Stellwagen, inside NGOM Average Shell Height: 53.6

Management Considerations PDT Input: The Council may want to consider a closure to
protect the strong YC on Stellwagen Bank to improve YPR
17
NGOM Area (Gray)
42 20 N

Closed Area ICan likely support fishing in 2020 (<1 trip)Majority of animals and fishing in “sliver” Landings: Us and 10/20sMinimal recruitment
18
Mean SH: 98.2 mmMode ~120 mm
N=165
2018 VMS Effort Data
Projection F=0.51 (mt) F=0.51CA1 Sliver 1131 2,493,428CA1 Access 235 518,086

Closed Area II - South Candidate for a FT trip+ in 2020 2 cohorts in the area – oldest will be 6yo in 2020.
19
Majority of biomass in eastern portion of stratum 62
Divergence in dredge and HabCam survey estimates Truth?
2019 Surveys: 1.35 billion scallops, 35.7 mil. lbs
Projection F=0.51 (mt) F=0.51 (lbs)CAII-S 4998 11,018,704
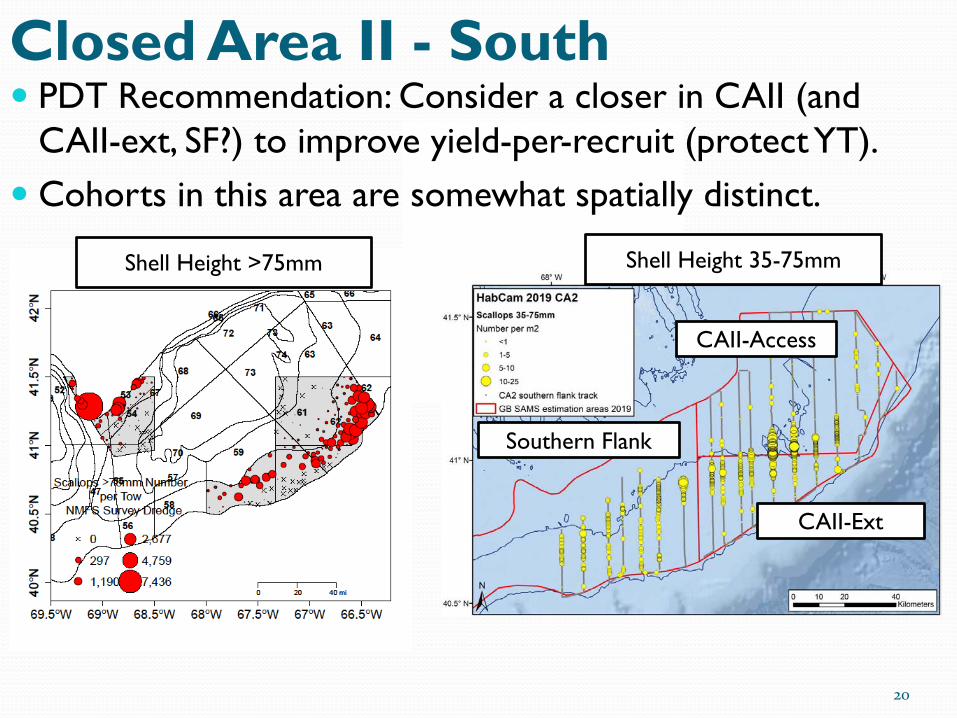
Closed Area II - South PDT Recommendation: Consider a closer in CAII (and
CAII-ext, SF?) to improve yield-per-recruit (protect YT). Cohorts in this area are somewhat spatially distinct.
20
Shell Height >75mm
Southern Flank
CAII-Access
CAII-Ext
Shell Height 35-75mm

NLS-North
Candidate for partial trip in 2020. Minimal recruitment, largest cohort exploitable.
21
SMAST Drop CameraScallops >75 mm
Commercial Dredge: ~132 mmMean meat weight: 40.5g
Between 10 and 12 count this year
Projection F=0.51 (mt) F=0.51 (lbs)NLS-N 1,096 2,416,266

Nantucket Lightship West
22
2018
2019
FY 2018: 2 TripsFY 2019: 3 Trips~30 million lbsallocated
High total mortality(M, F, discard)
~50 million lbdecline in total biomass estimate from 2018 - 2019
Substantial downturn in biomass.

Model suggests that there is not another trip in NLS-W in 2020. Need to re-think default allocation.
Uncertainty around growth.
NLS-West
23
Mean: 96.6 mmAvg wt: 16.8
Very little growth observed between 2017, 2018, 2019
Fishing effect (5 trips in 2 year)
Projection F=0.51 (mt) F=0.51 (lbs)NLS-West 1,434 3,161,429

NLS-South Shallow
Not expected to support a full trip in 2020 on its own. Could be combined with another Lightship area.
24
L-F is comparable to the NLS-W
Projection F=0.51 (mt) F=0.51 (lbs)NLS-S-shallow 1,376 3,033,561

NLS-South-deep
25
The outlook for these scallops has changed some since the Council voted in June to prioritize work to modify the FMP to accommodate harvest of these scallops through a separate TAC, outside of the 94.5% and 5.5% allocation split.Then: the majority of animals would be 40-50 count
and 8 years old in 2020, and may be more susceptible to large scale mortality as they get older in age.
Now: The 2019 survey information in this area suggests that these scallops grew between 2018 and 2019, and that meat counts have improved enough to make the NLS-S-deep a more viable candidate for fishery access in the future.
NLS-South-deep
26
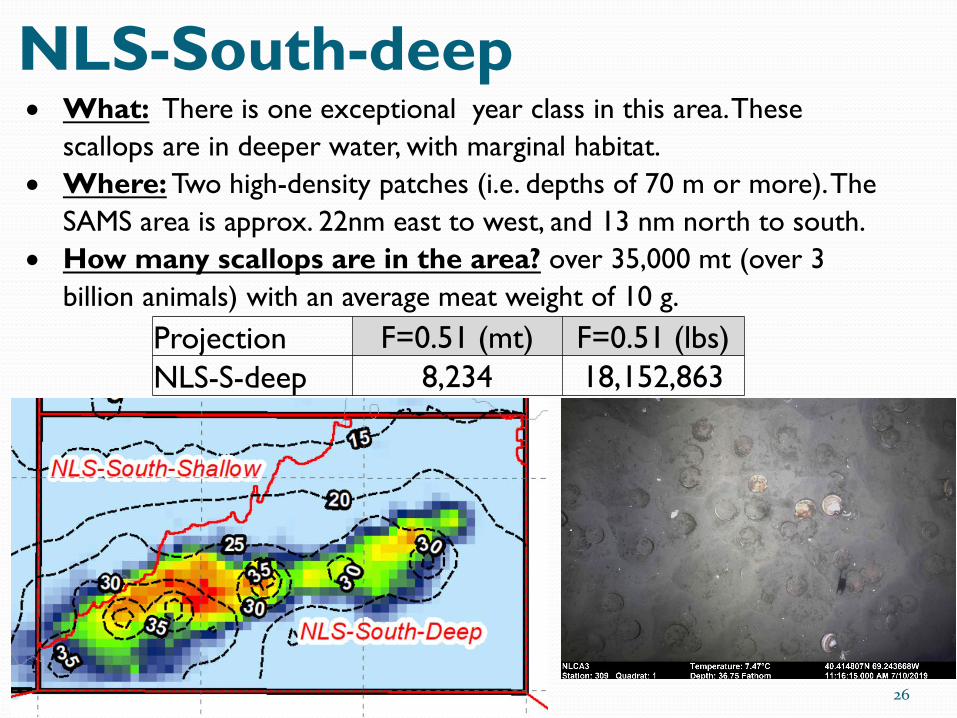
• What: There is one exceptional year class in this area. These scallops are in deeper water, with marginal habitat.
• Where: Two high-density patches (i.e. depths of 70 m or more). The SAMS area is approx. 22nm east to west, and 13 nm north to south.
• How many scallops are in the area? over 35,000 mt (over 3 billion animals) with an average meat weight of 10 g.
Projection F=0.51 (mt) F=0.51 (lbs)NLS-S-deep 8,234 18,152,863

NLS-South-deep
27
2018 2019Density per m2 stabilizedObserved Growth
Mean LengthCommercial Dredge
2016: 63.02 mm2017: 74.91 mm2018: 78.42 mm2019: 91.44 mm
Density2017: 13.66 m2
2018: 6.85 m2
2019: 6.26 m2
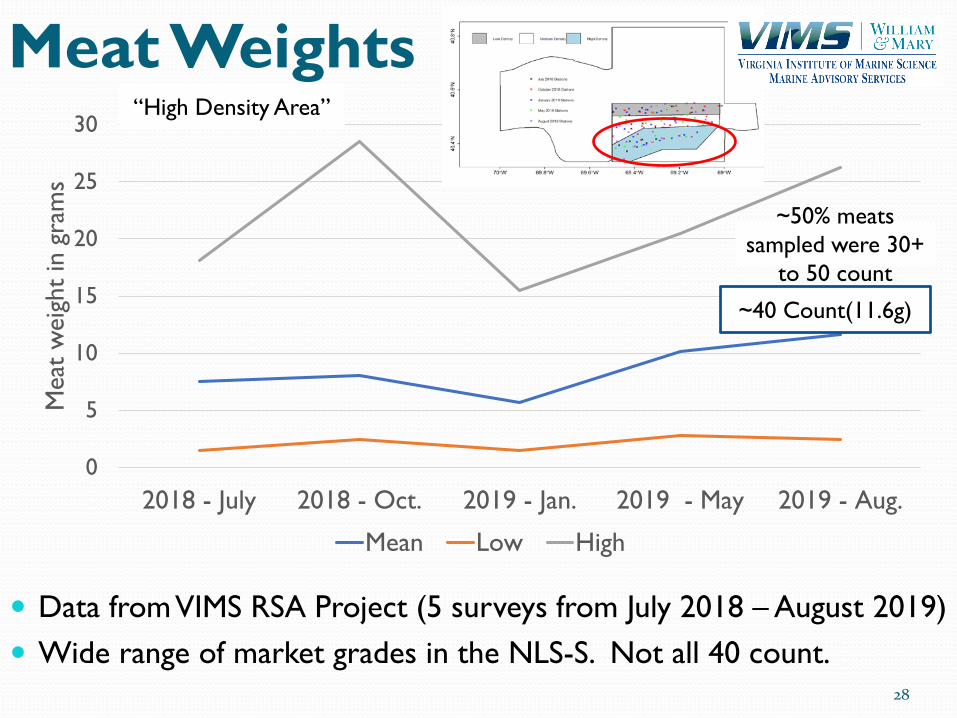
Meat Weights
28
Data from VIMS RSA Project (5 surveys from July 2018 – August 2019) Wide range of market grades in the NLS-S. Not all 40 count.
0
5
10
15
20
25
30
2018 - July 2018 - Oct. 2019 - Jan. 2019 - May 2019 - Aug.
Mea
t w
eigh
t in
gram
s
Mean Low High
~50% meats sampled were 30+
to 50 count
~40 Count(11.6g)
“High Density Area”

Lengths in NLS-S-deep
29
Scallops over 100 mm(Average size is ~90mm)

Selectivity in NLS-S-deep
30
Not all scallops have recruited to the 4” ring.Commercial dredge (4” ring) capable of
retaining a range of sizes.
NLS-S-deep video
31
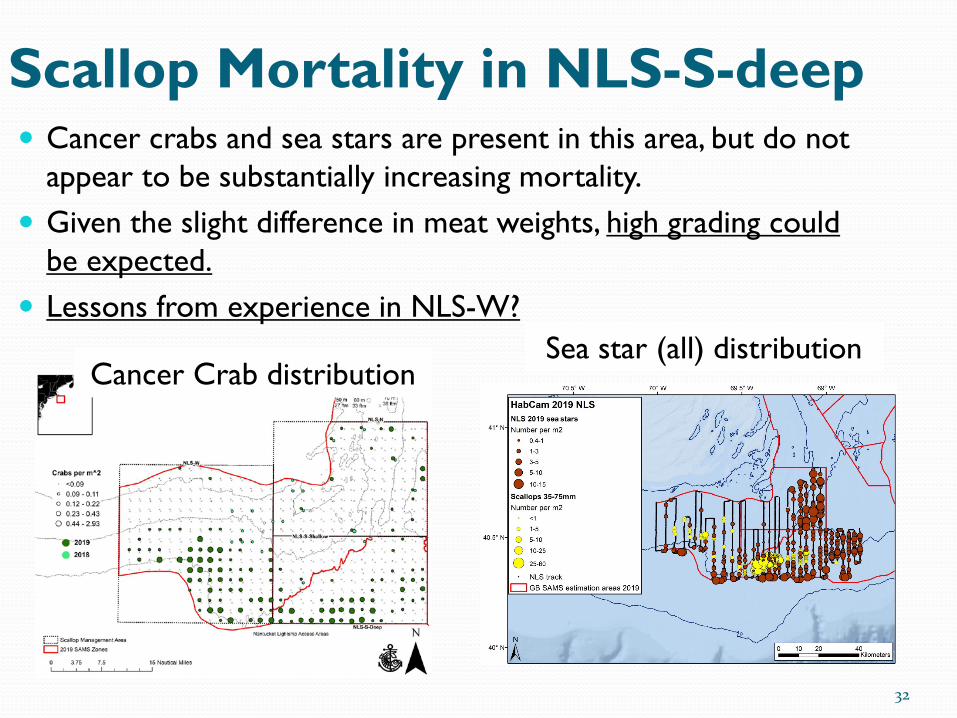
Scallop Mortality in NLS-S-deep
32
Cancer crabs and sea stars are present in this area, but do not appear to be substantially increasing mortality.
Given the slight difference in meat weights, high grading could be expected.
Lessons from experience in NLS-W?
Cancer Crab distributionSea star (all) distribution

Potential approaches to NLS-S
33
Changes that could be made in a Framework or a Specs Package
More Complicated Changes to the FMP (that would take more time to develop, potentially an amendment)
• Possession limits (remove, change)• Change the minimum ring-sizeThe PDT does not recommend modifying the 4” minimum ring size.• Gear obstruction.• Increase Crew limits.• Develop an area TAC that is not
part of the LA and LAGC IFQ allocation.
• Modify the access area boundary.Distribute effort (access) to the area over the FY to reduce congestion, improve safety.
• Use of shucking machines at sea• Large scale shell stocking• Transferring shell stock at sea
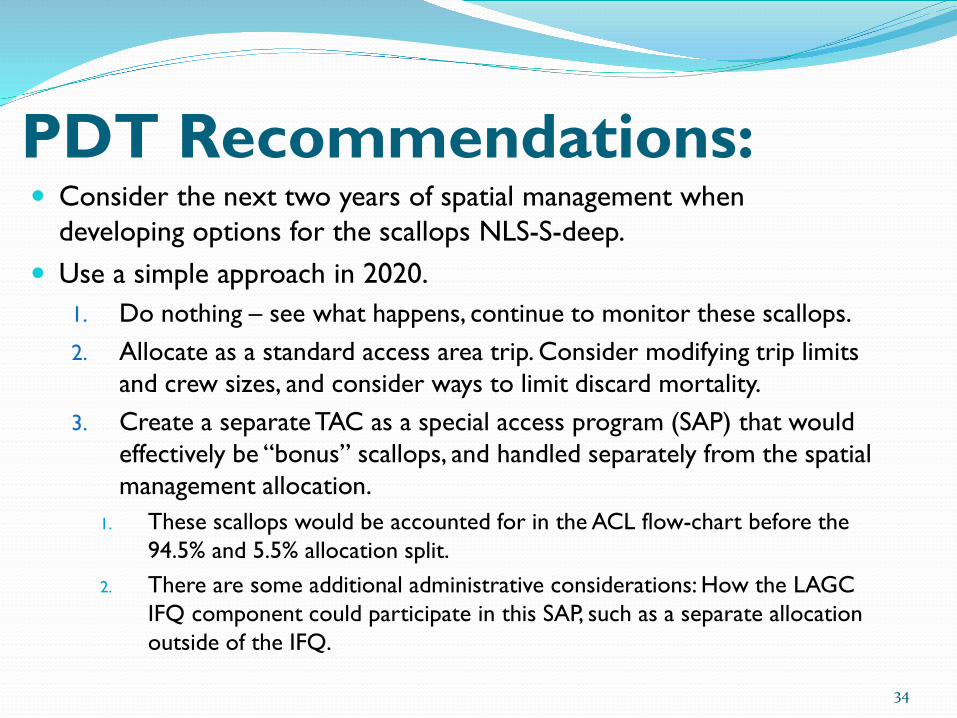
PDT Recommendations:
34
Consider the next two years of spatial management when developing options for the scallops NLS-S-deep.
Use a simple approach in 2020.1. Do nothing – see what happens, continue to monitor these scallops.2. Allocate as a standard access area trip. Consider modifying trip limits
and crew sizes, and consider ways to limit discard mortality. 3. Create a separate TAC as a special access program (SAP) that would
effectively be “bonus” scallops, and handled separately from the spatial management allocation.
1. These scallops would be accounted for in the ACL flow-chart before the 94.5% and 5.5% allocation split.
2. There are some additional administrative considerations: How the LAGC IFQ component could participate in this SAP, such as a separate allocation outside of the IFQ.

Mid-Atlantic Access AreaCombined Projection Results:
Could support multiple trips in 2020. (2?) Fishery is working on one dominant YC (7yo in 2020). Some pre-recruits and recruits ET. Meat quality may be improving, still issues.
35
MAAA ABC OFL
Total F=0.51 F=0.64
HCS 8,221 2,814 3,283
ETFlex 15,088 5,120 5,956
ETOpen 13,929 4,616 5,366
Total 37,238 12,550 14,605

Mid-Atlantic Access Area Majority of FY 2018 effort was north of 38.5° latitude. Some fishing in Delmarva (no longer part of MAAA)
36

Nematode Prevalence 2015-19
% of scallops in a sample that contain at least one lesion. Northward expansion 2015-16. Apparent stabilization of the spatial extent 2016-17. Possible slight northward expansion from 2017-18. Reduction in prevalence in 2019

Delmarva:
38
Order of magnitude reduction in biomass.Animals are at the southern extent of their range.
Converted to open bottom in 2018 (FW29).
Some effort in FY2018.
VIMS Biomass2015: 10,923 mt2016: 4,031 mt2017: 2,467 mt2018: 1,149 mt2019: 203 mt
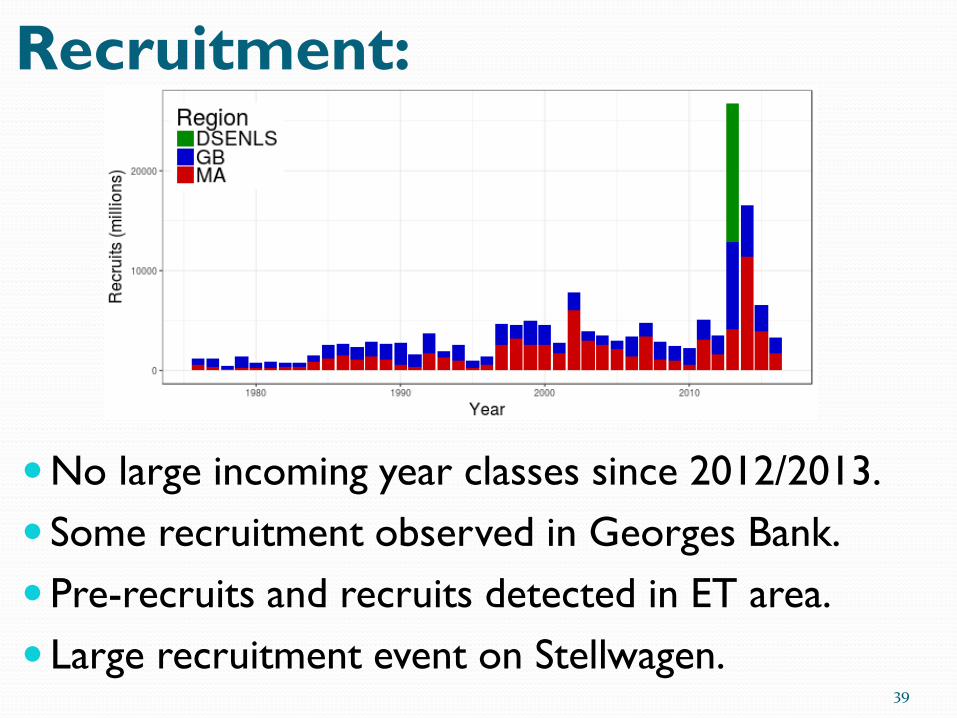
Recruitment:
No large incoming year classes since 2012/2013. Some recruitment observed in Georges Bank.Pre-recruits and recruits detected in ET area. Large recruitment event on Stellwagen.
39

2019 Fishery PerformanceAs of September 4, 2019 – 43% of FY complete FW30: FY Started April 1, 2019
LA & IFQ Projected landings: ~60 million lbs. Does not include set-asides
40
Component Landings to-date (lbs)
Limited Access 34,921,783
LAGC IFQ 1,710,845
LA w/ LAGC IFQ 38,038
Observer Set-Aside 384,358
TOTAL 37,055,024

Recent Fishery Performance
41
2018
2018
2018
2019
2019
2019
2018 2019

PDT’s 2020 Harvest Recs: Focus effort in access areas, and to continue to back off
effort in open areas for the following reasons: Animals in Closed Area I, Nantucket Lightship-North, and the
Mid-Atlantic access areas will be 7 & 8 years old in 2020, and are ready for harvest.
The majority of (weak) recruitment observed in the 2018 was in open areas, and would just be entering the fishery in 2020.
Limited removals from access areas in 2021.
New Reference Points in SARC 65 Potentially higher Fmsy Consider open area F rates that are consistent with recent
values. 2017: F=0.44 2018: F=0.295 2019: F=0.23
42
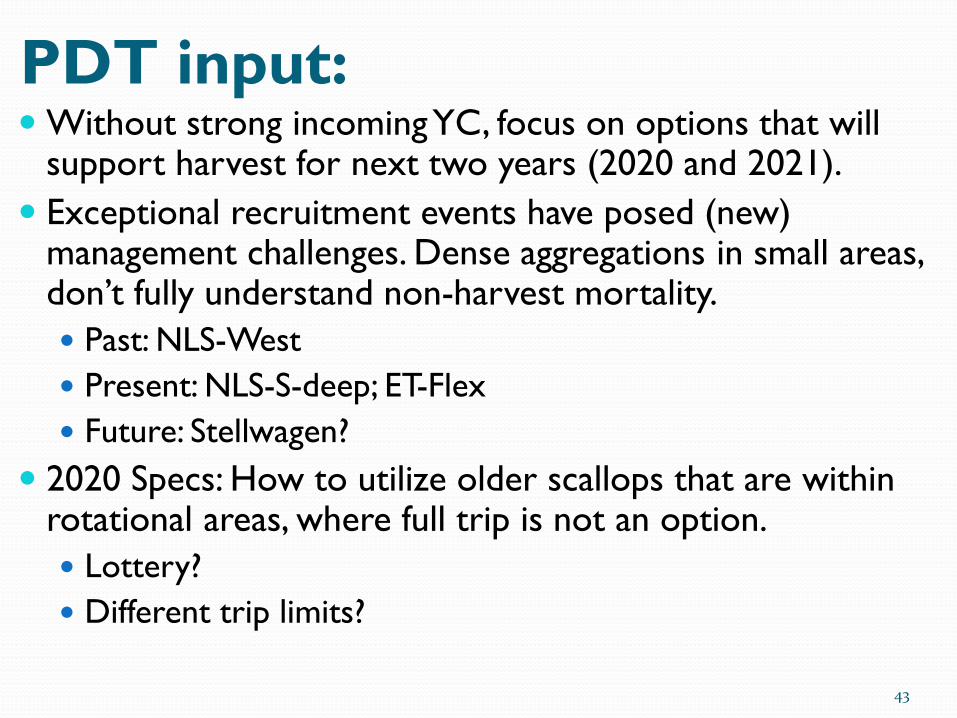
PDT input: Without strong incoming YC, focus on options that will
support harvest for next two years (2020 and 2021). Exceptional recruitment events have posed (new)
management challenges. Dense aggregations in small areas, don’t fully understand non-harvest mortality. Past: NLS-West Present: NLS-S-deep; ET-Flex Future: Stellwagen?
2020 Specs: How to utilize older scallops that are within rotational areas, where full trip is not an option. Lottery? Different trip limits?
43
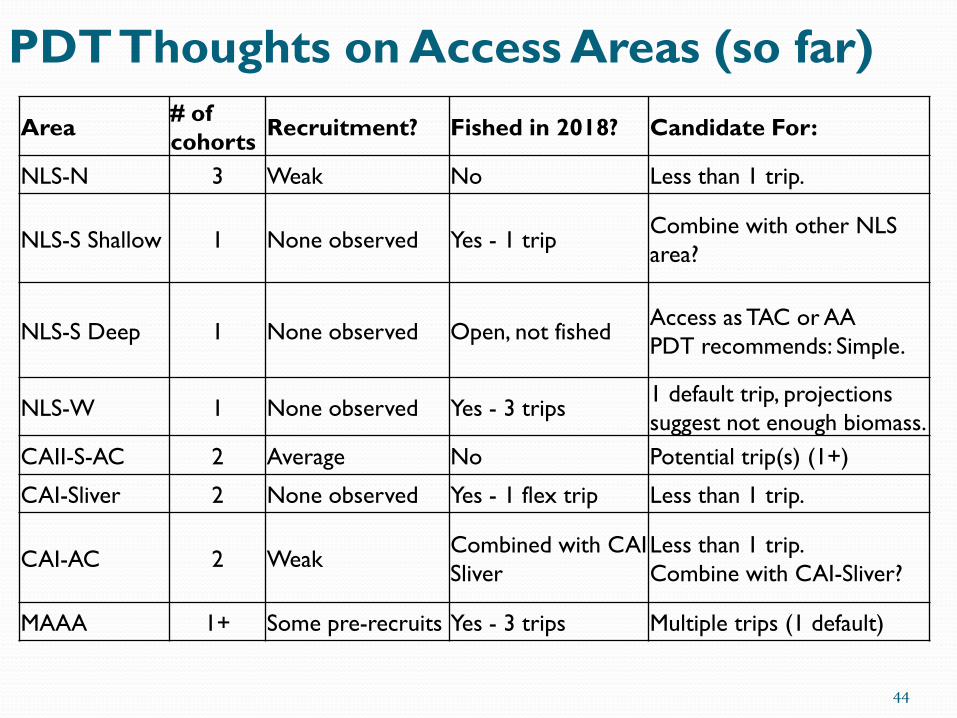
PDT Thoughts on Access Areas (so far)
44
Area # of cohorts Recruitment? Fished in 2018? Candidate For:
NLS-N 3 Weak No Less than 1 trip.
NLS-S Shallow 1 None observed Yes - 1 trip Combine with other NLS area?
NLS-S Deep 1 None observed Open, not fished Access as TAC or AAPDT recommends: Simple.
NLS-W 1 None observed Yes - 3 trips1 default trip, projections suggest not enough biomass.
CAII-S-AC 2 Average No Potential trip(s) (1+)
CAI-Sliver 2 None observed Yes - 1 flex trip Less than 1 trip.
CAI-AC 2 Weak Combined with CAI Sliver
Less than 1 trip. Combine with CAI-Sliver?
MAAA 1+ Some pre-recruits Yes - 3 trips Multiple trips (1 default)

45
ABC values for 2020F=0.51 (mt) F=0.51 (lbs)
HCS 2814 6,203,808Virginia 6 13,228ETFlex 5120 11,287,668ETOpen 4616 10,176,538DMV 158 348,330NYB 2357 5,196,296LI 2696 5,943,663Inshore+BI 947 2,087,778
C1North “Sliver” 1131 2,493,428C1Central “Access Area”
235 518,086
C2North* 1665 3,670,697C2South “CAII AA” 4998 11,018,704NLSW 1434 3,161,429NLSN 1096 2,416,266NLSSShal 1376 3,033,561NLSSDeep 8234 18,152,863C2Ext 2484 5,476,283GSC 1662 3,664,083NF 500 1,102,311SF 2725 6,007,597

46